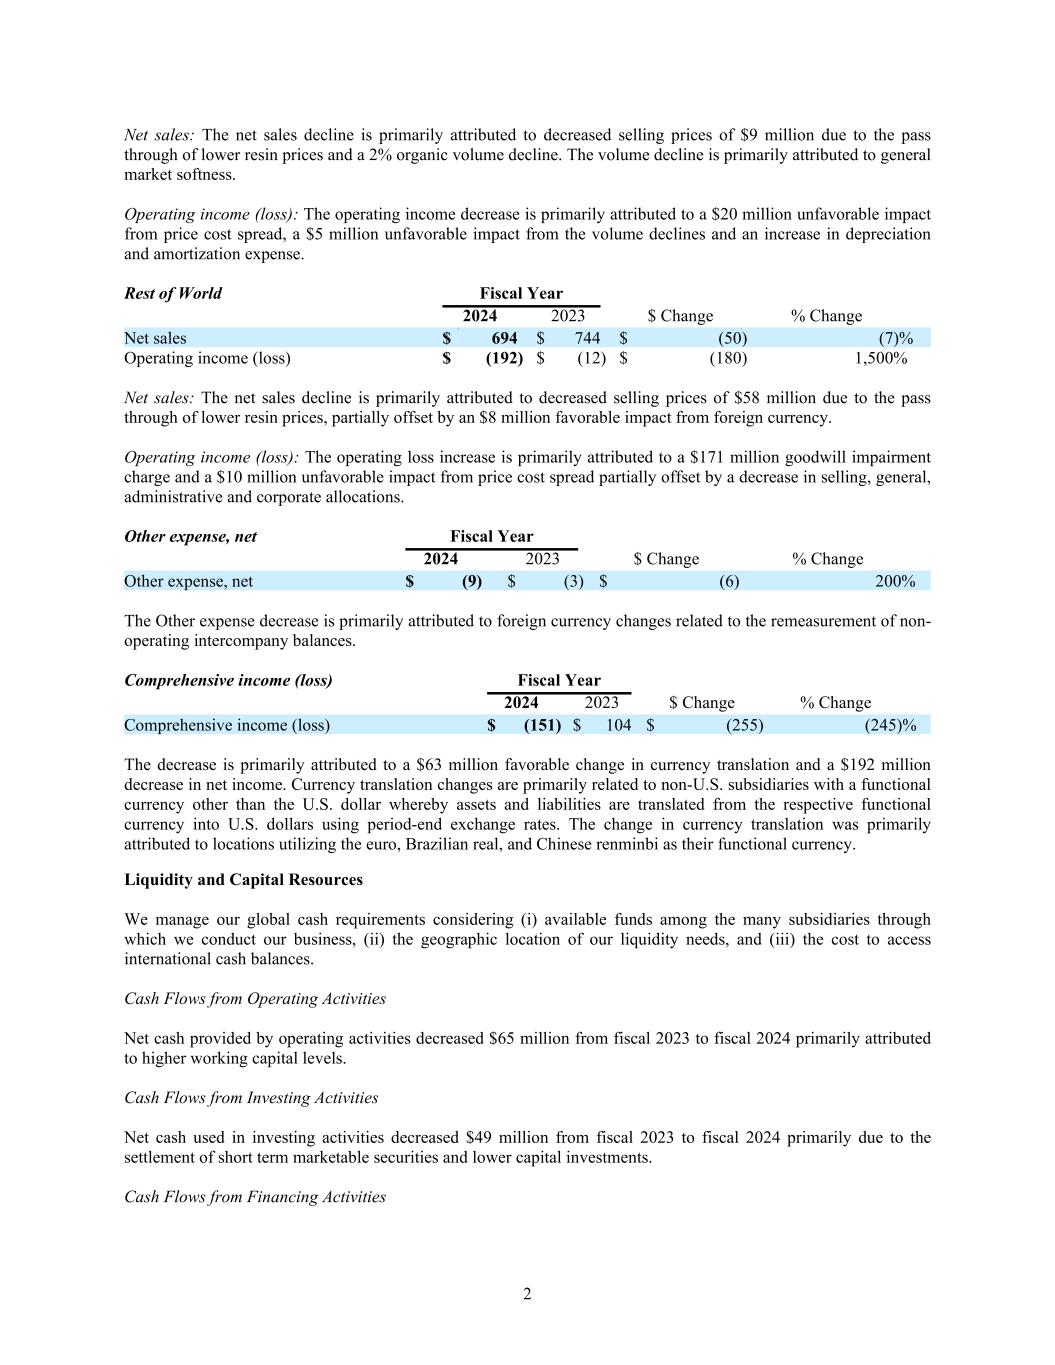
EXHIBIT 99.3 Item 7. MANAGEMENT’S DISCUSSION AND ANALYSIS OF FINANCIAL CONDITION AND RESULTS OF OPERATIONS The Combined Financial Statements represent the operations of Spinco and have been prepared on a carve-out basis which includes assumptions underlying the preparation that management believes are reasonable. However, the Combined Financial Statements included herein may not necessarily reflect the Spinco’s results of operations, financial position, and cash flows in the future or what they would have been had Spinco been an independent, stand-alone company during the periods presented. As a result, historical financial information is not necessarily indicative of Spinco’s future results of operations, financial position or cash flows. The following section is qualified in its entirety by the more detailed information in this document, including the Combined Financial Statements and notes thereto. Reverse Morris Trust-Type Transaction On November 4, 2024, Treasure Holdco, Inc., Berry, Magnera, and certain wholly owned subsidiaries of Magnera, completed the previously disclosed spinoff and merger transactions contemplated by the RMT Transaction Agreement and certain other agreements in connection with the Transactions. Outlook The Company is affected by general economic and industrial growth, raw material availability, cost inflation, supply chain disruptions, and general industrial production. Our business has both geographic and end market diversity, which reduces the effect of any one of these factors on our overall performance. Our results are affected by our ability to pass through raw material and other cost changes to our customers, improve manufacturing productivity and adapt to volume changes of our customers. Despite global macro-economic challenges in the short-term attributed to continued rising inflation, supply chain disruptions, currency devaluation and general market softness, we continue to believe our underlying long-term demand fundamental in all divisions will remain strong as we focus on delivering protective solutions that enhance consumer safety and by providing advantaged products in targeted markets. Discussion of Results of Operations for Fiscal 2024 Compared to Fiscal 2023 Business integration expenses consist of restructuring and impairment charges, divestiture related costs, and other business optimization costs. Tables present dollars in millions. Consolidated Overview Fiscal Year 2024 2023 $ Change % Change Net sales $ 2,187 $ 2,275 $ (88 ) (4 )% Operating income (loss) $ (141 ) $ 69 $ (210 ) (304 )% Net sales: The net sales decline is primarily attributed to decreased selling prices of $67 million due to the pass through of lower resin prices and a 1% organic volume decline, partially offset by a $10 million favorable impact from foreign currency. The volume decline is primarily attributed to general market softness. Operating income (loss): The change is primarily attributed to a $171 million goodwill impairment charge, a $30 million unfavorable impact from price cost spread, a $6 million increase in depreciation and amortization expense and a $5 million unfavorable impact from volume declines, partially offset by a $7 million decrease in selling, general, administrative and corporate allocations. Americas Fiscal Year 2024 2023 $ Change % Change Net sales $ 1,493 $ 1,531 $ (38 ) (2 )% Operating income $ 51 $ 81 $ (30 ) (37 )%

2 Net sales: The net sales decline is primarily attributed to decreased selling prices of $9 million due to the pass through of lower resin prices and a 2% organic volume decline. The volume decline is primarily attributed to general market softness. Operating income (loss): The operating income decrease is primarily attributed to a $20 million unfavorable impact from price cost spread, a $5 million unfavorable impact from the volume declines and an increase in depreciation and amortization expense. Rest of World Fiscal Year 2024 2023 $ Change % Change Net sales $ 694 $ 744 $ (50 ) (7 )% Operating income (loss) $ (192 ) $ (12 ) $ (180 ) 1,500 % Net sales: The net sales decline is primarily attributed to decreased selling prices of $58 million due to the pass through of lower resin prices, partially offset by an $8 million favorable impact from foreign currency. Operating income (loss): The operating loss increase is primarily attributed to a $171 million goodwill impairment charge and a $10 million unfavorable impact from price cost spread partially offset by a decrease in selling, general, administrative and corporate allocations. Other expense, net Fiscal Year 2024 2023 $ Change % Change Other expense, net $ (9 ) $ (3 ) $ (6 ) 200 % The Other expense decrease is primarily attributed to foreign currency changes related to the remeasurement of non- operating intercompany balances. Comprehensive income (loss) Fiscal Year 2024 2023 $ Change % Change Comprehensive income (loss) $ (151 ) $ 104 $ (255 ) (245 )% The decrease is primarily attributed to a $63 million favorable change in currency translation and a $192 million decrease in net income. Currency translation changes are primarily related to non-U.S. subsidiaries with a functional currency other than the U.S. dollar whereby assets and liabilities are translated from the respective functional currency into U.S. dollars using period-end exchange rates. The change in currency translation was primarily attributed to locations utilizing the euro, Brazilian real, and Chinese renminbi as their functional currency. Liquidity and Capital Resources We manage our global cash requirements considering (i) available funds among the many subsidiaries through which we conduct our business, (ii) the geographic location of our liquidity needs, and (iii) the cost to access international cash balances. Cash Flows from Operating Activities Net cash provided by operating activities decreased $65 million from fiscal 2023 to fiscal 2024 primarily attributed to higher working capital levels. Cash Flows from Investing Activities Net cash used in investing activities decreased $49 million from fiscal 2023 to fiscal 2024 primarily due to the settlement of short term marketable securities and lower capital investments. Cash Flows from Financing Activities

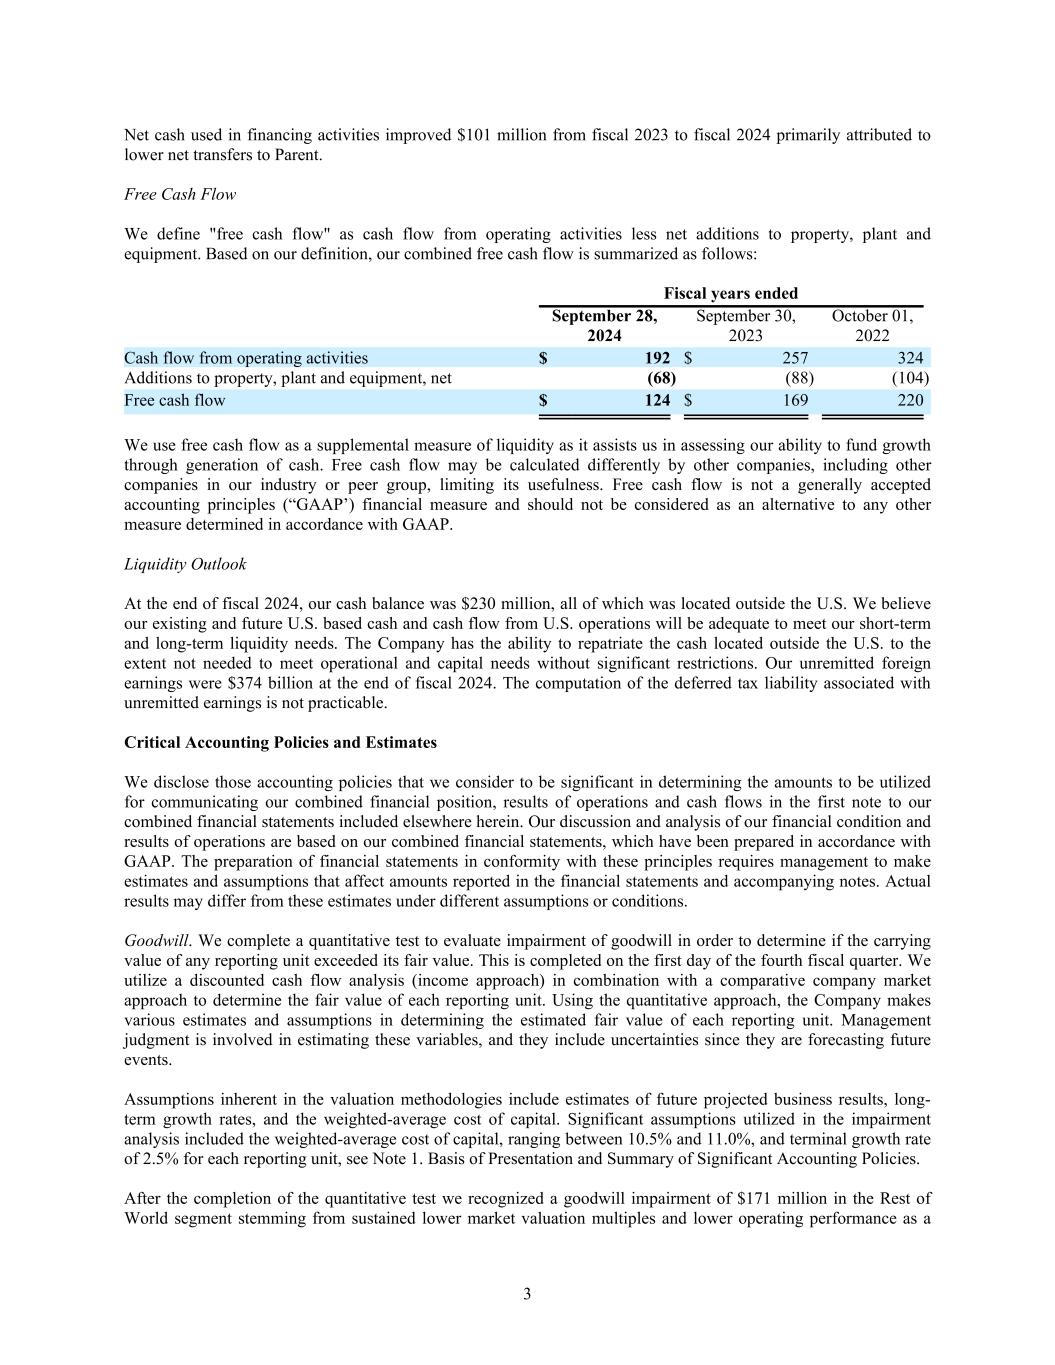
3 Net cash used in financing activities improved $101 million from fiscal 2023 to fiscal 2024 primarily attributed to lower net transfers to Parent. Free Cash Flow We define "free cash flow" as cash flow from operating activities less net additions to property, plant and equipment. Based on our definition, our combined free cash flow is summarized as follows: Fiscal years ended September 28, 2024 September 30, 2023 October 01, 2022 Cash flow from operating activities $ 192 $ 257 324 Additions to property, plant and equipment, net (68 ) (88 ) (104 ) Free cash flow $ 124 $ 169 220 We use free cash flow as a supplemental measure of liquidity as it assists us in assessing our ability to fund growth through generation of cash. Free cash flow may be calculated differently by other companies, including other companies in our industry or peer group, limiting its usefulness. Free cash flow is not a generally accepted accounting principles (“GAAP’) financial measure and should not be considered as an alternative to any other measure determined in accordance with GAAP. Liquidity Outlook At the end of fiscal 2024, our cash balance was $230 million, all of which was located outside the U.S. We believe our existing and future U.S. based cash and cash flow from U.S. operations will be adequate to meet our short-term and long-term liquidity needs. The Company has the ability to repatriate the cash located outside the U.S. to the extent not needed to meet operational and capital needs without significant restrictions. Our unremitted foreign earnings were $374 billion at the end of fiscal 2024. The computation of the deferred tax liability associated with unremitted earnings is not practicable. Critical Accounting Policies and Estimates We disclose those accounting policies that we consider to be significant in determining the amounts to be utilized for communicating our combined financial position, results of operations and cash flows in the first note to our combined financial statements included elsewhere herein. Our discussion and analysis of our financial condition and results of operations are based on our combined financial statements, which have been prepared in accordance with GAAP. The preparation of financial statements in conformity with these principles requires management to make estimates and assumptions that affect amounts reported in the financial statements and accompanying notes. Actual results may differ from these estimates under different assumptions or conditions. Goodwill. We complete a quantitative test to evaluate impairment of goodwill in order to determine if the carrying value of any reporting unit exceeded its fair value. This is completed on the first day of the fourth fiscal quarter. We utilize a discounted cash flow analysis (income approach) in combination with a comparative company market approach to determine the fair value of each reporting unit. Using the quantitative approach, the Company makes various estimates and assumptions in determining the estimated fair value of each reporting unit. Management judgment is involved in estimating these variables, and they include uncertainties since they are forecasting future events. Assumptions inherent in the valuation methodologies include estimates of future projected business results, long- term growth rates, and the weighted-average cost of capital. Significant assumptions utilized in the impairment analysis included the weighted-average cost of capital, ranging between 10.5% and 11.0%, and terminal growth rate of 2.5% for each reporting unit, see Note 1. Basis of Presentation and Summary of Significant Accounting Policies. After the completion of the quantitative test we recognized a goodwill impairment of $171 million in the Rest of World segment stemming from sustained lower market valuation multiples and lower operating performance as a

4 result of continued market softness. Future declines in our peer company and our market capitalizations and total enterprise value along with lower valuation market multiples or significant declines in operating performance could impact future impairment tests or may require a more frequent assessment. The Company's fair value and carrying value of our reporting units are as follows: Fair Value July 1, 2024 Carrying Value July 1, 2024 Cushion July 1, 2024 Americas $ 1,770 $ 1,613 $ 157 Rest of World 610 781 (171 ) Deferred Taxes and Effective Tax Rates. We estimate the effective tax rate (“ETR”) and associated liabilities or assets for each of our legal entities in accordance with authoritative guidance. We utilize tax planning to minimize or defer tax liabilities to future periods. In recording ETRs and related liabilities and assets, we rely upon estimates, which are based upon our interpretation of U.S. and local tax laws as they apply to our legal entities and our overall tax structure. Audits by local tax jurisdictions, including the U.S. Government, could yield different interpretations from our own and cause the Company to owe more taxes than originally recorded. See Note 1. Basis of Presentation and Summary of Significant Accounting Policies and Note 5. Income Taxes.


