Glatfelter (NYSE: GLT)
Deutsche Bank Global Industrials and Basic Materials Conference
June 2012
Forward-Looking Statements and Use of non-GAAP Financial Measures
Certain statements included in this presentation, which pertain to future financial and business matters, are “forward-looking statements” within the meaning of the safe harbor provisions of the United States Private Securities Litigation Reform Act of 1995. These statements are based on management’s current expectations and are subject to numerous risks, uncertainties and other unpredictable or uncontrollable factors, which may cause actual results or performance to differ materially from the Company’s expectations. Various risks and factors that could cause future results to differ materially from those expressed in the forward-looking statements include, but are not limited to: changes in industry, business, market, political and economic conditions in the U.S. and other countries in which Glatfelter does business; demand for or pricing of its products; changes in tax legislation, governmental laws, regulations and policies; initiatives of regulatory authorities; acquisition integration risks; technological changes and innovations; market growth rates; cost reduction initiatives; the cost, and successful design and construction, of the Composite Fibers capacity expansion project, and other factors. In light of these risks, uncertainties and other factors, the forward-looking matters discussed in this presentation may not occur, and readers are cautioned not to place undue reliance on these forward-looking statements. The forward-looking statements speak only as of the date of this presentation and Glatfelter undertakes no obligation, and does not intend, to update these forward-looking statements to reflect events or circumstances occurring after the date of this presentation. More information about these factors is contained in Glatfelter’s filings with the U.S. Securities and Exchange Commission, which are available at www.glatfelter.com.
During the course of this presentation, certain non-U.S. GAAP financial measures will be presented. A reconciliation of these measures to U.S. GAAP financial measures is included in the appendix of this presentation.
2011 Full Year Highlights
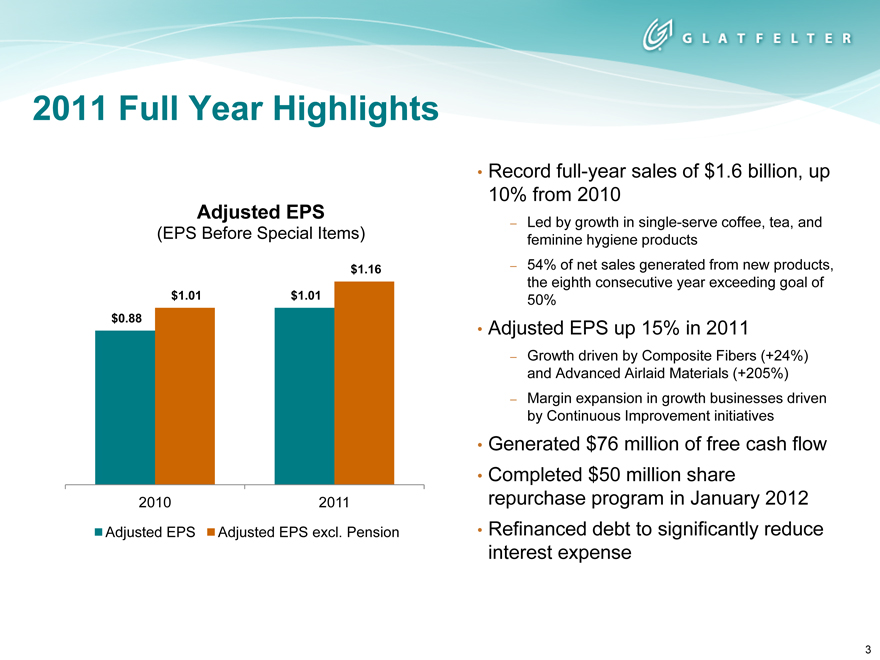
Adjusted EPS
(EPS Before Special Items)
$1.16
$1.01 $1.01
$0.88
2010 2011
Adjusted EPS Adjusted EPS excl. Pension
Record full-year sales of $1.6 billion, up 10% from 2010
Led by growth in single-serve coffee, tea, and feminine hygiene products
54% of net sales generated from new products, the eighth consecutive year exceeding goal of 50%
Adjusted EPS up 15% in 2011
Growth driven by Composite Fibers (+24%) and Advanced Airlaid Materials (+205%)
Margin expansion in growth businesses driven by Continuous Improvement initiatives
Generated $76 million of free cash flow Completed $50 million share repurchase program in January 2012 Refinanced debt to significantly reduce interest expense
Q1 2012 Highlights
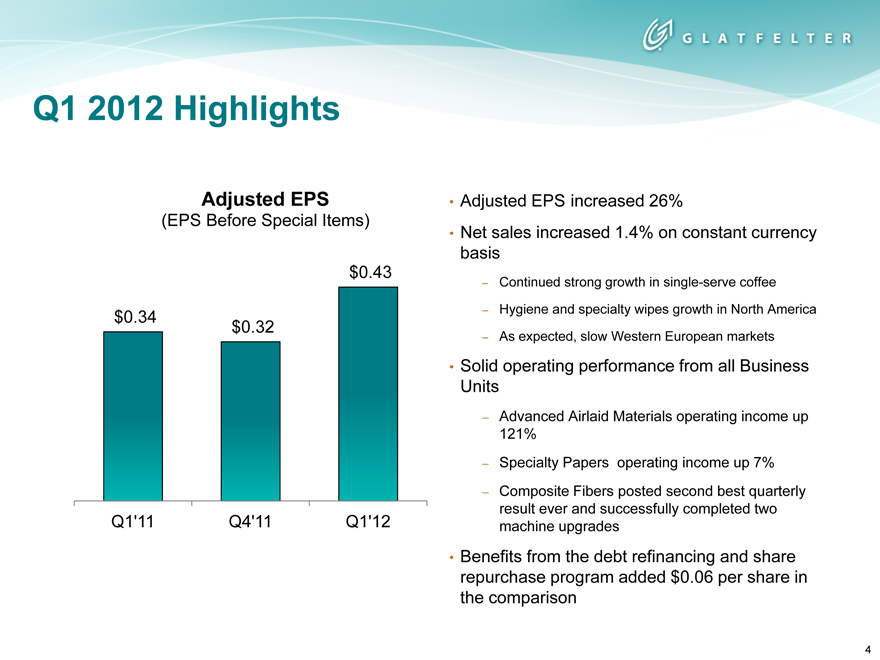
Adjusted EPS
(EPS Before Special Items)
$0.43
$0.34 $0.32
Q1’11 Q4’11 Q1’12
Adjusted EPS increased 26%
Net sales increased 1.4% on constant currency basis
Continued strong growth in single-serve coffee
Hygiene and specialty wipes growth in North America
As expected, slow Western European markets
Solid operating performance from all Business Units
Advanced Airlaid Materials operating income up 121%
Specialty Papers operating income up 7%
Composite Fibers posted second best quarterly result ever and successfully completed two machine upgrades
Benefits from the debt refinancing and share repurchase program added $0.06 per share in the comparison
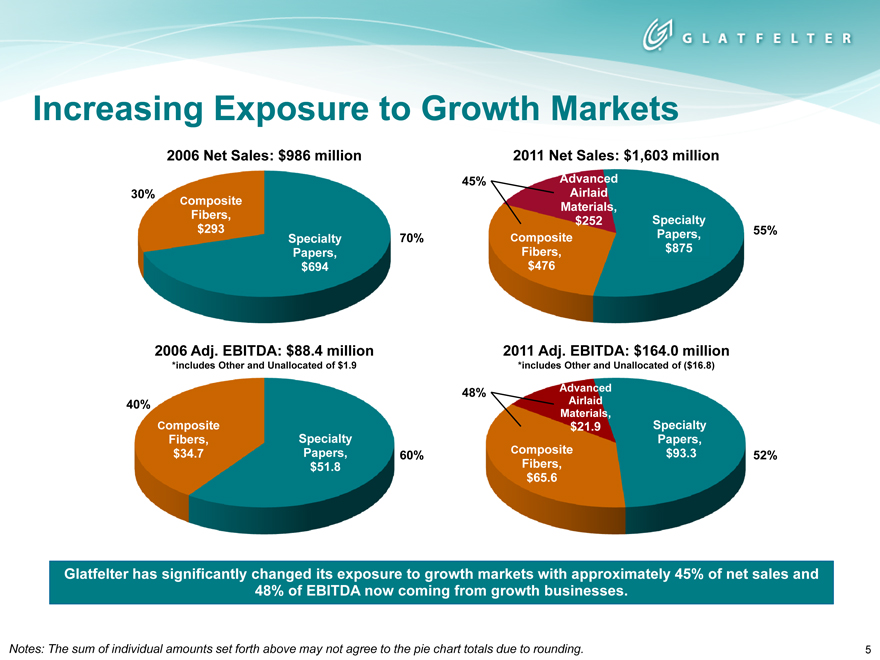
Increasing Exposure to Growth Markets
2006 Net Sales: $986 million 2011 Net Sales: $1,603 million
45% Advanced
30% Advanced Airlaid Airlaid
Composite
Fibers, Materials, $252 Materials Specialty
$293 $239 55%
Specialty 70% Composite Papers, Specialty Papers
Papers, Composite Fibers, Fibers $875 $863
$694 $476 $447
2006 Adj. EBITDA: $88.4 million 2011 Adj. EBITDA: $164.0 million
*includes Other and Unallocated of $1.9 *includes Other and Unallocated of ($16.8)
48% Advanced
40% Airlaid
Materials,
Composite $21.9 Specialty
Fibers, Specialty Papers,
$34.7 Papers, 60% Composite $93.3 52%
$51.8 Fibers,
$65.6
Glatfelter has significantly changed its exposure to growth markets with approximately 45% of net sales and 48% of EBITDA now coming from growth businesses.
Notes: The sum of individual amounts set forth above may not agree to the pie chart totals due to rounding.
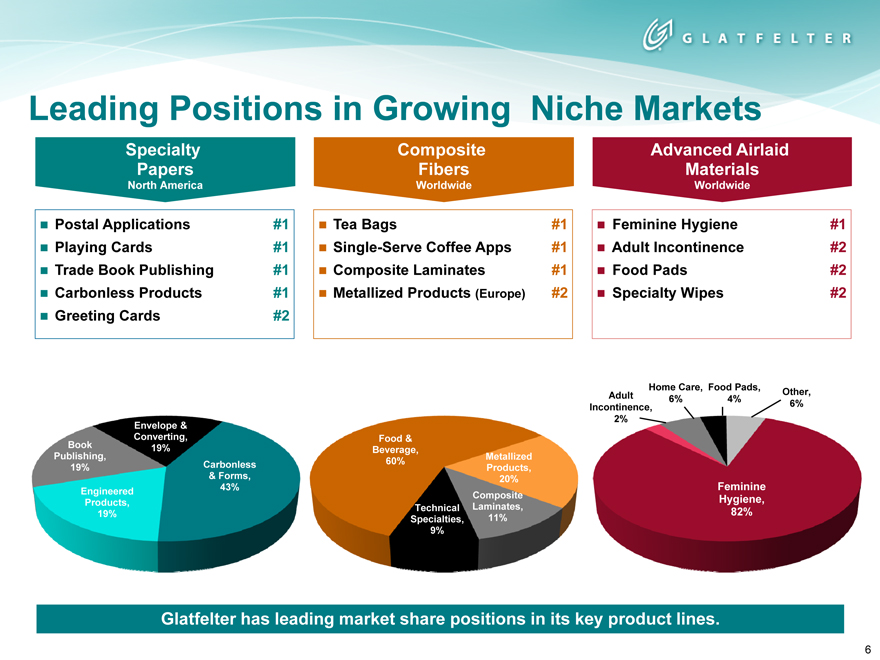
Leading Positions in Growing Niche Markets
Specialty Papers
North America
Postal Applications #1
Playing Cards #1
Trade Book Publishing #1
Carbonless Products #1
Greeting Cards #2
Composite Fibers
Worldwide
Tea Bags #1
Single-Serve Coffee Apps #1
Composite Laminates #1
Metallized Products (Europe) #2
Advanced Airlaid Materials
Worldwide
Feminine Hygiene #1
Adult Incontinence #2
Food Pads #2
Specialty Wipes #2
Home Care, Food Pads,
Adult 6% 4% Other,
Incontinence, 6%
2%
Envelope &
Converting, Food &
Book 19% Beverage,
Publishing, Metallized
19% Carbonless 60% Products,
& Forms, 20%
43% Feminine
Engineered Composite
Products, Technical Laminates, Hygiene,
19% 82%
Specialties, 11%
9%
Glatfelter has leading market share positions in its key product lines.
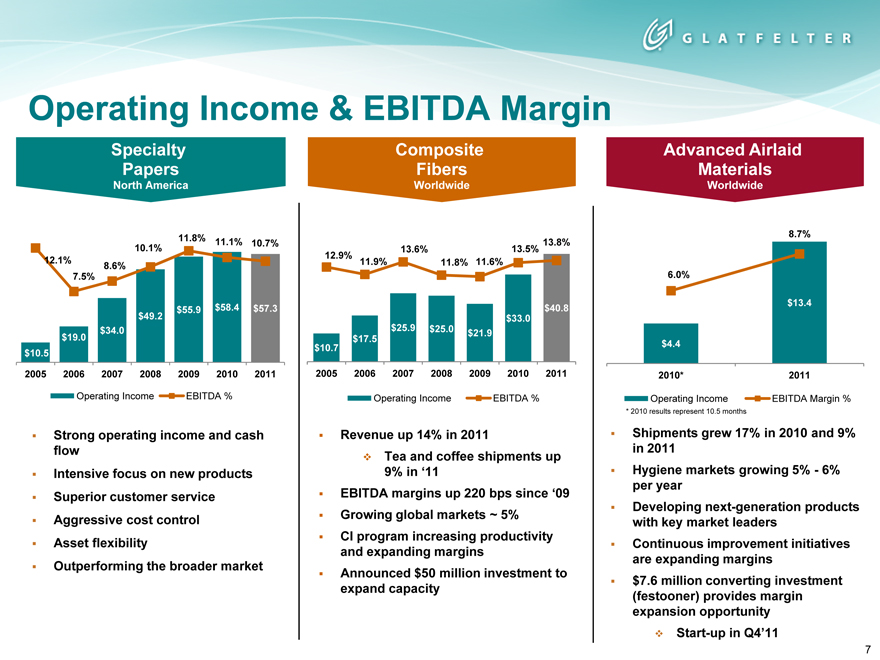
Operating Income & EBITDA Margin
Specialty Papers
North America
11.8% 11.1% 10.7%
10.1%
12.1% 8.6%
7.5%
$49.2 $55.9 $58.4 $57.3
$34.0
$19.0
$10.5
2005 2006 2007 2008 2009 2010 2011
Operating Income EBITDA %
Strong operating income and cash flow Intensive focus on new products Superior customer service Aggressive cost control Asset flexibility Outperforming the broader market
Composite Fibers
Worldwide
13.6% 13.5% 13.8%
12.9% 11.9% 11.8% 11.6%
$40.8
$33.0
$25.9 $25.0 $21.9
$17.5
$10.7
2005 2006 2007 2008 2009 2010 2011
Operating Income EBITDA %
Revenue up 14% in 2011
Tea and coffee shipments up 9% in ‘11
EBITDA margins up 220 bps since ‘09
Growing global markets ~ 5%
CI program increasing productivity and expanding margins
Announced $50 million investment to expand capacity
Advanced Airlaid Materials
Worldwide
8.7%
6.0%
$13.4
$4.4
2010* 2011
Operating Income EBITDA Margin %
* | | 2010 results represent 10.5 months |
Shipments grew 17% in 2010 and 9% in 2011 Hygiene markets growing 5%-6% per year bps since ‘09
Developing next-generation products with key market leaders Continuous improvement initiatives are expanding margins $7.6 million converting investment (festooner) provides margin expansion opportunity
Start-up in Q4’11
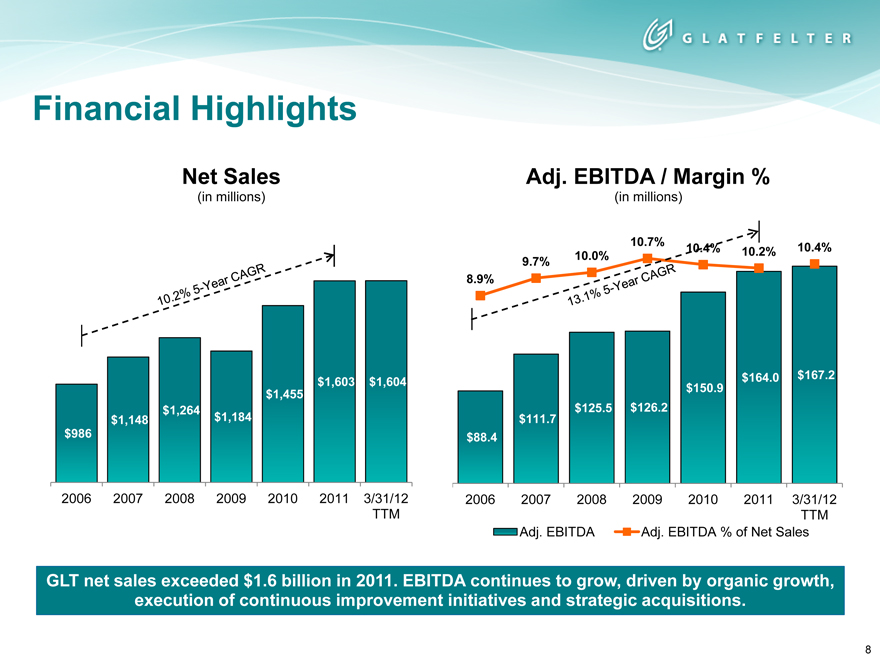
Financial Highlights
Net Sales
(in millions)
10.2% 5-Year CAGR
$1,603 $1,604
$1,455
$1,264
$1,148 $1,184
$986
2006 2007 2008 2009 2010 2011 3/31/12
TTM
Adj. EBITDA / Margin %
13.1% 5-Year CAGR
(in millions)
10.7%
9.7% 10.0% 10.4% 10.2% 10.4%
8.9%
$164.0 $167.2
$150.9
$125.5 $126.2
$111.7
$88.4
2006 2007 2008 2009 2010 2011 3/31/12
TTM
Adj. EBITDA Adj. EBITDA % of Net Sales
GLT net sales exceeded $1.6 billion in 2011. EBITDA continues to grow, driven by organic growth, execution of continuous improvement initiatives and strategic acquisitions.
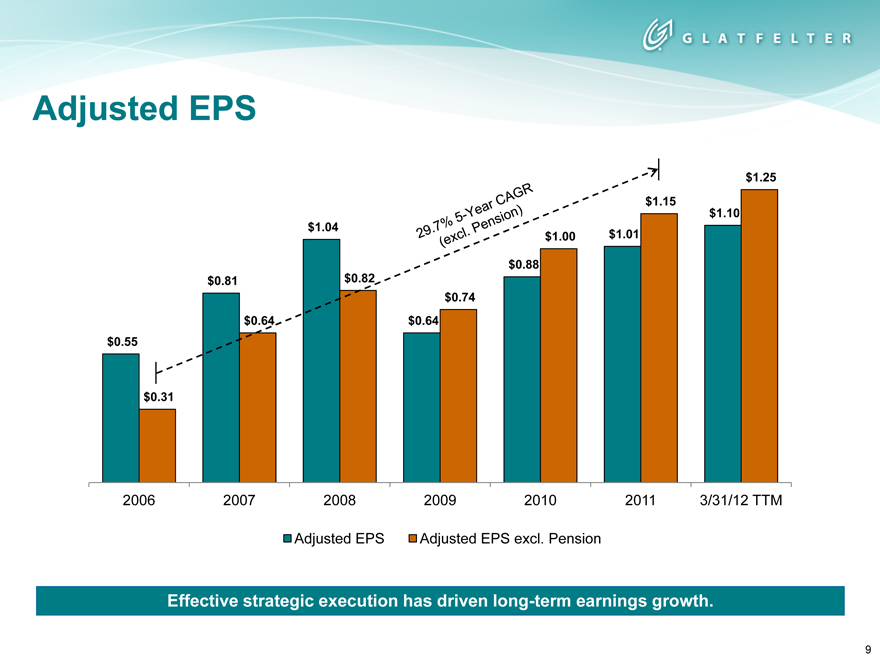
Adjusted EPS
$1.25 $1.15 $1.10 $1.04 $1.00 $1.01
$0.88 $0.81 $0.82 $0.74 $0.64 $0.64 $0.55
$0.31
2006 2007 2008 2009 2010 2011 3/31/12 TTM
Adjusted EPS Adjusted EPS excl. Pension
Effective strategic execution has driven long-term earnings growth.
9
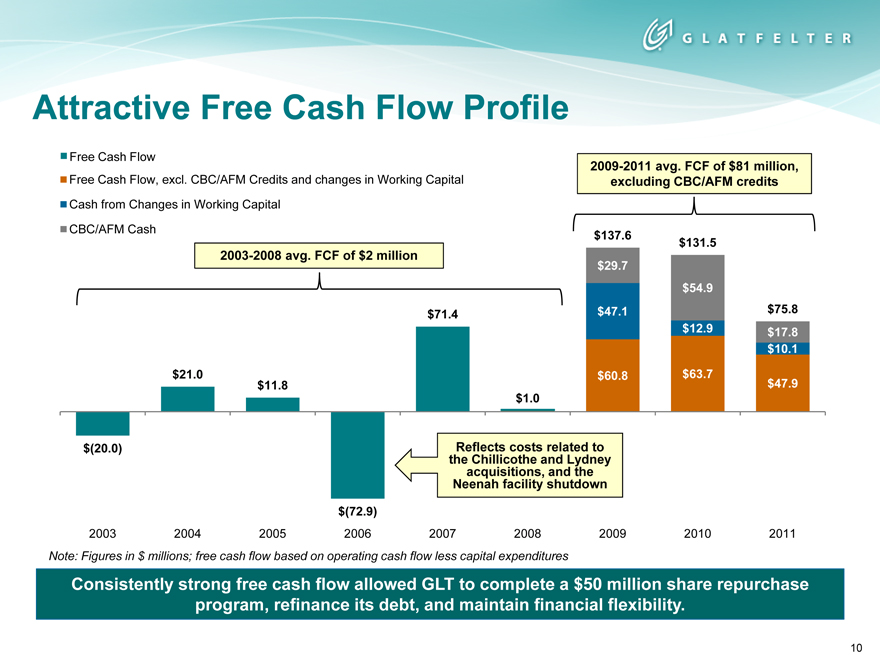
Attractive Free Cash Flow Profile
Free Cash Flow
Free Cash Flow, excl. CBC/AFM Credits and changes in Working Capital Cash from Changes in Working Capital CBC/AFM Cash
2003-2008 avg. FCF of $2 million
$21.0
$(20.0)
$11.8
$71.4
$1.0
$(72.9)
Reflects costs related to the Chillicothe and Lydney acquisitions, and the Neenah facility shutdown
2009-2011 avg. FCF of $81 million, excluding CBC/AFM credits
$137.6 $131.5 $29.7 $54.9
$47.1 $75.8
$12.9 $17.8 $10.1
$60.8 $63.7 $47.9
2003 2004 2005 2006 2007 2008 2009 2010 2011
Note: Figures in $ millions; free cash flow based on operating cash flow less capital expenditures
Consistently strong free cash flow allowed GLT to complete a $50 million share repurchase program, refinance its debt, and maintain financial flexibility.
10
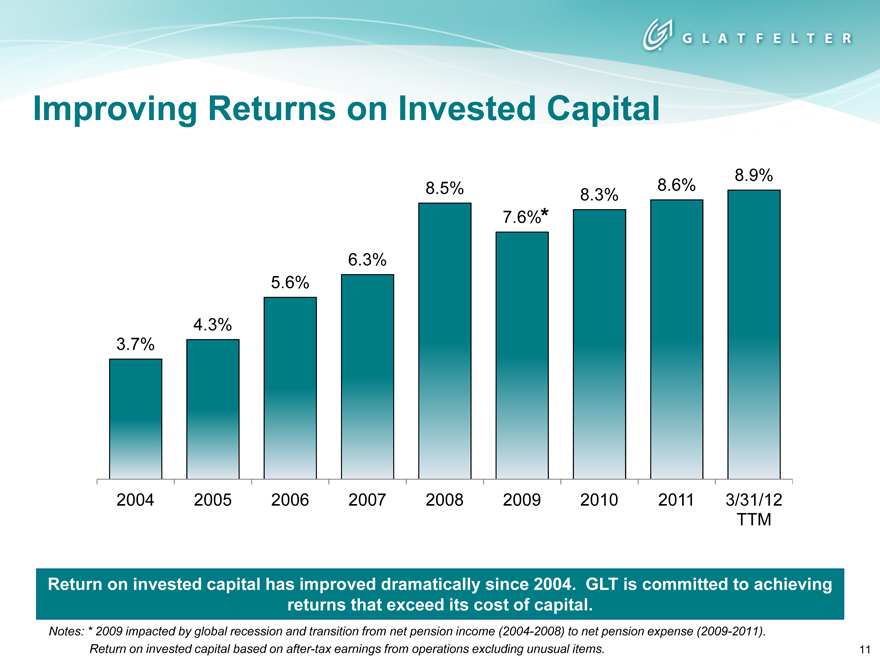
Improving Returns on Invested Capital
8.9%
8.5% 8.6%
8.3%
7.6%*
6.3%
5.6%
4.3%
3.7%
2004 2005 2006 2007 2008 2009 2010 2011 3/31/12 TTM
Return on invested capital has improved dramatically since 2004. GLT is committed to achieving returns that exceed its cost of capital.
Notes: * 2009 impacted by global recession and transition from net pension income (2004-2008) to net pension expense (2009-2011). Return on invested capital based on after-tax earnings from operations excluding unusual items.
11
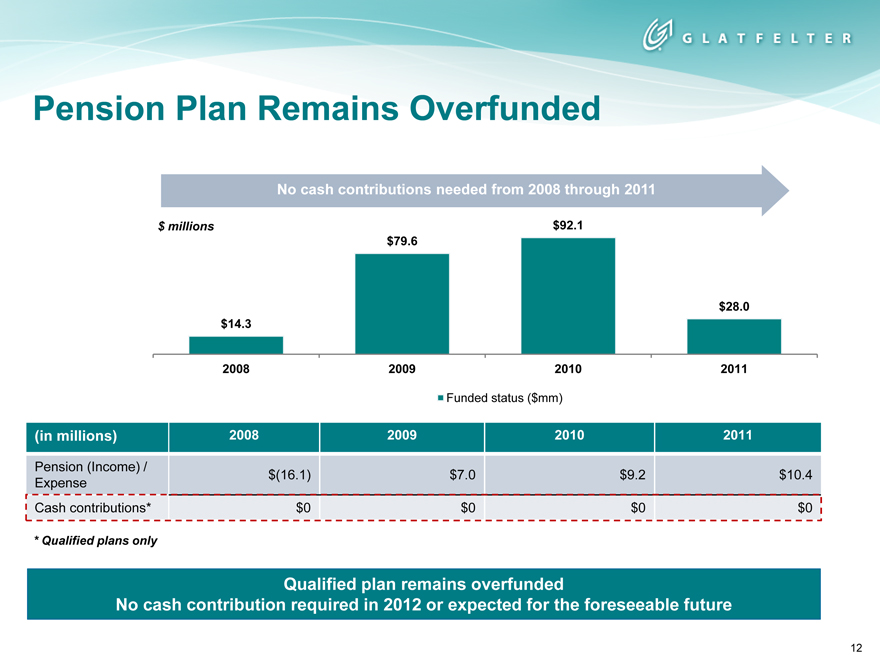
Pension Plan Remains Overfunded
No cash contributions needed from 2008 through 2011
$ millions $92.1
$79.6
$28.0
$14.3
2008 2009 2010 2011
Funded status ($mm)
(in millions) 2008 2009 2010 2011
Pension (Income) /
Expense $(16.1) $7.0 $9.2 $10.4
Cash contributions* $0 $0 $0 $0
Qualified plan remains overfunded
No cash contribution required in 2012 or expected for the foreseeable future
12
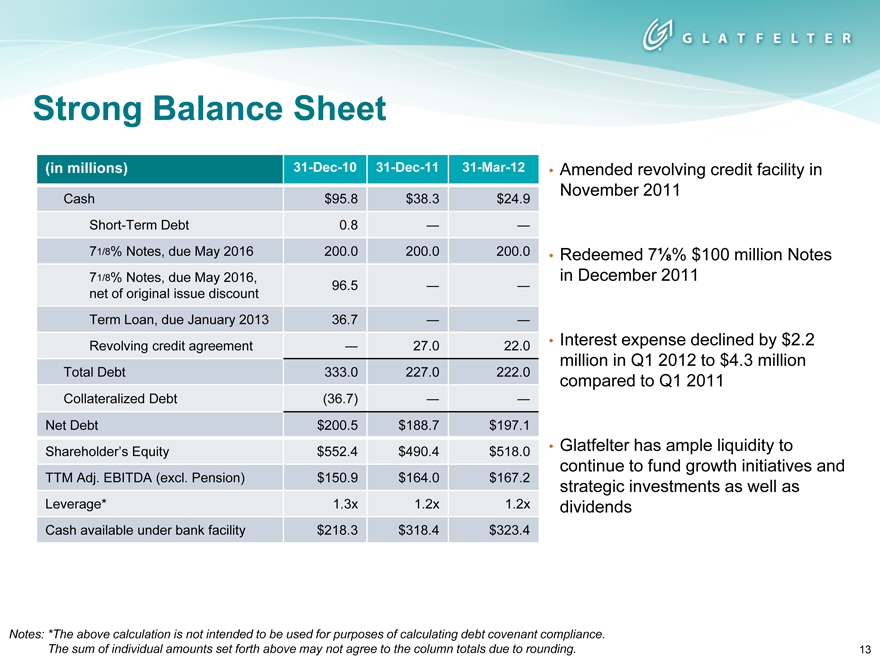
Strong Balance Sheet
(in millions) 31-Dec-10 31-Dec-11 31-Mar-12
Cash $95.8 $38.3 $24.9
Short-Term Debt 0.8 — —
71/8% Notes, due May 2016 200.0 200.0 200.0
71/8% Notes, due May 2016,
net of original issue discount 96.5 — —
Term Loan, due January 2013 36.7 — —
Revolving credit agreement — 27.0 22.0
Total Debt 333.0 227.0 222.0
Collateralized Debt (36.7) — —
Net Debt $200.5 $188.7 $197.1
Shareholder’s Equity $552.4 $490.4 $518.0
TTM Adj. EBITDA (excl. Pension) $150.9 $164.0 $167.2
Leverage* 1.3x 1.2x 1.2x
Cash available under bank facility $218.3 $318.4 $323.4
Amended revolving credit facility in November 2011
Redeemed 7 1/8% $100 million Notes in December 2011
Interest expense declined by $2.2 million in Q1 2012 to $4.3 million compared to Q1 2011
Glatfelter has ample liquidity to continue to fund growth initiatives and strategic investments as well as dividends
Notes: *The above calculation is not intended to be used for purposes of calculating debt covenant compliance. The sum of individual amounts set forth above may not agree to the column totals due to rounding.
13
Glatfelter Value Drivers
Strong Revenue Growth
5-year CAGR of 10.2%
Leading positions in global growth markets Tea and Coffee markets growing at 5% Feminine Hygiene market growing at 6%
Innovation leadership in key markets drives revenue growth opportunities
Expanding Margins
Driving cost reduction and productivity improvements
Leveraging leading positions in niche segments
Track Record of Profitable Growth
5-year EPS (excluding pension) CAGR of 30%
Improving returns on invested capital
Strong cash flow and financial strength to fund future growth
Strong balance sheet to fund growth opportunities
Timberland holdings of 32,000 acres
Pension plan overfunded
14
Appendix
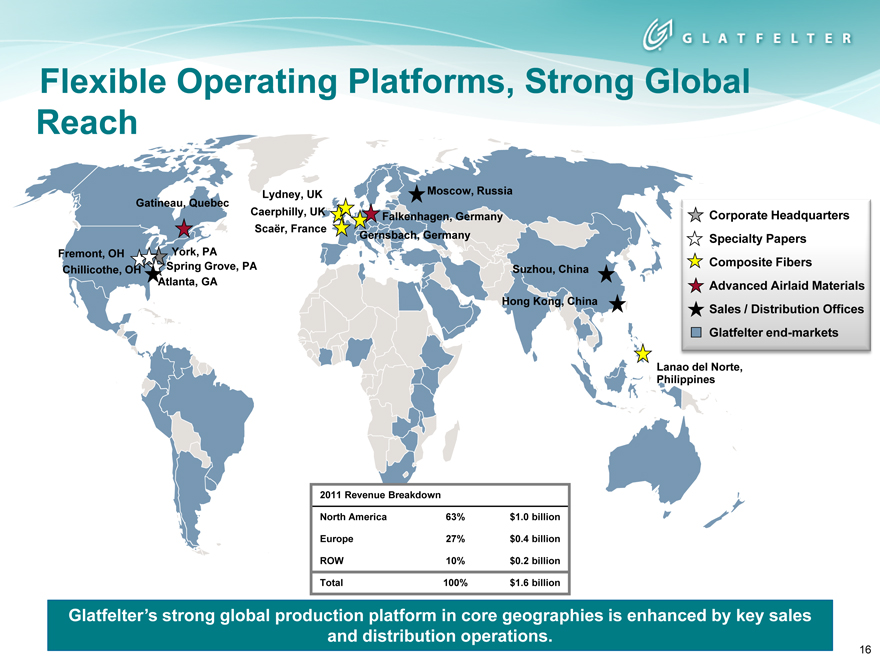
Lydney, UK Moscow, Russia Gatineau, Quebec
Caerphilly, UK Falkenhagen, Germany Corporate Headquarters Scaër, France Gernsbach, Germany Specialty Papers Fremont, OH York, PA Composite Fibers Chillicothe, OH Spring Grove, PA Suzhou, China Atlanta, GA Advanced Airlaid Materials Hong Kong, China Sales / Distribution Offices Glatfelter end-markets
Lanao del Norte, Philippines
Flexible Operating Platforms, Strong Global Reach
2011 Revenue Breakdown
North America 63% $1.0 billion
Europe 27% $0.4 billion
ROW 10% $0.2 billion
Total 100% $1.6 billion
Glatfelter’s strong global production platform in core geographies is enhanced by key sales and distribution operations.
16
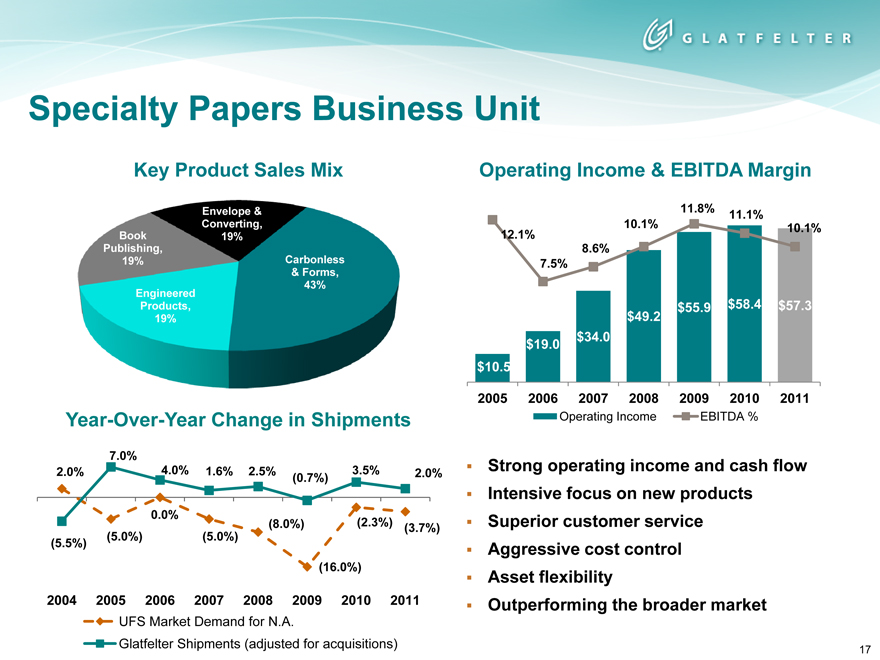
Specialty Papers Business Unit
Key Product Sales Mix
Envelope & Converting, Book 19% Publishing,
19% Carbonless
& Forms, 43% Engineered Products, 19%
Year-Over-Year Change in Shipments
7.0%
2.0% 4.0% 1.6% 2.5% 3.5% 2.0%
(0.7%)
0.0%
(8.0%) (2.3%)
(3.7%)
(5.0%) (5.0%)
(5.5%)
(16.0%)
2004 2005 2006 2007 2008 2009 2010 2011
UFS Market Demand for N.A.
Glatfelter Shipments (adjusted for acquisitions)
Operating Income & EBITDA Margin
11.8%
11.1%
12.1% 10.1% 10.1% 8.6% 7.5%
$49.2 $55.9 $58.4 $57.3
$34.0
$19.0
$10.5
2005 2006 2007 2008 2009 2010 2011
Operating Income EBITDA %
Strong operating income and cash flow
Intensive focus on new products
Superior customer service
Aggressive cost control
Asset flexibility
Outperforming the broader market
17
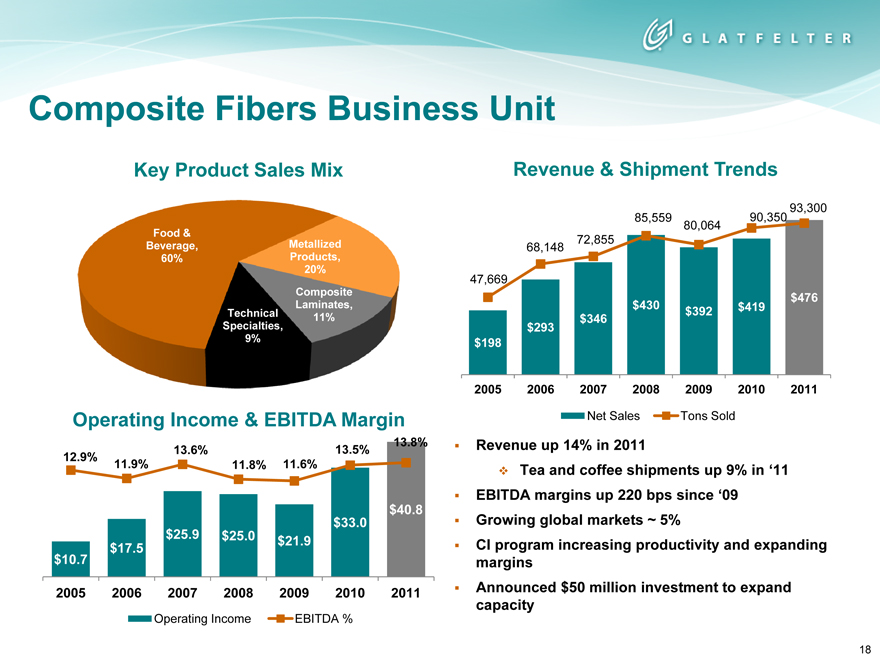
Composite Fibers Business Unit
Key Product Sales Mix
Food &
Beverage, Metallized 60% Products, 20%
Composite Laminates, Technical 11% Specialties, 9%
Operating Income & EBITDA Margin
13.8%
13.6% 13.5%
12.9%
11.9% 11.8% 11.6%
$40.8
$25.9 $33.0
$17.5 $25.0 $21.9
$10.7
2005 2006 2007 2008 2009 2010 2011
Operating Income EBITDA %
Revenue & Shipment Trends
93,300 85,559 90,350 80,064 72,855 68,148
47,669 $476 $430 $419 $392 $346 $293 $198
2005 2006 2007 2008 2009 2010 2011
Net Sales Tons Sold
Revenue up 14% in 2011
Tea and coffee shipments up 9% in ‘11 EBITDA margins up 220 bps since ‘09 Growing global markets ~ 5% CI program increasing productivity and expanding margins Announced $50 million investment to expand capacity
18
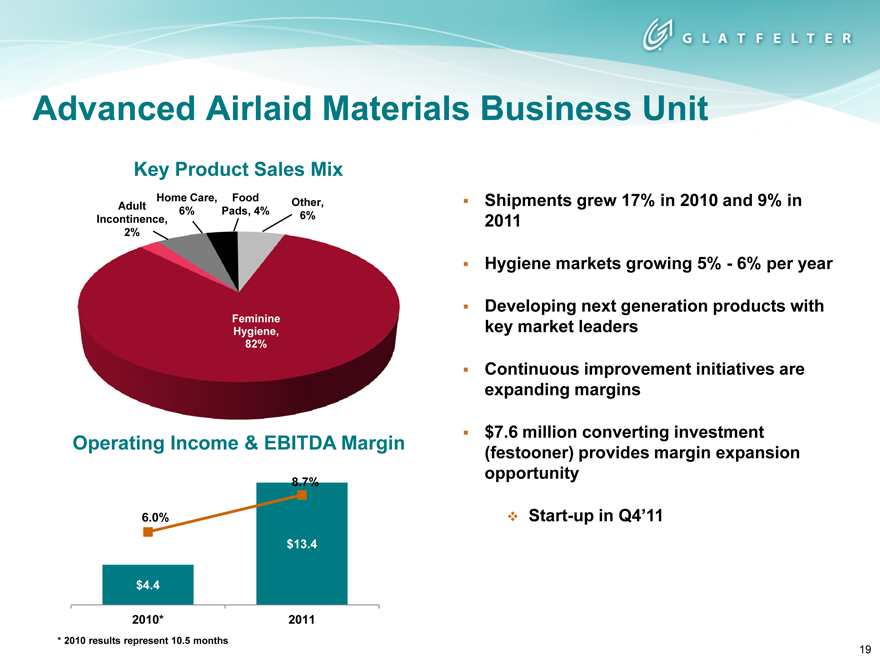
Advanced Airlaid Materials Business Unit
Key Product Sales Mix
Adult Incontinence, 2%
Home Care, 6%
Food Pads, 4%
Other, 6%
Feminine Hygiene, 82%
Shipments grew 17% in 2010 and 9% in 2011
Hygiene markets growing 5%—6% per year
Developing next generation products with key market leaders
Continuous improvement initiatives are expanding margins
$7.6 million converting investment (festooner) provides margin expansion opportunity
Start-up in Q4’11
Operating Income & EBITDA Margin
6.0%
8.7%
$13.4
$4.4
2010* 2011
* | | 2010 results represent 10.5 months |
19
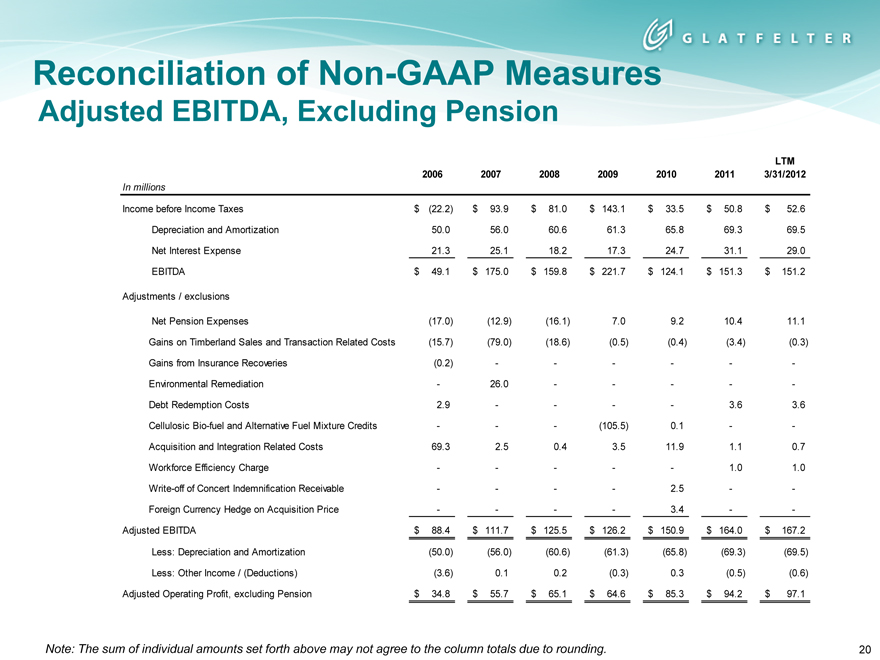
Reconciliation of Non-GAAP Measures
Adjusted EBITDA, Excluding Pension
LTM
2006 2007 2008 2009 2010 2011 3/31/2012
In millions
Income before Income Taxes $ (22.2) $ 93.9 $ 81.0 $ 143.1 $ 33.5 $ 50.8 $ 52.6
Depreciation and Amortization 50.0 56.0 60.6 61.3 65.8 69.3 69.5
Net Interest Expense 21.3 25.1 18.2 17.3 24.7 31.1 29.0
EBITDA $ 49.1 $ 175.0 $ 159.8 $ 221.7 $ 124.1 $ 151.3 $ 151.2
Adjustments / exclusions
Net Pension Expenses (17.0) (12.9) (16.1) 7.0 9.2 10.4 11.1
Gains on Timberland Sales and Transaction Related Costs (15.7) (79.0) (18.6) (0.5) (0.4) (3.4) (0.3)
Gains from Insurance Recoveries (0.2) ————— -
Environmental Remediation — 26.0 ———— -
Debt Redemption Costs 2.9 ———— 3.6 3.6
Cellulosic Bio-fuel and Alternative Fuel Mixture Credits ——— (105.5) 0.1 — -
Acquisition and Integration Related Costs 69.3 2.5 0.4 3.5 11.9 1.1 0.7
Workforce Efficiency Charge ————— 1.0 1.0
Write-off of Concert Indemnification Receivable ———— 2.5 — -
Foreign Currency Hedge on Acquisition Price ———— 3.4 — -
Adjusted EBITDA $ 88.4 $ 111.7 $ 125.5 $ 126.2 $ 150.9 $ 164.0 $ 167.2
Less: Depreciation and Amortization (50.0) (56.0) (60.6) (61.3) (65.8) (69.3) (69.5)
Less: Other Income / (Deductions) (3.6) 0.1 0.2 (0.3) 0.3 (0.5) (0.6)
Adjusted Operating Profit, excluding Pension $ 34.8 $ 55.7 $ 65.1 $ 64.6 $ 85.3 $ 94.2 $ 97.1
Note: The sum of individual amounts set forth above may not agree to the column totals due to rounding.
20
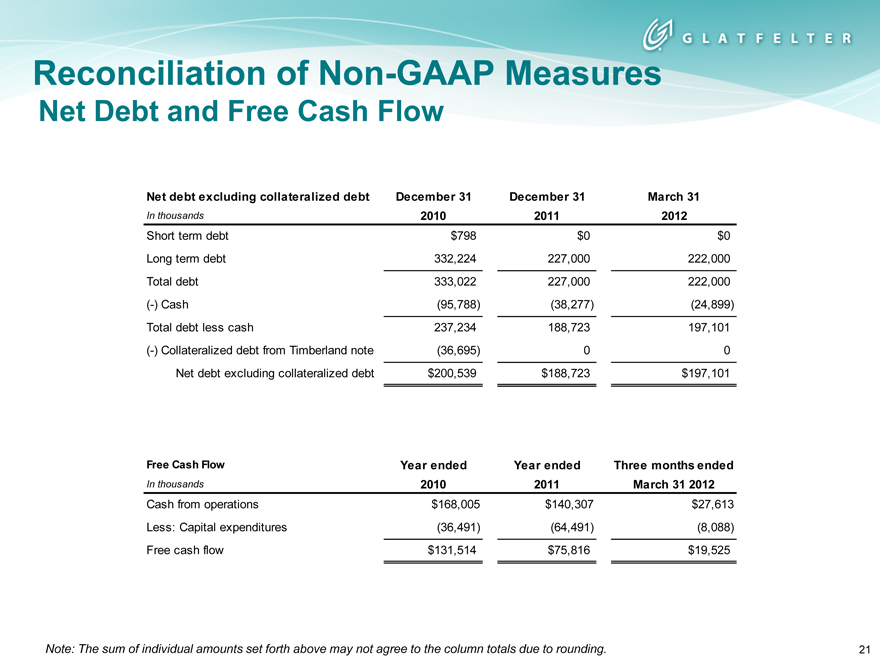
Reconciliation of Non-GAAP Measures
Net Debt and Free Cash Flow
Net debt excluding collateralized debt December 31 December 31 March 31
In thousands 2010 2011 2012
Short term debt $798 $0 $0
Long term debt 332,224 227,000 222,000
Total debt 333,022 227,000 222,000
(-) Cash (95,788) (38,277) (24,899)
Total debt less cash 237,234 188,723 197,101
(-) Collateralized debt from Timberland note (36,695) 0 0
Net debt excluding collateralized debt $200,539 $188,723 $197,101
Free Cash Flow Year ended Year ended Three months ended
In thousands 2010 2011 March 31 2012
Cash from operations $168,005 $140,307 $27,613
Less: Capital expenditures (36,491) (64,491) (8,088)
Free cash flow $131,514 $75,816 $19,525
Note: The sum of individual amounts set forth above may not agree to the column totals due to rounding.
21