Exhibit 99.2

| Goodrich Corporation Third Quarter 2007 Results October 25, 2007 |

| Certain statements made in this presentation are forward-looking statements within the meaning of the Private Securities Litigation Reform Act of 1995 regarding the Company's future plans, objectives and expected performance. The Company cautions readers that any such forward- looking statements are based on assumptions that the Company believes are reasonable, but are subject to a wide range of risks, and actual results may differ materially. Important factors that could cause actual results to differ include, but are not limited to: demand for and market acceptance of new and existing products, such as the Airbus A350 XWB and A380, the Boeing 787 Dreamliner, the Embraer 190, the Dassault Falcon 7X, and the Lockheed Martin F- 35 Lightning II and F-22 Raptor; the health of the commercial aerospace industry, including the impact of bankruptcies and/or mergers in the airline industry; global demand for aircraft spare parts and aftermarket services; and other factors discussed in the Company's filings with the Securities and Exchange Commission and in the Company's October 25, 2007 Third Quarter 2007 Results press release. The Company cautions you not to place undue reliance on the forward-looking statements contained in this presentation, which speak only as of the date on which such statements were made. The Company undertakes no obligation to release publicly any revisions to these forward- looking statements to reflect events or circumstances after the date on which such statements were made or to reflect the occurrence of unanticipated events. Forward Looking Statements |

| Financial and Operational Highlights |

| Highlights Board of Directors approved 12.5% dividend increase, payable on January 2, 2008 Announced sale of Aviation Technical Services (ATS) to Macquarie Bank Limited, expect to realize net cash proceeds of approximately $90 million All periods reflect ATS as a discontinued operation Third quarter 2007 results, compared with third quarter 2006 Sales grew 15% - continued significant growth in commercial aftermarket sales Segment OI margin increased from 14.5% to 17.2% Income per diluted share from continuing operations of $1.10 - a 39% increase over third quarter 2006 Includes $0.11 per diluted share related to a customer claims settlement |

| 2007 & 2008 Outlook Full Year 2007 Outlook Sales outlook adjusted to $6.4 - $6.5 billion - excluding sales associated with ATS ($6.5 - $6.6 billion previously) Outlook for income per diluted share from continuing operations increased to $3.65 - $3.70 ($3.50 - $3.60 per diluted share previously) Net cash provided by operating activities, minus capital expenditures, of 60% - 75% of net income (unchanged) Full Year 2008 Outlook Sales outlook of $7.1 - $7.2 billion - approximately 11% growth over expected 2007 results Outlook for net income and income per diluted share from continuing operations of $4.15 - $4.30 - approximately 12 - 16% growth over expected 2007 results Includes expected increase in effective tax rate to 33 - 35% Net cash provided by operating activities, minus capital expenditures, expected to be greater than 75% of net income |

| Delivering Sustained Sales Growth and Margin Expansion Q4 2004 Q1 2005 Q2 2005 Q3 2005 Q4 2005 Q1 2006 Q2 2006 Q3 2006 Q4 2006 Q1 2007 Q2 2007 Q3 2007 FY07 Est. East 4554 4765 4940 5103 5203 5368 5508 5578 5719 5879 6013 6219 6400 w 100 Q4 2004 Q1 2005 Q2 2005 Q3 2005 Q4 2005 Q1 2006 Q2 2006 Q3 2006 Q4 2006 Q1 2007 Q2 2007 Q3 2007 FY07 Est. East 0.0977 0.1045 0.1088 0.1112 0.1179 0.1181 0.1245 0.1311 0.135 0.1416 0.1467 0.1537 0.155 $M Sales* (Trailing Four Qtrs.) Segment Operating Income Margins* (Trailing Four Qtrs.) 2007 Outlook Range Approximate 2007 Outlook ~ * Excluding ATS - now classified as a discontinued operation |

| Year-over-Year Financial Results |

| (Dollars in Millions, excluding EPS) 3rd Qtr 2007 3rd Qtr 2006 Change Sales $1,602 $1,395 15% Segment operating income $276 $202 37% - % of Sales 17.2% 14.5% +2.7% Income - Continuing Operations - Net Income $140 $127 $100 $101 40% 26% Diluted EPS - Continuing Operations - Net Income $1.10 $0.99 $0.79 $0.80 39% 24% Third Quarter 2007 - Financial Summary Year-over-Year Performance |

| (Dollars in Millions, excluding EPS) 1st Nine Months 2007 1st Nine Months 2006 Change Sales $4,724 $4,224 12% Segment operating income $762 $578 32% - % of Sales 16.1% 13.7% +2.4% Income - Continuing Operations - Net Income $363 $351 $380* $383* (4%) (8%) Diluted EPS - Continuing Operations - Net Income $2.84 $2.75 $3.01* $3.04* (6%) (10%) First Nine Months 2007 - Financial Summary Year-over-Year Performance * First nine months 2006 results include tax settlements totaling $145 million, or $1.15 per diluted share |

| Third Quarter 2007 Year-over-Year Financial Change Analysis (Dollars in Millions) (Dollars in Millions) Item Sales After-tax Income from Continuing Ops Income per Diluted Share from Continuing Ops Third Quarter 2006 - Income from Continuing Operations $1,395 $100 $0.79 Increased overall volume, efficiency, mix, other $187 $51 $0.38 Customer settlements $14 $0.11 Foreign exchange translation costs $20 ($3) ($0.02) Stock-based compensation ($10) ($0.07) Tax settlements in third quarter 2006 ($14) ($0.11) Other income (expense) $2 $0.02 Third Quarter 2007 - Income from Continuing Operations $1,602 $140 $1.10 |

| Third Quarter 2007 Year-over-Year Segment Results 3rd Quarter 2007 3rd Quarter 2006 Change Change Dollars in Millions 3rd Quarter 2007 3rd Quarter 2006 $ % Sales Actuation and Landing Systems Nacelles and Interior Systems Electronic Systems Total Sales $608 $545 $449 $1,602 $516 $464 $415 $1,395 $92 $81 $34 $207 18% 17% 8% 15% Segment OI Actuation and Landing Systems Nacelles and Interior Systems Electronic Systems Total Segment OI $73 $144 $59 $276 $42 $103 $57 $202 $31 $41 $2 $74 74% 39% 4% 37% Segment Margin Actuation and Landing Systems Nacelles and Interior Systems Electronic Systems Overall Segment Margin 12.1% 26.3% 13.1% 17.2% 8.2% 22.2% 13.6% 14.5% N/A N/A N/A N/A +3.9% +4.1% (0.5%) +2.7% |
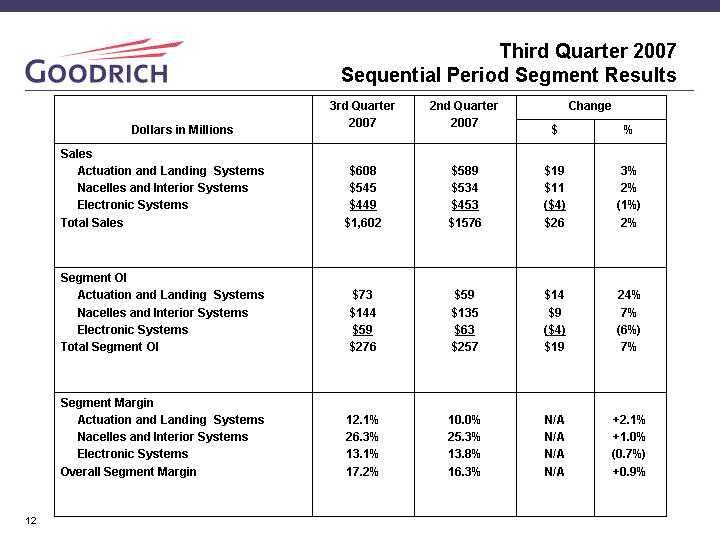
| Third Quarter 2007 Sequential Period Segment Results 3rd Quarter 2007 2nd Quarter 2007 Change Change Dollars in Millions 3rd Quarter 2007 2nd Quarter 2007 $ % Sales Actuation and Landing Systems Nacelles and Interior Systems Electronic Systems Total Sales $608 $545 $449 $1,602 $589 $534 $453 $1576 $19 $11 ($4) $26 3% 2% (1%) 2% Segment OI Actuation and Landing Systems Nacelles and Interior Systems Electronic Systems Total Segment OI $73 $144 $59 $276 $59 $135 $63 $257 $14 $9 ($4) $19 24% 7% (6%) 7% Segment Margin Actuation and Landing Systems Nacelles and Interior Systems Electronic Systems Overall Segment Margin 12.1% 26.3% 13.1% 17.2% 10.0% 25.3% 13.8% 16.3% N/A N/A N/A N/A +2.1% +1.0% (0.7%) +0.9% |
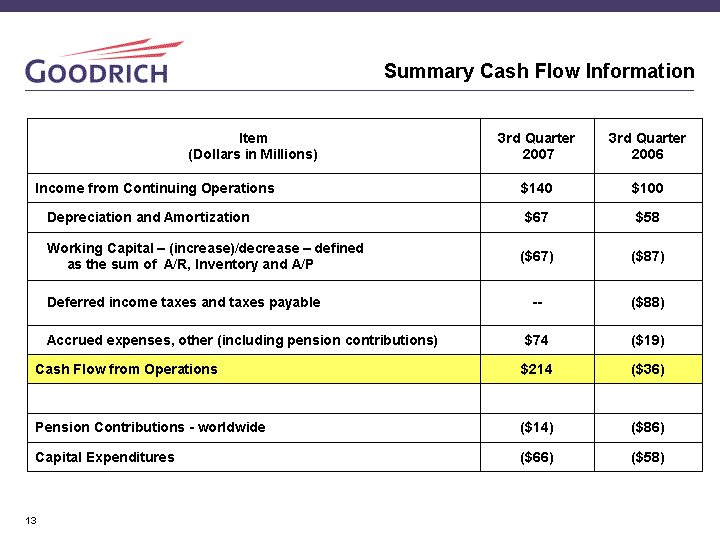
| Summary Cash Flow Information Item (Dollars in Millions) 3rd Quarter 2007 3rd Quarter 2006 Income from Continuing Operations $140 $100 Depreciation and Amortization $67 $58 Working Capital - (increase)/decrease - defined as the sum of A/R, Inventory and A/P ($67) ($87) Deferred income taxes and taxes payable -- ($88) Accrued expenses, other (including pension contributions) $74 ($19) Cash Flow from Operations $214 ($36) Pension Contributions - worldwide ($14) ($86) Capital Expenditures ($66) ($58) |

| Sales by Market Channel |

| Boeing Airbus Regional, Business, GA OE Commercial A/C Aftermarket Regional, Business & GA Aftmkt Military aftermarket Milatary OE Other East 10 15 8 30 7 8 17 5 First Nine Months 2007 Sales by Market Channel Total Sales $4,724M Large Commercial Aircraft Aftermarket 30% Regional, Business & General Aviation Aftermarket 7% Boeing Commercial OE 10% Airbus Commercial OE 15% Defense & Space, OE & Aftermarket 25% Other 5% OE AM Balanced business mix; aftermarket represents 45% of total sales Regional, Business & Gen. Av. OE 8% Total Commercial Aftermarket 37% Total Commercial OE 33% Total Defense and Space 25% |

| Sales by Market Channel Third Quarter 2007 Change Analysis Actual Goodrich Change Comparisons Actual Goodrich Change Comparisons Actual Goodrich Change Comparisons 3Q 2007 vs. 3Q 2006 3Q 2007 vs. 2Q 2007 First Nine Months 2007 vs. First Nine Months 2006 Boeing and Airbus - OE Production Aircraft Deliveries 18% 4% 7% Regional, Business & General Aviation - OE Aircraft Deliveries 20% (11%) 17% Aftermarket - Large Commercial, Regional, Business and GA ASMs, Age, Cycles, Fleet size 16% 1% 17% Defense and Space - OE and Aftermarket US, UK Defense Budgets 9% 4% 8% Other IGT, Other 12% 5% 12% Goodrich Total Sales 15% 2% 12% |

| 2007 and 2008 Outlook |
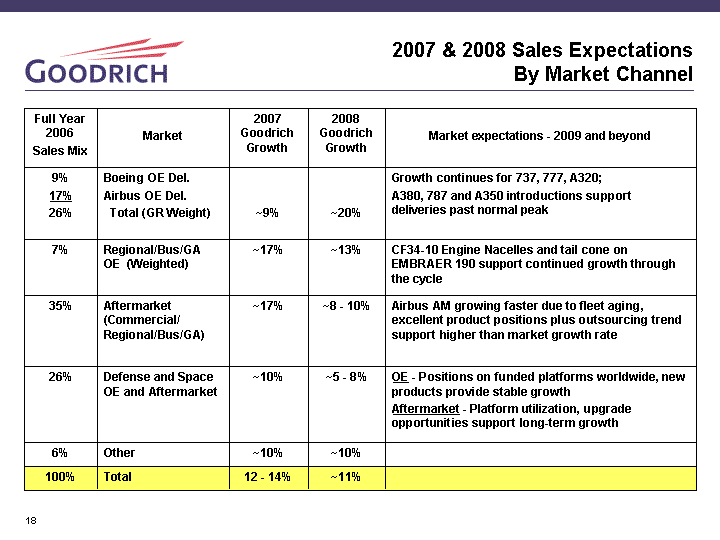
| 2007 & 2008 Sales Expectations By Market Channel Full Year 2006 Sales Mix Market 2007 Goodrich Growth 2008 Goodrich Growth Market expectations - 2009 and beyond 9% 17% 26% Boeing OE Del. Airbus OE Del. Total (GR Weight) ~9% ~20% Growth continues for 737, 777, A320; A380, 787 and A350 introductions support deliveries past normal peak 7% Regional/Bus/GA OE (Weighted) ~17% ~13% CF34-10 Engine Nacelles and tail cone on EMBRAER 190 support continued growth through the cycle 35% Aftermarket (Commercial/ Regional/Bus/GA) ~17% ~8 - 10% Airbus AM growing faster due to fleet aging, excellent product positions plus outsourcing trend support higher than market growth rate 26% Defense and Space OE and Aftermarket ~10% ~5 - 8% OE - Positions on funded platforms worldwide, new products provide stable growth Aftermarket - Platform utilization, upgrade opportunities support long-term growth 6% Other ~10% ~10% 100% Total 12 - 14% ~11% |

| Aerospace and Defense Themes Commercial Aircraft Original Equipment Production New orders for commercial aircraft, including regional aircraft, remain very strong Manufacturers continue to raise production rates Strong sales for new models entering production, especially Boeing's 787 Dreamliner Deliveries expected to increase an average of 9 percent per year from 2008 through 2010, currently expect peak in 2011 with slight drop in 2012 Continued strong demand for larger regional jets Commercial Aircraft Aftermarket Products and Services Worldwide growth in available seat miles supports demand for replacement parts and repair and overhaul services Expect 4 - 5 percent base volume growth over the long-term Consistent and predictable over the cycle Aging aircraft fleet drives additional growth for many popular models of aircraft Defense and Space Products and Services Strong demand for products supporting platforms Original equipment and aftermarket Good positions on newly funded platforms (e.g. Black Hawk helicopters, F-35) New opportunities for mission equipment and intelligence, surveillance and reconnaissance (ISR) products |
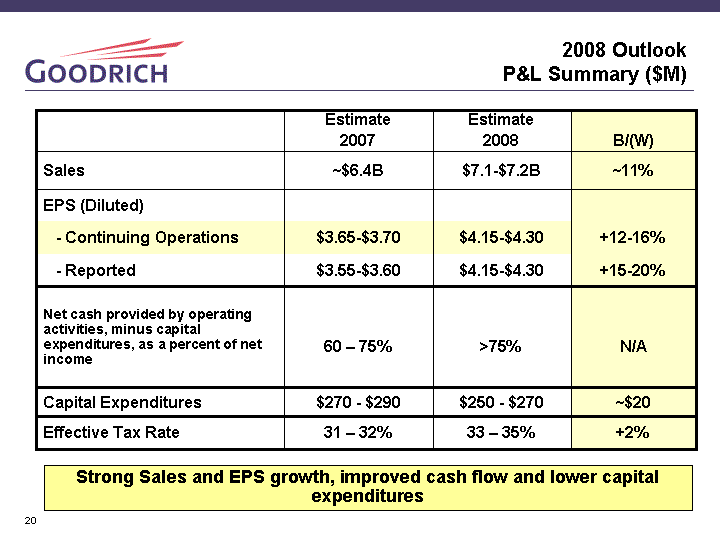
| 2008 Outlook P&L Summary ($M) Estimate 2007 Estimate 2008 B/(W) Sales ~$6.4B $7.1-$7.2B ~11% EPS (Diluted) - Continuing Operations $3.65-$3.70 $4.15-$4.30 +12-16% - Reported $3.55-$3.60 $4.15-$4.30 +15-20% Net cash provided by operating activities, minus capital expenditures, as a percent of net income 60 - 75% >75% N/A Capital Expenditures $270 - $290 $250 - $270 ~$20 Effective Tax Rate 31 - 32% 33 - 35% +2% Strong Sales and EPS growth, improved cash flow and lower capital expenditures |