Deutsche Bank Global Auto Industry Conference January 13, 2015 Exhibit 99.1 |
Forward-Looking Statements Certain information contained in this presentation constitutes forward-looking statements for purposes of the safe harbor provisions of The Private Securities Litigation Reform Act of 1995. There are a variety of factors, many of which are beyond our control, that affect our operations, performance, business strategy and results and could cause our actual results and experience to differ materially from the assumptions, expectations and objectives expressed in any forward-looking statements. These factors include, but are not limited to: our ability to implement successfully our strategic initiatives; actions and initiatives taken by both current and potential competitors; increases in the prices paid for raw materials and energy; a labor strike, work stoppage or other similar event; deteriorating economic conditions or an inability to access capital markets; work stoppages, financial difficulties or supply disruptions at our suppliers or customers; the adequacy of our capital expenditures; our failure to comply with a material covenant in our debt obligations; potential adverse consequences of litigation involving the company; as well as the effects of more general factors such as changes in general market, economic or political conditions or in legislation, regulation or public policy. Additional factors are discussed in our filings with the Securities and Exchange Commission, including our annual report on Form 10-K, quarterly reports on Form 10-Q and current reports on Form 8-K. In addition, any forward-looking statements represent our estimates only as of today and should not be relied upon as representing our estimates as of any subsequent date. While we may elect to update forward-looking statements at some point in the future, we specifically disclaim any obligation to do so, even if our estimates change. Reconciliations of the non-GAAP financial measures used in this presentation are available in the Appendix and are posted on our Investor Relations website, investor.goodyear.com. 2 |
Company Overview . Goodyear tires are sold in two distinct tire markets... (% of 2013 Units of 162 million) ...and serve customers around the world (% of 2013 Revenue of ~$20 billion) …available in a diverse selection of products... (% of 2013 Revenue of ~$20 billion) OE ~20% of 2013 Revenue Consumer 21% Retail 7% Other 12% Chemical 4% Commercial Includes: OTR, Farm, Race, & Aviation 56% North America 44% Europe, Middle East & Africa 34% Latin America 11% Asia Pacific 11% Goodyear is a global tire industry leader with powerful brands and broad product reach Replacement Market 69% OE Market 31% 3 |
Strategy Roadmap 4 Our Destination - Our Destination - Creating Sustainable Value Creating Sustainable Value Industry MegaTrends “Long-term Growth Drivers” Where We Are Where We Are Key Strategies Key Strategies Key How To’s Key How To’s Executing Plan Innovation Leader Record Earnings Value Creating Investing for Growth US Pension Fully Funded Top Line / Bottom Line Growth First with Customers Innovation Leaders Leader in Targeted Segments 1. North America: Grow Profitably 2. Asia: Win in China / Grow Asia 3. EMEA / LA: Return to Historical Profit Competitively Advantaged Profitable thru Economic Cycle Cash Flow Positive Investment Grade Market-Back Innovation Excellence Sales & Marketing Excellence Operational Excellence Operational Excellence Enabling Investments Enabling Investments Top Talent / Top Teams |
Goodyear’s Competitive Advantage For winners, not an “OR”… it is an “AND” Goodyear delivers both in an integrated manner Market-Back Approach Sufficient HVA Capacity Advantaged Value Proposition Operational Excellence 5 AND Iconic brand Industry leading products Pervasive distribution Strong customer relations Consumer-centric focus Right Tire Right Time Right Place Right Cost |
Goodyear Then … And Now 2013 2012 2011 2010 $1.6 $1.2 $1.4 $0.9 Segment Operating Income Growth (a) See Segment Operating Income reconciliation in Appendix on page 23 (b) Trailing twelve months as of September 30, 2014 (c) See Free Cash Flow from Operations reconciliation in Appendix on page 24 (d) Primarily non-US plans; projected for December 31, 2014 using 2013 year-end assumptions (a) 2013 2012 2011 2010 $1.0 $0.7 $0.2 $0.4 Strong Free Cash Flow (c) 6 $ In billions 2014E 2013 2012 2011 ~$0.7 $1.9 $3.5 $3.1 Progress on Global Unfunded Pension (d) Significant SOI growth and cash generation capability $1.8 TTM (b) $0.8 TTM (b) TTM (b) $0.8 2013 2012 2010 $0.7 $0.5 $0.3 ~$0 North America Turnaround 2011 Segment Operating Income $0.3B loss in 2009 Fully funded, froze, and de- risked U.S. plans |
Preliminary View of 2014 Results 7 • Record total company and North America segment operating income • Now expect 2014 FY SOI growth slightly below original 10-15% range, primarily due to a more challenging industry environment in Europe in Q4 and stronger dollar globally – Expect global volume to be essentially flat – Expect Q4 impact of these developments to be $0.15-$0.20 per share below our expectations at time of Q3 call • Expect free cash flow to be slightly better than anticipated at time of Q3 call; capital allocation plan remains on track Record earnings and strong free cash flow |
Q4 2014 EMEA Business Update 8 • Industry negatively impacted by warmer than expected winter that lasted through the quarter; one of the warmest on record • While our winter premium brand sales through Q3 were strong, dealer replenishment was much weaker in Q4 than we expected – Industry sell-out was down double digits in some markets compared with last year • More challenging economic conditions and a stronger US dollar More challenging environment than expected in Europe in Q4 |
9 2015 Outlook Preliminary Planning Assumptions FX headwind (similar impact as 2014) Venezuela uncertainty Neutral OTR Potential release of US tax valuation allowance Tax rate if released: 30-35% of global pre-tax income, no US cash taxes for ~5 years Global volume growth of 1-2% Positive price mix vs. raw materials (~$50-$100 million) Cost savings Operational Excellence Amiens closure / EMEA Farm tire business exit $1.2 billion capex Reaffirming 10-15% SOI growth target for 2015; Planning assumptions to be updated in year-end call Positive Drivers Other Factors As previously presented during Q3 Earnings Call (October 29, 2014) |
10 2015 Outlook Preliminary Planning Assumptions FX headwind (similar impact as 2014) Venezuela uncertainty Neutral OTR Potential release of US tax valuation allowance • Tax rate if released: 30-35% of global pre-tax income, no US cash taxes for ~5 years Global volume growth of 1-2% Positive price mix vs. raw materials (~$50-$100 million) Cost savings • Operational Excellence • Amiens closure / EMEA Farm tire business exit $1.2 billion capex Positive Drivers Other Factors Will update at our Year-End Earnings Call in February 2015 (Call-Out boxes reflect latest factors) Getting tougher Lower raws USD continues to strengthen Increasing confidence Impact of oil price on economic model Chinese tariffs Continue to reaffirm 10-15% SOI growth target for 2015; Expect positive momentum in NA to offset International headwinds |
Recent Trends: Raw Materials • Spot prices down significantly YoY in 2014: – Natural Rubber: ~32% – Synthetic Rubber: ~8% – Carbon Black: ~53% – Oil (WTI): ~46% • Raw materials ~50% of tire business cost of goods sold – Tires ~85% of total cost of goods sold • Around two-thirds of raw materials are influenced by oil prices – P&L impact lags spot rates by 1-2 quarters depending on commodity • Customer agreements indexed to raw materials: – OE customers (~20% of sales) – Certain large Commercial fleets – OTR customers Goodyear Global Raw Material Usage 2014 FY Estimate *Petrochemical-based * * * * Recent decline in commodity prices will provide a further tailwind to raw material costs beginning in Q2 2015 |
Recent Trends: Potential US Tariffs on Chinese Consumer Tire Imports Several recent affirmative rulings by the Department of Commerce (DOC) and International Trade Commission (ITC) for anti-dumping (AD) and countervailing duty (CVD) investigations 7/22/14: ITC affirmative preliminary injury decision 11/21/14: DOC affirmative preliminary CVD decision and rate set (12.03% margin for most Chinese tire importers) CVD and any future AD margins retroactive to September Upcoming decisions: 1/20/15: DOC preliminary AD decision & rate Petition seeking AD margins between 45.80-87.99% 4/6/15: DOC final AD and CVD decisions 5/21/15: ITC final injury determination (deadline could be pushed 60 days) 2009-2012 Traiff 421 benefited our US business 12 |
2015-2016 Financial Targets We remain confident in our strategy Reaffirming 2015-2016 targets – Annual 10-15% SOI growth per year – Annual positive free cash flow from operations – Adjusted Debt to EBITDAP (a) ratio of ~2.0x by the end of 2016 (a) Total debt plus global pension liability, divided by net income before interest expense, income tax expense, depreciation and amortization expense, net periodic pension cost, rationalization charges and other (income) and expense Reaffirming 2015-2016 targets; will update assumptions on Q4 call |
Capital Allocation |
2014 - 2016 SOI Target $5.5 - $5.8 2014 - 2016 EBITDAP ~ $7.8 - $8.2 Adjustments for: Corporate Expense, Depreciation, and Pension Expense 15 Sources and Uses of Cash 2014-2016 Note: All estimates based on current assumptions and available data Strong earnings growth driving significant cash available for deployment Maintaining the Business Capital Allocation Plan $ In billions • Interest Expense ~$1.2 - • Taxes Paid ~ $0.8 - $1.0 • Sustaining CapEx ~ $2.0 - $2.2 • Working Capital ~ $0.0 • ~$4.0 - $4.6 Cash Available for Deployment • Dividends / Share Repurchase • Growth CapEx • Debt Reductions (incl. Pension) • Restructurings ~$3.6 - $3.8 Total $1.4 |
Balanced capital allocation plan Capital Allocation Plan – Driving Value 2014-2016 16 * $0.65B approved by Board of Directors; increases dependent on Company performance including the achievement of financial targets Debt Repayment / Pension Funding Growth CapEx Restructurings Shareholder Return Program $1.5B $0.6 - $0.9B* $0.6B $0.8 - $0.9B $3.6 - $3.8B |
Americas NA & LA ~ 30% Americas NA & LA ~ 55% EMEA & Asia ~ 70% EMEA & Asia ~ 45% 2011-2013 ~$1.3 billion 2014-2016 ~$1.5 billion Heavy investment in new China plant and Europe tire labeling Includes new plant for the Americas ~$500 million Growth CapEx Investment Continue to invest for growth ... shifting focus to meet business needs Targeting ~20% IRR Primarily investment in HVA capacity & tire labeling capabilities 17 |
Balance Sheet Management – Leverage Targets Leverage consistent with commitment to achieving investment grade metrics Reduces cost of capital Improves global access to credit Committed to achieving investment grade balance sheet by the end of 2016 Adjusted Debt / EBITDAP (a) Note: See reconciliations in Appendix on page 25 Greater ability to move debt overseas Ability to reduce cash balances a) Total debt plus global pension liability, divided by net income before interest expense, income tax expense, depreciation and amortization expense, net periodic pension cost, rationalization charges and other (income) and expense |
Shareholder Return Program Continued focus on shareholder returns Share repurchase program - $450 million authorized in 2014-2016 plan – Completed $150 million in Q4/14 – Approximately halfway through program in first year Dividend payment $0.06 per share per quarter, a 20% increase in first year |
Q & A |
Appendix |
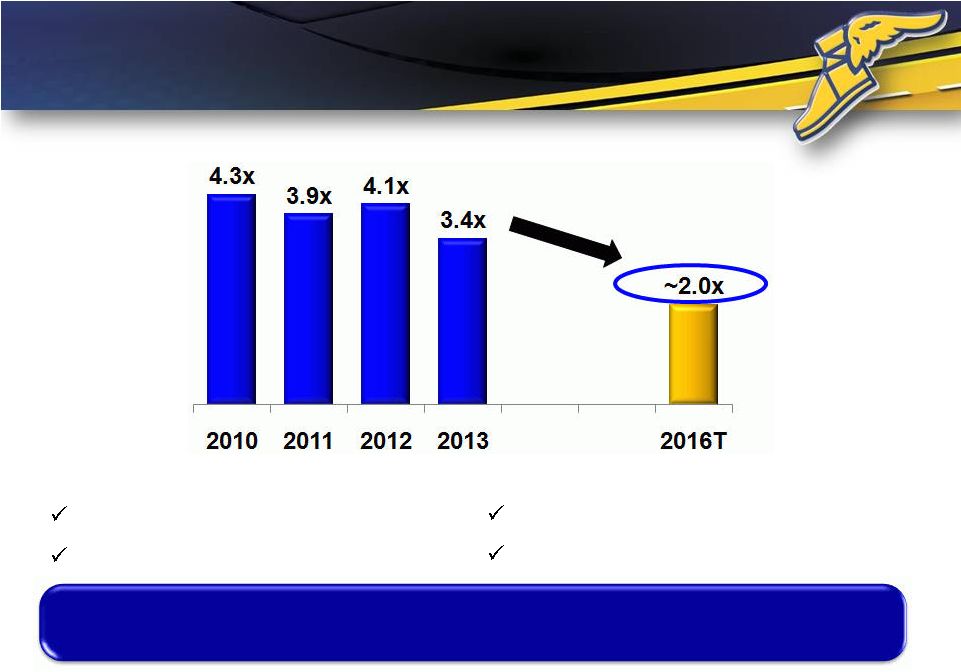
Use of Historical and Forward-Looking Non-GAAP Financial Measures This presentation contains our historical total segment operating income and free cash flow from operations for certain periods, our targeted total segment operating income growth rate for 2015-16, our historical ratio of Adjusted Debt to EBITDAP for certain periods, and our targeted ratio of Adjusted Debt to EBITDAP for 2016. Total segment operating income, free cash flow from operations, and the ratio of Adjusted Debt to EBITDAP are important financial measures for the company but are not financial measures defined by U.S. GAAP, and should not be construed as an alternative to corresponding financial measures presented in accordance with U.S. GAAP. Total segment operating income is the sum of the individual strategic business units’ segment operating income as determined in accordance with U.S. GAAP. The most directly comparable GAAP financial measure is Income before Income Taxes. Management believes that total segment operating income is useful because it represents the aggregate value of income created by the company’s SBUs and excludes items not directly related to the SBUs for performance evaluation purposes. Free Cash Flow from Operations is the company’s Cash Flow from Operations as determined in accordance with U.S. GAAP before pension contributions and direct payments and rationalization payments, less capital expenditures. Management believes that Free Cash Flow from Operations is useful because it represents the cash generating capability of the company’s ongoing operations, after taking into consideration capital expenditures necessary to maintain its business and pursue growth opportunities. Adjusted Debt is the sum of our total debt and our global pension liability, each as determined in accordance with U.S. GAAP, and EBITDAP, as adjusted, represents net income (the most directly comparable GAAP financial measure) before interest expense, income tax expense, depreciation and amortization expense, net periodic pension cost, rationalization charges and other (income) and expense. We present the ratio of Adjusted Debt to EBITDAP because we believe it is widely used by investors as a means of evaluating a company’s leverage. It should be noted that other companies may calculate similarly titled non-GAAP financial measures differently and, as a result, the measures presented herein may not be comparable to such similarly titled measures reported by other companies. We are unable to present a quantitative reconciliation of our forward-looking non-GAAP financial measures to the most directly comparable GAAP financial measures, because management cannot reliably predict all of the necessary components of those GAAP financial measures without unreasonable effort. These components could be significant to the calculation of those GAAP financial measures in the future. |
Reconciliation for Segment Operating Income / Margin $ In millions 2013 2012 2011 2010 Total Segment Operating Income 1,772 $ 1,580 $ 1,248 $ 1,368 $ 917 $ Rationalizations (97) (58) (175) (103) (240) Interest expense (420) (392) (357) (330) (316) Other expense (227) (97) (139) (73) (186) Asset write-offs & accelerated depreciation (11) (23) (20) (50) (15) Corporate incentive compensation plans (98) (108) (69) (70) (71) Corporate pension curtailments/settlements (33) - 1 (15) - Intercompany profit elimination 5 4 (1) (5) (14) Retained expenses of divested operations (18) (24) (14) (29) (20) Other (54) (69) (34) (75) (47) Income before Income Taxes 819 $ 813 $ 440 $ 618 $ 8 $ United States and Foreign Taxes 170 138 203 201 172 Less: Minority Shareholders Net Income 91 46 25 74 52 Goodyear Net Income (Loss) 558 $ 629 $ 212 $ 343 $ (216) $ Sales $18,573 $19,540 $20,992 $22,767 $18,832 Return on Sales 3.0% 3.2% 1.0% 1.5% (1.1)% Total Segment Operating Margin 9.5% 8.1% 5.9% 6.0% 4.9% Twelve Months Ended December 31, Twelve Months Ended September 30, 2014 |
Reconciliation for Free Cash Flow From Operations 24 a) Working capital represents total changes in accounts receivable, inventories and accounts payable – trade. b) Pension expense is the net periodic pension cost before curtailments, settlements and termination benefits as reported in the pension-related note in the Notes to Consolidated Financial Statements. c) Other includes amortization and write-off of debt issuance costs, net pension curtailments and settlements, net rationalization charges, net (gains) losses on asset sales, net Venezuela currency remeasurement loss, customer prepayments and government grants, insurance proceeds, compensation and benefits less pension expense, other current liabilities, and other assets and liabilities. The amounts below are calculated from the Consolidated Statements of Cash Flows except for pension expense, which is as reported in the pension- related note in the Notes to Consolidated Financial Statements. Trailing Twelve Months Ended ($ in millions) Sept. 30, 2014 2013 2012 2011 2010 Net Income (Loss) 649 $ 675 $ 237 $ 417 $ (164) $ Depreciation and Amortization 736 722 687 715 652 Change in Working Capital (a) (50) 415 457 (650) 52 Pension Expense (b) 196 285 307 266 300 Other (c) 329 75 140 461 546 Capital Expenditures (1,068) (1,168) (1,127) (1,043) (944) Free Cash Flow from Operations (non-GAAP) 792 $ 1,004 $ 701 $ 166 $ 442 $ Capital Expenditures 1,068 1,168 1,127 1,043 944 Pension Contributions & Direct Payments (1,382) (1,162) (684) (294) (405) Rationalization Payments (181) (72) (106) (142) (57) Cash Flow from Operating Activities (GAAP) 297 $ 938 $ 1,038 $ 773 $ 924 $ Year Ended December 31, |
EBITDAP, Adjusted Debt & Leverage Ratio Reconciliations $ In millions a) Net periodic pension cost excludes curtailments/settlements and termination benefits. b) Other includes rationalization charges and other (income) and expense. 2013 2012 2011 2010 Net Income (Loss) $675 $237 $417 ($164) Interest Expense 392 357 330 316 Income Tax Expense 138 203 201 172 Depreciation and Amortization 722 687 715 652 Net Periodic Pension Cost (a) 285 307 266 300 Other (b) 155 314 176 426 EBITDAP, as adjusted $2,367 $2,105 $2,105 $1,702 2013 2012 2011 2010 Notes Payable and Overdrafts 14 102 256 238 Long Term Debt / Capital Leases due Within a Year 73 96 156 188 Long Term Debt and Capital Leases 6,162 4,888 4,789 4,319 Total Debt $6,249 $5,086 $5,201 $4,745 Unfunded Pension Liability $1,855 $3,522 $3,097 $2,549 Adjusted Debt $8,104 $8,608 $8,298 $7,294 Adjusted Debt/EBITDAP 3.42x 4.09x 3.94x 4.29x Year Ended December 31, |