Exhibit 99.2

2ndQuarter 2003
Analyst Conference
July 28, 2003
New York, NY
Forward-Looking Statements
Today’s discussion may include “forward-looking statements” within the meaning of the Private Securities Litigation Reform Act of 1995. Such statements relate to future events and expectations and involve known and unknown risks and uncertainties. Alcoa’s actual results or actions may differ materially from those projected in the forward-looking statements. For a summary of the specific risk factors that could cause results to differ materially from those expressed in the forward-looking statements, please refer to Alcoa’s Form 10-K for the year ended December 31, 2002, in addition to the Quarterly Report on Form 10-Q for the quarter ended June 30, 2003 filed with the Securities and Exchange Commission.

Richard B. Kelson
Executive VP and CFO
2ndQuarter Highlights
| n | | Continued world-class safety performance |
| n | | Income from continuing operations $ 0.27 per diluted share up from $0.23 in the first quarter |
| n | | Revenue growth over both prior- and year-ago quarters |
| n | | Sequential profitability increases in all downstream segments |
| n | | Strengthened balance sheet by generating $1.2 billion in cash |
2ndQuarter Highlights
| n | | Disciplined capital spending, a 33% reduction from prior-year period |
| n | | Working capital reduction with revenue increase |
| n | | Cost savings of $16 million, remain solidly on track toward the $1.0 billion cost challenge |
| n | | Divestiture of Assets held for Sale progressing well |
| | — | | First major sale (PET in Latin America) recently announced |
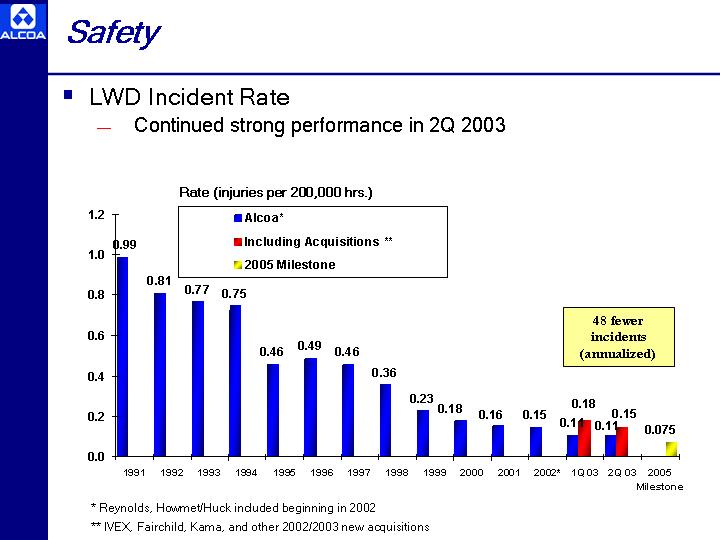
Safety
| | — | | Continued strong performance in 2Q 2003 |
[GRAPH]
* Reynolds, Howmet/Huck included beginning in 2002
** IVEX, Fairchild, Kama, and other 2002/2003 new acquisitions
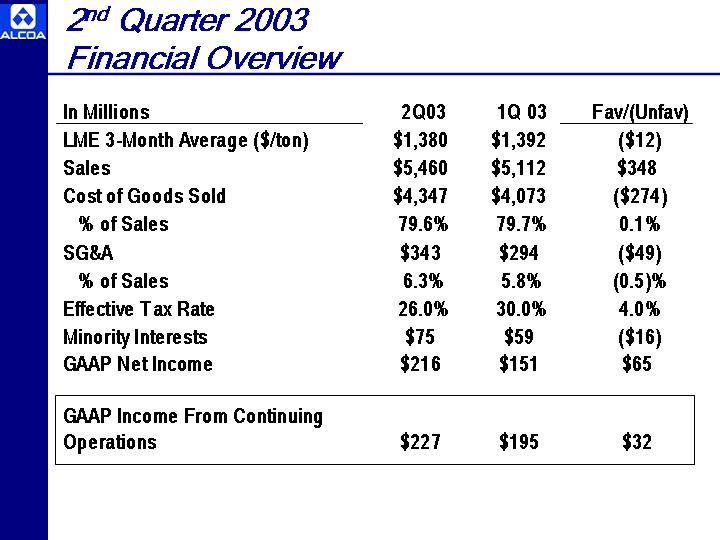
2ndQuarter 2003
Financial Overview
| In Millions | | 2Q03 | | 1Q 03 | | Fav/(Unfav) |
|
LME 3-Month Average ($/ton) | | $1,380 | | $1,392 | | ($12) |
Sales | | $5,460 | | $5,112 | | $348 |
Cost of Goods Sold | | $4,347 | | $4,073 | | ($274) |
% of Sales | | 79.6% | | 79.7% | | 0.1% |
SG&A | | $343 | | $294 | | ($49) |
% of Sales | | 6.3% | | 5.8% | | (0.5)% |
Effective Tax Rate | | 26.0% | | 30.0% | | 4.0% |
Minority Interests | | $75 | | $59 | | ($16) |
GAAP Net Income | | $216 | | $151 | | $65 |
GAAP Income From Continuing | | | | | | |
Operations | | $227 | | $195 | | $32 |
Significant Cash Generation…
| n | | Cash from operations of $1.2 billion in the quarter, up sequentially and year-over-year |
| | — | | Strongest cash flow since 4Q 2000, excluding forward metal sale |
| n | | Working capital reduction of $210 million sequentially, with revenue increase of $348 million |
| n | | Capital spending discipline, $401 million year to date, 29% year-over-year decline |
| | — | | $1 billion remains target for full year |
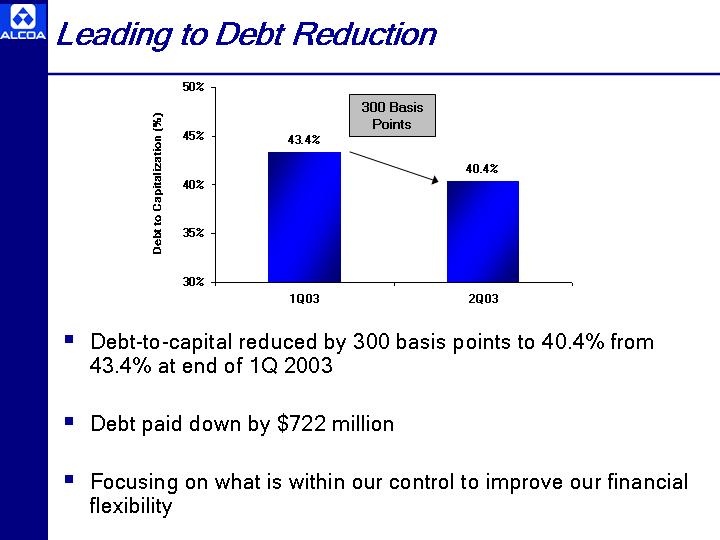
Leading to Debt Reduction
[GRAPH]
| n | | Debt-to-capital reduced by 300 basis points to 40.4% from 43.4% at end of 1Q 2003 |
| n | | Debt paid down by $722 million |
| n | | Focusing on what is within our control to improve our financial flexibility |
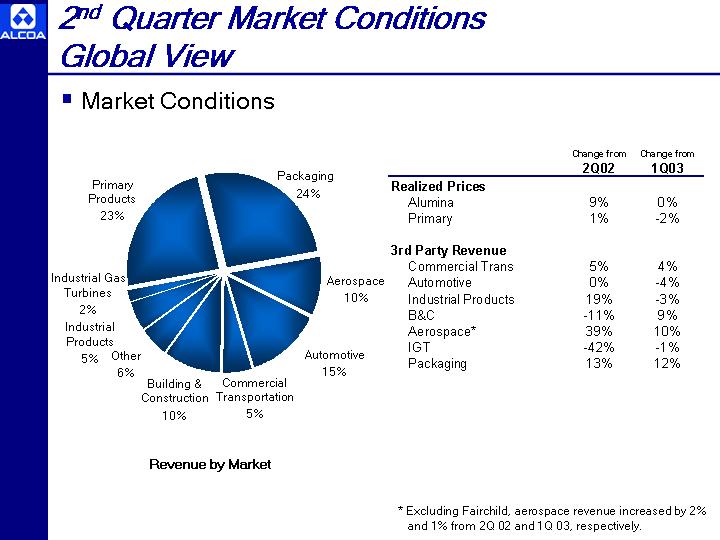
2ndQuarter Market Conditions Global View
[GRAPH]
| | | Change from
2Q02
| | | Change from
1Q03
| |
Realized Prices | | | | | | |
Alumina | | 9 | % | | 0 | % |
Primary | | 1 | % | | -2 | % |
3rd Party Revenue | | | | | | |
Commercial Trans | | 5 | % | | 4 | % |
Automotive | | 0 | % | | -4 | % |
Industrial Products | | 19 | % | | -3 | % |
B&C | | -11 | % | | 9 | % |
Aerospace* | | 39 | % | | 10 | % |
IGT | | -42 | % | | -1 | % |
Packaging | | 13 | % | | 12 | % |
| * | | Excluding Fairchild, aerospace revenue increased by 2% and 1% from 2Q 02 and 1Q 03, respectively. |
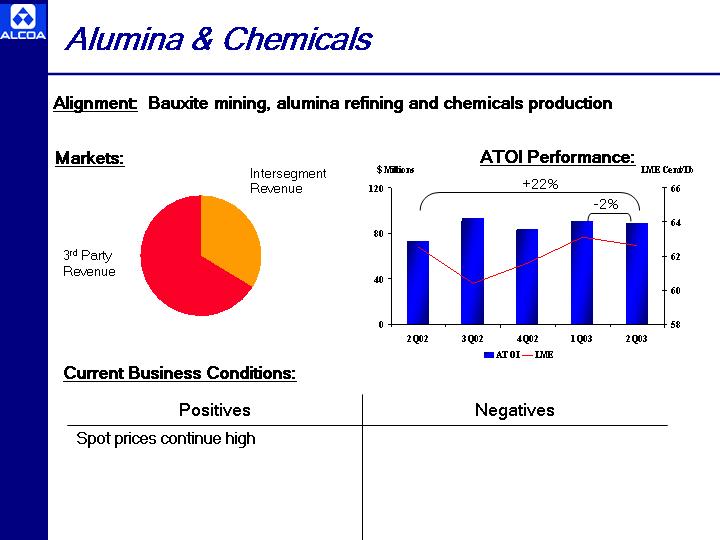
Alumina & Chemicals
Alignment: Bauxite mining, alumina refining and chemicals production
| Markets: | | ATOI Performance: |
| |
| [GRAPH] | | [GRAPH] |
Current Business Conditions:
Positives
| | Negatives
|
Spot prices continue high | | |
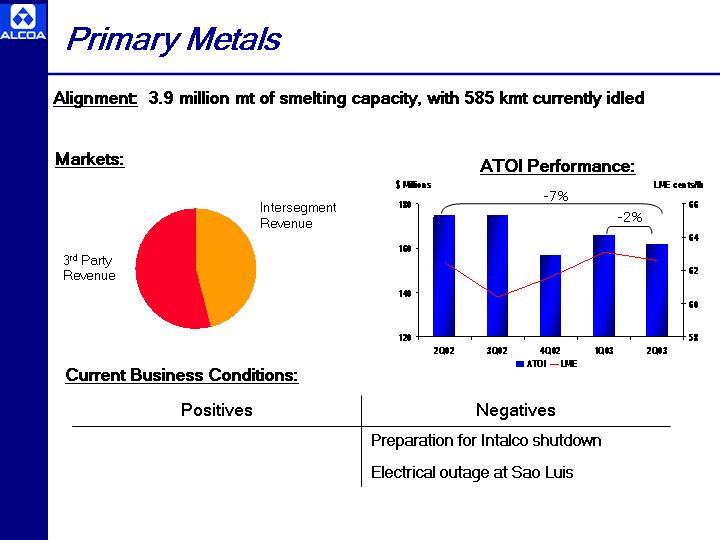
Primary Metals
Alignment: 3.9 million mt of smelting capacity, with 585 kmt currently idled
| Markets: | | ATOI Performance: |
| |
| [GRAPH] | | [GRAPH] |
Current Business Conditions:
Positivies
| | Negatives
|
| | | Preparation for Intalco shutdown |
| |
| | | Electrical outage at Sao Luis |
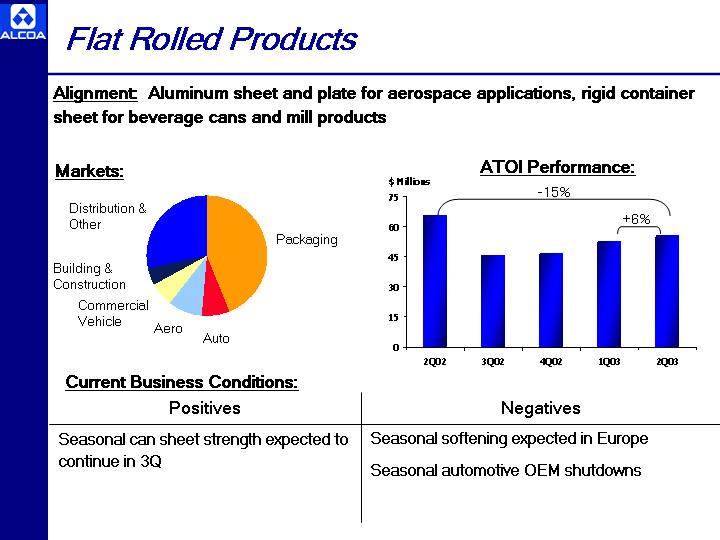
Flat Rolled Products
Alignment: Aluminum sheet and plate for aerospace applications, rigid container sheet for beverage cans and mill products
| Markets: | | ATOI Performance: |
| |
[GRAPH] | | [GRAPH] |
Current Business Conditions:
Positives
| | Negatives
|
| Seasonal can sheet strength expected to continue in 3Q | | Seasonal softening expected in Europe |
| |
| | | Seasonal automotive OEM shutdowns |
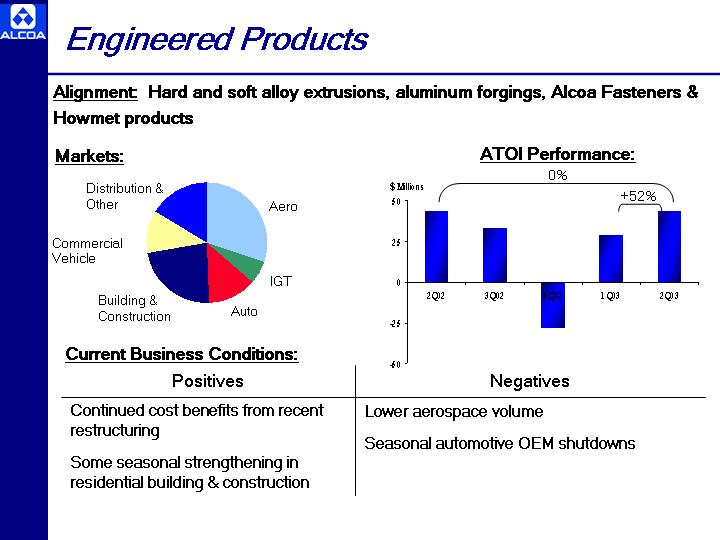
Engineered Products
Alignment: Hard and soft alloy extrusions, aluminum forgings, Alcoa Fasteners & Howmet products
| Markets: | | ATOI Performance: |
| |
[GRAPH] | | [GRAPH] |
Current Business Conditions:
Positives
| | Negatives
|
| Continued cost benefits from recent restructuring | | Lower aerospace volume |
| |
| Some seasonal strengthening in residential building & construction | | Seasonal automotive OEM shutdowns |
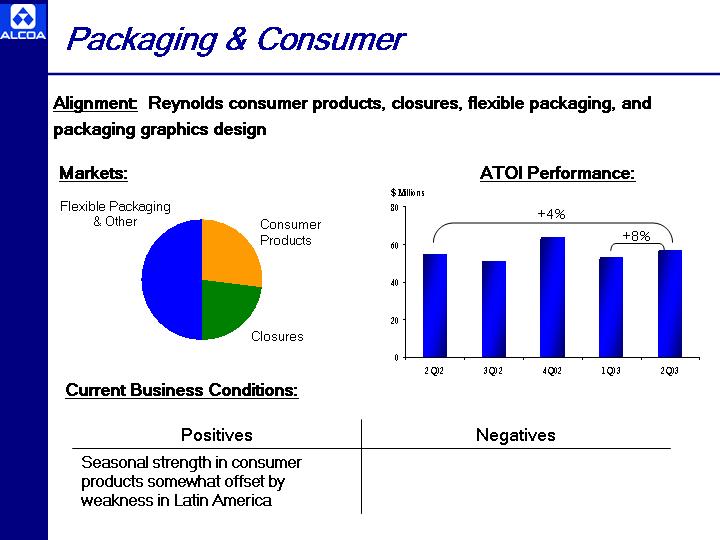
Packaging & Consumer
Alignment: Reynolds consumer products, closures, flexible packaging, and packaging graphics design
| Markets: | | ATOI Performance: |
| |
[GRAPH] | | [GRAPH] |
Current Business Conditions:
Positives
| | Negatives
|
| Seasonal strength in consumer products somewhat offset by weakness in Latin America | | |
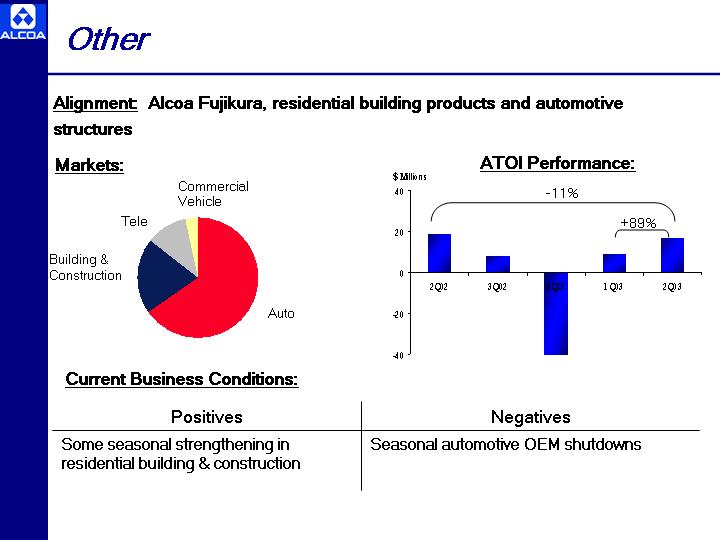
Other
Alignment: Alcoa Fujikura, residential building products and automotive structures
| Markets: | | ATOI Performance: |
| |
[GRAPH] | | [GRAPH] |
Current Business Conditions:
Positives
| | Negatives
|
| Some seasonal strengthening in residential building & construction | | Seasonal automotive OEM shutdowns |
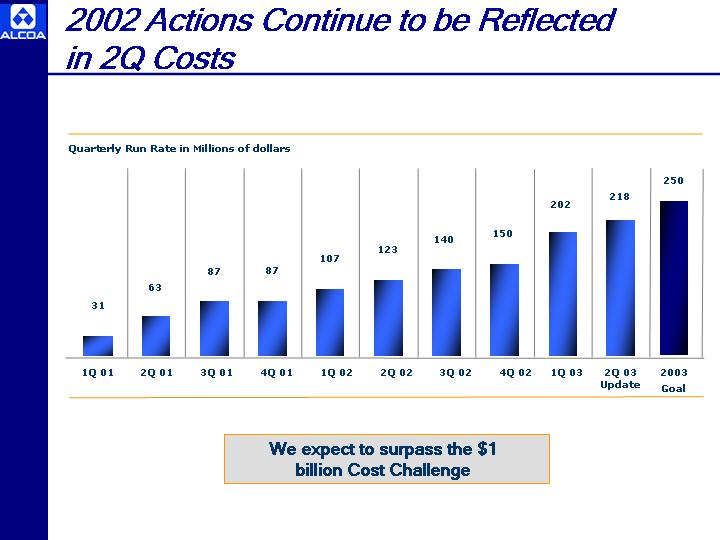
2002 Actions Continue to be Reflected in 2Q Costs
[GRAPH]
We expect to surpass the $1 billion Cost Challenge

Return on Capital
[GRAPH]
All indicators are based on the Bloomberg ROC Methodology.
1Q 03 Quarter Annualized ROC excludes $47 million after-tax cumulative effect of accounting change due to adoption of FAS 143.
Summary
Second quarter accomplishments are indicative of our focus going forward:
| | n | | Top-line growth and strong cash generation |
| | n | | Cost savings – driven by ABS |
| | n | | Working capital reduction |
| | n | | Disciplined capital expenditures |
| | n | | Balance sheet improvement |

Alain Belda
Chairman and CEO
First Half 2003 Achievements
| n | | We focused on cost, execution & capital discipline |
| | — | | Offsetting geopolitical issues, rising energy, health & welfare costs |
| n | | We managed the portfolio |
— Fairchild & Ivex integrations demonstrating significant progress
— First announcement of asset divestiture program
| n | | We continued to strengthen the balance sheet |
| | — | | Firmly on our way to attain our target capital structure |
In the 1H/03, Alcoa delivered on goals in a challenging environment
Two Examples of Actions Taken
US Smelting
| n | | 1.4 million mt of capacity, 8 locations |
| n | | Competitive average power cost, $22/Mwh |
| n | | Staffing, the critical issue |
| | — | | Roadmap to $120/mt cost takeout progressing well |
| | — | | Achieved $50+/mt as of June 2003, across multiple plants and |
| | functions | | – balance rest of the year |
Howmet
| n | | Premier global investment casting supplier |
| n | | Impacted by IGT and aerospace market downturns |
| | — | | Roadmap to quintile performance defined |
Operating in the Current Business Environment
| n | | We have adjusted to the slow global economy |
| n | | Offsetting the challenging business conditions with cost controls and the benefits from last year’s restructuring initiatives |
| n | | Dealing with aluminum industry dynamics |
Our Top Priorities
| n | | Long-term value creation |
| | — | | Values are our foundation |
| | — | | Cost control, capital discipline, customers – ABS is how we do business |
| n | | Deliver on our short term goals |
| | — | | Successful integrationand asset divestitures |
| n | | Excel under any market conditions |
| | — | | Slow, uneven growth in the U.S. |
| | — | | Lingering weakness in Europe, Latin America, Asia |
| | — | | Multiple opportunities for profitable growth – they must meet our hurdles |
| | — | | Organic and Acquisitions |
| | — | | Outperform the competition and industrial peers |
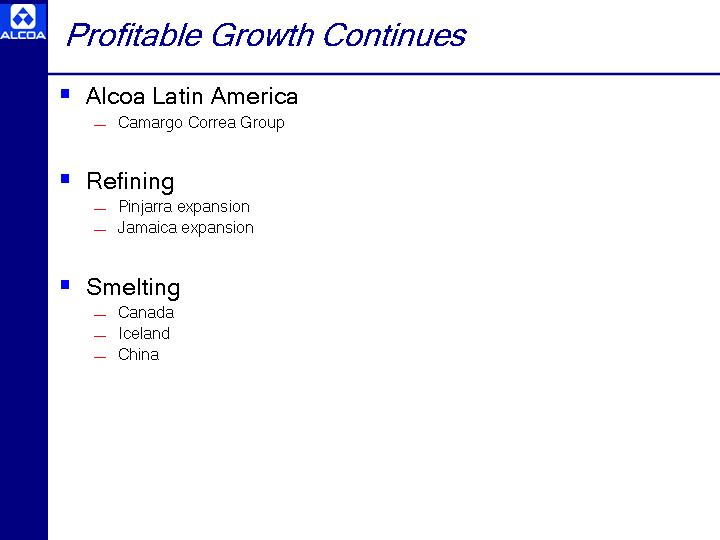
Profitable Growth Continues
The Road Ahead
| n | | We don’t expect the business environment to become easier, but we are poised to excel |
| n | | Focus is on positioning our portfolio and businesses for the long-term while achieving short term goals |
| n | | Continue to meet our priorities and long-term value creation |
For Additional Information, contact:
William F. Oplinger
Director, Investor Relations
Alcoa
390 Park Avenue
New York, N.Y. 10022-4608
Telephone: (212) 836-2674
Facsimile: (212) 836-2813
www.alcoa.com

Appendix
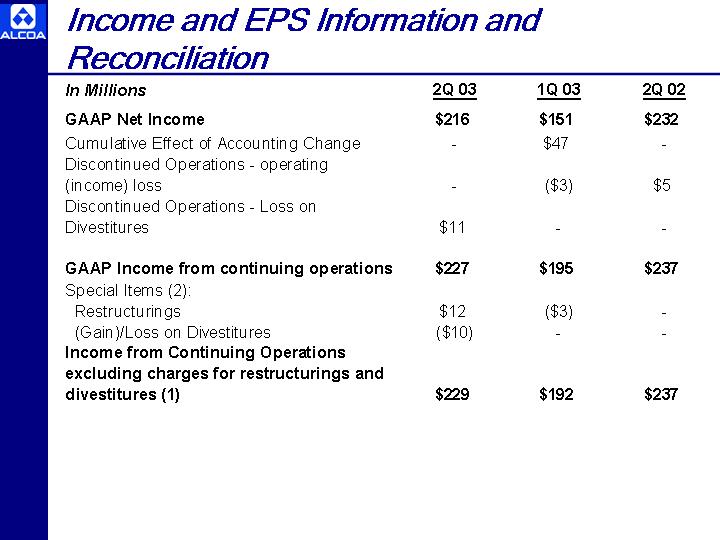
Income and EPS Information and Reconciliation
| In Millions | | 2Q 03
| | | 1Q 03
| | | 2Q 02
|
GAAP Net Income | | $ | 216 | | | $ | 151 | | | $ | 232 |
Cumulative Effect of Accounting Change | | | — | | | $ | 47 | | | | — |
Discontinued Operations—operating (income) loss | | | — | | | $ | (3 | ) | | $ | 5 |
Discontinued Operations—Loss on Divestitures | | $ | 11 | | | | — | | | | — |
GAAP Income from continuing operations | | $ | 227 | | | $ | 195 | | | $ | 237 |
Special Items (2): | | | | | | | | | | | |
Restructurings | | $ | 12 | | | $ | (3 | ) | | | — |
(Gain)/Loss on Divestitures | | $ | (10 | ) | | | — | | | | — |
Income from Continuing Operations excluding charges for restructurings and divestitures (1) | | $ | 229 | | | $ | 192 | | | $ | 237 |

Income and EPS Information and Reconciliation (Continued)
| In Millions | | 2Q 03
| | | 1Q 03
| | 2Q 02
|
GAAP Earnings per share | | $ | 0.26 | | | $ | 0.17 | | $ | 0.27 |
Cumulative Effect of Accounting Change | | | — | | | $ | 0.06 | | | — |
Discontinued Operations—operating (income) loss | | | — | | | | — | | $ | 0.01 |
Discontinued Operations—Loss on Divestitures | | $ | 0.01 | | | | — | | | — |
GAAP Earnings per share from continuing operations | | $ | 0.27 | | | $ | 0.23 | | $ | 0.28 |
Special Items: | | | | | | | | | | |
Restructurings | | $ | 0.01 | | | | — | | | — |
(Gain)/Loss on Divestitures | | $ | (0.01 | ) | | | — | | | — |
EPS from Continuing Operations excluding charges for restructurings and divestitures(1) | | $ | 0.27 | | | $ | 0.23 | | $ | 0.28 |
Avg. Shares Diluted Outstanding | | | 847 | | | | 846 | | | 852 |
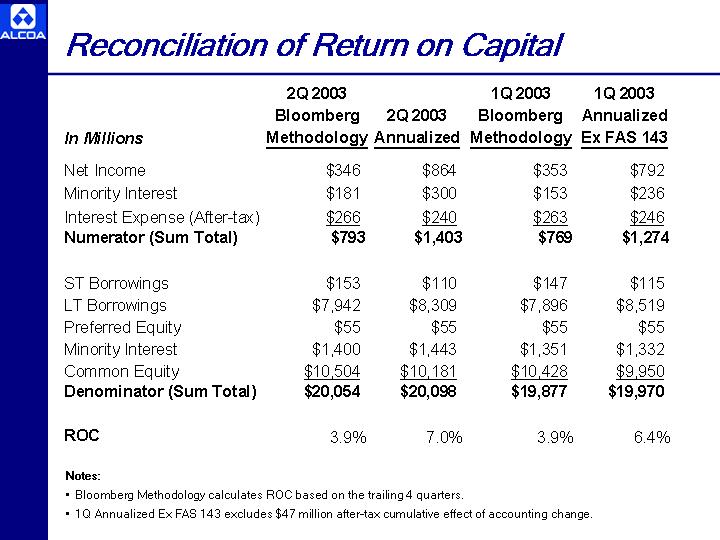
Reconciliation of Return on Capital
| In Millions | | 2Q 2003 Bloomberg
Methodology
| | | 2Q 2003
Annualized
| | | 1Q 2003 Bloomberg
Methodology
| | | 1Q 2003
Annualized
Ex FAS 143
| |
Net Income | | $ | 346 | | | $ | 864 | | | $ | 353 | | | $ | 792 | |
Minority Interest | | $ | 181 | | | $ | 300 | | | $ | 153 | | | $ | 236 | |
Interest Expense (After-tax) | | $ | 266 | | | $ | 240 | | | $ | 263 | | | $ | 246 | |
| | |
|
|
| |
|
|
| |
|
|
| |
|
|
|
Numerator (Sum Total) | | $ | 793 | | | $ | 1,403 | | | $ | 769 | | | $ | 1,274 | |
ST Borrowings | | $ | 153 | | | $ | 110 | | | $ | 147 | | | $ | 115 | |
LT Borrowings | | $ | 7,942 | | | $ | 8,309 | | | $ | 7,896 | | | $ | 8,519 | |
Preferred Equity | | $ | 55 | | | $ | 55 | | | $ | 55 | | | $ | 55 | |
Minority Interest | | $ | 1,400 | | | $ | 1,443 | | | $ | 1,351 | | | $ | 1,332 | |
Common Equity | | $ | 10,504 | | | $ | 10,181 | | | $ | 10,428 | | | $ | 9,950 | |
| | |
|
|
| |
|
|
| |
|
|
| |
|
|
|
Denominator (Sum Total) | | $ | 20,054 | | | $ | 20,098 | | | $ | 19,877 | | | $ | 19,970 | |
ROC | | | 3.9 | % | | | 7.0 | % | | | 3.9 | % | | | 6.4 | % |
Notes:
| • | | Bloomberg Methodology calculates ROC based on the trailing 4 quarters. |
| • | | 1Q Annualized Ex FAS 143 excludes $47 million after-tax cumulative effect of accounting change. |
Notes to Reconciliation
| (1) | | Alcoa believes that income from continuing operations excluding charges for restructurings and divestitures is a measure that should be presented in addition to income from continuing operations determined in accordance with GAAP. The following matters should be considered when evaluating this non-GAAP financial measure: |
| | — | | Alcoa reviews the operating results of its businesses excluding the impacts of restructurings and divestitures. Excluding the impacts of these charges can provide an additional basis of comparison. Management believes that these charges are unusual in nature, and would not be indicative of ongoing operating results. As a result, management believes these charges should be considered in order to compare past, current, and future periods. |
| | — | | The economic impacts of the restructuring and divestiture charges are described in the footnotes to Alcoa’s financial statements. Generally speaking, charges associated with restructurings include cash and non-cash charges and are the result of employee layoff, plant consolidation of assets, or plant closure costs. These actions are taken in order to achieve a lower cost base for future operating results. |
| | — | | Charges associated with divestitures principally represent adjustments to the carrying value of certain assets and liabilities and do not typically require a cash payment. These actions are taken primarily for strategic reasons as the company has decided not to participate in this portion of the portfolio of businesses. |
| | — | | Alcoa’s growth over the last five years, and the onset of the manufacturing recession led to the aforementioned charges in 2001 and 2002. Before the start of the current manufacturing recession, Alcoa last recorded charges associated with restructuring and divestitures in 1997. |
| | — | | Restructuring and divestiture charges are typically material and are considered to be outside the normal operations of a business. Corporate management is responsible for making decisions about restructurings and divestitures. |
| | — | | There can be no assurance that additional restructurings and divestitures will not occur in future periods. To compensate for this limitation, management believes that it is appropriate to consider both income from continuing operations determined under GAAP as well as income from continuing operations excluding restructuring and divestiture charges. |
| (2) | | Special items totaled $15 of income for the second quarter before taxes and minority interests. The amount is comprised of adjustments to the estimated proceeds on several businesses to be divested that resulted in net gains, and was offset by additional layoff charges primarily for businesses serving the aerospace and primary metals markets. After tax and minority interests, special items amounted to a loss of $2 in the quarter. |