EXHIBIT 99.2
1st Quarter 2004 Analyst Conference
April 22, 2004
New York, NY
Forward-Looking Statements
Today’s discussion may include “forward-looking statements” within the meaning of the Private Securities Litigation Reform Act of 1995. Such statements relate to future events and expectations and involve known and unknown risks and uncertainties. Alcoa’s actual results or actions may differ materially from those projected in the forward-looking statements. For a summary of the specific risk factors that could cause results to differ materially from those expressed in the forward-looking statements, please refer to Alcoa’s Form 10-K for the year ended December 31, 2003 filed with the Securities and Exchange Commission.

Richard B. Kelson
Executive Vice President Chief Financial Officer

1st Quarter Highlights
?Highest level of revenue since 2Q 2001
COGS sequential improvement to less than 78% of sales
?Income from operations up sequentially and year-over-year
?5 out of 6 segments up on a year-over-year basis
?Continued ROC improvement to 8.7% annualized
1st Quarter Highlights (continued)
?Strong start toward new 2006 cost challenge ?
Continued disciplined capital spending ?
Substantial completion of the divestiture program
?Debt to capitalization ratio within target range
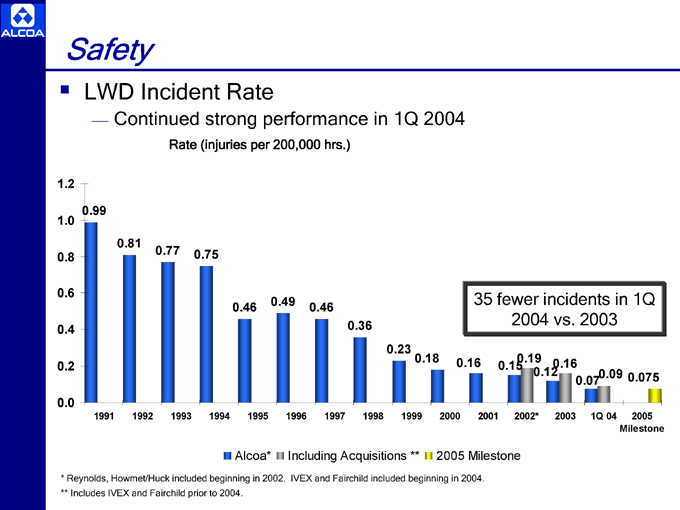
Safety
?LWD Incident Rate
??Continued strong performance in 1Q 2004
Rate (injuries per 200,000 hrs.)
fewer incidents in 1Q
2004 vs. 2003
0.99
0.81
0.77 0.75
0.49 35
0.46 0.46
0.36
0.23
0.18 0.16 0.19 0.16
0.15 0.12 0.09 0.075
0.07
1991 1992 1993 1994 1995 1996 1997 1998 1999 2000 2001 2002* 2003 1Q 04 2005
Milestone
Alcoa* Including Acquisitions ** 2005 Milestone
* Reynolds, Howmet/Huck included beginning in 2002. IVEX and Fairchild included beginning in 2004. ** Includes IVEX and Fairchild prior to 2004.
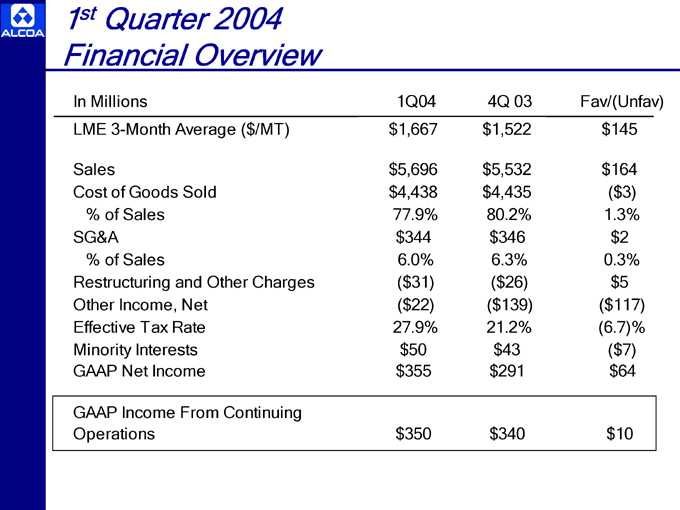
1st Quarter 2004 Financial Overview
In Millions 1Q04 4Q 03 Fav/(Unfav)
LME 3-Month Average ($/MT) $ 1,667 $ 1,522 $ 145
Sales $ 5,696 $ 5,532 $ 164
Cost of Goods Sold $ 4,438 $ 4,435 ($ 3)
% of Sales 77.9% 80.2% 1.3%
SG&A $ 344 $ 346 $ 2
% of Sales 6.0% 6.3% 0.3%
Restructuring and Other Charges ($ 31) ($ 26) $ 5
Other Income, Net ($ 22) ($ 139) ($ 117)
Effective Tax Rate 27.9% 21.2% (6.7)%
Minority Interests $ 50 $ 43 ($ 7)
GAAP Net Income $ 355 $ 291 $ 64
GAAP Income From Continuing
Operations $ 350 $ 340 $ 10
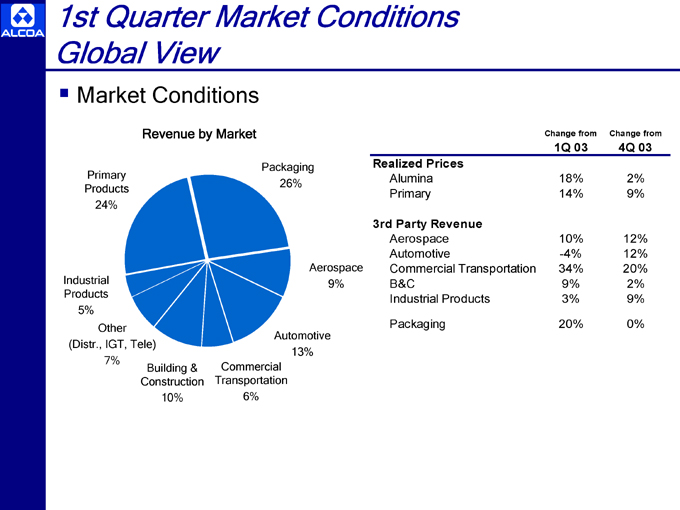
1st Quarter Market Conditions Global View
?Market Conditions
Revenue by Market
Primary Products 24%
Industrial Products 5%
Other (Distr., IGT, Tele) 7%
Building & Construction 10%
Commercial Transportation 6%
Packaging 26%
Aerospace 9%
Automotive 13%
Change from Change from
1Q 03 4Q 03
Realized Prices
Alumina 18% 2%
Primary 14% 9%
3rd Party Revenue
Aerospace 10% 12%
Automotive -4% 12%
Commercial Transportation 34% 20%
B&C 9% 2%
Industrial Products 3% 9%
Packaging 20% 0%
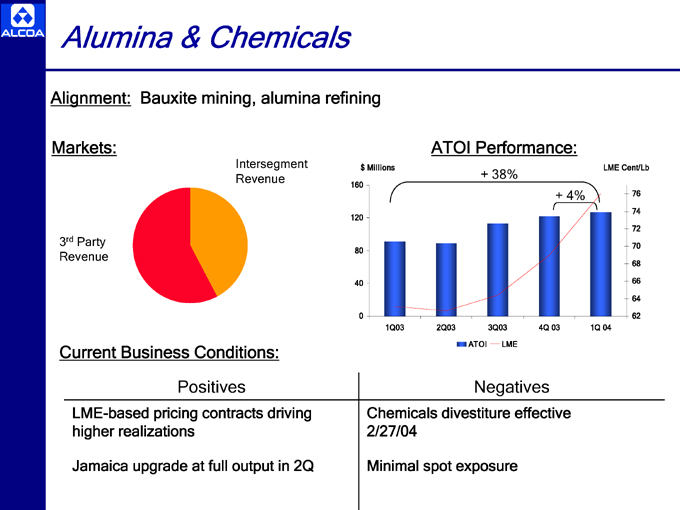
Alumina & Chemicals
Alignment: Bauxite mining, alumina refining
Markets:
Intersegment Revenue
3rd Party Revenue
ATOI Performance:
+ 38% LME
+ 4%
1Q03 2Q03 3Q03 4Q 03 1Q 04
ATOI LME
Current Business Conditions:
Positives
LME-based pricing contracts driving higher realizations
Jamaica upgrade at full output in 2Q
Negatives
Chemicals divestiture effective 2/27/04
Minimal spot exposure
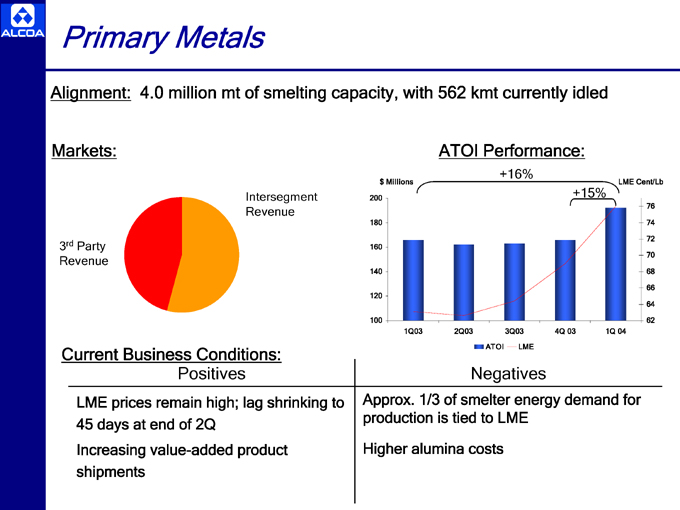
Primary Metals
Alignment: 4.0 million mt of smelting capacity, with 562 kmt currently idled
Markets:
Intersegment Revenue
3rd Party Revenue
ATOI Performance:
+16%
$ Millions LME Cent/Lb
200 +15%
76
180 74
72
160
70
140 68
66
120
64
100 62
1Q03 2Q03 3Q03 4Q 03 1Q 04
ATOI LME
Current Business Conditions: Positives
LME prices remain high; lag shrinking to 45 days at end of 2Q
Increasing value-added product shipments
Negatives
Approx. 1/3 of smelter energy demand for production is tied to LME
Higher alumina costs
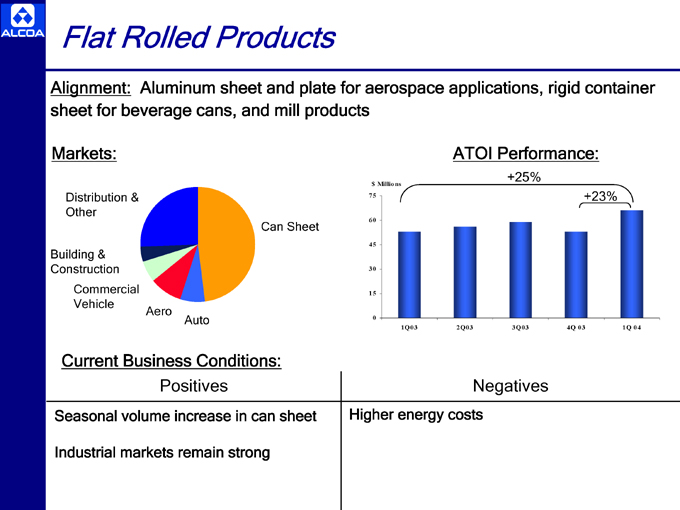
Flat Rolled Products
Alignment: Aluminum sheet and plate for aerospace applications, rigid container sheet for beverage cans, and mill products
Markets:
Distribution & Other
Building & Construction
Commercial Vehicle
Aero
Auto
Can Sheet
ATOI Performance:
+25%
$ Millions
75 +23%
60
45
30
15
0
1Q03 2Q03 3Q03 4Q 03 1Q 04
Current Business Conditions: Positives
Seasonal volume increase in can sheet
Industrial markets remain strong
Negatives
Higher energy costs
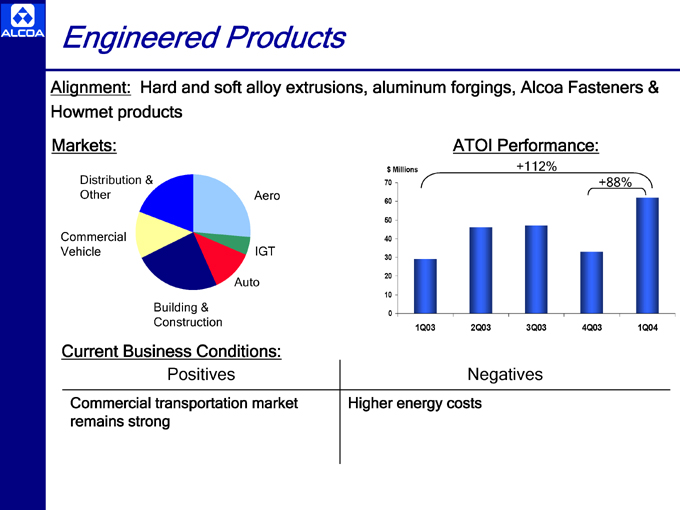
Engineered Products
Alignment: Hard and soft alloy extrusions, aluminum forgings, Alcoa Fasteners & Howmet products
Markets:
Distribution & Other
Commercial Vehicle
Building & Construction
Auto
IGT
Aero
ATOI Performance:
$ Millions +112%
70 +88%
60
50
40
30
20
10
0
1Q03 2Q03 3Q03 4Q03 1Q04
Current Business Conditions: Positives
Commercial transportation market remains strong
Negatives
Higher energy costs
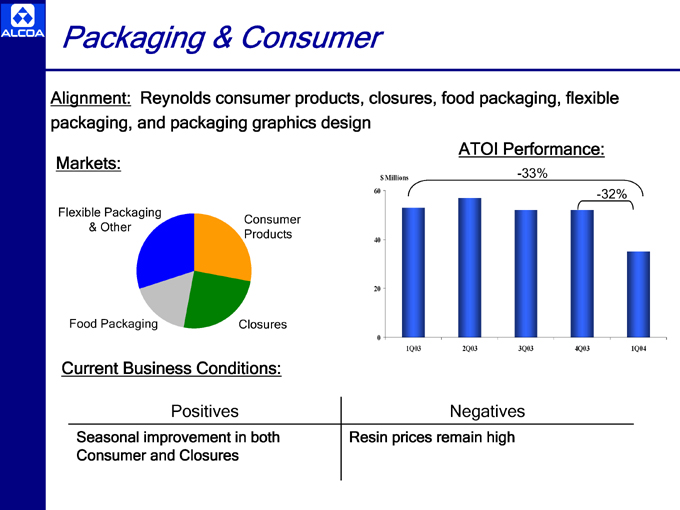
Packaging & Consumer
Alignment: Reynolds consumer products, closures, food packaging, flexible packaging, and packaging graphics design
Markets:
Flexible Packaging & Other
Food Packaging
Consumer Products
Closures
ATOI Performance:
$ Millions -33%
60 -32%
40
20
0
1Q03 2Q03 3Q03 4Q03 1Q04
Current Business Conditions:
Positives
Seasonal improvement in both Consumer and Closures
Negatives
Resin prices remain high
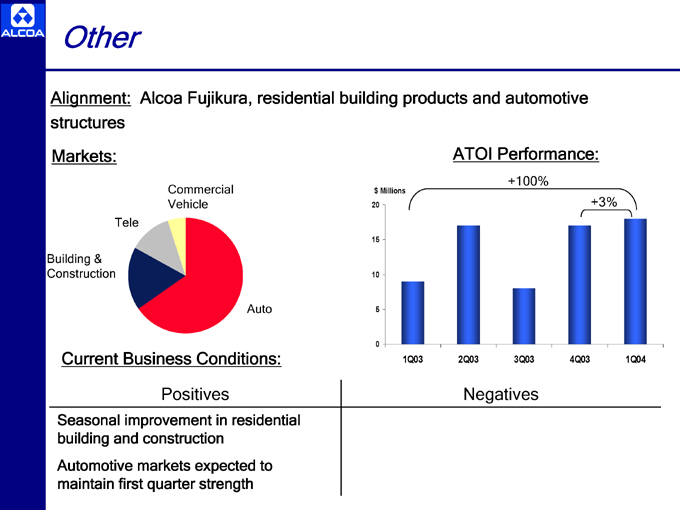
Other
Alignment: Alcoa Fujikura, residential building products and automotive structures
Markets:
Tele
Building & Construction
Auto
Commercial Vehicle
ATOI Performance:
+100%
$ Millions
20 +3%
15
10
5
0
1Q03 2Q03 3Q03 4Q03 1Q04
Current Business Conditions:
Positives
Seasonal improvement in residential building and construction Automotive markets expected to maintain first quarter strength
Negatives
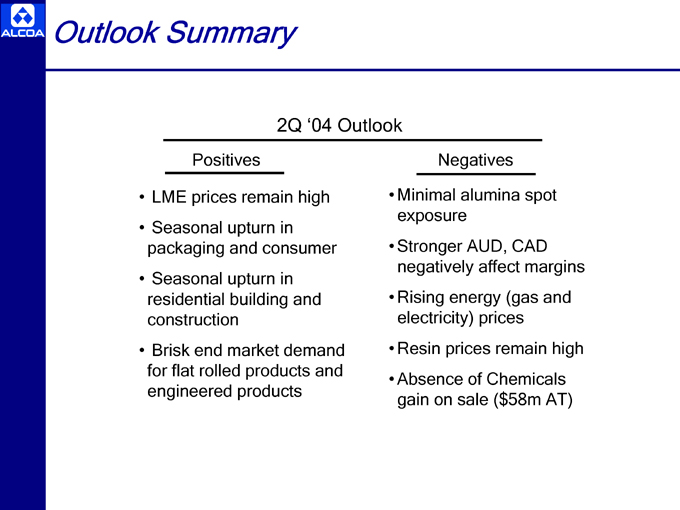
Outlook Summary
2Q ‘04 Outlook
Positives
• LME prices remain high
• Seasonal upturn in packaging and consumer
• Seasonal upturn in residential building and construction
• Brisk end market demand for flat rolled products and engineered products
Negatives
• Minimal alumina spot exposure
• Stronger AUD, CAD negatively affect margins
• Rising energy (gas and electricity) prices
• Resin prices remain high
• Absence of Chemicals gain on sale ($58m AT)
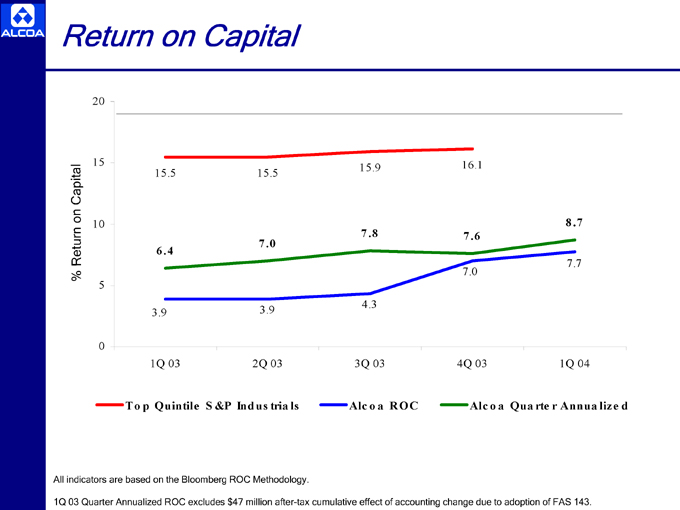
15.9 16.1
15.5 15.5
8.7
7.8 7.6
7.0
6.4
7.7
7.0
4.3
3.9 3.9
1Q 03 2Q 03 3Q 03 4Q 03 1Q 04
To p Quintile S &P Ind us tria ls Alc o a ROC Alc o a Qua rte r Annua lize d
All indicators are based on the Bloomberg ROC Methodology.
1Q 03 Quarter Annualized ROC excludes $47 million after-tax cumulative effect of accounting change due to adoption of FAS 143.
Bernt Reitan
Executive Vice President – Alcoa Group President, Primary Products
Agenda
?Biography
?Alumina and Smelting Operations
??Safety
??Customer Value
??Manufacturing Excellence
?Market Outlook
?Growth Opportunities
Biography – Bernt Reitan
?1980 – 2000 (Elkem ASA)
??1987 – 1988 Senior VP Materials and Technology
??1988 – 2000 Managing Director – Elkem Aluminium ANS
?2000 – Present (Alcoa Inc.)
??2000 President – Alcoa World Chemical
??2001 President – AWAC
??2003 President – Alcoa Primary Metals
??2004 Current Position
?Service on Industry Association Boards
??International Aluminium Institute
??European Aluminium Association
??Norwegian Metallurgical Industry Association
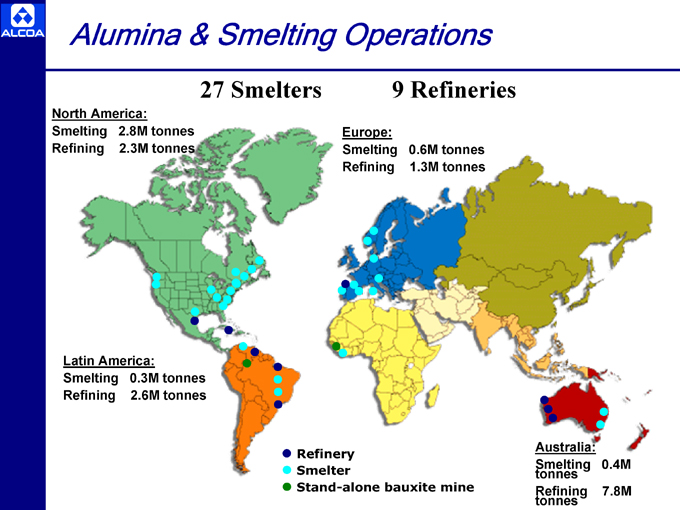
Alumina & Smelting
Operations
27 Smelters 9 Refineries
North America: Smelting 2.8M tonnes Refining 2.3M tonnes
Latin America: Smelting 0.3M tonnes
Refining 2.6M tonnes
Europe:
Smelting 0.6M tonnes
Refining 1.3M tonnes
Refinery Smelter
Stand-alone bauxite mine
Australia:
Smelting 0.4M
tonnes
Refining 7.8M
tonnes

Safety
(per 200,000 hours)
Lost Work Day Frequency Rate
0.19
0.14
0.11
0.10
2001 2002 2003 2004Q1
OSHA Recordable Frequency Rate
4.4
2.7
2.2
1.9
2001 2002 2003 2004Q1
Alcoa Primary Products Business Model
?Maximize Value-Added Products for Customers
Operational Excellence
?Growth
??Creep capacity
??Brownfield expansions
??Greenfield expansions
??Joint ventures and partnerships
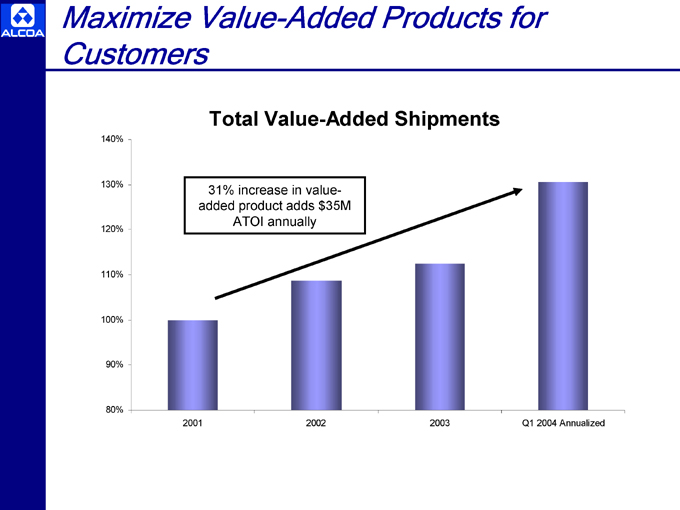
Maximize Value-Added Products for Customers
Total Value-Added Shipments
31% increase in value-added product adds $35M ATOI annually
2001 2002 2003 Q1 2004 Annualized
Operational Excellence via ABS
Accelerate improvement through best practice sharing
??Like-technology teams (LTT) in smelting
??Manufacturing and Technology (M&T) Council in refining
?Power of Comparisons Across the System
??Productivity ??Energy consumption efficiencies??Current efficiencies ??Maintenance systems??Yield ??Pot life
?Standardize best practices
?Revolving 30-60-90-day plans
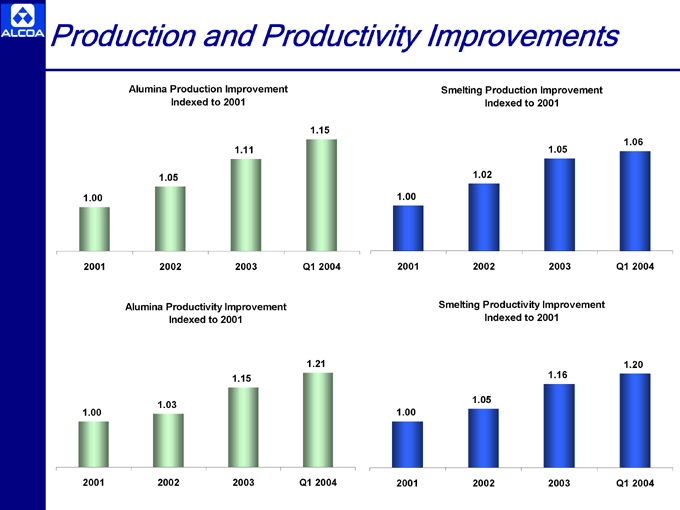
Production and Productivity Improvements
Alumina Production Improvement Indexed to 2001
1.15
1.11
1.05
1.00
2001 2002 2003 Q1 2004
Alumina Productivity Improvement Indexed to 2001
1.21
1.15
1.03
1.00
2001 2002 2003 Q1 2004
Smelting Production Improvement Indexed to 2001
1.06
1.05
1.02
1.00
2001 2002 2003 Q1 2004
Smelting Productivity Improvement Indexed to 2001
1.20
1.16
1.05
1.00
2001 2002 2003 Q1 2004
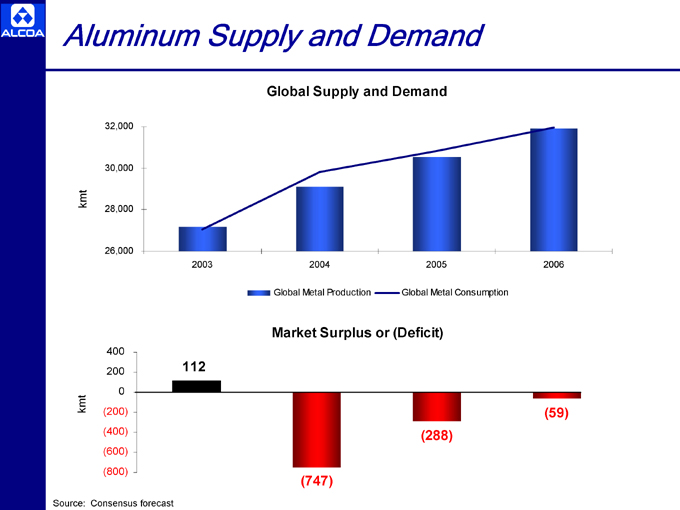
Aluminum Supply and Demand
Global Supply and Demand
2003 2004 2005 2006
Global Metal Production Global Metal Consumption
Market Surplus or (Deficit)
112
(59)
(288)
(747)
Source: Consensus forecast
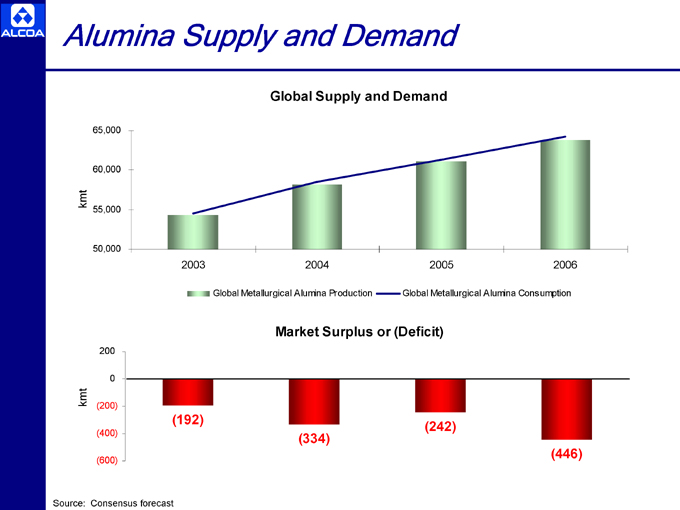
Alumina Supply and Demand
Global Supply and Demand
2003 2004 2005 2006
Global Metallurgical Alumina Production Global Metallurgical Alumina Consumption
(192)
(242)
(334)
(446)
Source: Consensus forecast
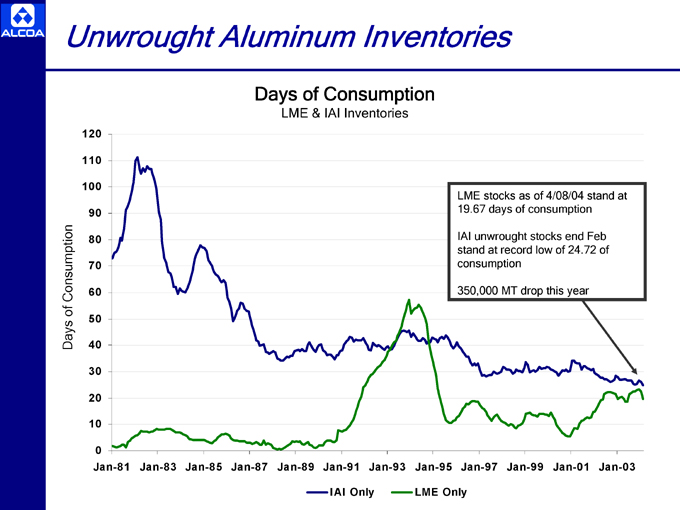
Unwrought Aluminum Inventories
Days of Consumption
LME & IAI Inventories
LME stocks as of 4/08/04 stand at 19.67 days of consumption
IAI unwrought stocks end Feb stand at record low of 24.72 of consumption
350,000 MT drop this year
Jan-81 Jan-83 Jan-85 Jan-87 Jan-89 Jan-91 Jan-93 Jan-95 Jan-97 Jan-99 Jan-01 Jan-03
IAI Only LME Only
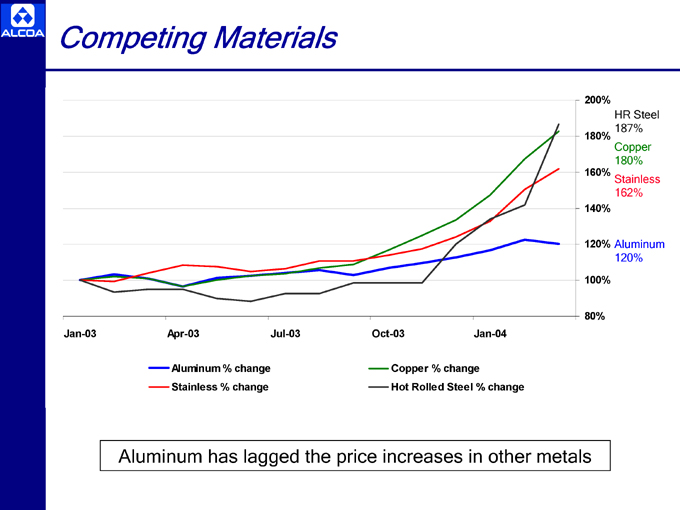
Jan-03 Apr-03 Jul-03 Oct-03 Jan-04
HR Steel 187% Copper 180% Stainless 162%
Aluminum 120%
Aluminum % change Copper % change
Stainless % change Hot Rolled Steel % change
Aluminum has lagged the price increases in other metals
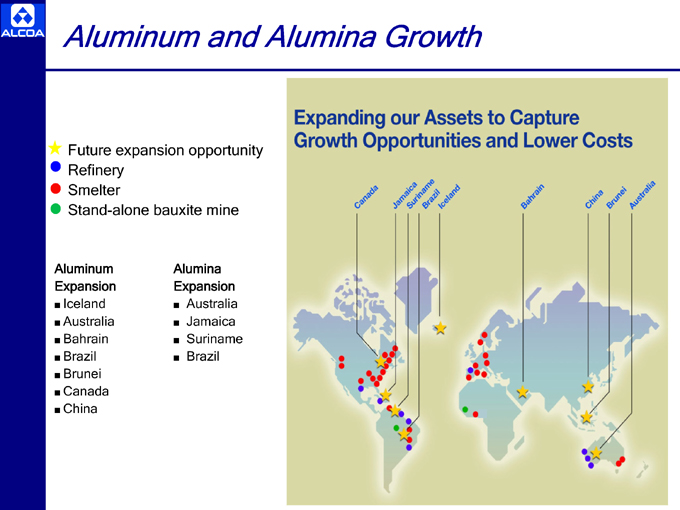
Aluminum and Alumina Growth
Future expansion opportunity Refinery Smelter Stand-alone bauxite mine
Aluminum Expansion
? Iceland
? Australia
? Bahrain
? Brazil
? Brunei
? Canada
? China
Alumina Expansion
? Australia
? Jamaica
? Suriname
? Brazil
For Additional Information, contact:
William F. Oplinger Director, Investor Relations
Alcoa
390 Park Avenue
New York, N.Y. 10022-4608 Telephone: (212) 836-2674 Facsimile: (212) 836-2813 www.alcoa.com

Appendix
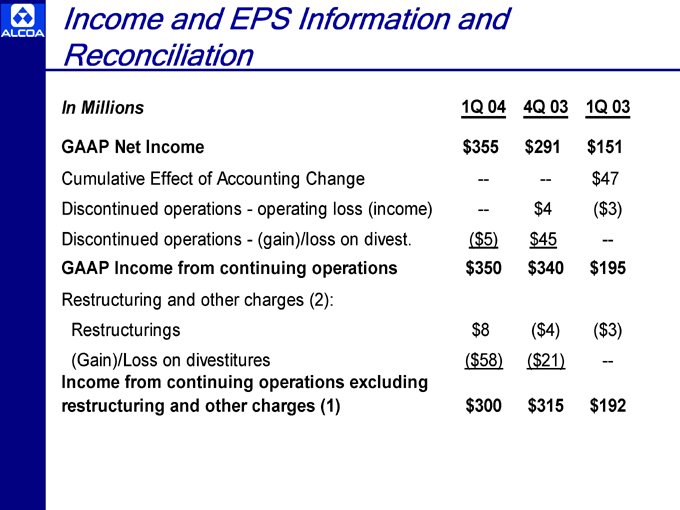
Income and EPS Information and Reconciliation
In Millions 1Q 04 4Q 03 1Q 03
GAAP Net Income $ 355 $ 291 $ 151
Cumulative Effect of Accounting Change — — $ 47
Discontinued operations—operating loss (income) — $ 4 ($ 3)
Discontinued operations—(gain)/loss on divest. ($ 5) $ 45 —
GAAP Income from continuing operations $ 350 $ 340 $ 195
Restructuring and other charges (2):
Restructurings $ 8 ($ 4) ($ 3)
(Gain)/Loss on divestitures ($ 58) ($ 21) —
Income from continuing operations excluding
restructuring and other charges (1) $ 300 $ 315 $ 192
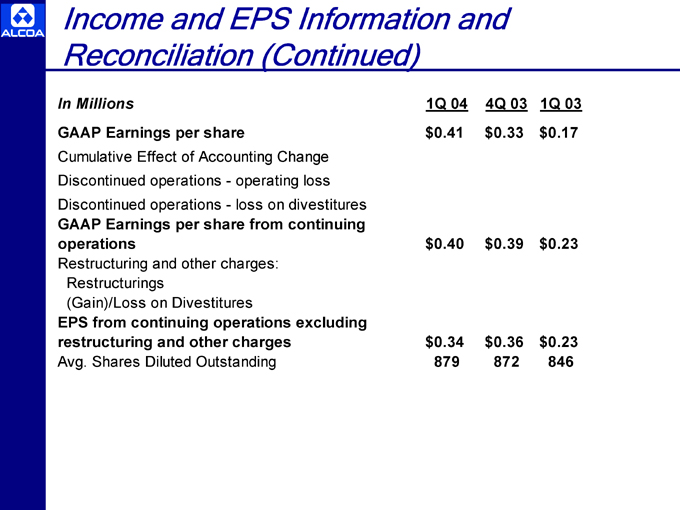
Income and EPS Information and Reconciliation (Continued)
In Millions 1Q 04 4Q 03 1Q 03
GAAP Earnings per share $ 0.41 $ 0.33 $ 0.17
Cumulative Effect of Accounting Change
Discontinued operations—operating loss
Discontinued operations—loss on divestitures
GAAP Earnings per share from continuing
operations $ 0.40 $ 0.39 $ 0.23
Restructuring and other charges:
Restructurings
(Gain)/Loss on Divestitures
EPS from continuing operations excluding
restructuring and other charges $ 0.34 $ 0.36 $ 0.23
Avg. Shares Diluted Outstanding 879 872 846
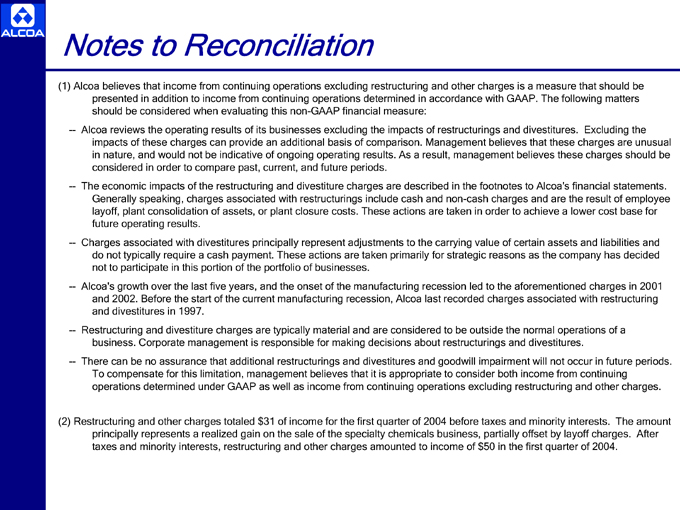
Notes to Reconciliation
(1) Alcoa believes that income from continuing operations excluding restructuring and other charges is a measure that should be presented in addition to income from continuing operations determined in accordance with GAAP. The following matters should be considered when evaluating this non-GAAP financial measure:
— Alcoa reviews the operating results of its businesses excluding the impacts of restructurings and divestitures. Excluding the impacts of these charges can provide an additional basis of comparison. Management believes that these charges are unusual in nature, and would not be indicative of ongoing operating results. As a result, management believes these charges should be considered in order to compare past, current, and future periods.
— The economic impacts of the restructuring and divestiture charges are described in the footnotes to Alcoa’s financial statements. Generally speaking, charges associated with restructurings include cash and non-cash charges and are the result of employee layoff, plant consolidation of assets, or plant closure costs. These actions are taken in order to achieve a lower cost base for future operating results.
— Charges associated with divestitures principally represent adjustments to the carrying value of certain assets and liabilities and do not typically require a cash payment. These actions are taken primarily for strategic reasons as the company has decided not to participate in this portion of the portfolio of businesses.
— Alcoa’s growth over the last five years, and the onset of the manufacturing recession led to the aforementioned charges in 2001 and 2002. Before the start of the current manufacturing recession, Alcoa last recorded charges associated with restructuring and divestitures in 1997.
— Restructuring and divestiture charges are typically material and are considered to be outside the normal operations of a business. Corporate management is responsible for making decisions about restructurings and divestitures.
— There can be no assurance that additional restructurings and divestitures and goodwill impairment will not occur in future periods. To compensate for this limitation, management believes that it is appropriate to consider both income from continuing operations determined under GAAP as well as income from continuing operations excluding restructuring and other charges.
(2) Restructuring and other charges totaled $31 of income for the first quarter of 2004 before taxes and minority interests. The amount principally represents a realized gain on the sale of the specialty chemicals business, partially offset by layoff charges. After taxes and minority interests, restructuring and other charges amounted to income of $50 in the first quarter of 2004.
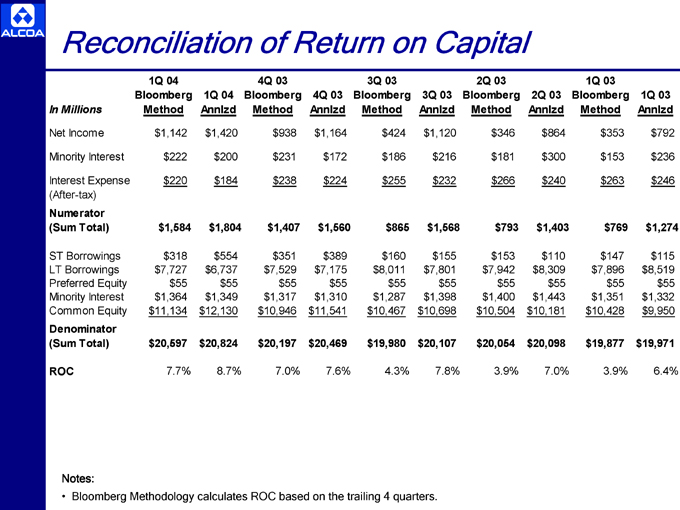
Reconciliation of Return on Capital
1Q 04 4Q 03 3Q 03 2Q 03 1Q 03
Bloomberg 1Q 04 Bloomberg 4Q 03 Bloomberg 3Q 03 Bloomberg 2Q 03 Bloomberg 1Q 03
In Millions Method Annlzd Method Annlzd Method Annlzd Method Annlzd Method Annlzd
Net Income $ 1,142 $ 1,420 $ 938 $ 1,164 $ 424 $ 1,120 $ 346 $ 864 $ 353 $ 792
Minority Interest $ 222 $ 200 $ 231 $ 172 $ 186 $ 216 $ 181 $ 300 $ 153 $ 236
Interest Expense $ 220 $ 184 $ 238 $ 224 $ 255 $ 232 $ 266 $ 240 $ 263 $ 246
(After-tax)
Numerator
(Sum Total) $ 1,584 $ 1,804 $ 1,407 $ 1,560 $ 865 $ 1,568 $ 793 $ 1,403 $ 769 $ 1,274
ST Borrowings $ 318 $ 554 $ 351 $ 389 $ 160 $ 155 $ 153 $ 110 $ 147 $ 115
LT Borrowings $ 7,727 $ 6,737 $ 7,529 $ 7,175 $ 8,011 $ 7,801 $ 7,942 $ 8,309 $ 7,896 $ 8,519
Preferred Equity $ 55 $ 55 $ 55 $ 55 $ 55 $ 55 $ 55 $ 55 $ 55 $ 55
Minority Interest $ 1,364 $ 1,349 $ 1,317 $ 1,310 $ 1,287 $ 1,398 $ 1,400 $ 1,443 $ 1,351 $ 1,332
Common Equity $ 11,134 $ 12,130 $ 10,946 $ 11,541 $ 10,467 $ 10,698 $ 10,504 $ 10,181 $ 10,428 $ 9,950
Denominator
(Sum Total) $ 20,597 $ 20,824 $ 20,197 $ 20,469 $ 19,980 $ 20,107 $ 20,054 $ 20,098 $ 19,877 $ 19,971
ROC 7.7% 8.7% 7.0% 7.6% 4.3% 7.8% 3.9% 7.0% 3.9% 6.4%
Notes:
• Bloomberg Methodology calculates ROC based on the trailing 4 quarters.