Exhibit 99.2
3rd Quarter 2004 Analyst Conference
October 7, 2004 New York, NY
Forward-Looking Statements
Today’s discussion may include “forward-looking statements” within the meaning of the Private Securities Litigation Reform Act of 1995. Such statements relate to future events and expectations and involve known and unknown risks and uncertainties. Alcoa’s actual results or actions may differ materially from those projected in the forward-looking statements. For a summary of the specific risk factors that could cause results to differ materially from those expressed in the forward-looking statements, please refer to Alcoa’s Form 10-K for the year ended December 31, 2003, in addition to the Quarterly Report on Form 10-Q for the quarter ended June 30, 2004 filed with the Securities and Exchange Commission.
2
Alain J. P. Belda
Chairman and Chief Executive Officer
Agenda
Reflections on third quarter performance
Continued strong market dynamics
Taking action on costs
4
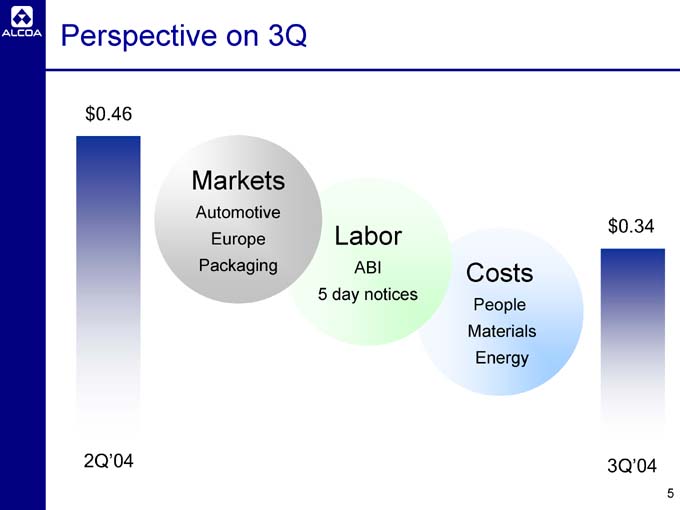
Perspective on 3Q
2Q’04 $0.46
Markets
Automotive Europe Packaging
Labor
ABI 5 day notices
Costs
People Materials Energy
3Q’04 $0.34
5
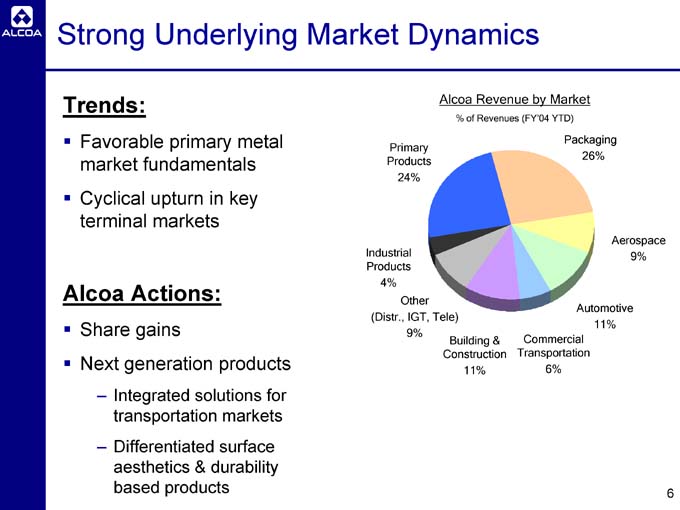
Strong Underlying Market Dynamics
Trends:
Favorable primary metal market fundamentals
Cyclical upturn in key terminal markets
Alcoa Actions:
Share gains
Next generation products
Integrated solutions for transportation markets
Differentiated surface aesthetics & durability based products
Alcoa Revenue by Market
% of Revenues (FY’04 YTD)
Packaging 26%
Aerospace 9%
Automotive 11%
Commercial Transportation 6%
Building & Construction 11%
Other (Distr., IGT, Tele) 9%
Industrial Products 4%
Primary Products 24%
6
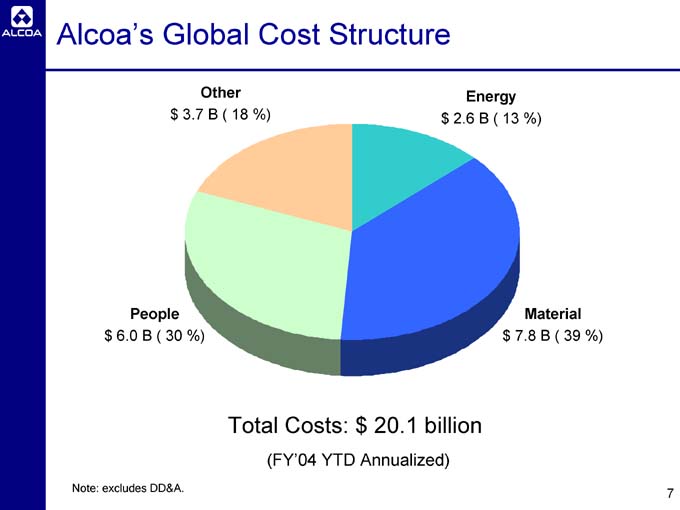
Alcoa’s Global Cost Structure
Other $3.7 B ( 18%)
Energy $2.6 B ( 13%)
Material $7.8 B ( 39%)
People $6.0 B ( 30%)
Total Costs: $20.1 billion
(FY’04 YTD Annualized)
Note: excludes DD&A.
7
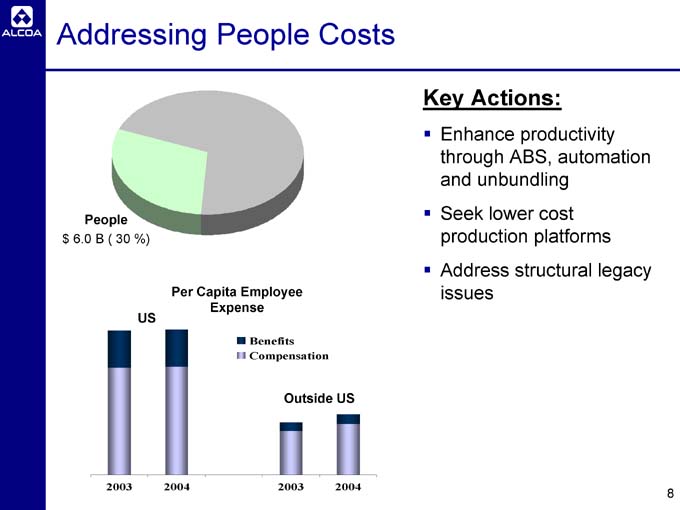
Addressing People Costs
People $6.0 B ( 30%)
Per Capita Employee Expense
US
2003 2004
Outside US
2003 2004
Benefits Compensation
Key Actions:
Enhance productivity through ABS, automation and unbundling
Seek lower cost production platforms
Address structural legacy issues
8
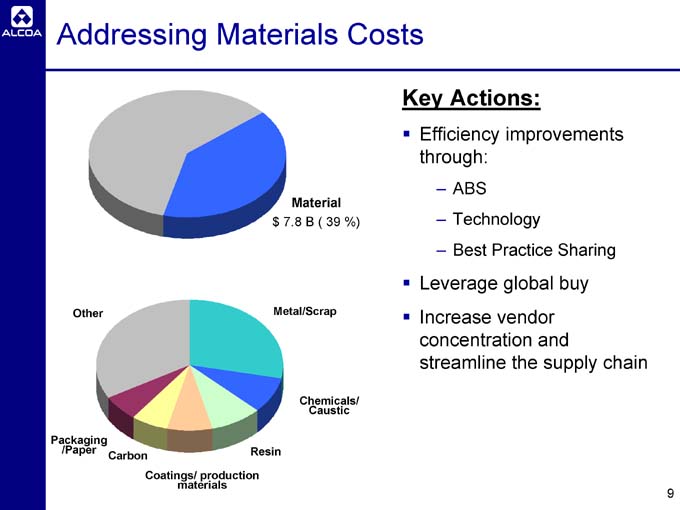
Addressing Materials Costs
Material $7.8 B ( 39%)
Other
Metal/Scrap
Chemicals/Caustic
Resin
Coatings/ production materials
Carbon
Packaging /Paper
Key Actions:
Efficiency improvements through:
ABS
Technology
Best Practice Sharing
Leverage global buy
Increase vendor concentration and streamline the supply chain
9
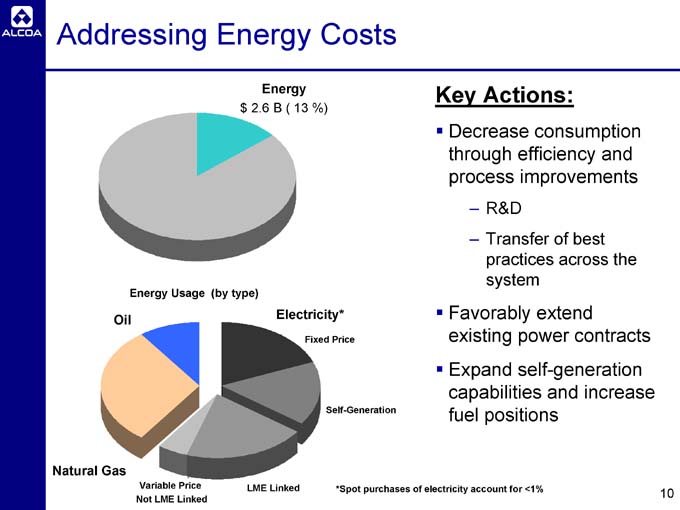
Addressing Energy Costs
Energy $2.6 B ( 13%)
Energy Usage (by type)
Oil
Electricity*
Fixed Price
Self-Generation
LME Linked
Variable Price Not LME Linked
Natural Gas
Key Actions:
Decrease consumption through efficiency and process improvements
R&D
Transfer of best practices across the system
Favorably extend existing power contracts
Expand self-generation capabilities and increase fuel positions
*Spot purchases of electricity account for <1%
10
Alcoa Today and Tomorrow
Fundamentals are better than they have been in many years
Significant growth opportunities exist
Many areas of engagement on costs
Continue to manage capital wisely
Confidently pursuing a winning, global strategy
11
Richard B. Kelson
Executive Vice President
Chief Financial Officer
3rd Quarter Overview
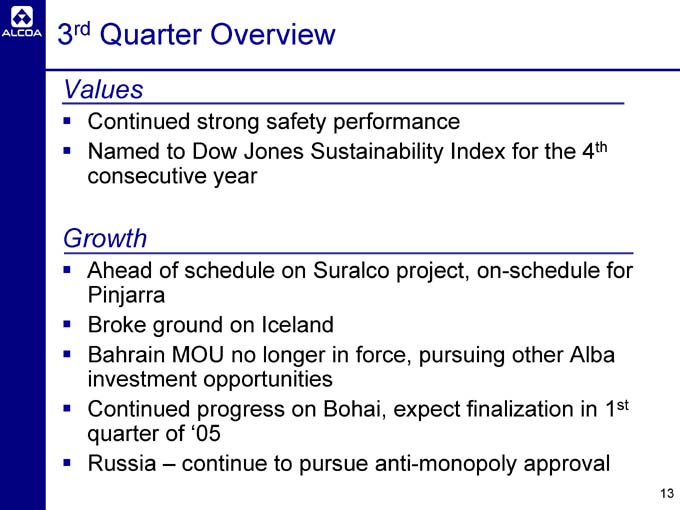
Values
Continued strong safety performance
Named to Dow Jones Sustainability Index for the 4th consecutive year
Growth
Ahead of schedule on Suralco project, on-schedule for Pinjarra
Broke ground on Iceland
Bahrain MOU no longer in force, pursuing other Alba investment opportunities
Continued progress on Bohai, expect finalization in 1st quarter of ‘05
Russia – continue to pursue anti-monopoly approval
13
3rd Quarter Overview
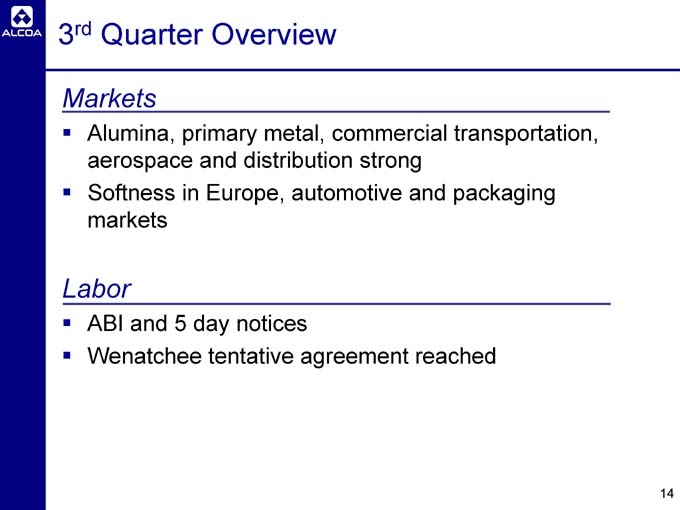
Markets
Alumina, primary metal, commercial transportation, aerospace and distribution strong
Softness in Europe, automotive and packaging markets
Labor
ABI and 5 day notices
Wenatchee tentative agreement reached
14
3rd Quarter Overview
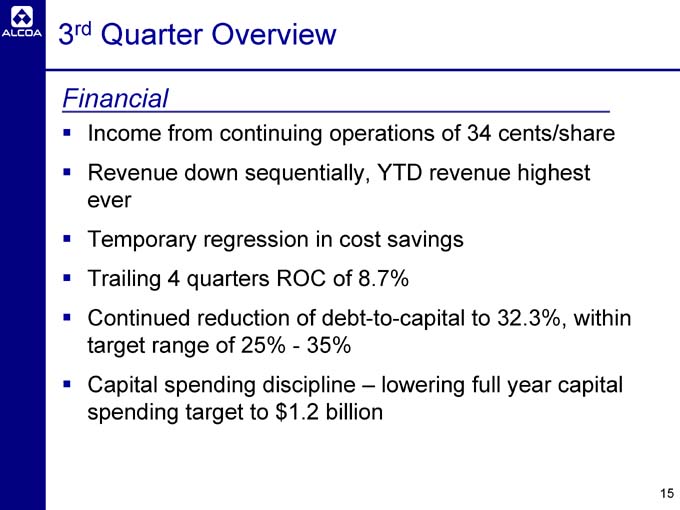
Financial
Income from continuing operations of 34 cents/share
Revenue down sequentially, YTD revenue highest ever
Temporary regression in cost savings
Trailing 4 quarters ROC of 8.7%
Continued reduction of debt-to-capital to 32.3%, within target range of 25%—35%
Capital spending discipline – lowering full year capital spending target to $1.2 billion
15
Safety
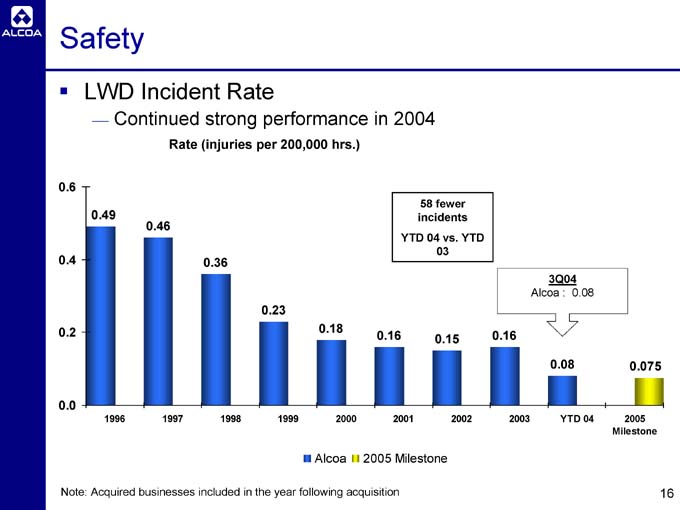
LWD Incident Rate
Continued strong performance in 2004
Rate (injuries per 200,000 hrs.)
0.6 0.4 0.2 0.0
0.49 0.46 0.36 0.23 0.18 0.16 0.15 0.16 0.08 0.075
1996 1997 1998 1999 2000 2001 2002 2003 YTD 04 2005 Milestone
58 fewer incidents YTD 04 vs. YTD
03
3Q04
Alcoa : 0.08
Alcoa 2005 Milestone
Note: Acquired businesses included in the year following acquisition
16
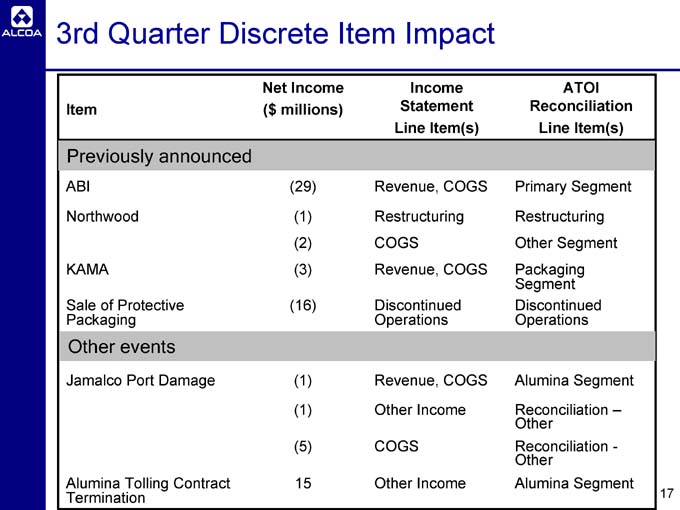
3rd Quarter Discrete Item Impact
Item Net Income ($millions) Income Statement Line Item(s) ATOI Reconciliation Line Item(s)
Previously announced
ABI (29) Revenue, COGS Primary Segment
Northwood (1) Restructuring Restructuring
(2) COGS Other Segment
KAMA (3) Revenue, COGS Packaging Segment
Sale of Protective Packaging (16) Discontinued Operations Discontinued Operations
Other events
Jamalco Port Damage (1) Revenue, COGS Alumina Segment
(1) Other Income Reconciliation – Other
(5) COGS Reconciliation - Other
Alumina Tolling Contract Termination 15 Other Income Alumina Segment
17
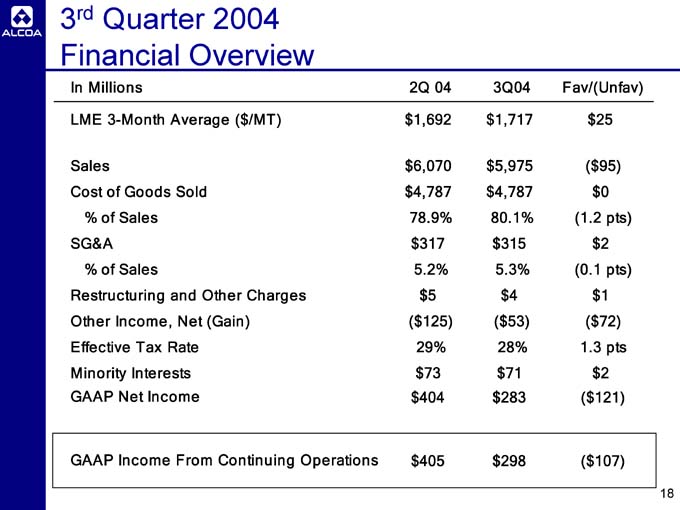
3rd Quarter 2004 Financial Overview
In Millions 2Q 04 3Q04 Fav/(Unfav)
LME 3-Month Average ($/MT) $1,692 $1,717 $25
Sales $6,070 $5,975 ($95)
Cost of Goods Sold $4,787 $4,787 $0
% of Sales 78.9% 80.1% (1.2 pts)
SG&A $317 $315 $2
% of Sales 5.2% 5.3% (0.1 pts)
Restructuring and Other Charges $5 $4 $1
Other Income, Net (Gain) ($125) ($53) ($72)
Effective Tax Rate 29% 28% 1.3 pts
Minority Interests $73 $71 $2
GAAP Net Income $404 $283 ($121)
GAAP Income From Continuing Operations $405 $298 ($107)
18
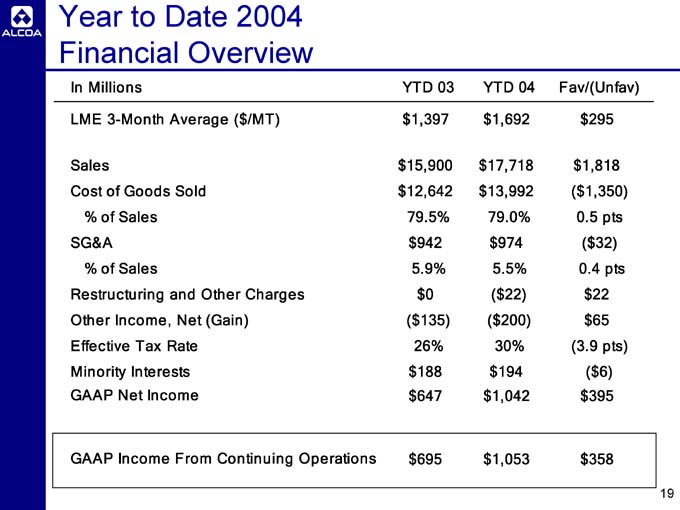
Year to Date 2004 Financial Overview
In Millions YTD 03 YTD 04 Fav/(Unfav)
LME 3-Month Average ($/MT) $1,397 $1,692 $295
Sales $15,900 $17,718 $1,818
Cost of Goods Sold $12,642 $13,992 ($1,350)
% of Sales 79.5% 79.0% 0.5 pts
SG&A $942 $974 ( $32)
% of Sales 5.9% 5.5% 0.4 pts
Restructuring and Other Charges $0 ($22) $22
Other Income, Net (Gain) ( $135) ($200) $65
Effective Tax Rate 26% 30% (3.9 pts)
Minority Interests $188 $194 ($6)
GAAP Net Income $647 $1,042 $395
GAAP Income From Continuing Operations $695 $1,053 $358
19
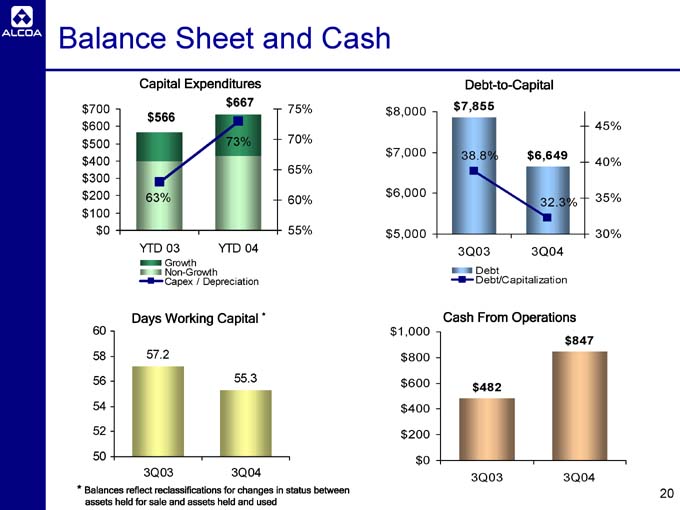
Balance Sheet and Cash
Capital Expenditures
$700 $600 $500 $400 $300 $200 $100 $0
$566 63% $667 73%
75% 70% 65% 60% 55%
YTD 03 YTD 04
Growth
Non-Growth
Capex / Depreciation
Debt-to-Capital
$8,000 $7,000 $6,000 $5,000
$7,855 38.8% $6,649 32.3%
45% 40% 35% 30%
3Q03 3Q04
Debt
Debt/Capitalization
Days Working Capital *
60 58 56 54 52 50
57.2 55.3
3Q03 3Q04
Cash From Operations
$1,000 $800 $600 $400 $200 $0
$482 $847
3Q03 3Q04
* Balances reflect reclassifications for changes in status between assets held for sale and assets held and used
20
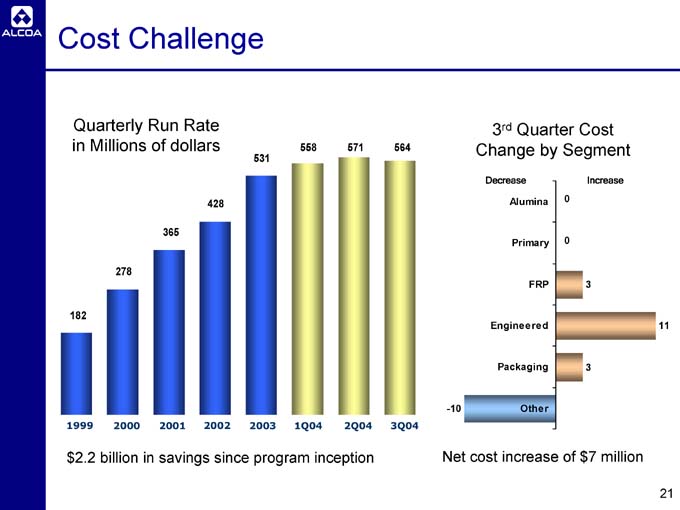
Cost Challenge
Quarterly Run Rate in Millions of dollars
182 278 365 428 531 558 571 564
1999 2000 2001 2002 2003 1Q04 2Q04 3Q04
$2.2 billion in savings since program inception
3rd Quarter Cost Change by Segment
Decrease
Alumina
Primary
FRP
Engineered
Packaging
Other -10
Increase
0
0
3
11
3
Net cost increase of $7 million
21
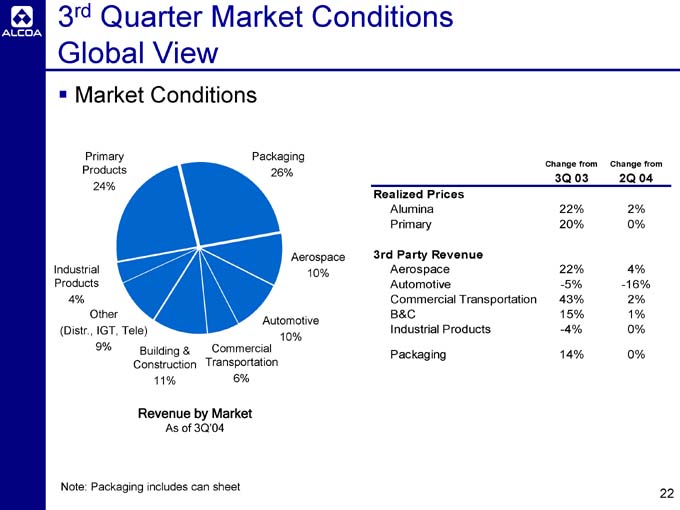
3rd Quarter Market Conditions Global View
Market Conditions
Packaging 26%
Aerospace 10%
Automotive 10%
Commercial Transportation 6%
Building & Construction 11%
Other (Distr., IGT, Tele) 9%
Industrial Products 4%
Primary Products 24%
Revenue by Market
As of 3Q’04
Change from 3Q 03 Change from 2Q 04
Realized Prices
Alumina 22% 2%
Primary 20% 0%
3rd Party Revenue
Aerospace 22% 4%
Automotive -5% -16%
Commercial Transportation 43% 2%
B&C 15% 1%
Industrial Products -4% 0%
Packaging 14% 0%
Note: Packaging includes can sheet
22
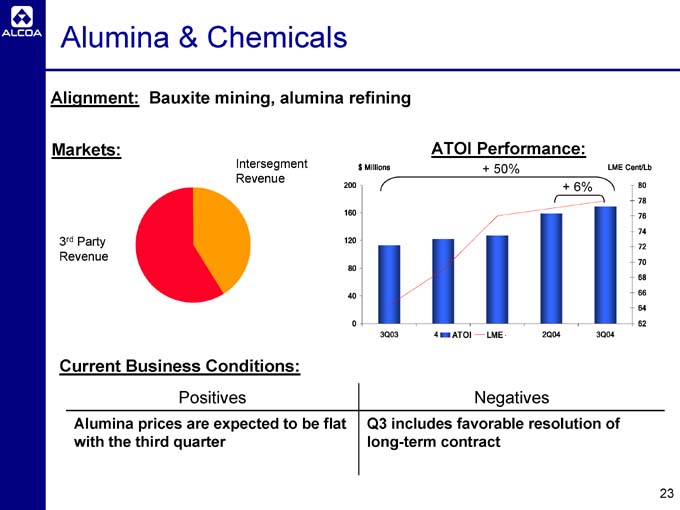
Alumina & Chemicals
Alignment: Bauxite mining, alumina refining
Markets:
Intersegment Revenue
3rd Party Revenue
ATOI Performance:
+ 50%
$ Millions
200 160 120 80 40 0
3Q03 4 ATOI LME 2Q04 3Q04
+ 6%
LME Cent/Lb
80 78 76 74 72 70 68 66 64 62
Current Business Conditions:
Positives
Alumina prices are expected to be flat with the third quarter
Negatives
Q3 includes favorable resolution of long-term contract
23
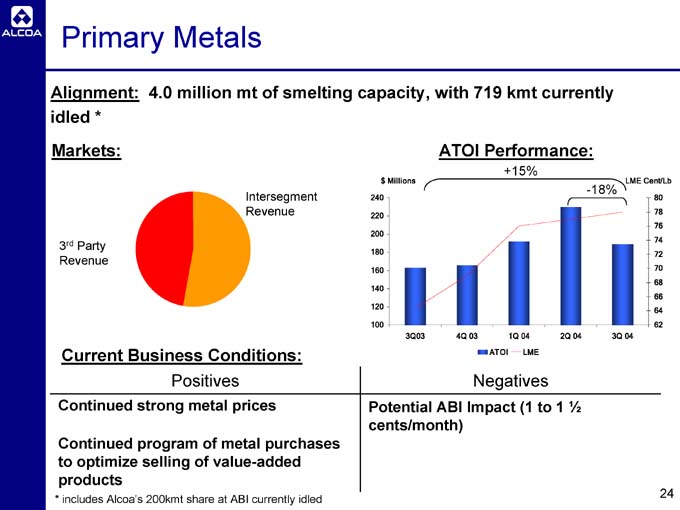
Primary Metals
Alignment: 4.0 million mt of smelting capacity, with 719 kmt currently idled *
Markets:
Intersegment Revenue
3rd Party Revenue
ATOI Performance:
+15%
$ Millions
240 220 200 180 160 140 120 100
-18%
3Q03 4Q 03 1Q 04 2Q 04 3Q 04
LME Cent/Lb
80 78 76 74 72 70 68 66 64 62
ATOI LME
Current Business Conditions:
Positives
Continued strong metal prices
Continued program of metal purchases to optimize selling of value-added products
Negatives
Potential ABI Impact (1 to 1 ½ cents/month)
* includes Alcoa’s 200kmt share at ABI currently idled
24
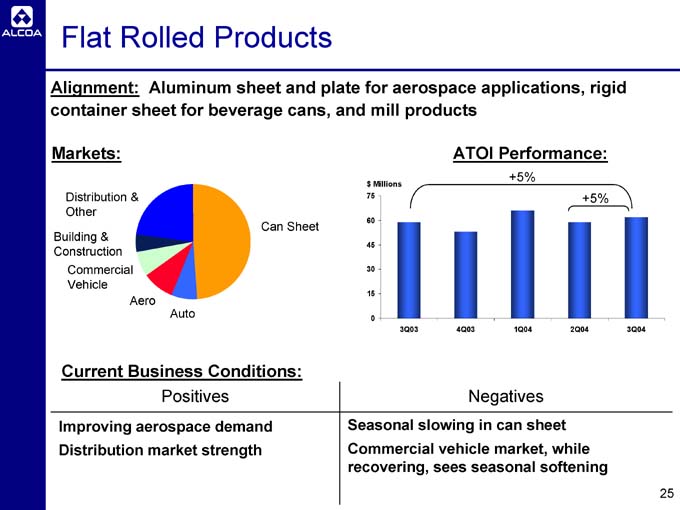
Flat Rolled Products
Alignment: Aluminum sheet and plate for aerospace applications, rigid container sheet for beverage cans, and mill products
Markets:
Distribution & Other
Building & Construction
Commercial Vehicle
Aero
Auto
Can Sheet
ATOI Performance:
+5%
$ Millions
75 60 45 30 15 0
+5%
3Q03 4Q03 1Q04 2Q04 3Q04
Current Business Conditions:
Positives
Improving aerospace demand
Distribution market strength
Negatives
Seasonal slowing in can sheet
Commercial vehicle market, while recovering, sees seasonal softening
25
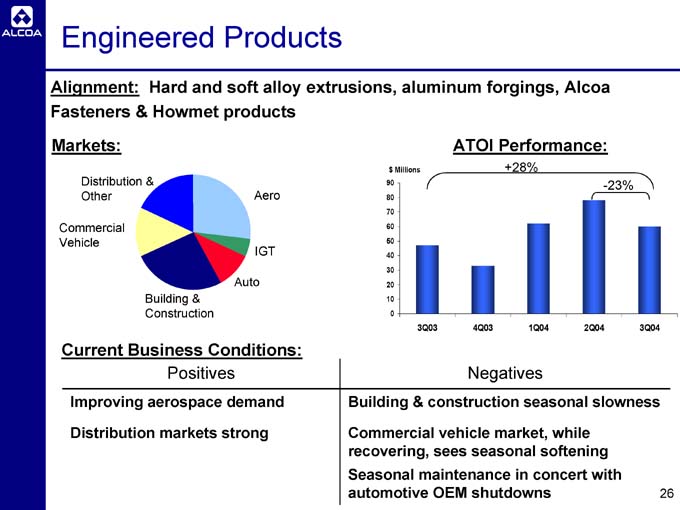
Engineered Products
Alignment: Hard and soft alloy extrusions, aluminum forgings, Alcoa Fasteners & Howmet products
Markets:
Distribution & Other
Commercial Vehicle
Building & Construction
Auto
IGT
Aero
ATOI Performance:
+28%
$ Millions
90 80 70 60 50 40 30 20 10 0
-23%
3Q03 4Q03 1Q04 2Q04 3Q04
Current Business Conditions:
Positives
Improving aerospace demand
Distribution markets strong
Negatives
Building & construction seasonal slowness
Commercial vehicle market, while recovering, sees seasonal softening
Seasonal maintenance in concert with automotive OEM shutdowns
26
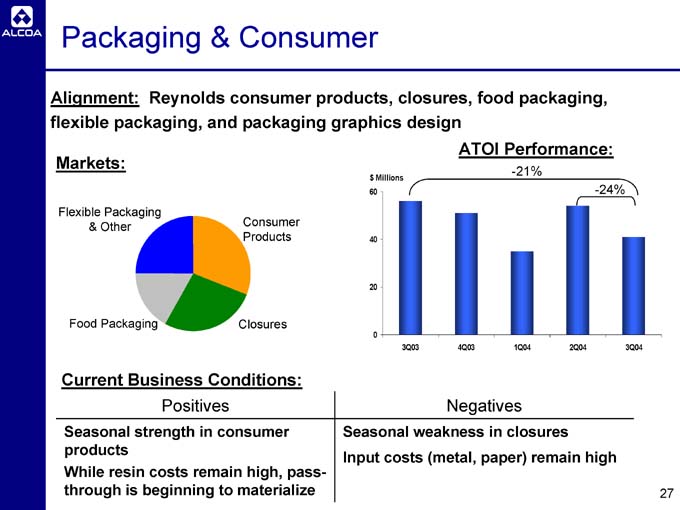
Packaging & Consumer
Alignment: Reynolds consumer products, closures, food packaging, flexible packaging, and packaging graphics design
Markets:
Flexible Packaging & Other
Consumer Products
Closures
Food Packaging
ATOI Performance:
-21%
$ Millions
60 40 20 0
-24%
3Q03 4Q03 1Q04 2Q04 3Q04
Current Business Conditions:
Positives
Seasonal strength in consumer products
While resin costs remain high, pass-through is beginning to materialize
Negatives
Seasonal weakness in closures
Input costs (metal, paper) remain high
27
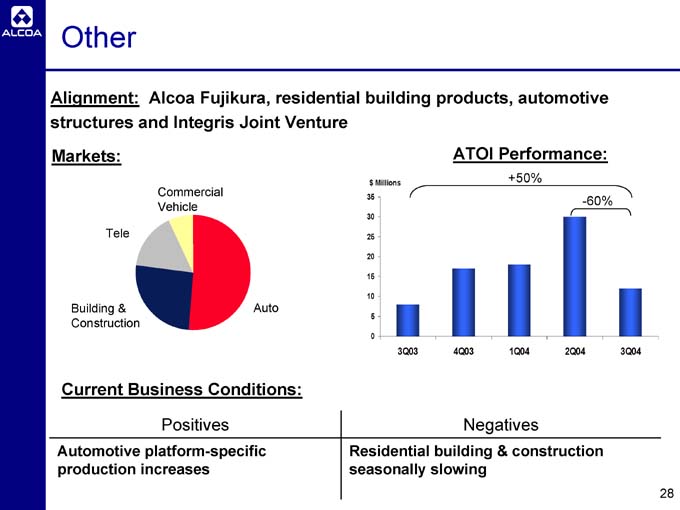
Other
Alignment: Alcoa Fujikura, residential building products, automotive structures and Integris Joint Venture
Markets:
Commercial Vehicle
Auto
Building & Construction
Tele
ATOI Performance:
+50%
$ Millions
35 30 25 20 15 10 5 0
-60%
3Q03 4Q03 1Q04 2Q04 3Q04
Current Business Conditions:
Positives
Automotive platform-specific production increases
Negatives
Residential building & construction seasonally slowing
28
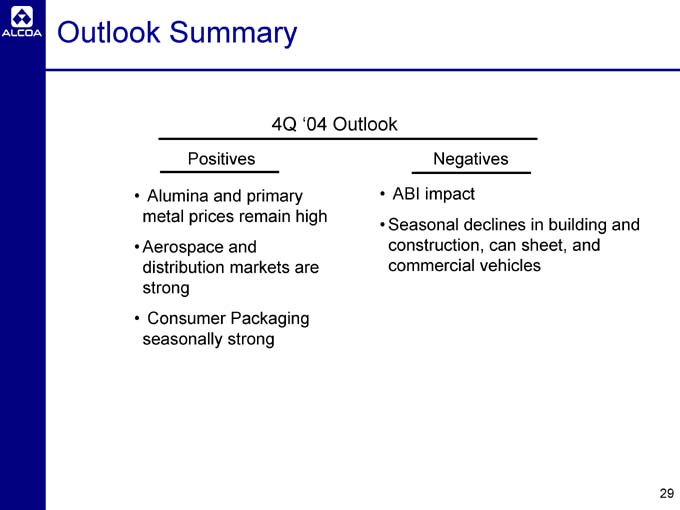
Outlook Summary
4Q ‘04 Outlook
Positives
Alumina and primary metal prices remain high
Aerospace and distribution markets are strong
Consumer Packaging seasonally strong
Negatives
ABI impact
Seasonal declines in building and construction, can sheet, and commercial vehicles
29
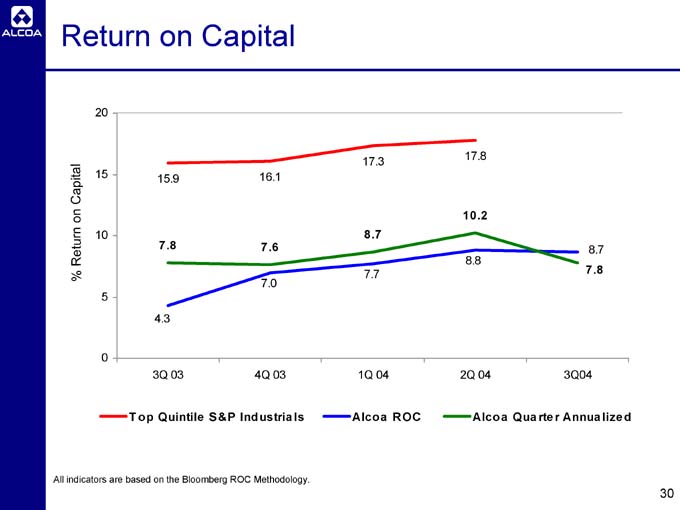
Return on Capital
% Return on Capital
20 15 10 5 0
15.9 16.1 17.3 17.8
7.8 7.6 8.7 10.2 7.8
4.3 7.0 7.7 8.8 8.7
3Q 03 4Q 03 1Q 04 2Q 04 3Q04
T op Quintile S&P Industrials
Alcoa ROC
Alcoa Quarter Annualized
All indicators are based on the Bloomberg ROC Methodology.
30
For Additional Information, contact:
William F. Oplinger
Director, Investor Relations
Alcoa
390 Park Avenue
New York, N.Y. 10022-4608
Telephone: (212) 836-2674
Facsimile: (212) 836-2813
www.alcoa.com
31
Appendix
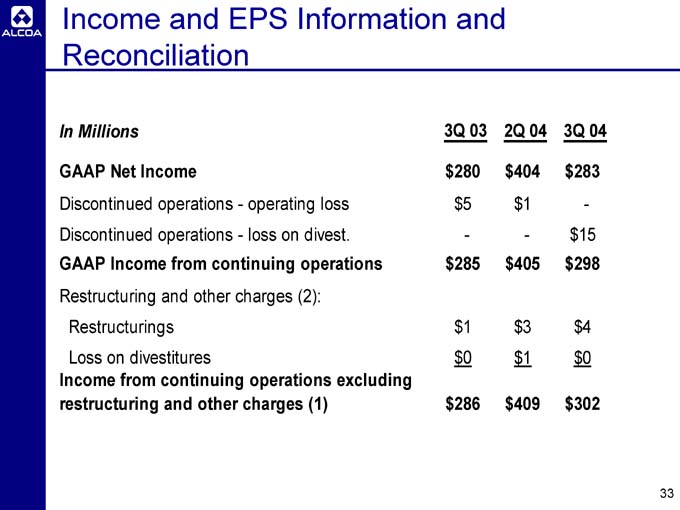
Income and EPS Information and Reconciliation
In Millions 3Q 03 2Q 04 3Q 04
GAAP Net Income $280 $404 $283
Discontinued operations - operating loss $5 $1 -
Discontinued operations - loss on divest. - - $15
GAAP Income from continuing operations $285 $405 $298
Restructuring and other charges (2):
Restructurings $1 $3 $4
Loss on divestitures $0 $1 $0
Income from continuing operations excluding
restructuring and other charges (1) $286 $409 $302
33
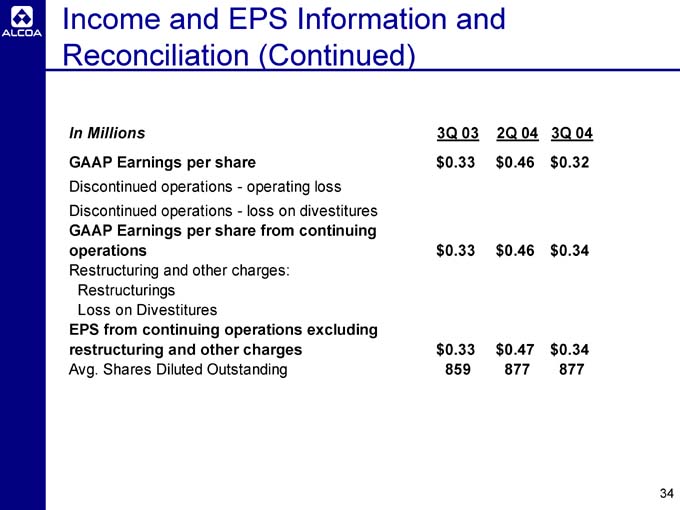
Income and EPS Information and Reconciliation (Continued)
In Millions 3Q 03 2Q 04 3Q 04
GAAP Earnings per share $0.33 $0.46 $0.32
Discontinued operations - operating loss
Discontinued operations - loss on divestitures
GAAP Earnings per share from continuing operations $0.33 $0.46 $0.34
Restructuring and other charges:
Restructurings
Loss on Divestitures
EPS from continuing operations excluding restructuring and other charges $0.33 $0.47 $0.34
Avg. Shares Diluted Outstanding 859 877 877
34
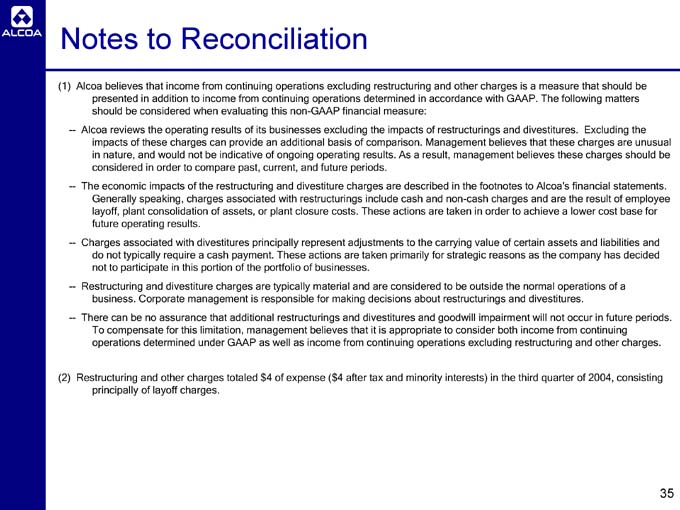
Notes to Reconciliation
(1) Alcoa believes that income from continuing operations excluding restructuring and other charges is a measure that should be presented in addition to income from continuing operations determined in accordance with GAAP. The following matters should be considered when evaluating this non-GAAP financial measure:
Alcoa reviews the operating results of its businesses excluding the impacts of restructurings and divestitures. Excluding the impacts of these charges can provide an additional basis of comparison. Management believes that these charges are unusual in nature, and would not be indicative of ongoing operating results. As a result, management believes these charges should be considered in order to compare past, current, and future periods.
The economic impacts of the restructuring and divestiture charges are described in the footnotes to Alcoa’s financial statements. Generally speaking, charges associated with restructurings include cash and non-cash charges and are the result of employee layoff, plant consolidation of assets, or plant closure costs. These actions are taken in order to achieve a lower cost base for future operating results.
Charges associated with divestitures principally represent adjustments to the carrying value of certain assets and liabilities and do not typically require a cash payment. These actions are taken primarily for strategic reasons as the company has decided not to participate in this portion of the portfolio of businesses.
Restructuring and divestiture charges are typically material and are considered to be outside the normal operations of a business. Corporate management is responsible for making decisions about restructurings and divestitures.
There can be no assurance that additional restructurings and divestitures and goodwill impairment will not occur in future periods. To compensate for this limitation, management believes that it is appropriate to consider both income from continuing operations determined under GAAP as well as income from continuing operations excluding restructuring and other charges.
(2) Restructuring and other charges totaled $4 of expense ($4 after tax and minority interests) in the third quarter of 2004, consisting principally of layoff charges.
35
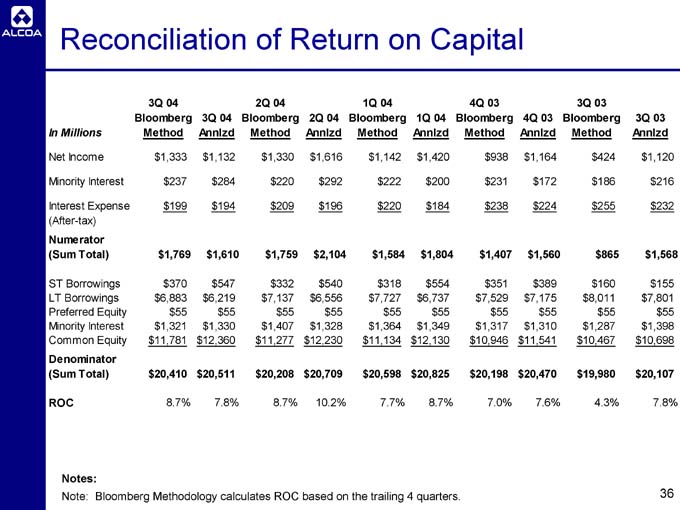
Reconciliation of Return on Capital
In Millions 3Q 04 Bloomberg Method 3Q 04 Annlzd 2Q 04 Bloomberg Method 2Q 04 Annlzd 1Q 04 Bloomberg Method 1Q 04 Annlzd 4Q 03 Bloomberg Method 4Q 03 Annlzd 3Q 03 Bloomberg Method 3Q 03 Annlzd
Net Income $1,333 $1,132 $1,330 $1,616 $1,142 $1,420 $938 $1,164 $424 $1,120
Minority Interest $237 $284 $220 $292 $222 $200 $231 $172 $186 $216
Interest Expense $199 $194 $209 $196 $220 $184 $238 $224 $255 $232
(After-tax)
Numerator
(Sum Total) $1,769 $1,610 $1,759 $2,104 $1,584 $1,804 $1,407 $1,560 $865 $1,568
ST Borrowings $370 $547 $332 $540 $318 $554 $351 $389 $160 $155
LT Borrowings $6,883 $6,219 $7,137 $6,556 $7,727 $6,737 $7,529 $7,175 $8,011 $7,801
Preferred Equity $55 $55 $55 $55 $55 $55 $55 $55 $55 $55
Minority Interest $1,321 $1,330 $1,407 $1,328 $1,364 $1,349 $1,317 $1,310 $1,287 $1,398
Common Equity $11,781 $12,360 $11,277 $12,230 $11,134 $12,130 $10,946 $11,541 $10,467 $10,698
Denominator
(Sum Total) $20,410 $20,511 $20,208 $20,709 $20,598 $20,825 $20,198 $20,470 $19,980 $20,107
ROC 8.7% 7.8% 8.7% 10.2% 7.7% 8.7% 7.0% 7.6% 4.3% 7.8%
Notes:
Note: Bloomberg Methodology calculates ROC based on the trailing 4 quarters.
36
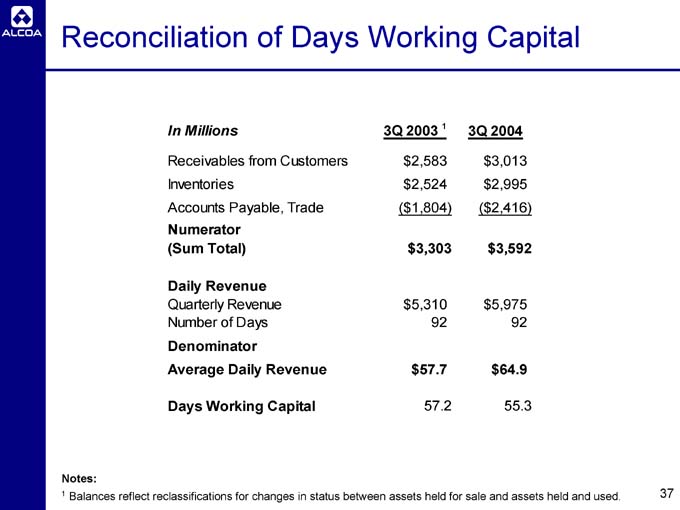
Reconciliation of Days Working Capital
In Millions 3Q 2003 1 3Q 2004
Receivables from Customers $2,583 $3,013
Inventories $2,524 $2,995
Accounts Payable, Trade ($1,804) ($2,416)
Numerator
(Sum Total) $3,303 $3,592
Daily Revenue
Quarterly Revenue $5,310 $5,975
Number of Days 92 92
Denominator
Average Daily Revenue $57.7 $64.9
Days Working Capital 57.2 55.3
Notes:
1 Balances reflect reclassifications for changes in status between assets held for sale and assets held and used.
37