Exhibit 99.2
[ALCOA LOGO]
4th Quarter 2004 Analyst Conference
January 10, 2005 New York, NY
Forward-Looking Statements
Today’s discussion may include “forward-looking statements” within the meaning of the Private Securities Litigation Reform Act of 1995. Such statements relate to future events and expectations and involve known and unknown risks and uncertainties. Alcoa’s actual results or actions may differ materially from those projected in the forward-looking statements. For a summary of the specific risk factors that could cause results to differ materially from those expressed in the forward-looking statements, please refer to Alcoa’s Form 10-K for the year ended December 31, 2003, in addition to the Quarterly Report on Form 10-Q for the quarter ended September 30, 2004 filed with the Securities and Exchange Commission.
2
Alain J. P. Belda
Chairman and Chief Executive Officer
2004 Review
Financial Performance
Income from continuing operations of $1.4 billion, up 33% from 2003 Highest annual sales in company history; revenue growth of $2.4 billion over 2003 Increased profitability in four out of six operating segments Cash from operations of $2.4 billion Second consecutive year of debt repayment greater than $1.1 billion
4
2004 Review
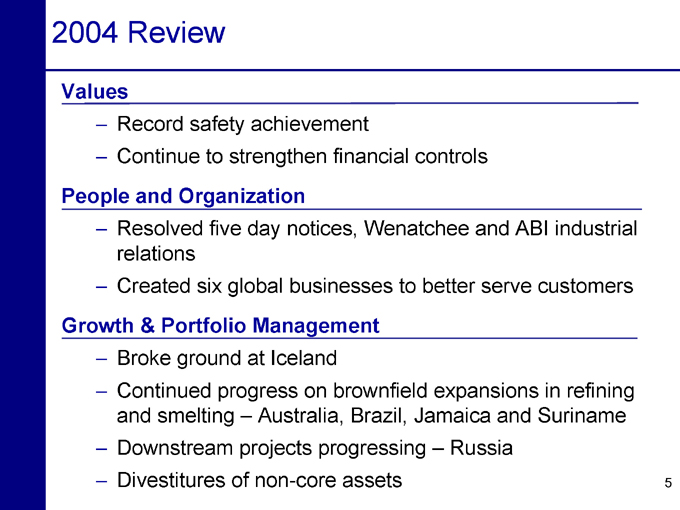
Values
Record safety achievement
Continue to strengthen financial controls
People and Organization
Resolved five day notices, Wenatchee and ABI industrial relations Created six global businesses to better serve customers
Growth & Portfolio Management
Broke ground at Iceland
Continued progress on brownfield expansions in refining and smelting – Australia, Brazil, Jamaica and Suriname Downstream projects progressing – Russia Divestitures of non-core assets
5
2004 Cost Pressures & Management Actions
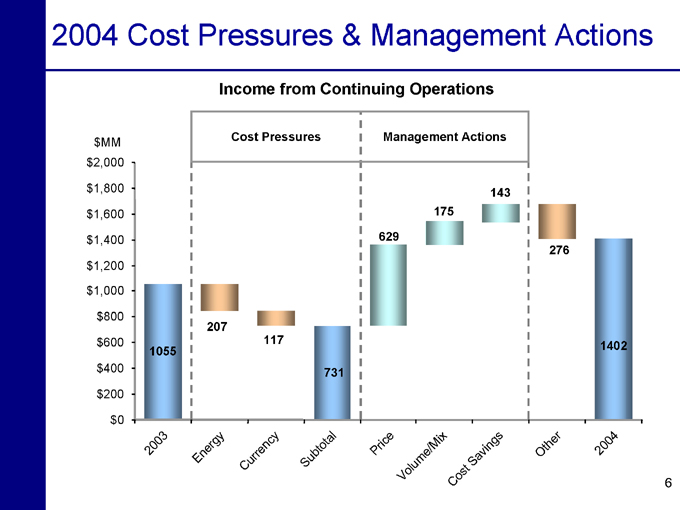
Income from Continuing Operations $MM $2,000
$1,800 $1,600 $1,400
$1,200 $1,000
$800 $600 $400 $200 $0
Cost Pressures
Management Actions
2003
Energy
Currency
Subtotal
Price
Volume/Mix
Cost
Savings
Other
2004
1055
207
117
731
629
175
143
276
1402
6
Escalating Industry Costs
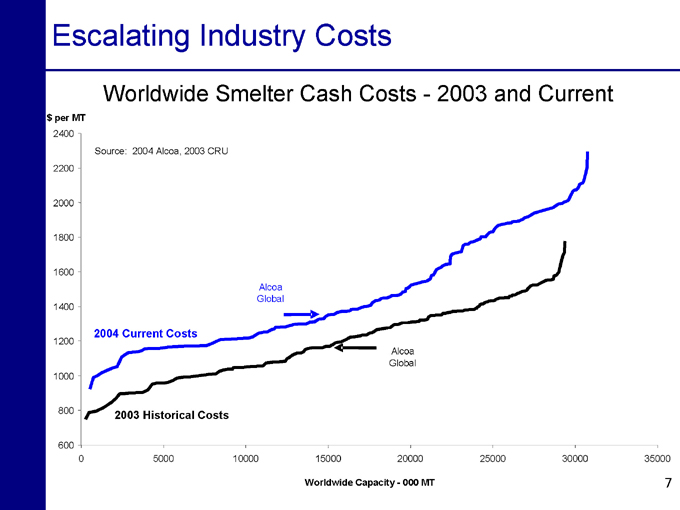
Worldwide Smelter Cash Costs—2003 and Current $ per MT
2400
2200
2000
1800
1600
1400
1200
1000
800
600
Source: 2004 Alcoa, 2003 CRU
2004 Current Costs
Alcoa Global
2003 Historical Costs
Alcoa Global
0
5000
10000
15000
20000
25000
30000
35000
Worldwide Capacity—000 MT
7
Currency Impact
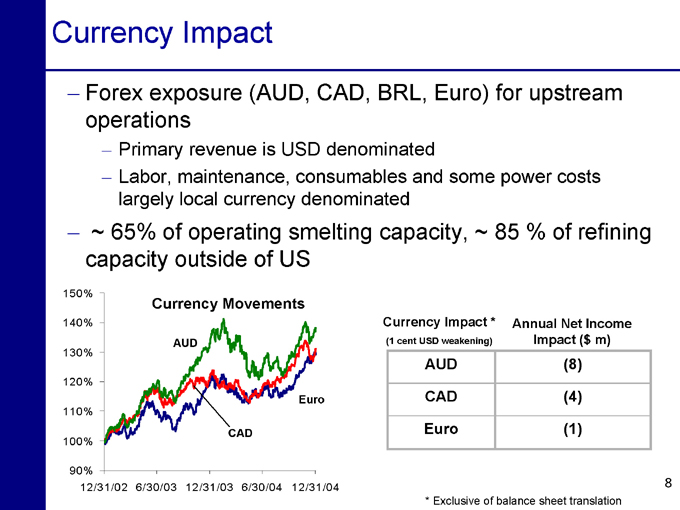
Forex exposure (AUD, CAD, BRL, Euro) for upstream operations
Primary revenue is USD denominated
Labor, maintenance, consumables and some power costs largely local currency denominated
~ 65% of operating smelting capacity, ~ 85 % of refining capacity outside of US
150%
140%
130%
120%
110%
100%
90%
Currency Movements
AUD
CAD
Euro
12/31/02 6/30/03 12/31/03 6/30/04 12/31/04
Currency Impact *
(1 cent USD weakening)
Annual Net Income Impact ($ m)
AUD (8)
CAD (4)
Euro (1)
* Exclusive of balance sheet translation
8

2005 - Planned Savings to Overcome Cost Pressures
Cost Inflation
650
600
500
400
300
200
100
0
70
Other
125
Energy Costs
390
Raw Materials
Average unit cost increases for select raw materials
80%
60%
40%
20%
0%
Caustic
Resin
Alloying Materials
Fuel Oil
Cost Savings
650
600
500
400
300
200
100
0
SG&A
60
Procurement
80
Other Sustainable Cost Savings
103
Shop Floor Productivity
377
9
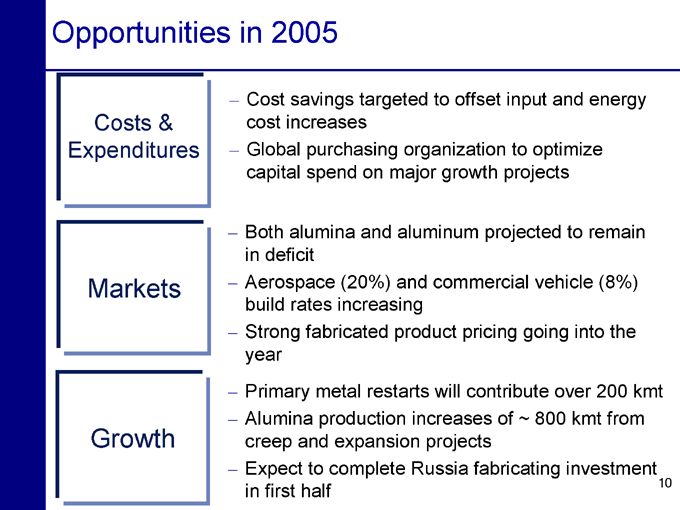
Opportunities in 2005
Costs & Expenditures
Markets
Growth
Cost savings targeted to offset input and energy cost increases
Global purchasing organization to optimize capital spend on major growth projects
Both alumina and aluminum projected to remain in deficit
Aerospace (20%) and commercial vehicle (8%) build rates increasing
Strong fabricated product pricing going into the year
Primary metal restarts will contribute over 200 kmt
Alumina production increases of ~ 800 kmt from creep and expansion projects
Expect to complete Russia fabricating investment in first half
10
[ALCOA LOGO]
Richard B. Kelson
Executive Vice President Chief Financial Officer

Financial Overview
4th Quarter income from continuing operations of 39 cents/share Revenue growth sequentially; YTD revenue highest ever Year-over-year improvements in 4 out of 6 operating segments Higher input costs continue to dampen cost savings achievement Trailing 4 quarters ROC of 8.5%; up 150 basis points from 2003 Lowered debt-to-capital to 29.3%
12
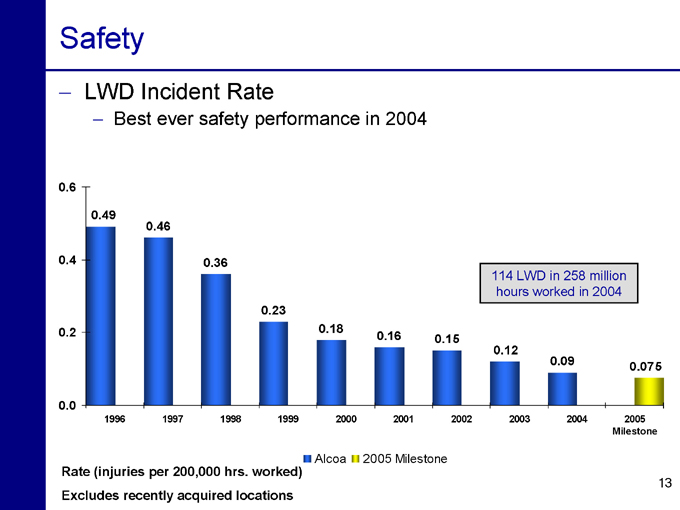
Safety
LWD Incident Rate
Best ever safety performance in 2004
0.6
0.4
0.2
0.0
1996
1997
1998
1999
2000
2001
2002
2003
2004
2005 Milestone
0.49
0.46
0.36
0.23
0.18
0.16
0.15
0.12
0.09
0.075
114 LWD in 258 million hours worked in 2004
Alcoa
2005 Milestone
Rate (injuries per 200,000 hrs. worked) Excludes recently acquired locations
13
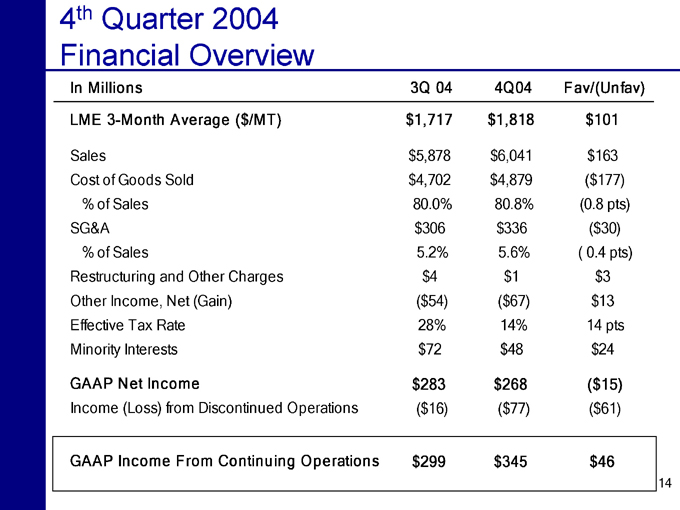
4th Quarter 2004 Financial Overview
In Millions 3Q 04 4Q04 Fav/(Unfav)
LME 3-Month Average ($/MT) $1,717 $1,818 $101
Sales $5,878 $6,041 $163
Cost of Goods Sold $4,702 $4,879 ($177)
% of Sales 80.0% 80.8% (0.8 pts)
SG&A $306 $336 ($30)
% of Sales 5.2% 5.6% (0.4 pts)
Restructuring and Other Charges $4 $1 $3
Other Income, Net (Gain) ($54) ($67) $13
Effective Tax Rate 28% 14% 14 pts
Minority Interests $72 $48 $24
GAAP Net Income $283 $268 ($15)
Income (Loss) from Discontinued Operations ($16) ($77) ($61)
GAAP Income From Continuing Operations $299 $345 $46
14
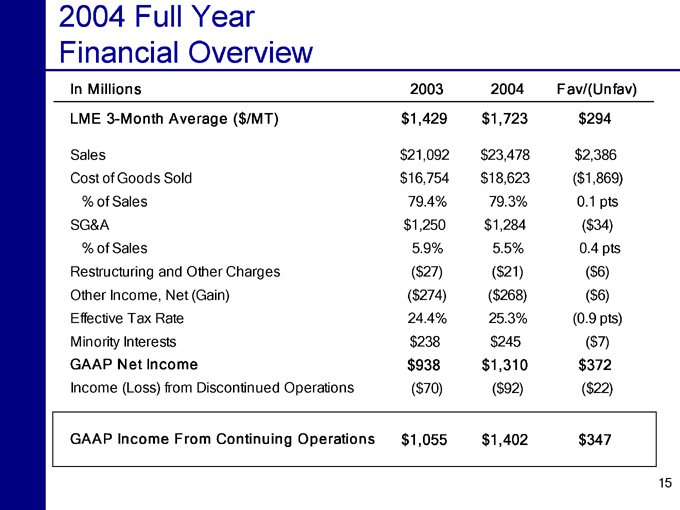
2004 Full Year Financial Overview
In Millions 2003 2004 Fav/(Unfav)
LME 3-Month Average ($/MT) $1,429 $1,723 $294
Sales $21,092 $23,478 $2,386
Cost of Goods Sold $16,754 $18,623 ($1,869)
% of Sales 79.4% 79.3% 0.1 pts
SG&A $1,250 $1,284 ( $34)
% of Sales 5.9% 5.5% 0.4 pts
Restructuring and Other Charges ($27) ($21) ($6)
Other Income, Net (Gain) ($274) ($268) ($6)
Effective Tax Rate 24.4% 25.3% (0.9 pts)
Minority Interests $238 $245 ($7)
GAAP Net Income $938 $1,310 $372
Income (Loss) from Discontinued Operations ($70) ($92) ( $22)
GAAP Income From Continuing Operations $1,055 $1,402 $347
15
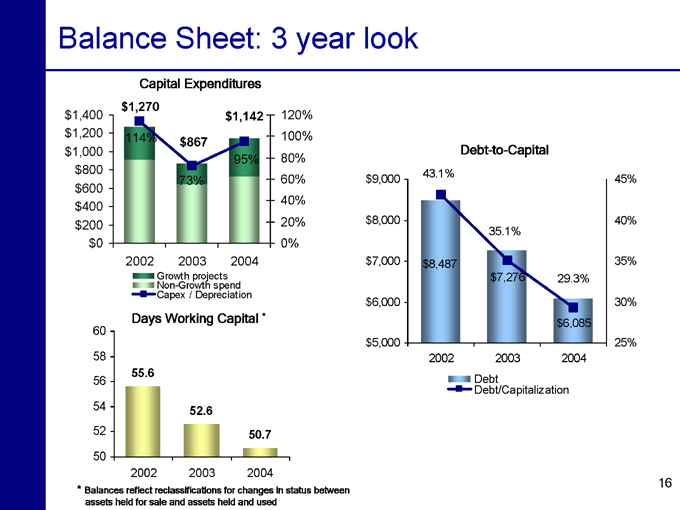
Balance Sheet: 3 year look
Capital Expenditures
$1,400
$1,200
$1,000
$800
$600
$400
$200
$0
$1,270
114% $867
73% $1,142
95%
2002 2003 2004
Growth projects Non-Growth spend Capex / Depreciation
120% 100% 80% 60% 40% 20% 0%
Days Working Capital *
60
58 56
54 52
50
2002
2003
2004
55.6
52.6
50.7
Debt-to-Capital
$9,000
$8,000
$7,000
$6,000
$5,000
2002
2003
2004
43.1%
35.1%
29.3%
$8,487
$7,276
$6,085
45%
40%
35%
30%
25%
Debt
Debt/Capitalization
* Balances reflect reclassifications for changes in status between assets held for sale and assets held and used
16
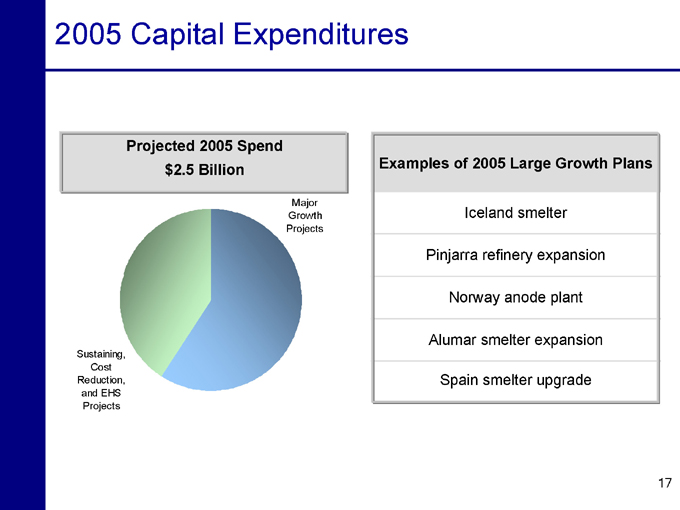
2005 Capital Expenditures
Projected 2005 Spend $2.5 Billion
Major Growth Projects
Sustaining, Cost Reduction, and EHS
Projects
Examples of 2005 Large Growth Plans
Iceland smelter
Pinjarra refinery expansion
Norway anode plant
Alumar smelter expansion
Spain smelter upgrade
17
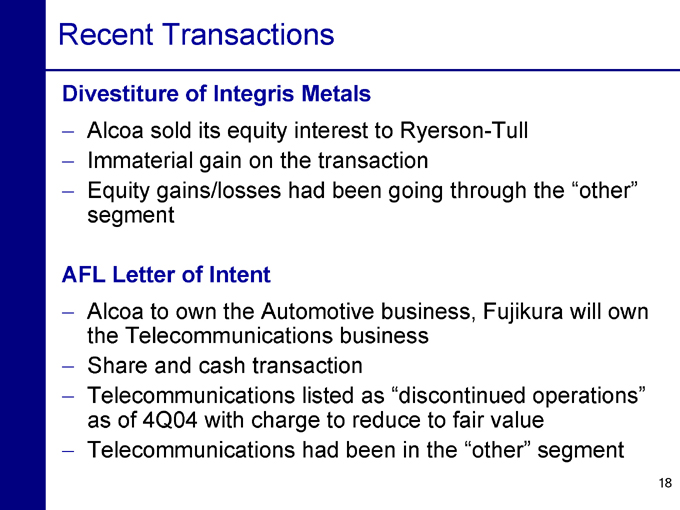
Recent Transactions
Divestiture of Integris Metals
Alcoa sold its equity interest to Ryerson-Tull Immaterial gain on the transaction
Equity gains/losses had been going through the “other” segment
AFL Letter of Intent
Alcoa to own the Automotive business, Fujikura will own the Telecommunications business Share and cash transaction Telecommunications listed as “discontinued operations” as of 4Q04 with charge to reduce to fair value Telecommunications had been in the “other” segment
18
Pension and Stock Option Expense
Pension
2005 Earnings Impact ~ $20 million additional pre-tax Balance Sheet – 2004 minimum pension liability increased by $22 million Cash Flow Impact – No material change in funding required in 2005
Stock Options
Plan to expense options in 3rd Quarter, 2005
Currently evaluating binomial lattice model for valuation Further details will be provided in 2Q conference call
19
4th Quarter Market Conditions Global View
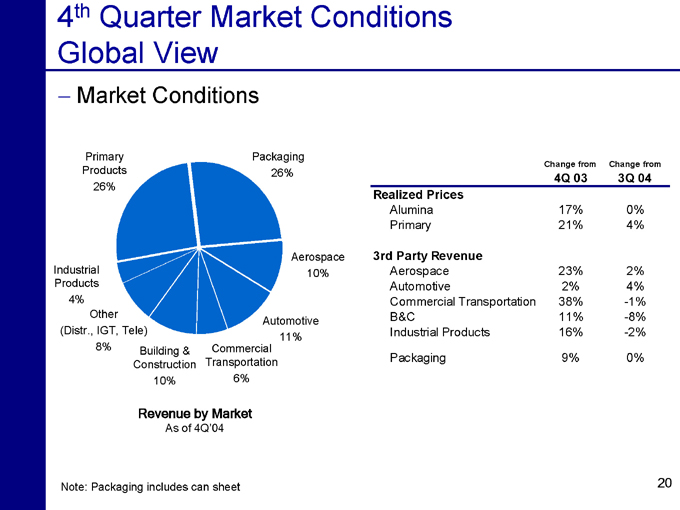
Market Conditions
Primary Products 26%
Industrial Products 4%
Other
(Distr., IGT, Tele)
8%
Building & Construction 10%
Commercial Transportation 6%
Automotive 11%
Aerospace 10%
Packaging 26%
Revenue by Market
As of 4Q’04
Change from Change from
4Q 03 3Q 04
Realized Prices
Alumina 17% 0%
Primary 21% 4%
3rd Party Revenue
Aerospace 23% 2%
Automotive 2% 4%
Commercial Transportation 38% -1%
B&C 11% -8%
Industrial Products 16% -2%
Packaging 9% 0%
Note: Packaging includes can sheet
20
Alumina & Chemicals
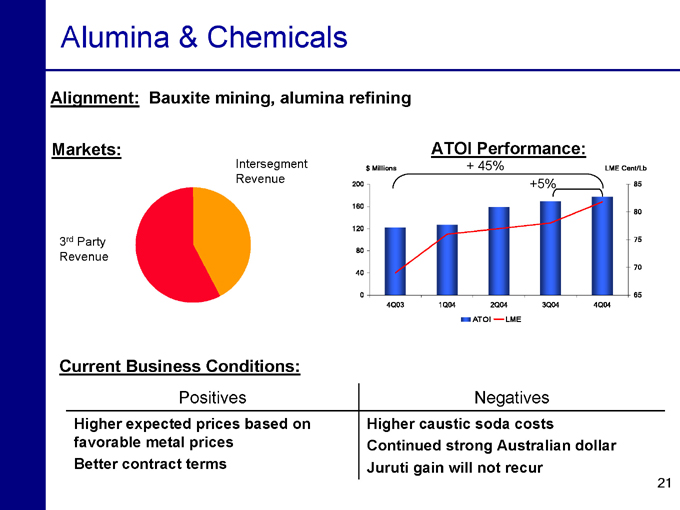
Alignment: Bauxite mining, alumina refining
Markets:
3rd Party Revenue
Intersegment Revenue
ATOI Performance:
+ 45%
$ Millions
2001
60
120
80
40
0
4Q03
1Q04
2Q04
3Q04
4Q04
+5%
LME Cent/Lb
85 80 75 70 65
ATOI
LME
Current Business Conditions:
Positives
Higher expected prices based on favorable metal prices Better contract terms
Negatives
Higher caustic soda costs
Continued strong Australian dollar Juruti gain will not recur
21
Primary Metals
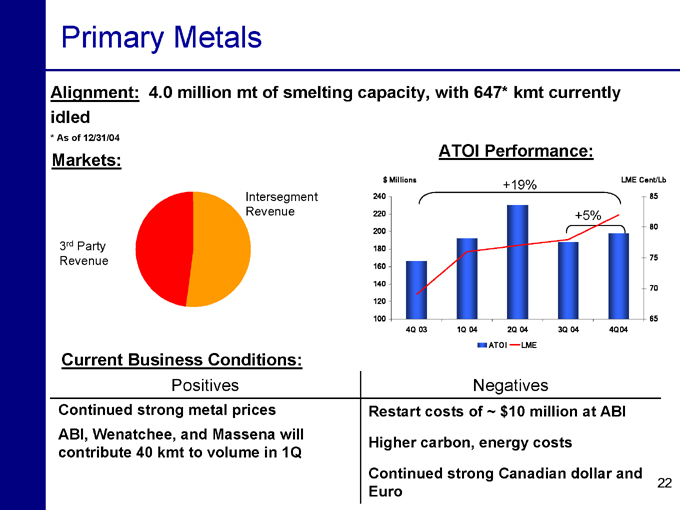
Alignment: 4.0 million mt of smelting capacity, with 647* kmt currently idled
* As of 12/31/04
Markets:
Intersegment Revenue
3rd Party Revenue
ATOI Performance:
+19% $ Millions
240 220 200 180 160 140 120 100
4Q 03
1Q 04
2Q 04
3Q 04
4Q04
LME Cent/Lb
85
80
75
70
65
ATOI
LME
Current Business Conditions:
Positives
Continued strong metal prices ABI, Wenatchee, and Massena will contribute 40 kmt to volume in 1Q
Negatives
Restart costs of ~ $10 million at ABI
Higher carbon, energy costs
Continued strong Canadian dollar and Euro
22
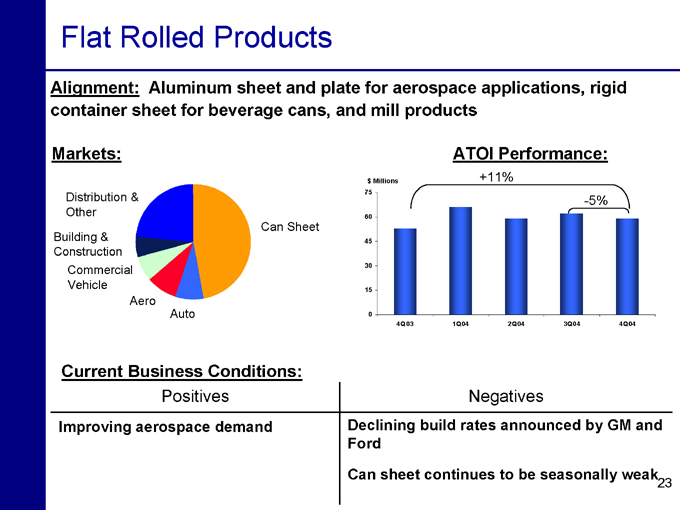
Flat Rolled Products
Alignment: Aluminum sheet and plate for aerospace applications, rigid container sheet for beverage cans, and mill products
Markets:
Distribution & Other
Building & Construction
Commercial Vehicle
Aero
Auto
Can Sheet
ATOI Performance:
+11% $ Millions
75
60
45
30
15
0
4Q03
1Q04
2Q04
3Q04
4Q04
-5%
Current Business Conditions:
Positives
Improving aerospace demand
Negatives
Declining build rates announced by GM and Ford
Can sheet continues to be seasonally weak
23
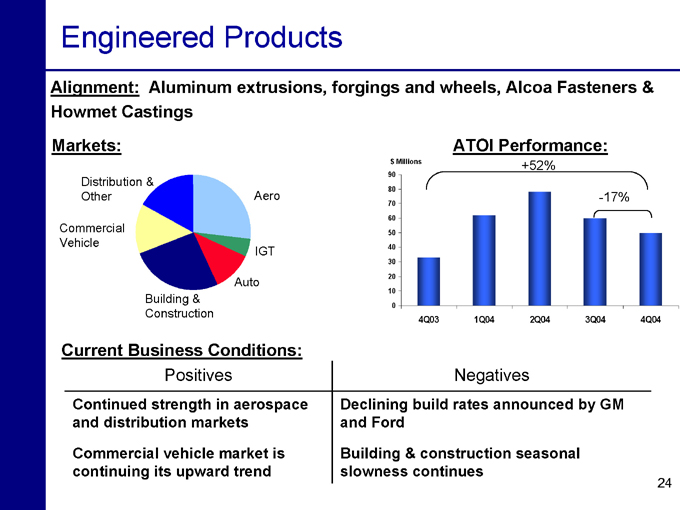
Engineered Products
Alignment: Aluminum extrusions, forgings and wheels, Alcoa Fasteners & Howmet Castings
Markets:
Distribution & Other
Commercial Vehicle
Building & Construction
Auto
IGT
Aero
ATOI Performance:
+52% $ Millions
90 80 70 60 50 40 30 20 10 0
4Q03
1Q04
2Q04
3Q04
4Q04
-17%
Current Business Conditions:
Positives
Continued strength in aerospace and distribution markets
Commercial vehicle market is continuing its upward trend
Negatives
Declining build rates announced by GM and Ford
Building & construction seasonal slowness continues
24
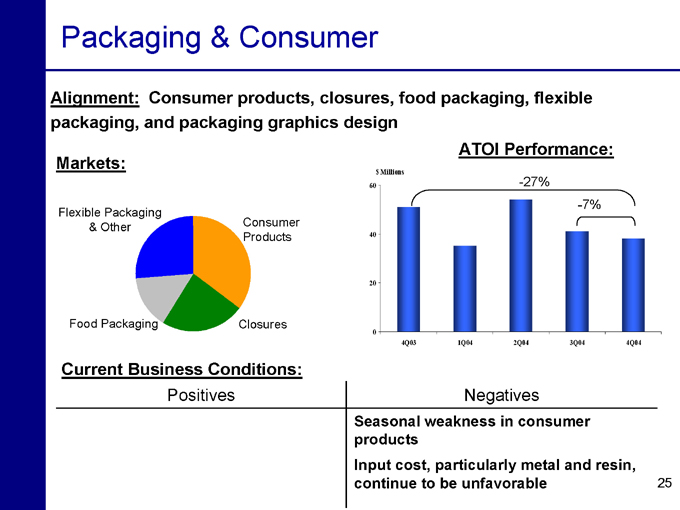
Packaging & Consumer
Alignment: Consumer products, closures, food packaging, flexible packaging, and packaging graphics design
Markets:
Flexible Packaging & Other
Food Packaging
Consumer Products
Closures
ATOI Performance:
-27% $ Millions
60 40 20 0
4Q03
1Q04
2Q04
3Q04
4Q04
-7%
Current Business Conditions:
Positives
Negatives
Seasonal weakness in consumer products Input cost, particularly metal and resin, continue to be unfavorable
25
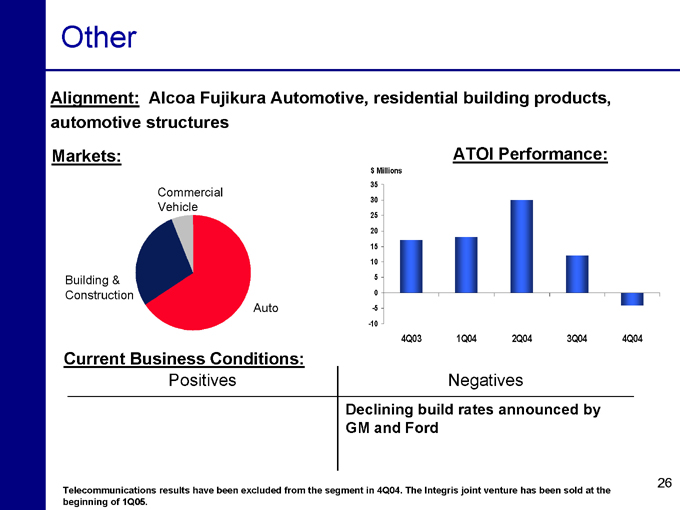
Other
Alignment: Alcoa Fujikura Automotive, residential building products, automotive structures
Markets:
Commercial Vehicle
Building & Construction
Auto
ATOI Performance: $ Millions
35 30 25 20 15 10 5 0 -5 -10
4Q03
1Q04
2Q04
3Q04
4Q04
Current Business Conditions:
Positives
Negatives
Declining build rates announced by GM and Ford
Telecommunications results have been excluded from the segment in 4Q04. The Integris joint venture has been sold at the beginning of 1Q05.
26
Outlook Summary
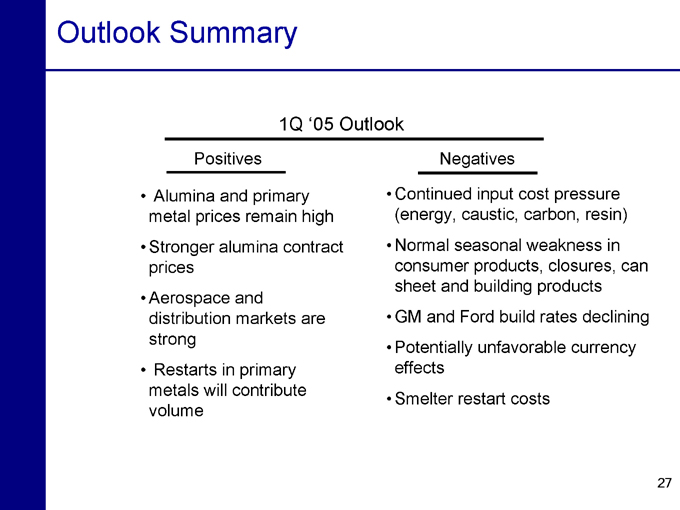
1Q ‘05 Outlook
Positives
Alumina and primary metal prices remain high
Stronger alumina contract prices
Aerospace and distribution markets are strong
Restarts in primary metals will contribute volume
Negatives
Continued input cost pressure (energy, caustic, carbon, resin)
Normal seasonal weakness in consumer products, closures, can sheet and building products
GM and Ford build rates declining
Potentially unfavorable currency effects
Smelter restart costs
27
2005 Challenges
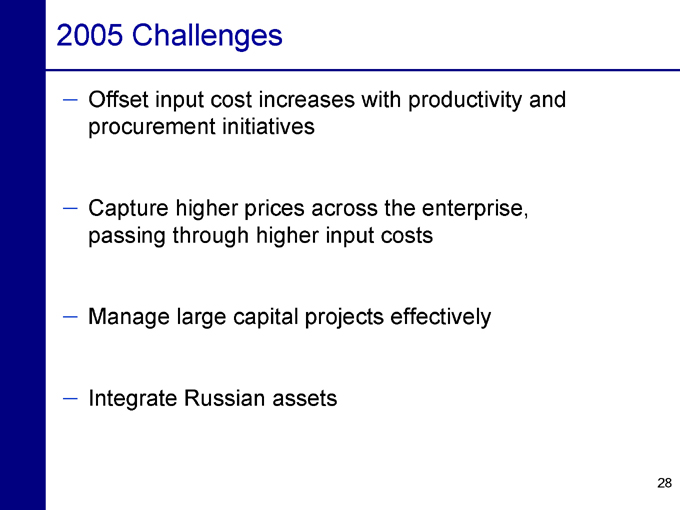
Offset input cost increases with productivity and procurement initiatives
Capture higher prices across the enterprise, passing through higher input costs
Manage large capital projects effectively
Integrate Russian assets
28
For Additional Information, contact:
William F. Oplinger Director, Investor Relations
Alcoa
390 Park Avenue
New York, N.Y. 10022-4608 Telephone: (212) 836-2674 Facsimile: (212) 836-2813 www.alcoa.com
29
Appendix
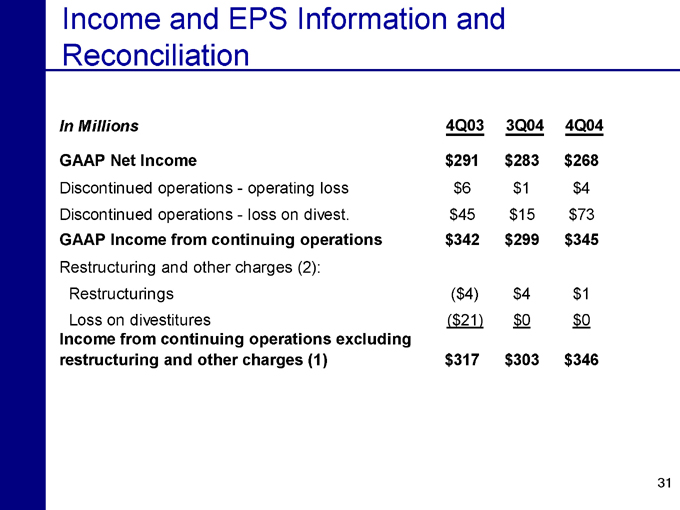
Income and EPS Information and Reconciliation
In Millions 4Q03 3Q04 4Q04
GAAP Net Income $291 $283 $268
Discontinued operations - operating loss $6 $1 $4
Discontinued operations - loss on divest. $45 $15 $73
GAAP Income from continuing operations $342 $299 $345
Restructuring and other charges (2):
Restructurings ($4) $4 $1
Loss on divestitures ($21) $0 $0
Income from continuing operations excluding
restructuring and other charges (1) $317 $303 $346
31
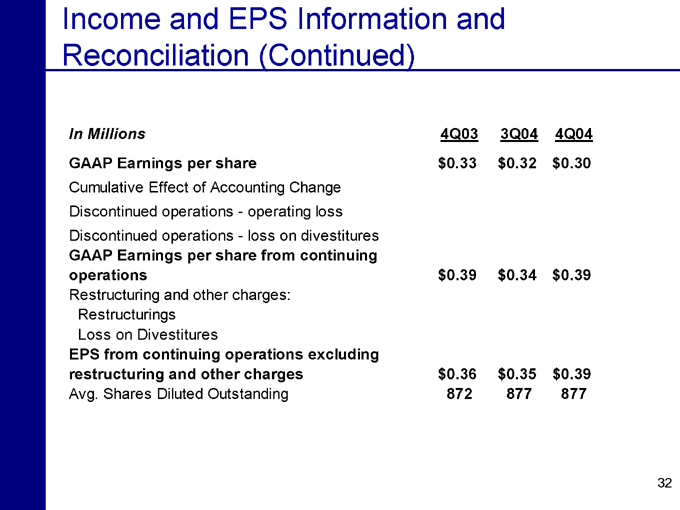
Income and EPS Information and Reconciliation (Continued)
In Millions 4Q03 3Q04 4Q04
GAAP Earnings per share $0.33 $0.32 $0.30
Cumulative Effect of Accounting Change
Discontinued operations - operating loss
Discontinued operations - loss on divestitures
GAAP Earnings per share from continuing
operations $0.39 $0.34 $0.39
Restructuring and other charges:
Restructurings
Loss on Divestitures
EPS from continuing operations excluding
restructuring and other charges $0.36 $0.35 $0.39
Avg. Shares Diluted Outstanding 872 877 877
32
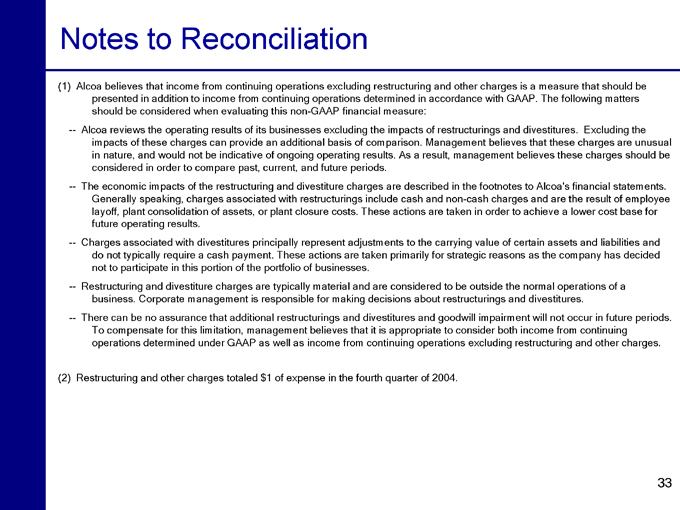
Notes to Reconciliation
(1) Alcoa believes that income from continuing operations excluding restructuring and other charges is a measure that should be presented in addition to income from continuing operations determined in accordance with GAAP. The following matters should be considered when evaluating this non-GAAP financial measure:
Alcoa reviews the operating results of its businesses excluding the impacts of restructurings and divestitures. Excluding the impacts of these charges can provide an additional basis of comparison. Management believes that these charges are unusual in nature, and would not be indicative of ongoing operating results. As a result, management believes these charges should be considered in order to compare past, current, and future periods.
The economic impacts of the restructuring and divestiture charges are described in the footnotes to Alcoa’s financial statements.
Generally speaking, charges associated with restructurings include cash and non-cash charges and are the result of employee layoff, plant consolidation of assets, or plant closure costs. These actions are taken in order to achieve a lower cost base for future operating results.
Charges associated with divestitures principally represent adjustments to the carrying value of certain assets and liabilities and do not typically require a cash payment. These actions are taken primarily for strategic reasons as the company has decided not to participate in this portion of the portfolio of businesses.
Restructuring and divestiture charges are typically material and are considered to be outside the normal operations of a business. Corporate management is responsible for making decisions about restructurings and divestitures.
There can be no assurance that additional restructurings and divestitures and goodwill impairment will not occur in future periods.
To compensate for this limitation, management believes that it is appropriate to consider both income from continuing operations determined under GAAP as well as income from continuing operations excluding restructuring and other charges.
(2) Restructuring and other charges totaled $1 of expense in the fourth quarter of 2004.
33
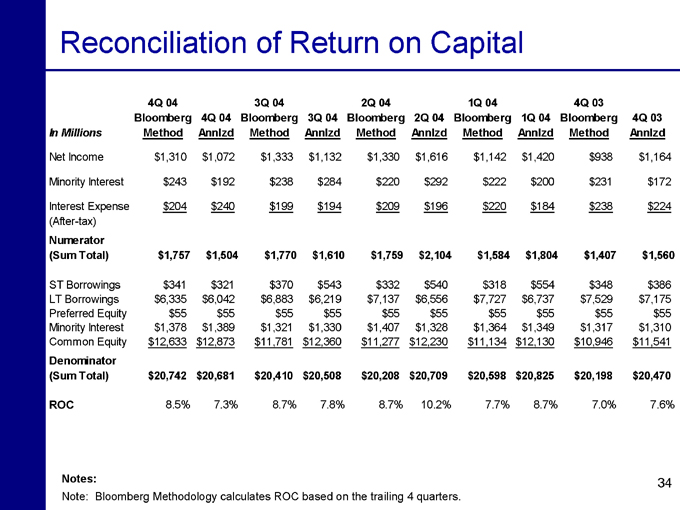
Reconciliation of Return on Capital
In Millions 4Q 04 Bloomberg Method 4Q 04 Annlzd 3Q 04 Bloomberg Method 3Q 04 Annlzd 2Q 04 Bloomberg Method 2Q 04 Annlzd 1Q 04 Bloomberg Method 1Q 04 Annlzd 4Q 03 Bloomberg Method 4Q 03 Annlzd
Net Income $1,310 $1,072 $1,333 $1,132 $1,330 $1,616 $1,142 $1,420 $938 $1,164
Minority Interest $243 $192 $238 $284 $220 $292 $222 $200 $231 $172
Interest Expense $204 $240 $199 $194 $209 $196 $220 $184 $238 $224
(After-tax)
Numerator
(Sum Total) $1,757 $1,504 $1,770 $1,610 $1,759 $2,104 $1,584 $1,804 $1,407 $1,560
ST Borrowings $341 $321 $370 $543 $332 $540 $318 $554 $348 $386
LT Borrowings $6,335 $6,042 $6,883 $6,219 $7,137 $6,556 $7,727 $6,737 $7,529 $7,175
Preferred Equity $55 $55 $55 $55 $55 $55 $55 $55 $55 $55
Minority Interest $1,378 $1,389 $1,321 $1,330 $1,407 $1,328 $1,364 $1,349 $1,317 $1,310
Common Equity $12,633 $12,873 $11,781 $12,360 $11,277 $12,230 $11,134 $12,130 $10,946 $11,541
Denominator
(Sum Total) $20,742 $20,681 $20,410 $20,508 $20,208 $20,709 $20,598 $20,825 $20,198 $20,470
ROC 8.5% 7.3% 8.7% 7.8% 8.7% 10.2% 7.7% 8.7% 7.0% 7.6%
Notes:
Note: Bloomberg Methodology calculates ROC based on the trailing 4 quarters.
34
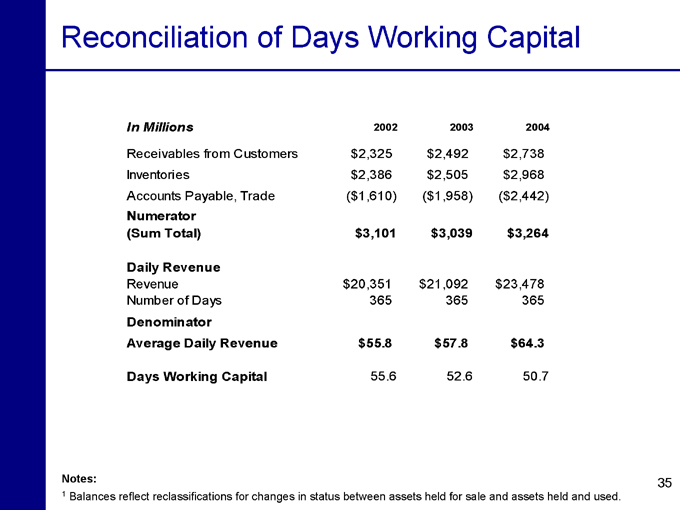
Reconciliation of Days Working Capital
2002 2003 2004
In Millions
Receivables from Customers $2,325 $2,492 $2,738
Inventories $2,386 $2,505 $2,968
Accounts Payable, Trade ($1,610) ($1,958) ($2,442)
Numerator
(Sum Total) $3,101 $3,039 $3,264
Daily Revenue
Revenue $20,351 $21,092 $23,478
Number of Days 365 365 365
Denominator
Average Daily Revenue $55.8 $57.8 $64.3
Days Working Capital 55.6 52.6 50.7
Notes:
1 Balances reflect reclassifications for changes in status between assets held for sale and assets held and used.
35


