Exhibit 99.2
1st Quarter 2005 Analyst Conference
April 6, 2005
Forward-Looking Statements
Today’s discussion may include “forward-looking statements” within the meaning of the Private Securities Litigation Reform Act of 1995. Such statements relate to future events and expectations and involve known and unknown risks and uncertainties. Alcoa’s actual results or actions may differ materially from those projected in the forward-looking statements. For a summary of the specific risk factors that could cause results to differ materially from those expressed in the forward-looking statements, please refer to Alcoa’s Form 10-K for the year ended December 31, 2004 filed with the Securities and Exchange Commission.
2
Richard B. Kelson
Executive Vice President Chief Financial Officer

1st Quarter Overview
Financial
Income from continuing operations of $0.31/share Income from continuing operations included $0.09/share for Russia integration, Elkem tax charge and restructuring charges Revenue up 4% sequentially to $6.3 billion Regained traction on cost savings initiative On a sequential basis, four of six segments achieved double-digit improvements in profitability Trailing 4 quarters ROC of 7.8%
4
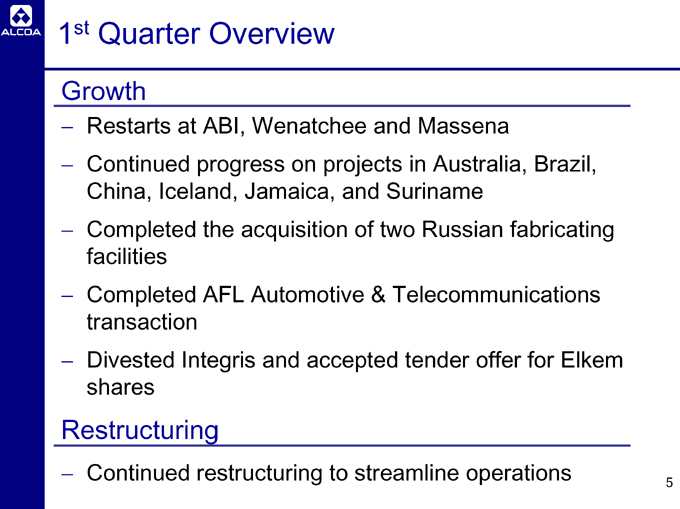
1st Quarter Overview
Growth
Restarts at ABI, Wenatchee and Massena
Continued progress on projects in Australia, Brazil, China, Iceland, Jamaica, and Suriname Completed the acquisition of two Russian fabricating facilities Completed AFL Automotive & Telecommunications transaction Divested Integris and accepted tender offer for Elkem shares
Restructuring
Continued restructuring to streamline operations
5
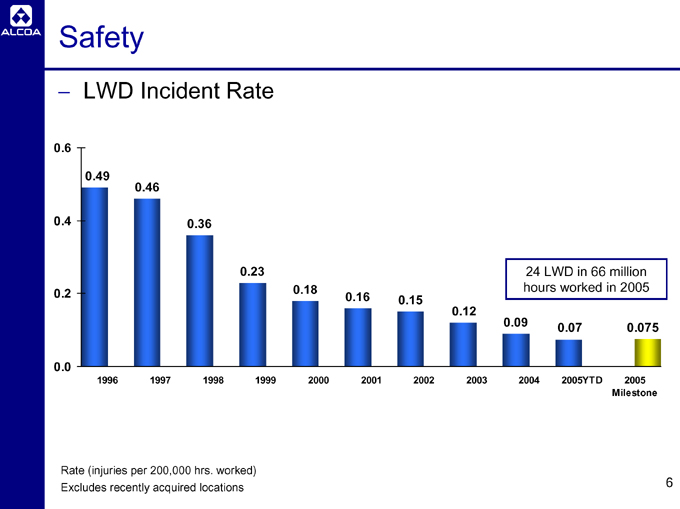
Safety
LWD Incident Rate
0.6 0.4 0.2 0.0
0.49
0.46
0.36
0.23
0.18
0.16
0.15
0.12
0.09
0.07
0.075
1996 1997 1998 1999 2000 2001 2002 2003 2004 2005YTD 2005 Milestone
24 LWD in 66 million hours worked in 2005
Rate (injuries per 200,000 hrs. worked) Excludes recently acquired locations
6
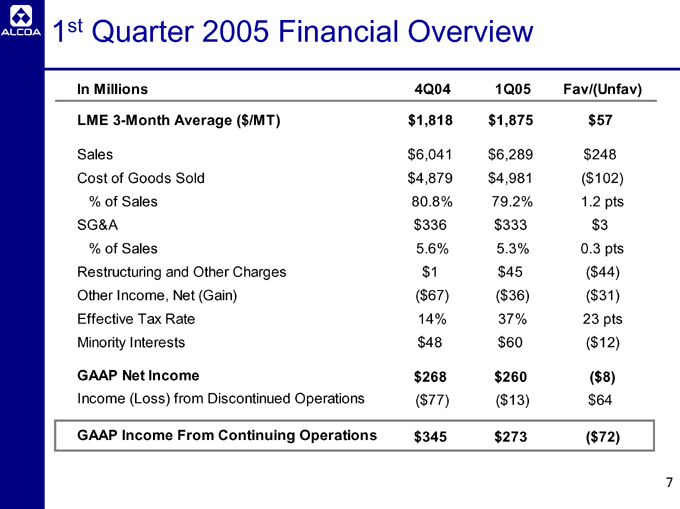
1st Quarter 2005 Financial Overview
In Millions 4Q04 1Q05 Fav/(Unfav)
LME 3-Month Average ($/MT) $1,818 $1,875 $57
Sales $6,041 $6,289 $248
Cost of Goods Sold $4,879 $4,981 ($102)
% of Sales 80.8% 79.2% 1.2 pts
SG&A $336 $ 333 $3
% of Sales 5.6% 5.3% 0.3 pts
Restructuring and Other Charges $1 $ 45 ($44)
Other Income, Net (Gain) ($67) ($ 36) ($31)
Effective Tax Rate 14% 37% 23 pts
Minority Interests $48 $60 ($12)
GAAP Net Income $268 $260 ($8)
Income (Loss) from Discontinued Operations ($77) ($13) $64
GAAP Income From Continuing Operations $345 $273 ($72)
7
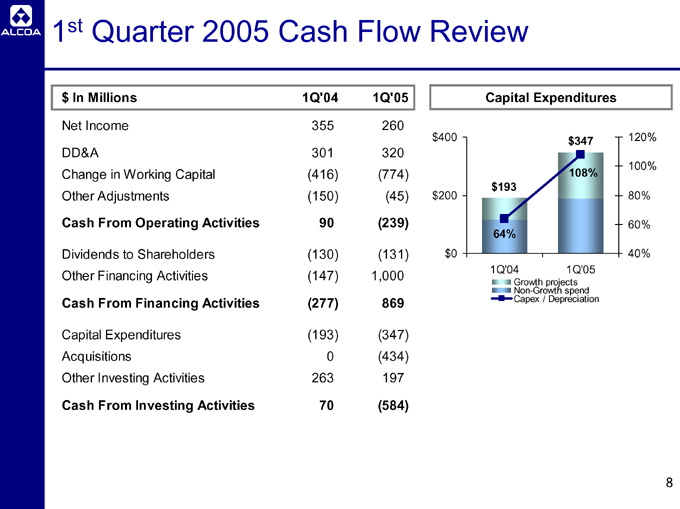
1st Quarter 2005 Cash Flow Review
$ In Millions 1Q’04 1Q’05
Net Income 355 260
DD&A 301 320
Change in Working Capital (416) (774)
Other Adjustments (150) (45)
Cash From Operating Activities 90 (239)
Dividends to Shareholders (130) (131)
Other Financing Activities (147) 1,000
Cash From Financing Activities (277) 869
Capital Expenditures (193) (347)
Acquisitions 0 (434)
Other Investing Activities 263 197
Cash From Investing Activities 70 (584)
Capital Expenditures $400 $200 $0
120% 100% 80% 60% 40% $193 $347 64% 108%
1Q’04 1Q’05
Growth projects Non-Growth spend Capex / Depreciation
8
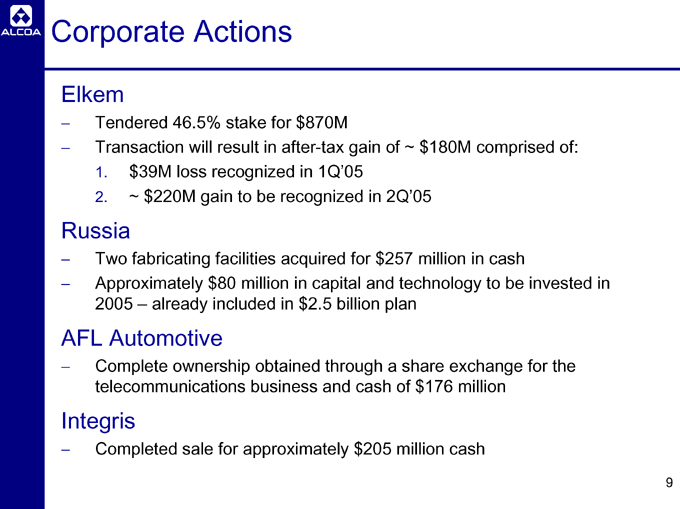
Corporate Actions
Elkem
Tendered 46.5% stake for $870M
Transaction will result in after-tax gain of ~ $180M comprised of:
1. $39M loss recognized in 1Q’05
2. ~ $220M gain to be recognized in 2Q’05
Russia
Two fabricating facilities acquired for $257 million in cash
Approximately $80 million in capital and technology to be invested in 2005 – already included in $2.5 billion plan
AFL Automotive
Complete ownership obtained through a share exchange for the telecommunications business and cash of $176 million
Integris
Completed sale for approximately $205 million cash
9
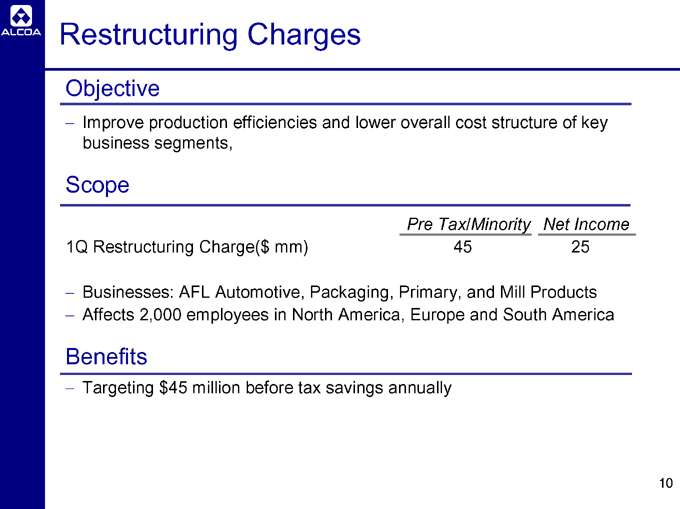
Restructuring Charges
Objective
Improve production efficiencies and lower overall cost structure of key business segments,
Scope
Pre Tax/Minority Net Income
1Q Restructuring Charge($ mm) 45 25
Businesses: AFL Automotive, Packaging, Primary, and Mill Products Affects 2,000 employees in North America, Europe and South America
Benefits
Targeting $45 million before tax savings annually
10
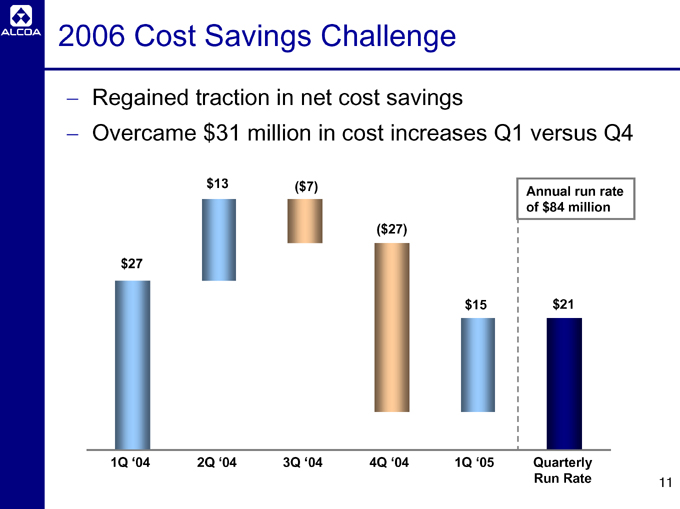
2006 Cost Savings Challenge
Regained traction in net cost savings
Overcame $31 million in cost increases Q1 versus Q4 $27 $13
($7)
($27) $15 $21
Annual run rate of $84 million
1Q ‘04 2Q ‘04 3Q ‘04 4Q ‘04 1Q ‘05 Quarterly Run Rate
11
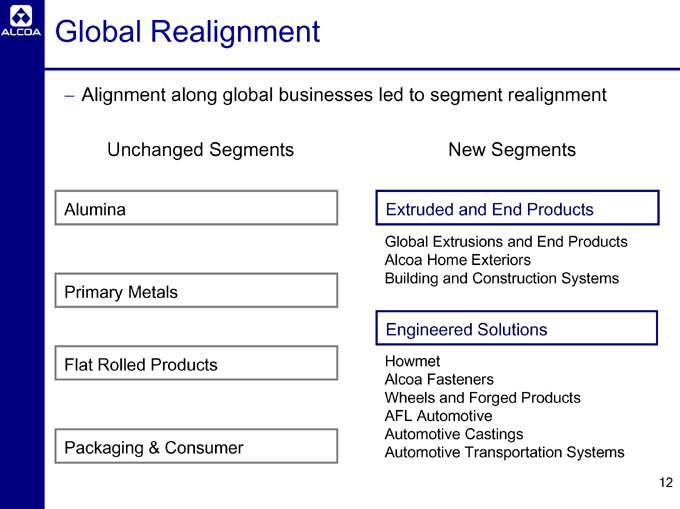
Global Realignment
Alignment along global businesses led to segment realignment
Unchanged Segments
Alumina Primary Metals Flat Rolled Products Packaging & Consumer
New Segments
Extruded and End Products
Global Extrusions and End Products Alcoa Home Exteriors Building and Construction Systems
Engineered Solutions
Howmet Alcoa Fasteners
Wheels and Forged Products AFL Automotive Automotive Castings Automotive Transportation Systems
12
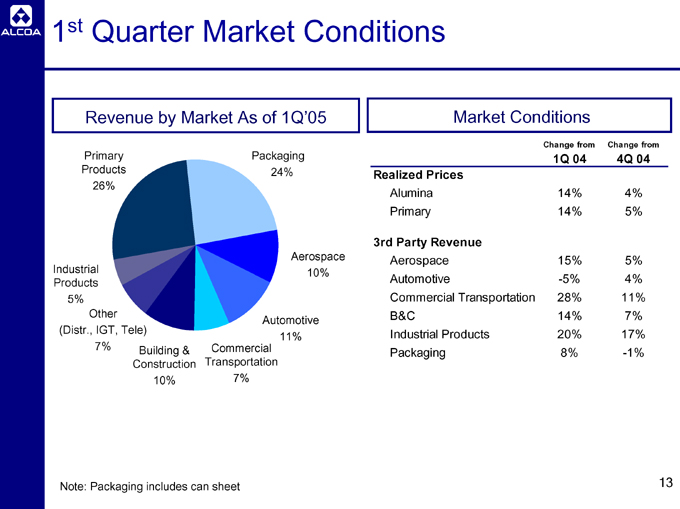
1st Quarter Market Conditions
Revenue by Market As of 1Q’05
Primary Products 26%
Industrial Products 5%
Other (Distr., IGT, Tele) 7%
Commercial Transportation 7%
Automotive 11%
Aerospace 10%
Packaging 24%
Market Conditions
Building & Construction 10%
Change from 1Q 04 Change from 4Q 04
Realized Prices
Alumina 14% 4%
Primary 14% 5%
3rd Party Revenue
Aerospace 15% 5%
Automotive -5% 4%
Commercial Transportation 28% 11%
B&C 14% 7%
Industrial Products 20% 17%
Packaging 8% -1%
Note: Packaging includes can sheet
13
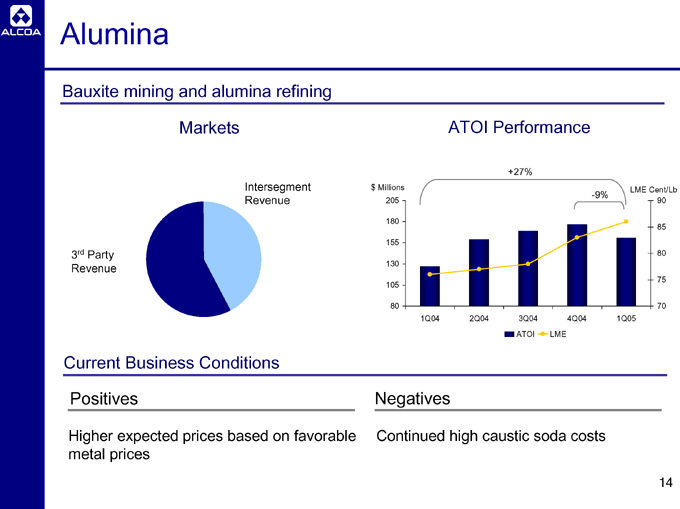
Alumina
Bauxite mining and alumina refining
Markets
3rd Party Revenue
Intersegment Revenue
Current Business Conditions
ATOI Performance $ Millions 205
180 155 130 105 80
+27%
-9%
LME Cent/Lb
90 85 80 75 70
1Q04 2Q04 3Q04 4Q04 1Q05 ATOI LME
Positives
Higher expected prices based on favorable metal prices
Negatives
Continued high caustic soda costs
14
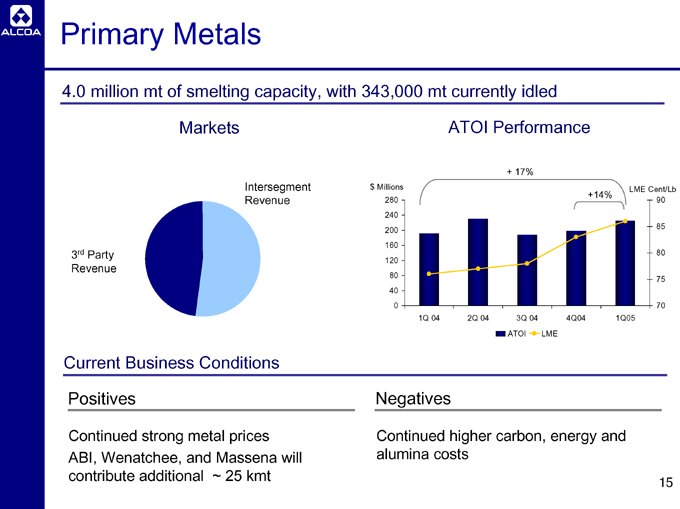
Primary Metals
4.0 million mt of smelting capacity, with 343,000 mt currently idled
Markets
3rd Party Revenue
Intersegment Revenue
ATOI Performance $ Millions 280 240 200 160 120 80 40 0
+ 17%
+14%
LME Cent/Lb
90 85 80 75 70
1Q 04 2Q 04 3Q 04 4Q04 1Q05 ATOI LME
Current Business Conditions
Positives
Continued strong metal prices ABI, Wenatchee, and Massena will contribute additional ~ 25 kmt
Negatives
Continued higher carbon, energy and alumina costs
15
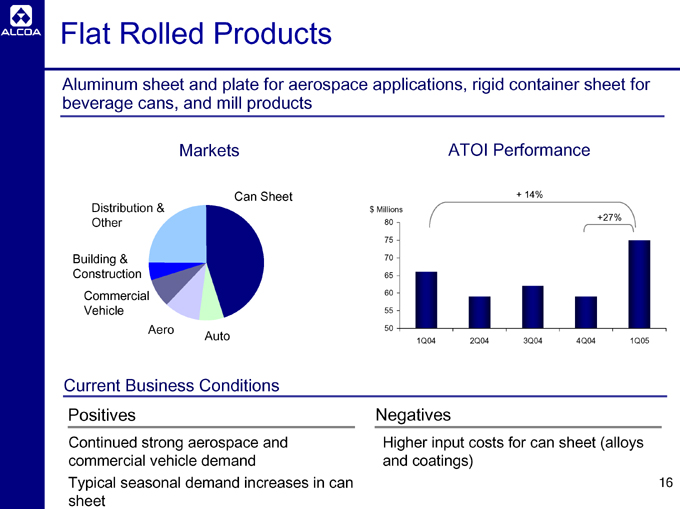
Flat Rolled Products
Aluminum sheet and plate for aerospace applications, rigid container sheet for beverage cans, and mill products
Markets
Distribution & Other
Building & Construction
Commercial Vehicle
Aero
Auto
Can Sheet
ATOI Performance $ Millions 80
75 70 65 60 55 50
+ 14%
+27%
1Q04 2Q04 3Q04 4Q04 1Q05
Current Business Conditions
Positives
Continued strong aerospace and commercial vehicle demand
Typical seasonal demand increases in can sheet
Negatives
Higher input costs for can sheet (alloys and coatings)
16
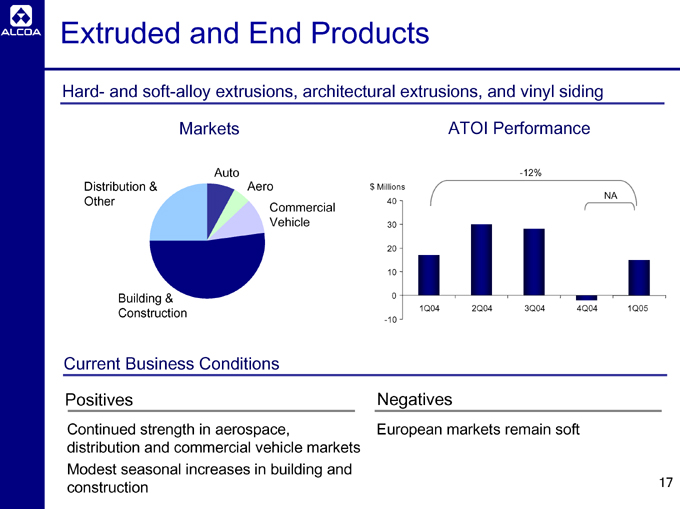
Extruded and End Products
Hard- and soft-alloy extrusions, architectural extrusions, and vinyl siding
Markets
Distribution & Other
Building & Construction
Auto
Aero
Commercial Vehicle
ATOI Performance $ Millions 40
30 20 10 0 -10
-12%
NA
1Q04 2Q04 3Q04 4Q04 1Q05
Current Business Conditions
Positives
Continued strength in aerospace, distribution and commercial vehicle markets Modest seasonal increases in building and construction
Negatives
European markets remain soft
17
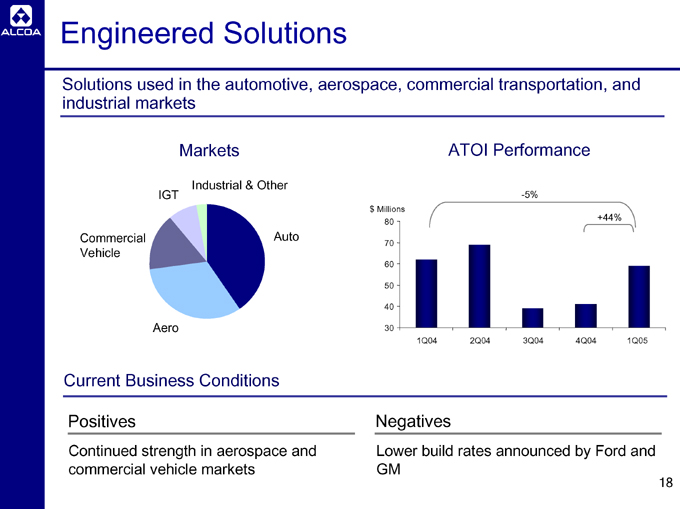
Engineered Solutions
Solutions used in the automotive, aerospace, commercial transportation, and industrial markets
Markets
IGT
Commercial Vehicle
Aero
Industrial & Other
Auto
ATOI Performance $ Millions 80
70 60 50 40 30
-5%
+44%
1Q04 2Q04 3Q04 4Q04 1Q05
Current Business Conditions
Positives
Continued strength in aerospace and commercial vehicle markets
Negatives
Lower build rates announced by Ford and GM
18
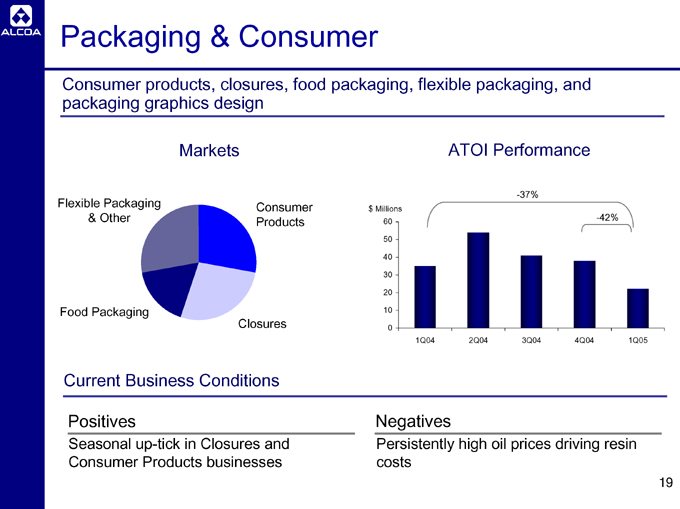
Packaging & Consumer
Consumer products, closures, food packaging, flexible packaging, and packaging graphics design
Markets
Flexible Packaging & Other
Food Packaging
Consumer Products
Closures
ATOI Performance $ Millions
60 50 40 30 20 10 0
-37%
-42%
1Q04 2Q04 3Q04 4Q04 1Q05
Current Business Conditions
Positives
Seasonal up-tick in Closures and Consumer Products businesses
Negatives
Persistently high oil prices driving resin costs
19
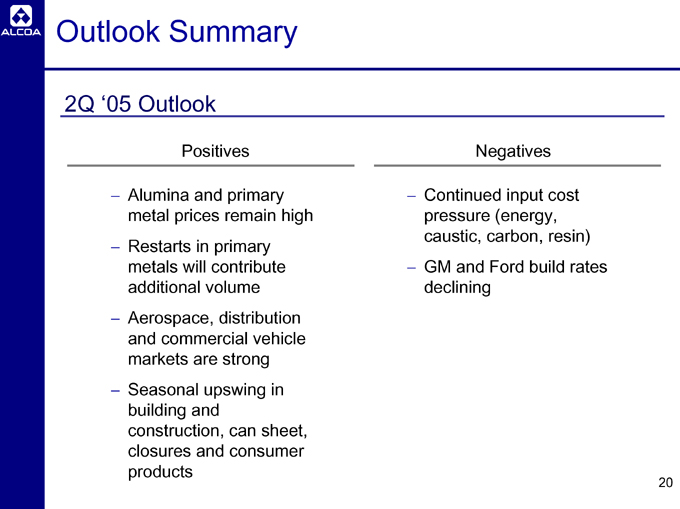
Outlook Summary
2Q ‘05 Outlook
Positives
Alumina and primary metal prices remain high Restarts in primary metals will contribute additional volume Aerospace, distribution and commercial vehicle markets are strong Seasonal upswing in building and construction, can sheet, closures and consumer products
Negatives
Continued input cost pressure (energy, caustic, carbon, resin) GM and Ford build rates declining
20
Bernt Reitan
Executive Vice President – Alcoa Group President, Primary Products
Global Trends will Drive Demand Growth
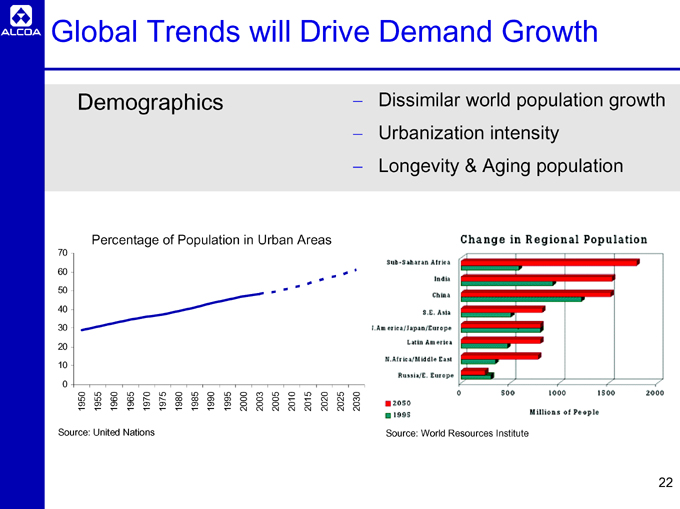
Demographics
Dissimilar world population growth Urbanization intensity Longevity & Aging population
Percentage of Population in Urban Areas
70
60 50
40 30
20 10
0
1950 1955 1960 1965 1970 1975 1980 1985 1990 1995 2000 2003 2005 2010 2015 2020 2025 2030
Source: United Nations
Source: World Resources Institute
22
Global Trends will Drive Demand Growth
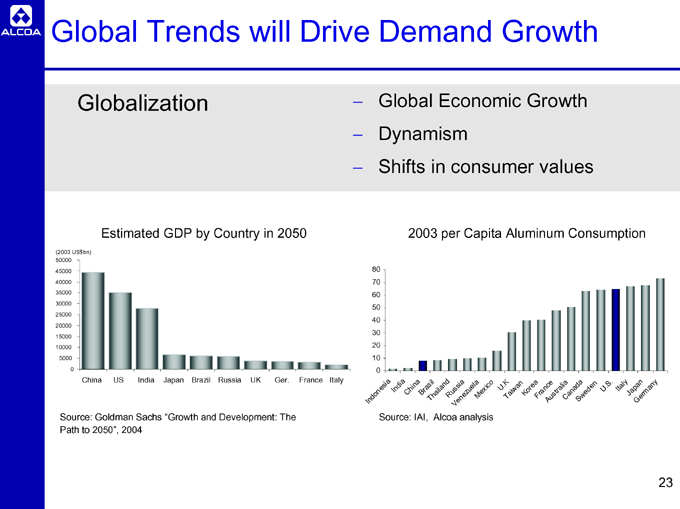
Globalization
Global Economic Growth Dynamism Shifts in consumer values
Estimated GDP by Country in 2050
(2003 US$bn)
50000 45000 40000 35000 30000 25000 20000 15000 10000 5000 0
China US India Japan Brazil Russia UK Ger. France Italy
Source: Goldman Sachs “Growth and Development: The Path to 2050”, 2004
2003 per Capita Aluminum Consumption
80 70 60 50 40 30 20 10 0
Indonesia India
China Brasil Thailand Russia Venezuela Mexico U.K Taiwan Korea France Australia Canada Sweden U.S. Italy Japan Germany
Source: IAI, Alcoa analysis
23
Strong Fundamentals through 2006
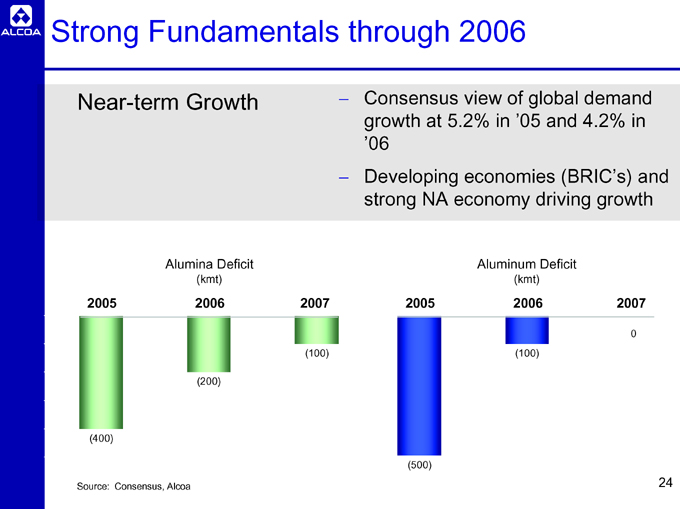
Near-term Growth
Consensus view of global demand growth at 5.2% in ‘05 and 4.2% in ‘06 Developing economies (BRIC’s) and strong NA economy driving growth
2005
Alumina Deficit
(kmt)
2006
2007
2005
Aluminum Deficit
(kmt)
2006
2007
(400)
(200)
(100)
(500)
(100)
0
Source: Consensus, Alcoa
24
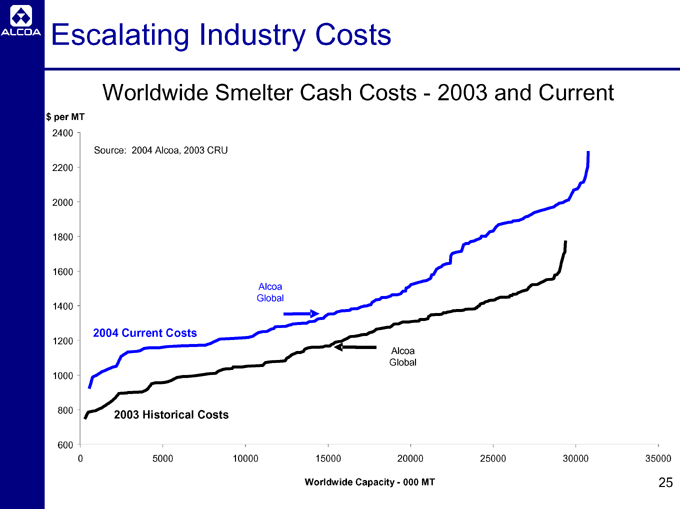
Escalating Industry Costs
Worldwide Smelter Cash Costs - 2003 and Current $ per MT
2400 2200 2000 1800 1600 1400 1200 1000 800 600
0 5000 10000 15000 20000 25000 30000 35000
Source: 2004 Alcoa, 2003 CRU
2004 Current Costs
Alcoa Global
Alcoa Global
2003 Historical Costs
Worldwide Capacity - 000 MT
25

Managing the System
Alumina Production Improvement
Indexed to 2001
1.0 1.07 1.13 1.17
2001 2002 2003 2004
Alumina Productivity Improvement
Indexed to 2001
1.0 1.14 1.22 1.34
2001 2002 2003 2004
Smelting Production Improvement
Indexed to 2001 -Continuously operating smelters
1.0
1.03
1.06
1.08
2001 2002 2003 2004
Smelting Productivity Improvement
Indexed to 2001
1.0
1.05
1.16
1.19
2001 2002 2003 2004
26
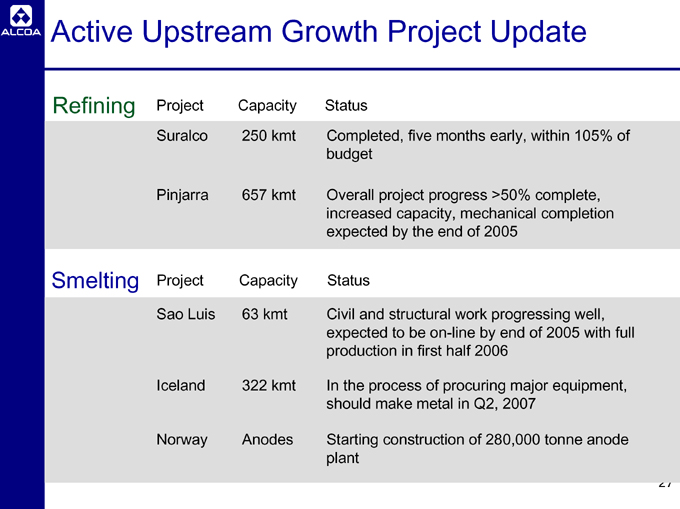
Active Upstream Growth Project Update
Refining Project Capacity Status
Suralco 250 kmt Completed, five months early, within 105% of budget
Pinjarra 657 kmt Overall project progress >50% complete, increased capacity, mechanical completion expected by the end of 2005
Smelting Project Capacity Status
Sao Luis 63 kmt Civil and structural work progressing well, expected to be on-line by end of 2005 with full production in first half 2006
Iceland 322 kmt In the process of procuring major equipment, should make metal in Q2, 2007
Norway Anodes Starting construction of 280,000 tonne anode plant
27
Alcoa’s Upstream Opportunity
Strong underlying growth dynamics Current strong market fundamentals
Our Focus
Safety and environmental compliance Operational excellence through ABS Creep Productivity improvements Cost control
Enhanced revenue through value added products Value creating growth opportunities
28
For Additional Information, contact:
William F. Oplinger Director, Investor Relations
Alcoa
390 Park Avenue
New York, N.Y. 10022-4608 Telephone: (212) 836-2674 Facsimile: (212) 836-2813 www.alcoa.com
29
Appendix
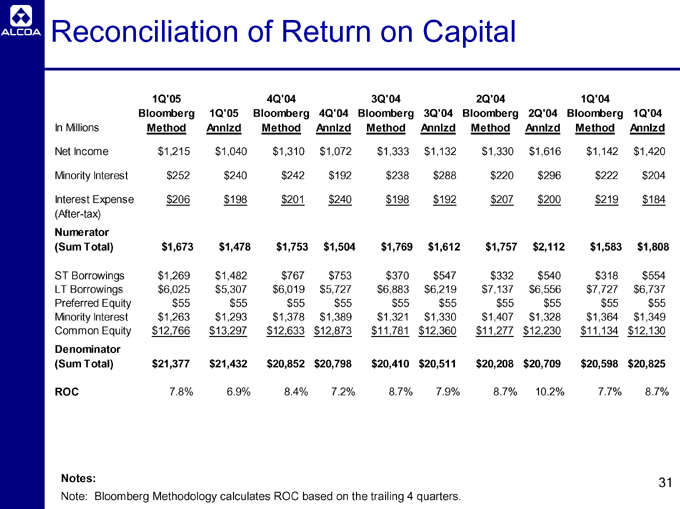
Reconciliation of Return on Capital
In Millions 1Q’05 Bloomberg Method 1Q’05 Annlzd 4Q’04 Bloomberg Method 4Q’04 Annlzd 3Q’04 Bloomberg Method 3Q’04 Annlzd 2Q’04 Bloomberg Method 2Q’04 Annlzd 1Q’04 Bloomberg Method 1Q’04 Annlzd
Net Income $1,215 $1,040 $1,310 $1,072 $1,333 $1,132 $1,330 $1,616 $1,142 $1,420
Minority Interest $252 $240 $242 $192 $238 $288 $220 $296 $222 $204
Interest Expense $206 $198 $201 $240 $198 $192 $207 $200 $219 $184
(After-tax)
Numerator
(Sum Total) $1,673 $1,478 $1,753 $1,504 $1,769 $1,612 $1,757 $2,112 $1,583 $1,808
ST Borrowings $1,269 $1,482 $767 $753 $370 $547 $332 $540 $318 $554
LT Borrowings $6,025 $5,307 $6,019 $5,727 $6,883 $6,219 $7,137 $6,556 $7,727 $6,737
Preferred Equity $55 $55 $55 $55 $55 $55 $55 $55 $55 $55
Minority Interest $1,263 $1,293 $1,378 $1,389 $1,321 $1,330 $1,407 $1,328 $1,364 $1,349
Common Equity $12,766 $13,297 $12,633 $12,873 $11,781 $12,360 $11,277 $12,230 $11,134 $12,130
Denominator
(Sum Total) $21,377 $21,432 $20,852 $20,798 $20,410 $20,511 $20,208 $20,709 $20,598 $20,825
ROC 7.8% 6.9% 8.4% 7.2% 8.7% 7.9% 8.7% 10.2% 7.7% 8.7%
Notes:
Note: Bloomberg Methodology calculates ROC based on the trailing 4 quarters.
31