Exhibit 99.2
Merrill Lynch Global Metals, Mining and Steel Conference
Richard B. Kelson
Executive Vice President, Chief Financial Officer
May 10, 2005
Forward-Looking Statements
Today’s discussion may include “forward-looking statements” within the meaning of the Private Securities Litigation Reform Act of 1995. Such statements relate to future events and expectations and involve known and unknown risks and uncertainties. Alcoa’s actual results or actions may differ materially from those projected in the forward-looking statements. For a summary of the specific risk factors that could cause results to differ materially from those expressed in the forward-looking statements, please refer to Alcoa’s Form 10-K for the year ended December 31, 2004 and Form 10-Q for the quarter ended March 31, 2005 filed with the Securities and Exchange Commission.
2
The Alcoa Investment Opportunity
Values driven organization
Broad market and geographic presence Commitment to operational excellence through the application of ABS
Unmatched growth opportunities Significant upside potential
3
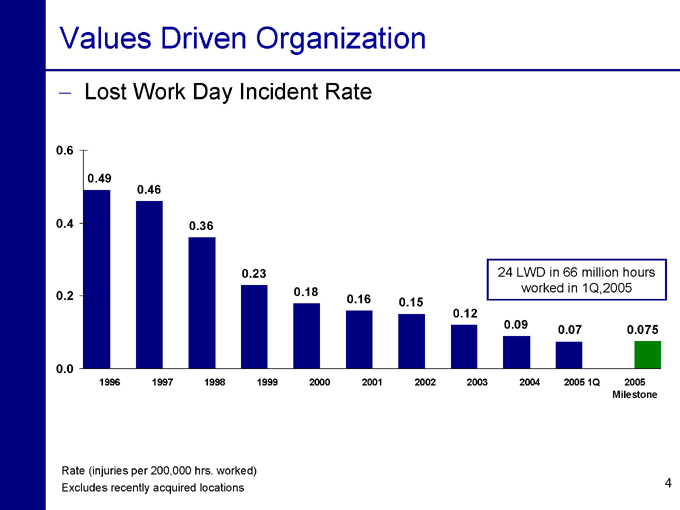
Values Driven Organization
Lost Work Day Incident Rate
0.6
0.4
0.2
0.0
24 LWD in 66 million hours worked in 1Q,2005
0.49
0.46
0.36
0.23
0.18
0.16
0.15
0.12
0.09
0.07
0.075
1996 1997 1998 1999 2000 2001 2002 2003 2004 2005 1Q 2005 Milestone
Rate (injuries per 200,000 hrs. worked) Excludes recently acquired locations
4
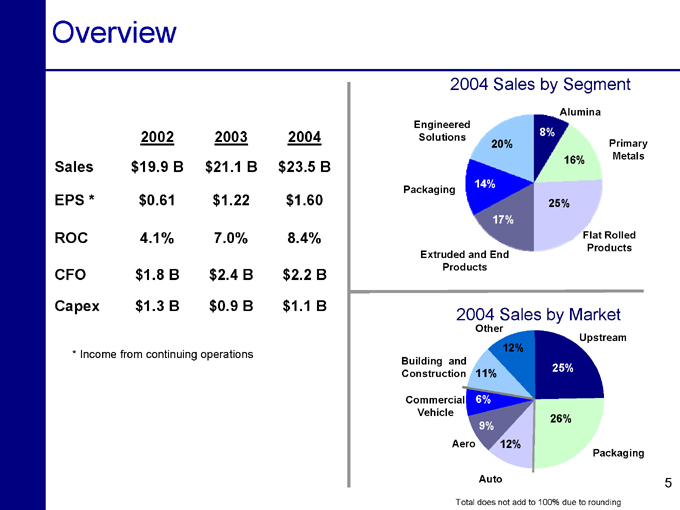
Overview
2002 2003 2004
Sales $19.9 B $21.1 B $23.5 B
EPS * $0.61 $1.22 $1.60
ROC 4.1% 7.0% 8.4%
CFO $1.8 B $2.4 B $2.2 B
Capex $1.3 B $0.9 B $1.1 B
* Income from continuing operations
2004 Sales by Segment
Engineered Solutions
20%
Packaging
14%
Extruded and End Products
17%
Flat Rolled Products
25%
Primary Metals
16%
Alumina
8%
2004 Sales by Market
Other
12%
Building and Construction
11%
Commercial Vehicle
6%
Aero
9%
Auto
12%
Packaging
26%
Upstream
25%
Total does not add to 100% due to rounding
5

Broad Geographic Presence
450 Locations 131,000 Employees
2004 Sales by Geography
Pacific
Europe
ROW
US
61%
22%
11%
6%
6
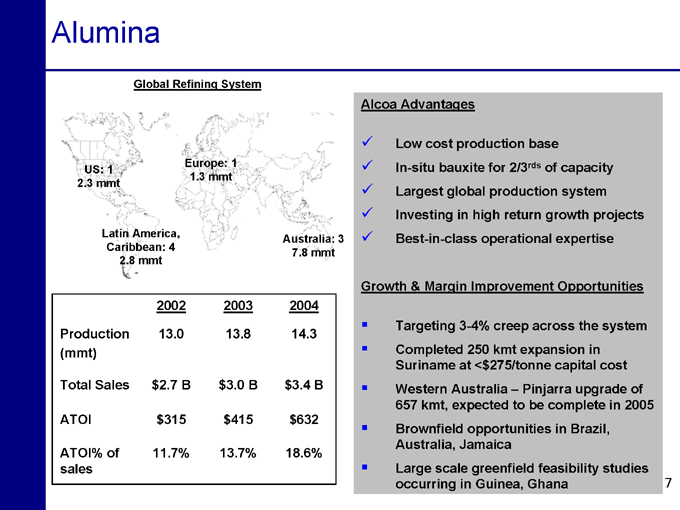
Alumina
Global Refining System
US: 1 2.3 mmt
Europe: 1 1.3 mmt
Latin America, Caribbean: 4 2.8 mmt
Australia: 3 7.8 mmt
Alcoa Advantages
Low cost production base
In-situ bauxite for 2/3rds of capacity Largest global production system Investing in high return growth projects Best-in-class operational expertise
Growth & Margin Improvement Opportunities
Targeting 3-4% creep across the system Completed 250 kmt expansion in Suriname at <$275/tonne capital cost Western Australia – Pinjarra upgrade of 657 kmt, expected to be complete in 2005 Brownfield opportunities in Brazil, Australia, Jamaica Large scale greenfield feasibility studies occurring in Guinea, Ghana
2002 2003 2004
Production 13.0 13.8 14.3
(mmt)
Total Sales $2.7 B $3.0 B $3.4 B
ATOI $315 $415 $632
ATOI% of 11.7% 13.7% 18.6%
sales
7
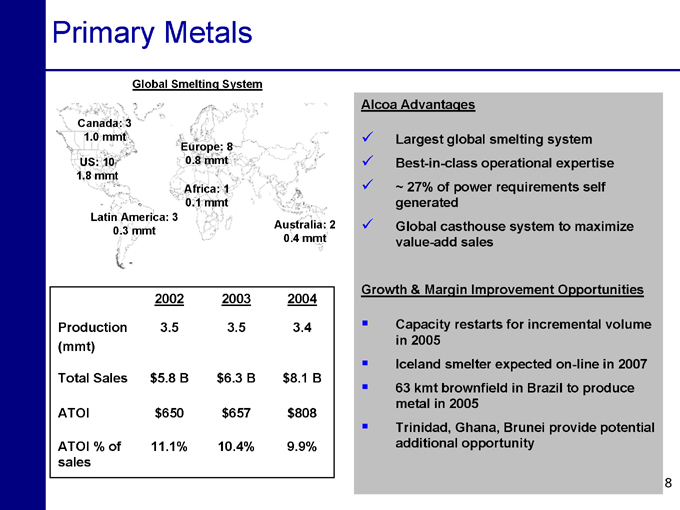
Primary Metals
Global Smelting System
Canada: 3 1.0 mmt
US: 10 1.8 mmt
Europe: 8 0.8 mmt
Latin America: 3 0.3 mmt
Africa: 1 0.1 mmt
Australia: 2 0.4 mmt
2002 2003 2004
Production 3.5 3.5 3.4
(mmt)
Total Sales $5.8 B $6.3 B $8.1 B
ATOI $650 $657 $808
ATOI % of 11.1% 10.4% 9.9%
sales
Alcoa Advantages
Largest global smelting system Best-in-class operational expertise ~ 27% of power requirements self generated Global casthouse system to maximize value-add sales
Growth & Margin Improvement Opportunities
Capacity restarts for incremental volume in 2005 Iceland smelter expected on-line in 2007 63 kmt brownfield in Brazil to produce metal in 2005 Trinidad, Ghana, Brunei provide potential additional opportunity
8
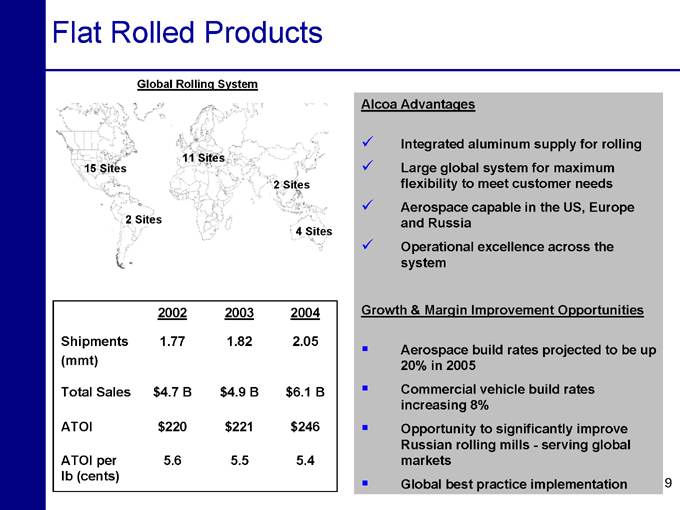
Flat Rolled Products
Global Rolling System
15 Sites
2 Sites
11 Sites
2 Sites
4 Sites
2002 2003 2004
Shipments 1.77 1.82 2.05
(mmt)
Total Sales $4.7 B $4.9 B $6.1 B
ATOI $220 $221 $246
ATOI per 5.6 5.5 5.4
lb (cents)
Alcoa Advantages
Integrated aluminum supply for rolling Large global system for maximum flexibility to meet customer needs Aerospace capable in the US, Europe and Russia Operational excellence across the system
Growth & Margin Improvement Opportunities
Aerospace build rates projected to be up 20% in 2005 Commercial vehicle build rates increasing 8% Opportunity to significantly improve Russian rolling mills—serving global markets Global best practice implementation
9
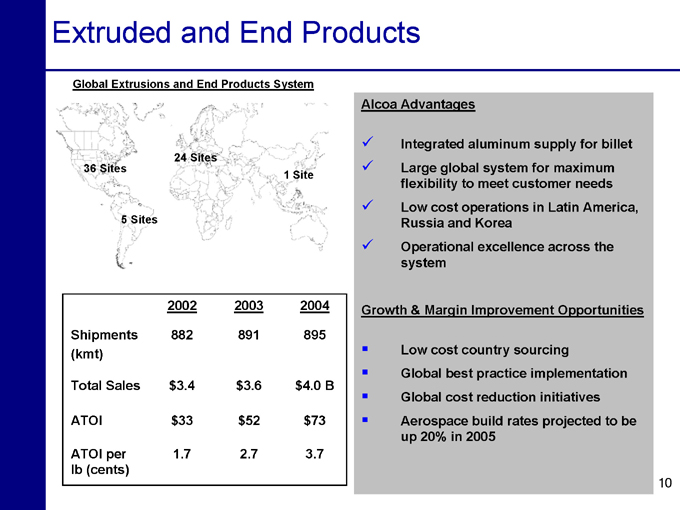
Extruded and End Products
Global Extrusions and End Products System
36 Sites
5 Sites
24 Sites
1 Site
2002 2003 2004
Shipments 882 891 895
(kmt)
Total Sales $3.4 $3.6 $4.0 B
ATOI $33 $52 $73
ATOI per 1.7 2.7 3.7
lb (cents)
Alcoa Advantages
Integrated aluminum supply for billet Large global system for maximum flexibility to meet customer needs Low cost operations in Latin America, Russia and Korea Operational excellence across the system
Growth & Margin Improvement Opportunities
Low cost country sourcing
Global best practice implementation Global cost reduction initiatives Aerospace build rates projected to be up 20% in 2005
10
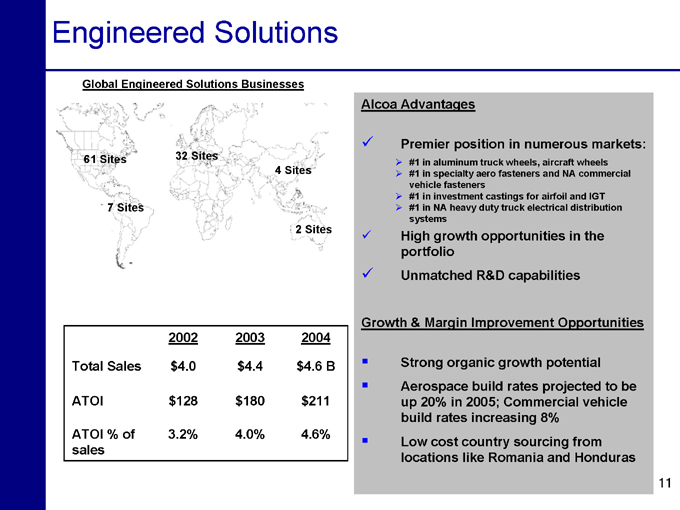
Engineered Solutions
Global Engineered Solutions Businesses
61 Sites
7 Sites
32 Sites
4 Sites
2 Sites
2002 2003 2004
Total Sales $4.0 $4.4 $4.6 B
ATOI $128 $180 $211
ATOI % of 3.2% 4.0% 4.6%
sales
Alcoa Advantages
Premier position in numerous markets:
#1 in aluminum truck wheels, aircraft wheels #1 in specialty aero fasteners and NA commercial vehicle fasteners #1 in investment castings for airfoil and IGT #1 in NA heavy duty truck electrical distribution systems
High growth opportunities in the portfolio Unmatched R&D capabilities
Growth & Margin Improvement Opportunities
Strong organic growth potential Aerospace build rates projected to be up 20% in 2005; Commercial vehicle build rates increasing 8% Low cost country sourcing from locations like Romania and Honduras
11
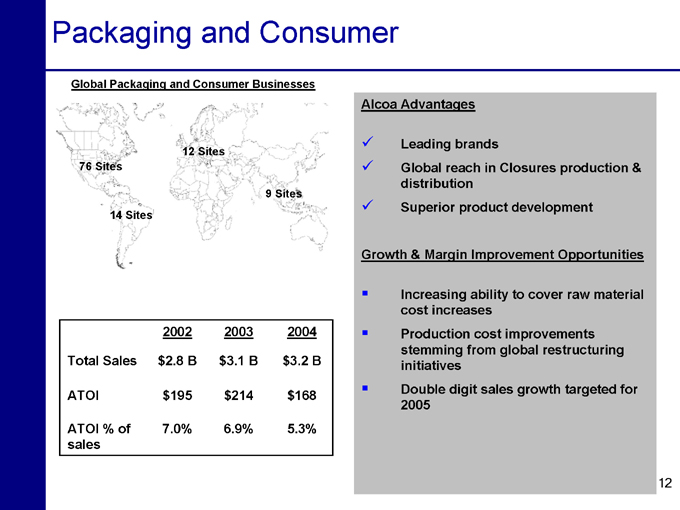
Packaging and Consumer
Global Packaging and Consumer Businesses
76 Sites
14 Sites
12 Sites
9 Sites
2002 2003 2004
Total Sales $2.8 B $3.1 B $3.2 B
ATOI $195 $214 $168
ATOI % of 7.0% 6.9% 5.3%
sales
Alcoa Advantages
Leading brands
Global reach in Closures production & distribution Superior product development
Growth & Margin Improvement Opportunities
Increasing ability to cover raw material cost increases Production cost improvements stemming from global restructuring initiatives Double digit sales growth targeted for 2005
12
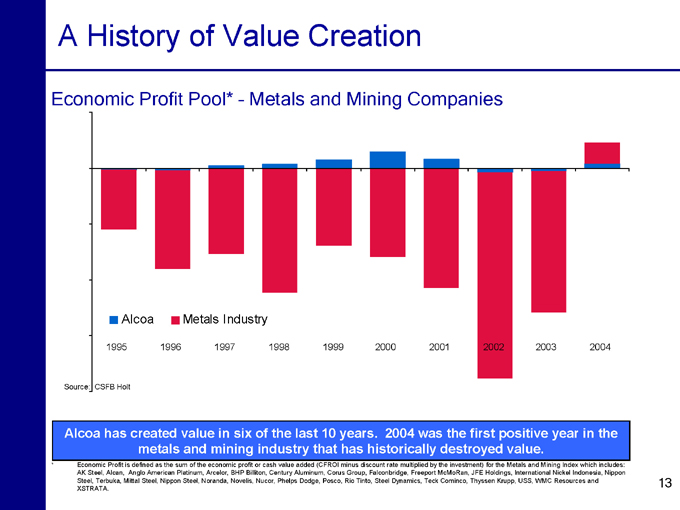
A History of Value Creation
Economic Profit Pool* – Metals and Mining Companies
Alcoa
Metals Industry
1995 1996 1997 1998 1999 2000 2001
2002
2003
2004
Source:
CSFB Holt
Alcoa has created value in six of the last 10 years. 2004 was the first positive year in the metals and mining industry that has historically destroyed value.
Economic Profit is defined as the sum of the economic profit or cash value added (CFROI minus discount rate multiplied by the investment) for the Metals and Mining Index which includes: AK Steel, Alcan, Anglo American Platinum, Arcelor, BHP Billiton, Century Aluminum, Corus Group, Falconbridge, Freeport McMoRan, JFE Holdings, International Nickel Indonesia, Nippon Steel, Terbuka, Mittal Steel, Nippon Steel, Noranda, Novelis, Nucor, Phelps Dodge, Posco, Rio Tinto, Steel Dynamics, Teck Cominco, Thyssen Krupp, USS, WMC Resources and XSTRATA.
13
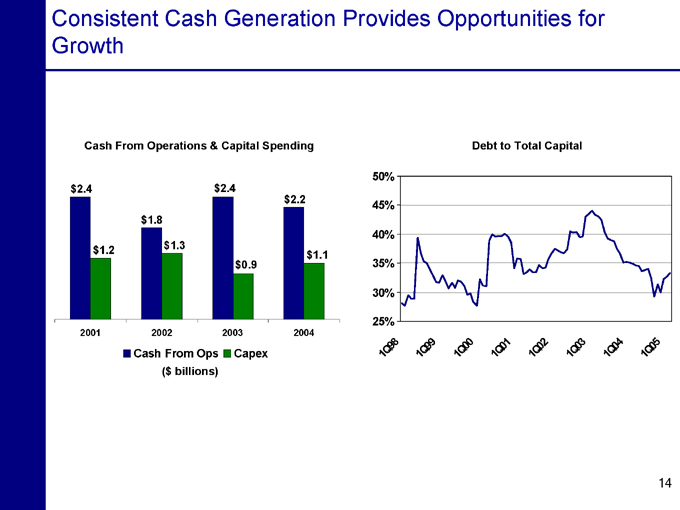
Consistent Cash Generation Provides Opportunities for Growth
Cash From Operations & Capital Spending $2.4 $1.2 $1.8 $1.3 $2.4 $0.9 $2.2 $1.1
2001 2002 2003 2004
Cash From Ops
Capex
($ billions)
Debt to Total Capital
50% 45% 40% 35% 30% 25%
1Q98
1Q99
1Q00
1Q01
1Q02
1Q03
1Q04
1Q05
14
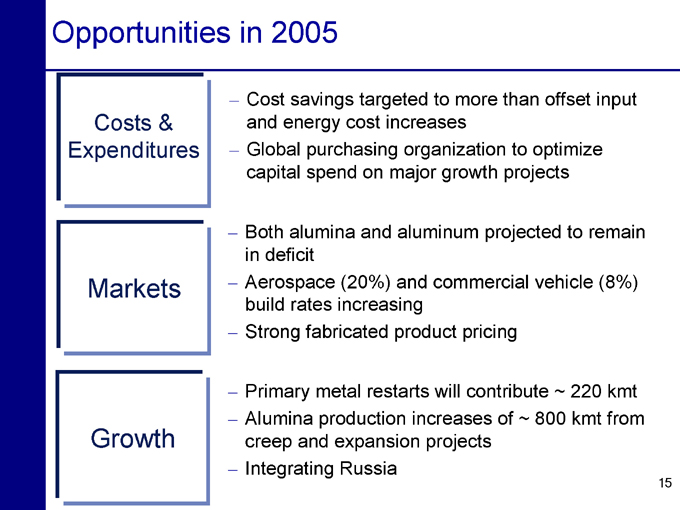
Opportunities in 2005
Costs & Expenditures
Cost savings targeted to more than offset input and energy cost increases Global purchasing organization to optimize capital spend on major growth projects
Markets
Both alumina and aluminum projected to remain in deficit Aerospace (20%) and commercial vehicle (8%) build rates increasing Strong fabricated product pricing
Growth
Primary metal restarts will contribute ~ 220 kmt Alumina production increases of ~ 800 kmt from creep and expansion projects Integrating Russia
15
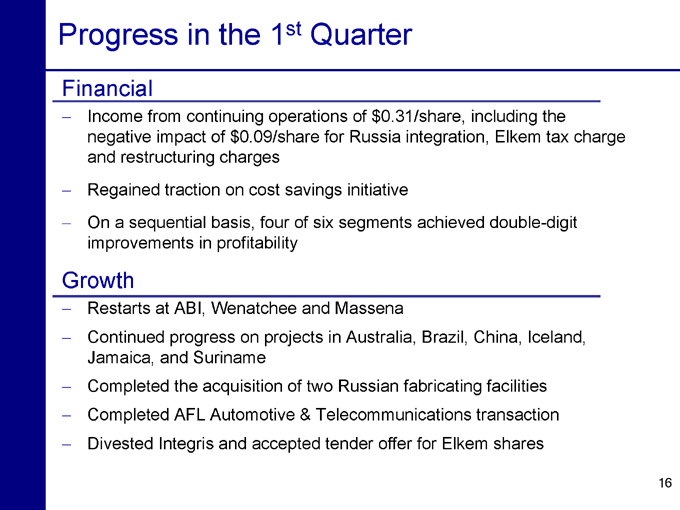
Progress in the 1st Quarter
Financial
Income from continuing operations of $0.31/share, including the negative impact of $0.09/share for Russia integration, Elkem tax charge and restructuring charges Regained traction on cost savings initiative On a sequential basis, four of six segments achieved double-digit improvements in profitability
Growth
Restarts at ABI, Wenatchee and Massena
Continued progress on projects in Australia, Brazil, China, Iceland, Jamaica, and Suriname Completed the acquisition of two Russian fabricating facilities Completed AFL Automotive & Telecommunications transaction Divested Integris and accepted tender offer for Elkem shares
16
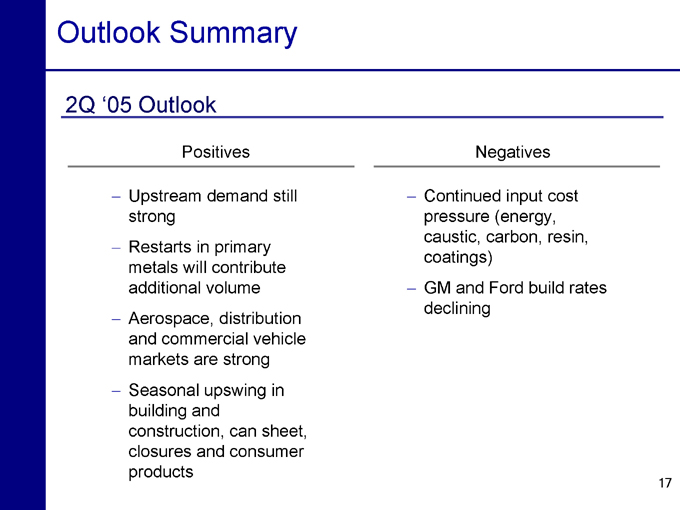
Outlook Summary
2Q ‘05 Outlook
Positives
Upstream demand still strong Restarts in primary metals will contribute additional volume Aerospace, distribution and commercial vehicle markets are strong Seasonal upswing in building and construction, can sheet, closures and consumer products
Negatives
Continued input cost pressure (energy, caustic, carbon, resin, coatings) GM and Ford build rates declining
17
The Alcoa Investment Opportunity
Values driven organization
Broad market and geographic presence Commitment to operational excellence through the application of ABS
Unmatched growth opportunities Significant upside potential
18
Appendix

Reconciliation of Return on Capital
In Millions 2004 2003 2002
Net Income $1,310 $938 $420
Minority Interest $242 $238 $135
Interest Expense $201 $237 $237
(After-tax)
Numerator (Sum Total) $1,753 $1,413 $792
ST Borrowings $767 $348 $193
LT Borrowings $6,019 $7,530 $7,375
Preferred Equity $55 $55 $56
Minority Interest $1,378 $1,317 $1,303
Common Equity $12,633 $10,946 $10,215
Denominator (Sum
Total) $20,852 $20,194 $19,142
ROC 8.4% 7.0% 4.1%
Note: Bloomberg Methodology calculates ROC based on the trailing 4 quarters.
20


