Exhibit 99.2
[Alcoa logo]
Quarter 2005 October 10, 2005
rd
Forward-Looking Statements
Today’s discussion may include “forward-looking statements” within the meaning of the Private Securities Litigation Reform Act of 1995. Such statements relate to future events and expectations and involve known and unknown risks and uncertainties. Alcoa’s actual results or actions may differ materially from those projected in the forward-looking statements. For a summary of the specific risk factors that could cause results to differ materially from those expressed in the forward-looking statements, please refer to Alcoa’s Form 10-K for the year ended December 31, 2004 and Form 10-Q for the quarter ended June 30, 2005 filed with the Securities and Exchange Commission.
2

Richard B. Kelson Executive Vice President Chief Financial Officer
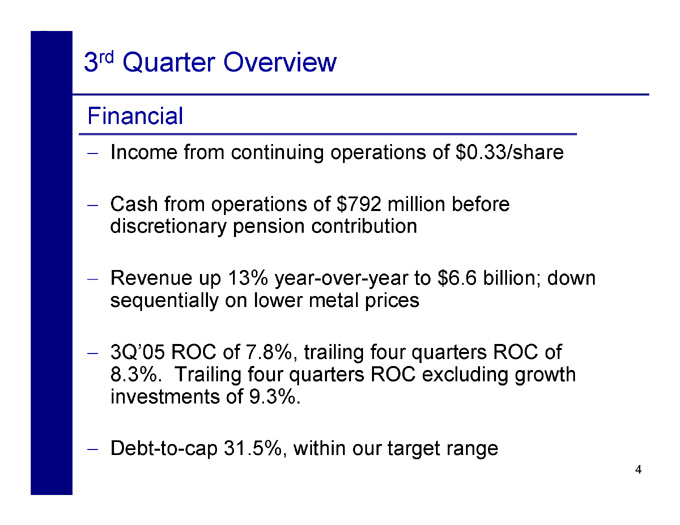
3rd Quarter Overview
Financial
- Income from continuing operations of $0.33/share
- Cash from operations of $792 million before discretionary pension contribution
- Revenue up 13% year-over-year to $6.6 billion; down sequentially on lower metal prices
- 3Q’05 ROC of 7.8%, trailing four quarters ROC of 8.3%. Trailing four quarters ROC excluding growth investments of 9.3%.
- Debt-to-cap 31.5%, within our target range
4
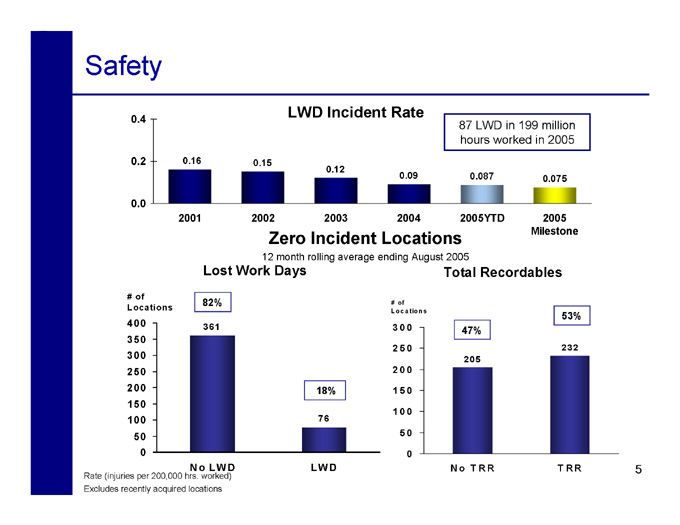
Safety
LWD Incident Rate
0.4
87 LWD in 199 million hours worked in 2005
0.2 0.16 0.15
0.12
0.09 0.087 0.075
0.0
2001 2002 2003 2004 2005YTD 2005
Zero Incident Locations Milestone
12 month rolling average ending August 2005
Lost Work Days Total Recordables
# of
82% # of
Locations Locations
53%
400 361 3 0 0
47%
350
2 5 0 232
300 205
250 2 0 0 200 18% 1 5 0
150
1 0 0
100 76
50 5 0
0 0
N o LW D LW D N o T R R T R R 5
Rate (injuries per 200,000 hrs. worked) Excludes recently acquired locations
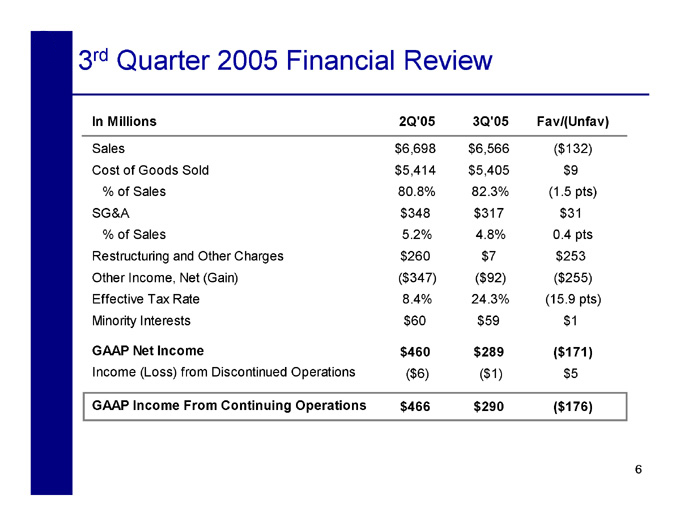
In Millions 2Q’05 3Q’05 Fav/(Unfav)
Sales $6,698 $6,566 ($132) Cost of Goods Sold $5,414 $5,405 $9 % of Sales 80.8% 82.3% (1.5 pts) SG&A $348 $317 $31 % of Sales 5.2% 4.8% 0.4 pts Restructuring and Other Charges $260 $7 $253 Other Income, Net (Gain) ($347) ($92) ($255) Effective Tax Rate 8.4% 24.3% (15.9 pts) Minority Interests $60 $59 $1
GAAP Net Income $460 $289 ($171)
Income (Loss) from Discontinued Operations ($6) ($1) $5
GAAP Income From Continuing Operations $466 $290 ($176)
6
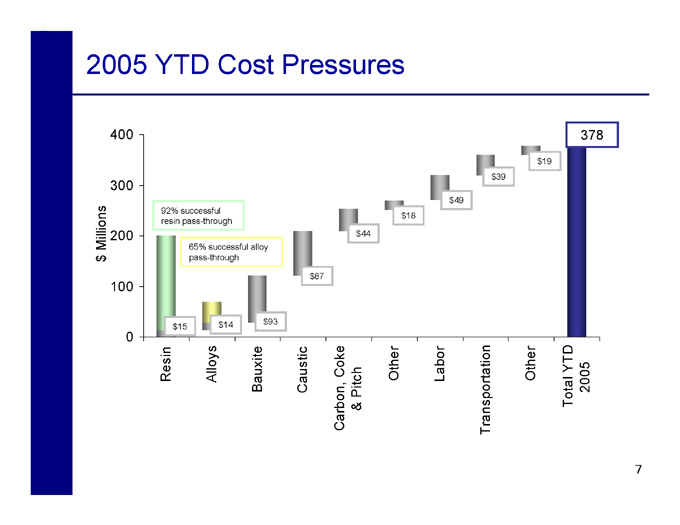
2005 YTD Cost Pressures
400 378
$19 $39
300
$49 92% successful $18 resin pass-through
200 $44
Millions 65% successful alloy pass-through
$
$87
100
$14 $93 $15
0
Resin Alloys Bauxite Caustic Other Labor Other Total YTD 2005 Carbon, Coke & Pitch Transportation
7
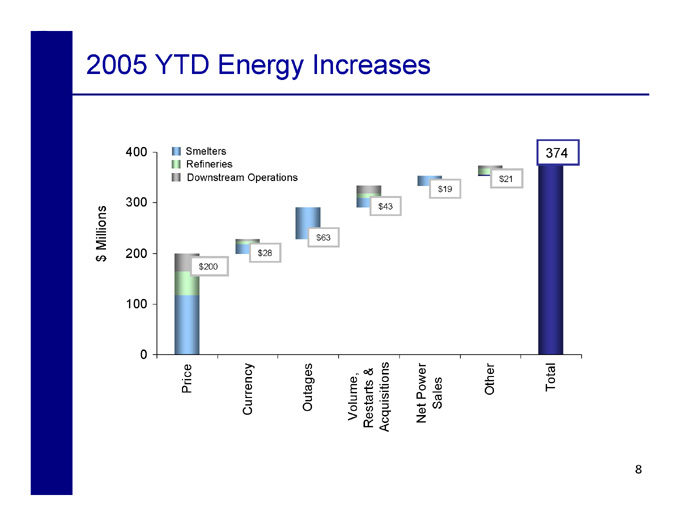
2005 YTD Energy Increases
400 Smelters 374 Refineries Downstream Operations $21 $19
300 $43
$ Millions $63
200 $28
$200
100
0
Price Currency Outages Volume, Restarts & Acquisitions Net Power Sales Other Total
8
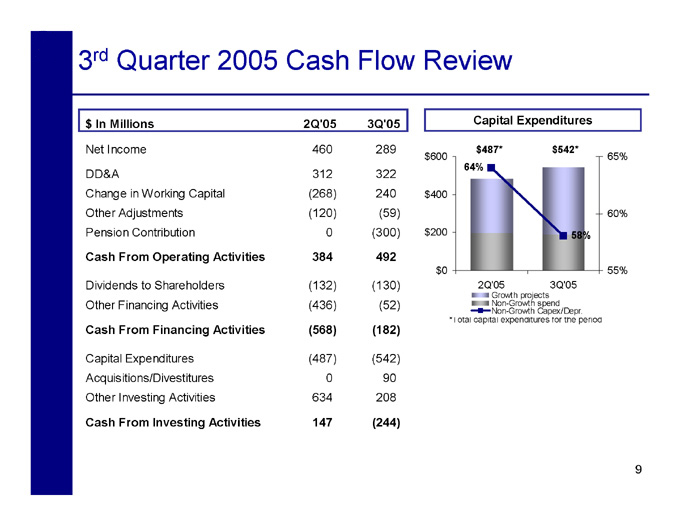
3rd Quarter 2005 Cash Flow Review
$ In Millions 2Q’05 3Q’05 Capital Expenditures
Net Income 460 289 $487* $542*
$600 65%
64%
DD&A 312 322
Change in Working Capital (268) 240 $400
Other Adjustments (120) (59) 60% Pension Contribution 0 (300) $200 58%
Cash From Operating Activities 384 492
$0 55%
Dividends to Shareholders (132) (130) 2Q’05 3Q’05
Growth projects
Other Financing Activities (436) (52) Non-Growth spend
Non-Growth Capex/Depr.
*Total capital expenditures for the period
Cash From Financing Activities (568) (182)
Capital Expenditures (487) (542) Acquisitions/Divestitures 0 90 Other Investing Activities 634 208
Cash From Investing Activities 147 (244)
9
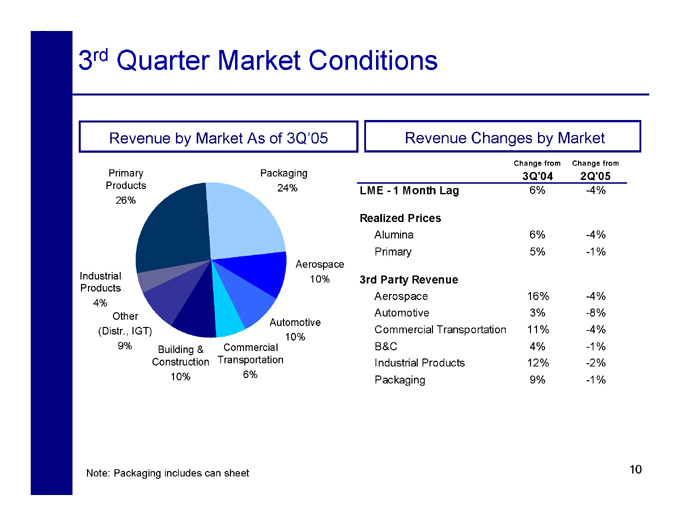
3rd Quarter Market Conditions
Revenue by Market As of 3Q’05 Revenue Changes by Market
Change from Change from
Primary Packaging 3Q’04 2Q’05 Products 24% 6% -4%
LME - 1 Month Lag
26%
Realized Prices
Alumina 6% -4% Primary 5% -1%
Aerospace
Industrial 10% 3rd Party Revenue
Products
Aerospace 16% -4%
4%
Other Automotive 3% -8%
Automotive
(Distr., IGT) Commercial Transportation 11% -4%
10%
9% Building & Commercial B&C 4% -1% Construction Transportation Industrial Products 12% -2% 10% 6%
Packaging 9% -1%
Note: Packaging includes can sheet 10
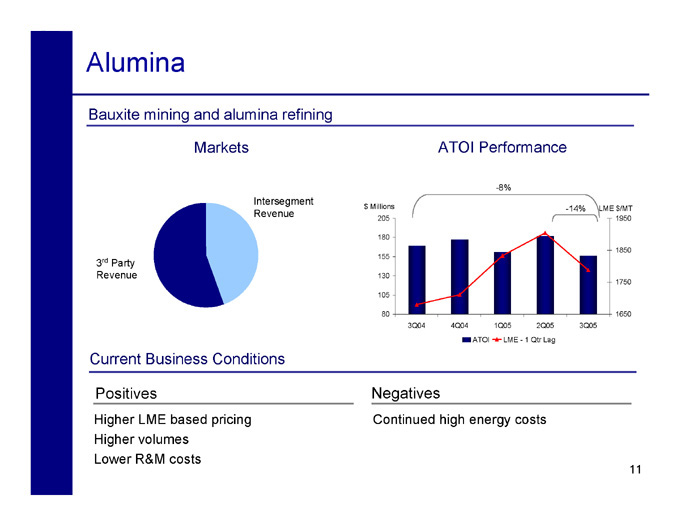
Alumina
Bauxite mining and alumina refining
Markets ATOI Performance
-8%
Intersegment
$ Millions -14% LME $/MT
Revenue
205 1950
180
1850 155
3rd Party
Revenue 130
1750 105
80 1650 3Q04 4Q04 1Q05 2Q05 3Q05 ATOI LME - 1 Qtr Lag
Current Business Conditions
Positives Negatives
Higher LME based pricing Continued high energy costs Higher volumes Lower R&M costs
11
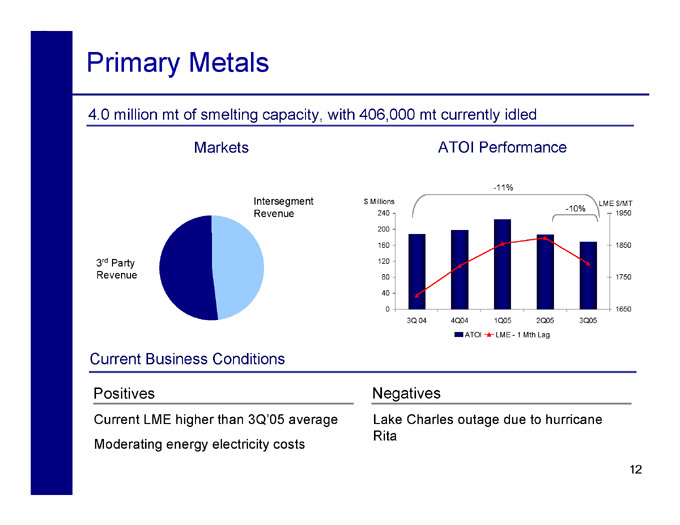
Primary Metals
4.0 million mt of smelting capacity, with 406,000 mt currently idled
Markets ATOI Performance
-11%
Intersegment $ Millions LME $/MT
-10%
Revenue 240 1950
200
160 1850
3rd Party 120
Revenue 80 1750
40
0 1650 3Q 04 4Q04 1Q05 2Q05 3Q05 ATOI LME - 1 Mth Lag
Current Business Conditions
Positives Negatives
Current LME higher than 3Q’05 average Lake Charles outage due to hurricane Rita Moderating energy electricity costs
12
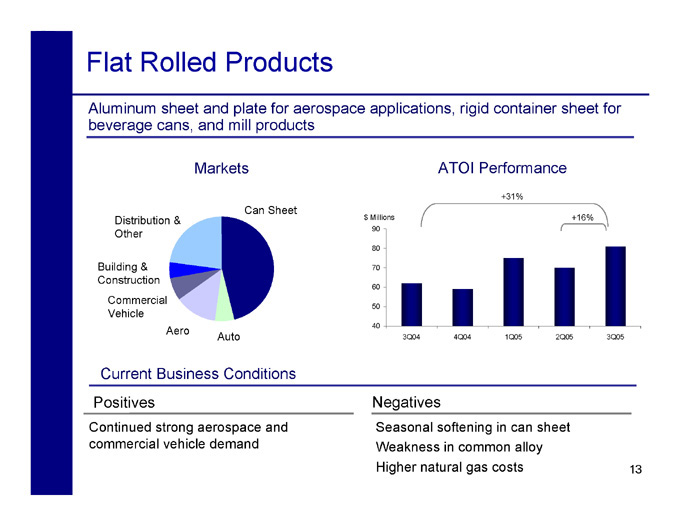
Flat Rolled Products
Aluminum sheet and plate for aerospace applications, rigid container sheet for beverage cans, and mill products
Markets ATOI Performance
+31%
Can Sheet
Distribution & $ Millions +16% Other 90
80
Building & 70 Construction
60
Commercial
50
Vehicle
Aero 40
Auto 3Q04 4Q04 1Q05 2Q05 3Q05
Current Business Conditions
Positives Negatives
Continued strong aerospace and Seasonal softening in can sheet commercial vehicle demand Weakness in common alloy
Higher natural gas costs 13
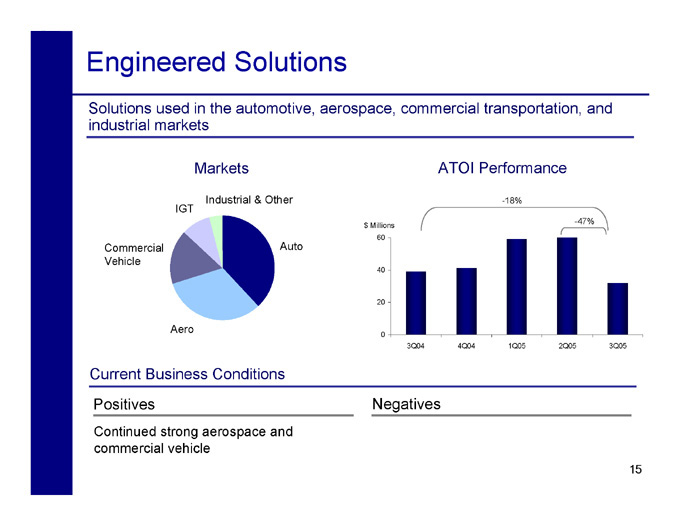
Engineered Solutions
Solutions used in the automotive, aerospace, commercial transportation, and industrial markets
Markets ATOI Performance
Industrial & Other -18% IGT
-47% $ Millions 60
Commercial Auto Vehicle
40
20
Aero
0
3Q04 4Q04 1Q05 2Q05 3Q05
Current Business Conditions
Positives Negatives
Continued strong aerospace and commercial vehicle
15
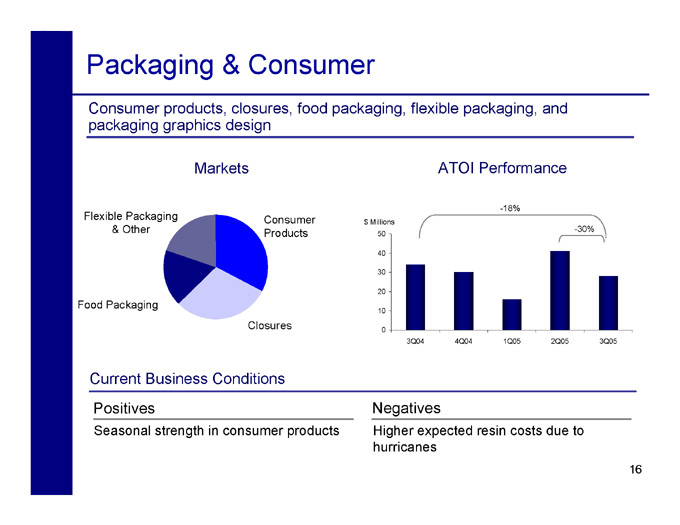
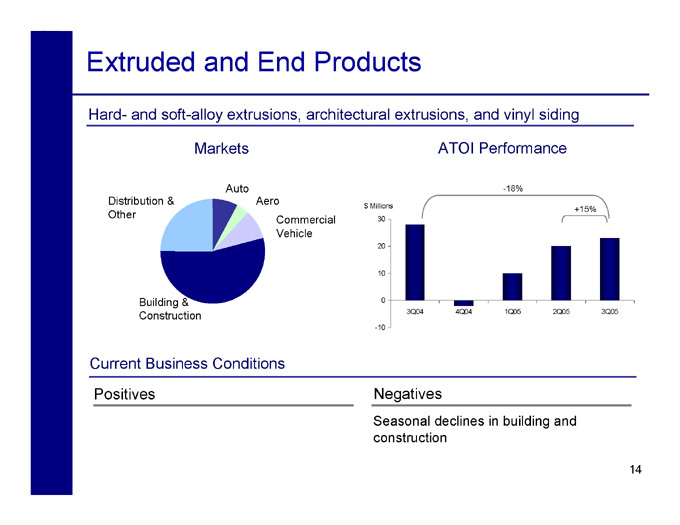
Packaging & Consumer
Consumer products, closures, food packaging, flexible packaging, and packaging graphics design
Markets ATOI Performance
-18%
Flexible Packaging Consumer
$ Millions
& Other -30% Products 50
40
30
20
Food Packaging
10
Closures 0
3Q04 4Q04 1Q05 2Q05 3Q05
Current Business Conditions
Positives Negatives
Seasonal strength in consumer products Higher expected resin costs due to hurricanes
16
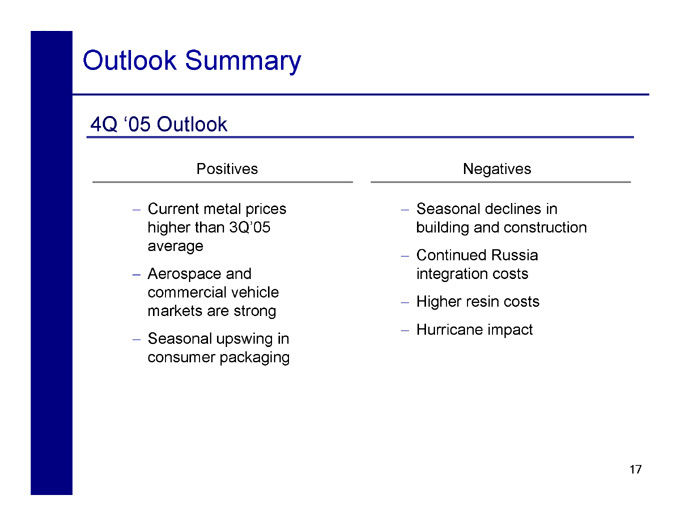
Outlook Summary
4Q ‘05 Outlook
Positives Negatives
- Current metal prices - Seasonal declines in higher than 3Q’05 building and construction average
- Continued Russia
- Aerospace and integration costs commercial vehicle
- Higher resin costs markets are strong
- Hurricane impact
- Seasonal upswing in consumer packaging
17
Alain Belda Chairman Chief Executive Officer
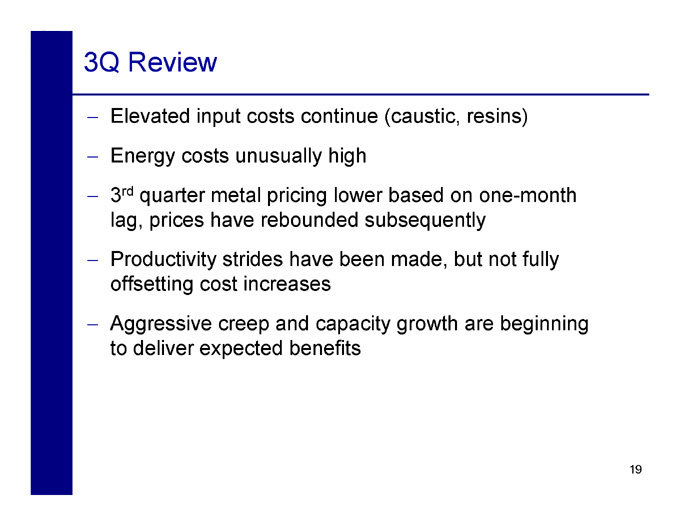
3Q Review
- Elevated input costs continue (caustic, resins)
- Energy costs unusually high
- 3rd quarter metal pricing lower based on one-month lag, prices have rebounded subsequently
- Productivity strides have been made, but not fully offsetting cost increases
- Aggressive creep and capacity growth are beginning to deliver expected benefits
19
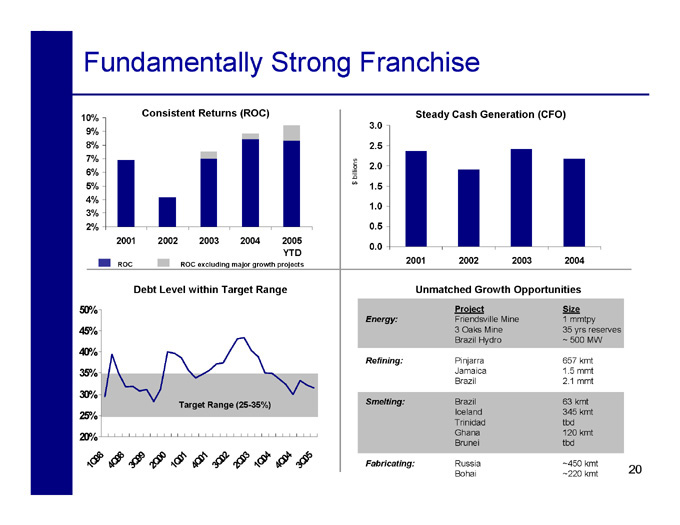
Fundamentally Strong Franchise
Consistent Returns (ROC) Steady Cash Generation (CFO)
10%
3.0 9%
8% 2.5 7% 2.0
6% billions
5% $ 1.5 4% 1.0 3%
2% 0.5 2001 2002 2003 2004 2005 0.0 YTD
ROC ROC excluding major growth projects 2001 2002 2003 2004
Debt Level within Target Range Unmatched Growth Opportunities
50% Project Size
Energy: Friendsville Mine 1 mmtpy 45% 3 Oaks Mine 35 yrs reserves Brazil Hydro ~ 500 MW
40%
Refining: Pinjarra 657 kmt 35% Jamaica 1.5 mmt Brazil 2.1 mmt
30%
Target Range (25-35%) Smelting: Brazil 63 kmt
25% Iceland 345 kmt Trinidad tbd 20% Ghana 120 kmt Brunei tbd
8 8 1 1 2 3 5
9 9 Q00 Q0 Q0 0 0 Q0 Fabricating: Russia ~450 kmt
1Q 4Q 3Q99 2 1 4 3Q 2Q 1Q044Q04 3 20
Bohai ~220 kmt
Strategic Direction Unchanged
- Executing on upstream growth projects including secure energy
- Integrating strategic investments in Russia, China
- Focused on portfolio management
- Systematically building ABS platforms to achieve operational excellence
- Capitalizing on strong market conditions (upstream, aerospace, commercial vehicle)
21
For Additional Information, contact:
William F. Oplinger Director, Investor Relations
Alcoa
390 Park Avenue
New York, N.Y. 10022-4608 Telephone: (212) 836-2674 Facsimile: (212) 836-2813 www.alcoa.com
22
Appendix
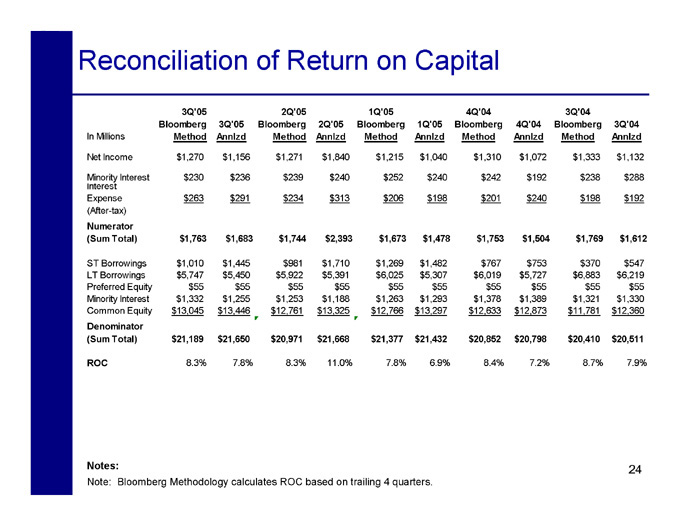
Reconciliation of Return on Capital
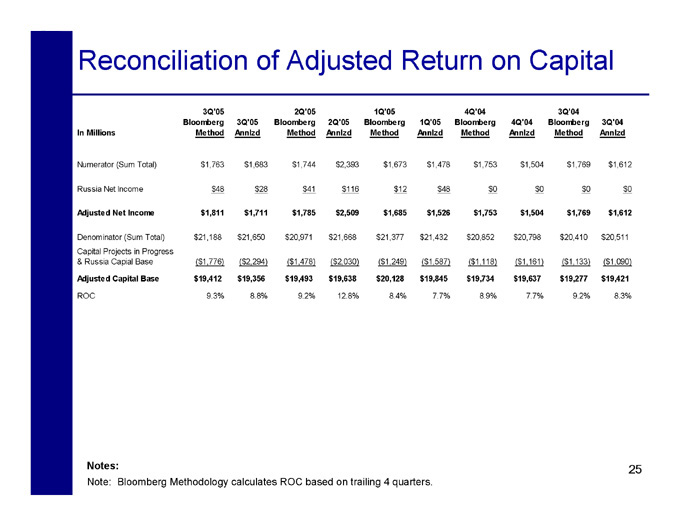
Reconciliation of Adjusted Return on Capital
3Q’05 2Q’05 1Q’05 4Q’04 3Q’04
Bloomberg 3Q’05 Bloomberg 2Q’05 Bloomberg 1Q’05 Bloomberg 4Q’04 Bloomberg 3Q’04 In Millions Method Annlzd Method Annlzd Method Annlzd Method Annlzd Method Annlzd
Numerator (Sum Total) $1,763 $1,683 $1,744 $2,393 $1,673 $1,478 $1,753 $1,504 $1,769 $1,612
Russia Net Income $48 $28 $41 $116 $12 $48 $0 $0 $0 $0
Adjusted Net Income $1,811 $1,711 $1,785 $2,509 $1,685 $1,526 $1,753 $1,504 $1,769 $1,612
Denominator (Sum Total) $21,188 $21,650 $20,971 $21,668 $21,377 $21,432 $20,852 $20,798 $20,410 $20,511 Capital Projects in Progress & Russia Capial Base ($1,776) ($2,294) ($1,478) ($2,030) ($1,249) ($1,587) ($1,118) ($1,161) ($1,133) ($1,090)
Adjusted Capital Base $19,412 $19,356 $19,493 $19,638 $20,128 $19,845 $19,734 $19,637 $19,277 $19,421
ROC 9.3% 8.8% 9.2% 12.8% 8.4% 7.7% 8.9% 7.7% 9.2% 8.3%
Notes: 25
Note: Bloomberg Methodology calculates ROC based on trailing 4 quarters.
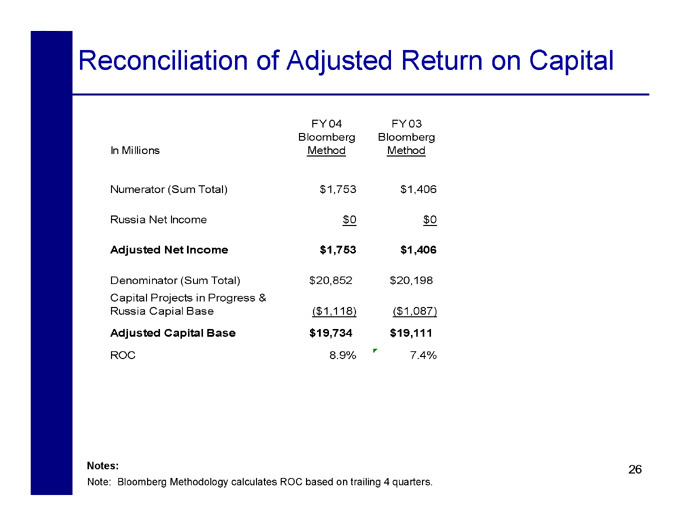
Reconciliation of Adjusted Return on Capital
FY 04 FY 03 Bloomberg Bloomberg In Millions Method Method
Numerator (Sum Total) $1,753 $1,406
Russia Net Income $0 $0
Adjusted Net Income $1,753 $1,406
Denominator (Sum Total) $20,852 $20,198 Capital Projects in Progress & Russia Capial Base ($1,118) ($1,087)
Adjusted Capital Base $19,734 $19,111
ROC 8.9% 7.4%
Notes: 26
Note: Bloomberg Methodology calculates ROC based on trailing 4 quarters.