 [Alcoa logo] October 9, 2007 3 Quarter 2007 Analyst Conference Exhibit 99.2 rd |
 2 [Alcoa logo] Today’s discussion may include “forward-looking statements” within the meaning of the Private Securities Litigation Reform Act of 1995. Such statements relate to future events and expectations and involve known and unknown risks and uncertainties. Alcoa’s actual results or actions may differ materially from those projected in the forward-looking statements. For a summary of the specific risk factors that could cause results to differ materially from those expressed in the forward-looking statements, please refer to Alcoa’s Form 10-K for the year ended December 31, 2006 and Forms 10-Q for the quarters ended March 31, 2007 and June 30, 2007 filed with the Securities and Exchange Commission. Forward Looking Statements 2 |
 [Alcoa logo] Chairman and Chief Executive Officer Alain J.P. Belda |
 4 [Alcoa logo] 3 rd Quarter 2007 Portfolio Management – Monetized Chalco investment – Increased the share repurchase program from 10% up to 25% – Committed to moving forward with the Packaging and Auto Castings businesses sale process 4 |
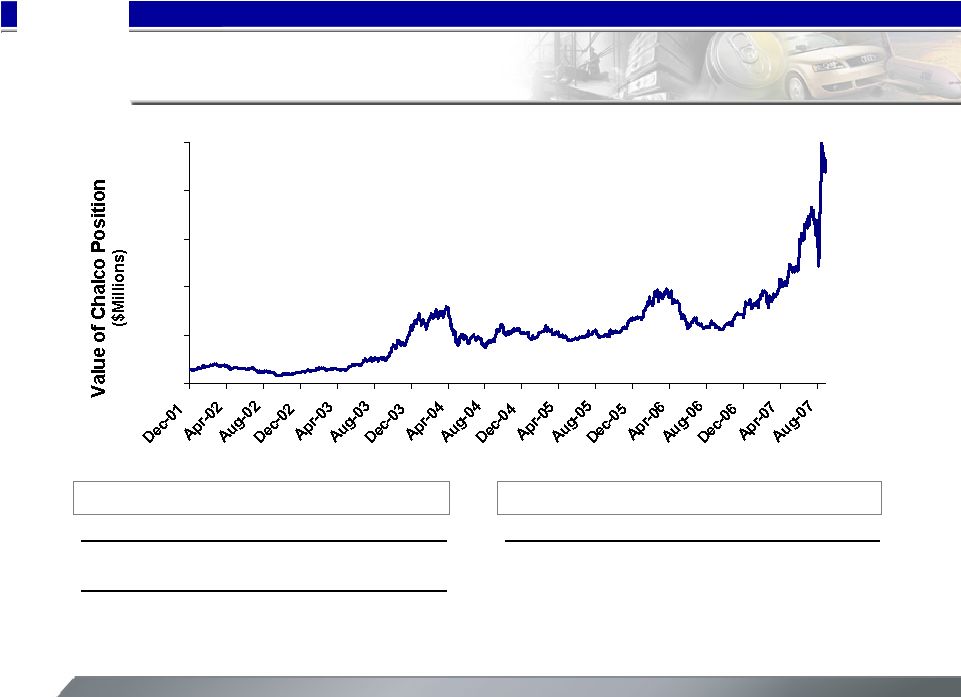 5 [Alcoa logo] Chalco Investment Monetized 0 500 1,000 1,500 2,000 2,500 Date Alcoa Shares Investment ($M) 12/12/01 828.2 146.5 1/11/02 840.2 2.1 1/6/04 884.2 31.9 Total Investment ($M) 180.5 Investment Performance Alcoa’s Chalco Position Total Annualized Total Shareholder Return 1050% 44% Price Appreciation 989% 42% Transaction yields $2.0 billion in proceeds 5 |
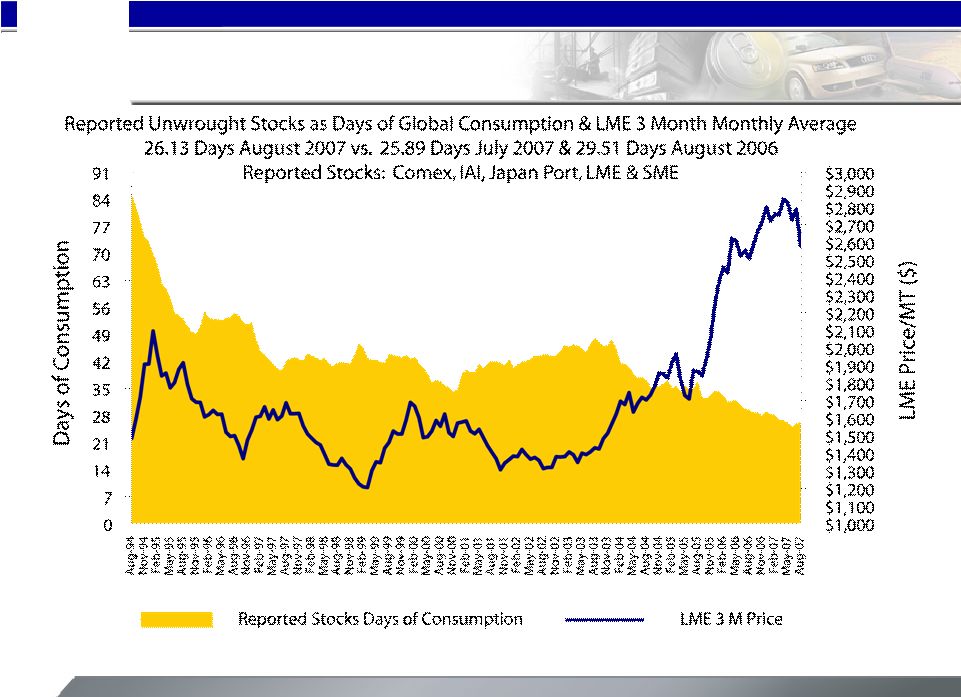 6 [Alcoa logo] Source: IAI and LME Global Days of Consumption 6 |
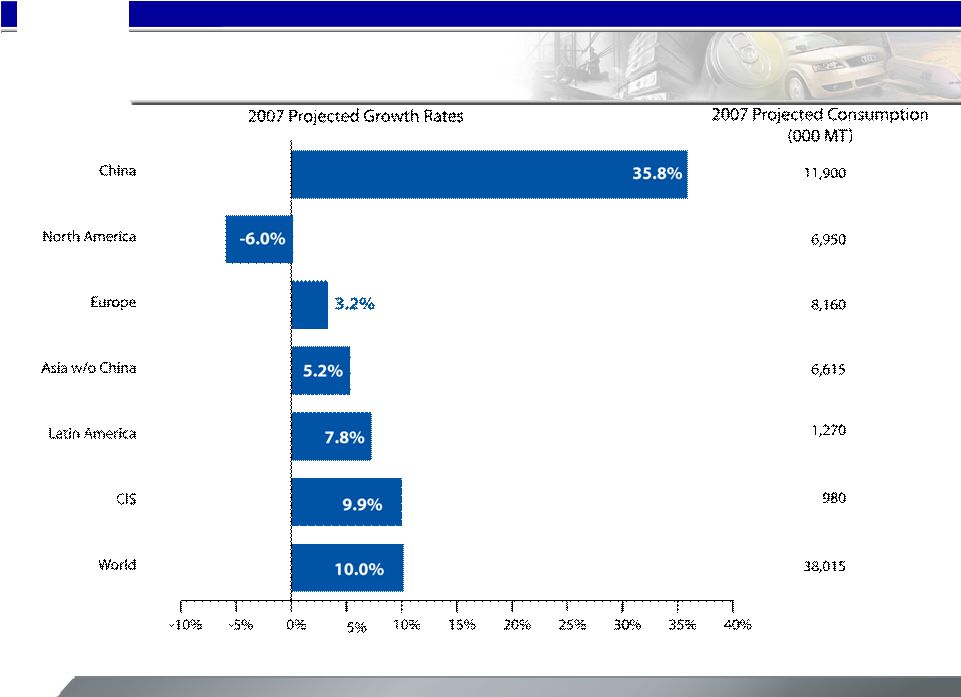 7 [Alcoa logo] Primary Aluminum Consumption Growth Rates Source: Alcoa analysis 7 |
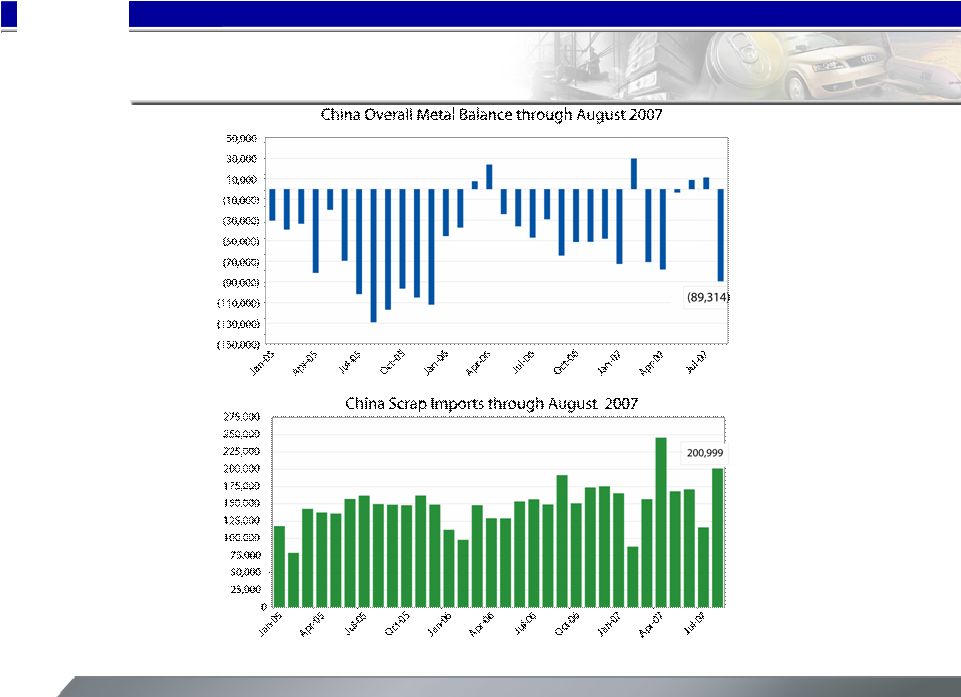 8 [Alcoa logo] China Aluminum Balance Source: China State Statistics Bureau 8 |
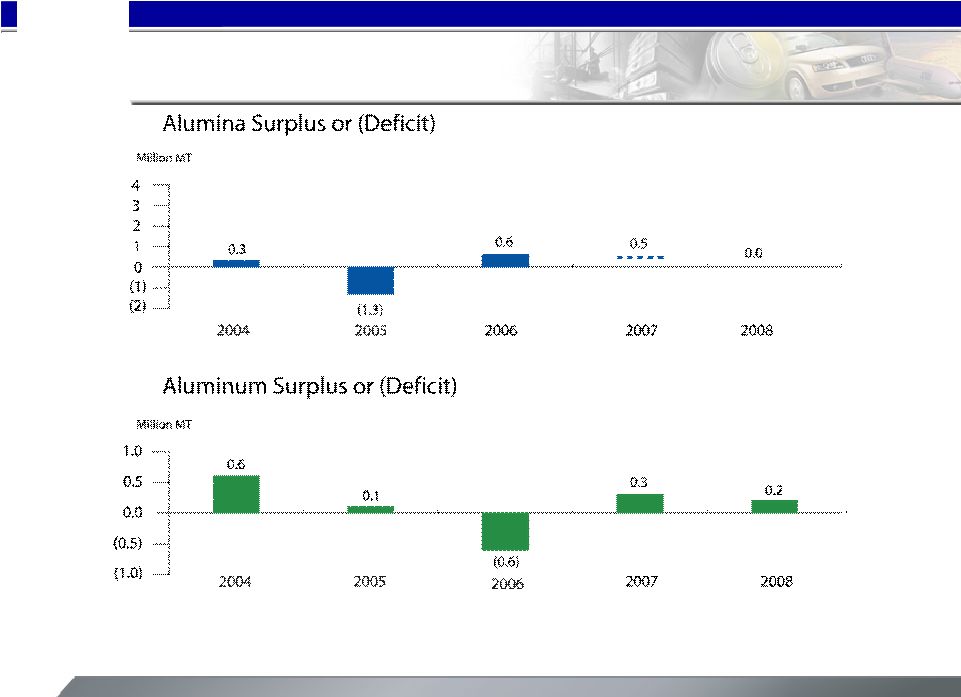 9 [Alcoa logo] Source: Alcoa analysis Supply / Demand Projections 9 |
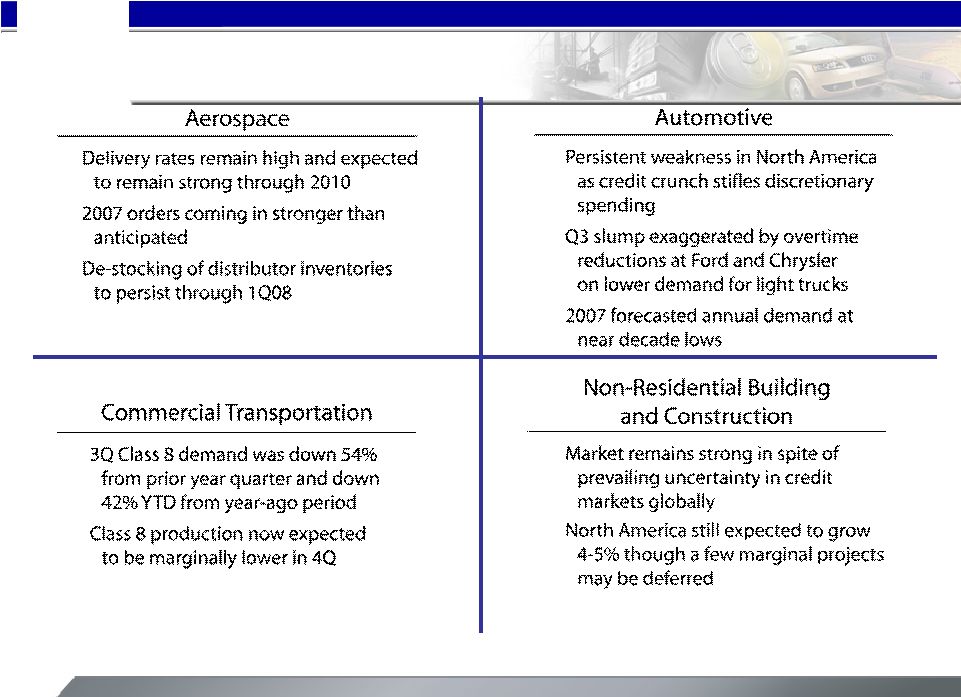 10 [Alcoa logo] Global Market Dynamics 10 |
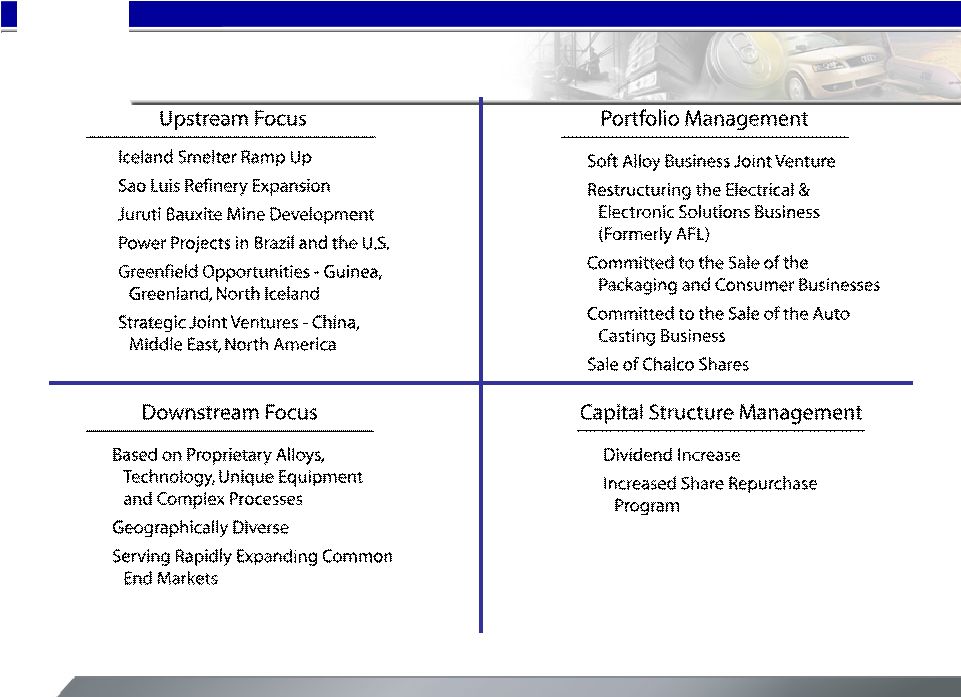 11 [Alcoa logo] Strategic Initiatives Update 11 |
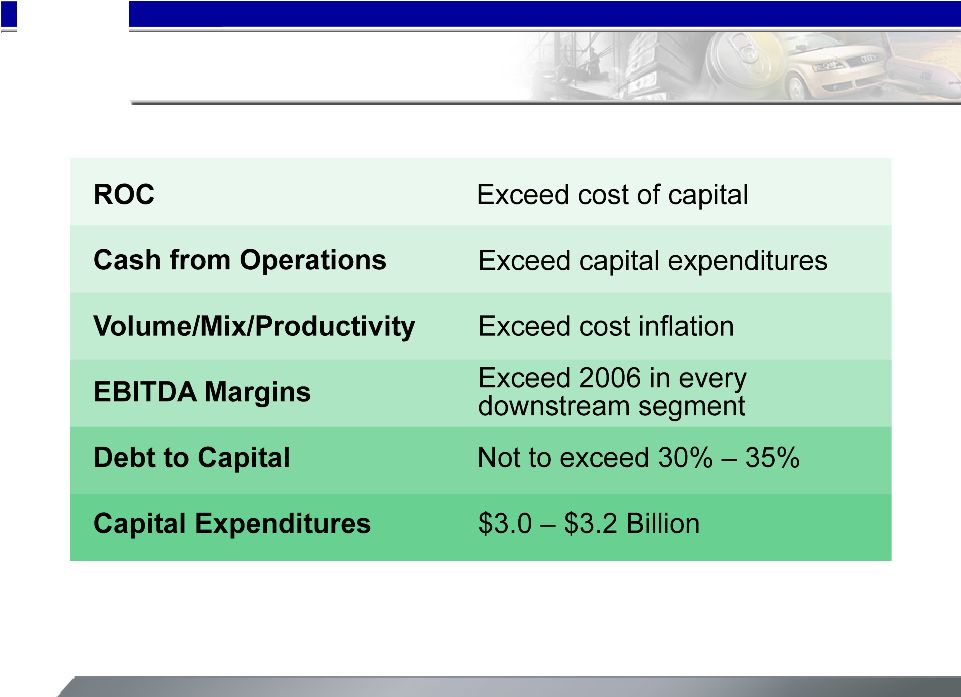 12 [Alcoa logo] 2007 Financial Targets 12 |
 [Alcoa logo] Executive Vice President and Chief Financial Officer Charles D. McLane |
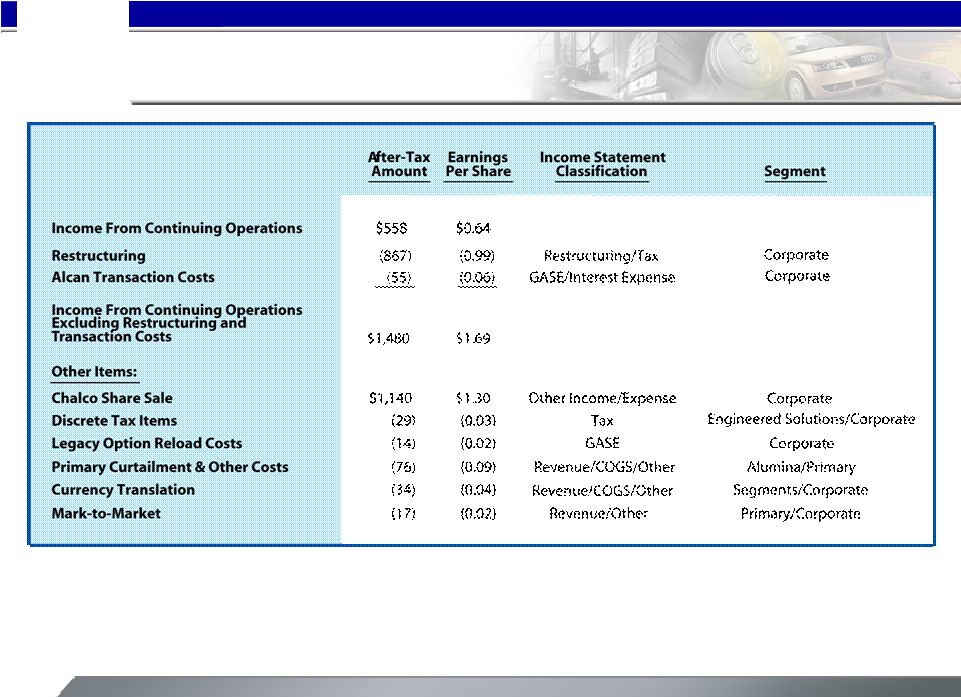
 14 [Alcoa logo] 3 rd Quarter 2007 Financial Overview – Income from continuing operations of $558m or $0.64 per share – Revenues of $7.4b – Cash from operations of $592m – Debt-to-cap at 29% – Trailing four quarters ROC of 11.8% – Chalco share sale and portfolio restructuring 14 |
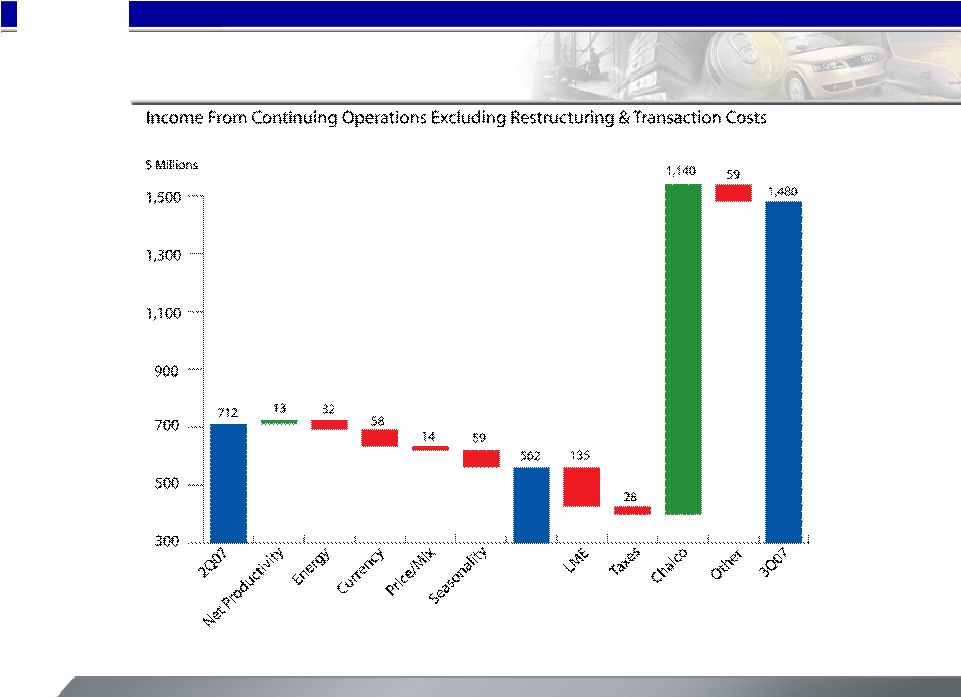 15 [Alcoa logo] 2 nd Quarter vs. 3 rd Quarter Comparison Please see slide 19 and 39 for a reconciliation of income from continuing operations excluding restructuring and transaction costs for the third and second quarters of 2007, respectively. 15 |
 16 [Alcoa logo] 3 rd Quarter 2007 Financial Overview $ In Millions 2Q'07 3Q'07 Change Sales $8,066 $7,387 ($679) Cost of Goods Sold $6,178 $5,910 ($268) % of Sales 76.6% 80.0% 3.4 pts. SG&A $367 $365 ($2) % of Sales 4.5% 4.9% 0.4 pts. Restructuring and Other Charges ($57) $577 $634 Interest Expense $86 $151 $65 Other Income, Net ($60) ($1,731) ($1,671) Effective Tax Rate 30.0% 63.0% 33 pts. Minority Interests $110 $76 ($34) GAAP Net Income $715 $555 ($160) Loss from Discontinued Operations ($1) ($3) ($2) GAAP Income From Continuing Operations $716 $558 ($158) 16 |
 17 [Alcoa logo] Income from continuing operations – excluding restructuring and other charges and transaction costs is a non-GAAP financial measure. Management believes that this measure is meaningful to investors because management reviews the operating results of Alcoa excluding the impacts of restructuring and other charges and transaction costs. There can be no assurances that additional restructuring and other charges and transaction costs will not occur in future periods. To compensate for this limitation, management believes that it is appropriate to consider both income from continuing operations determined under GAAP as well as income from continuing operations – excluding restructuring and other charges and transaction costs. 3 rd Quarter 2007 Financial Overview 17 |
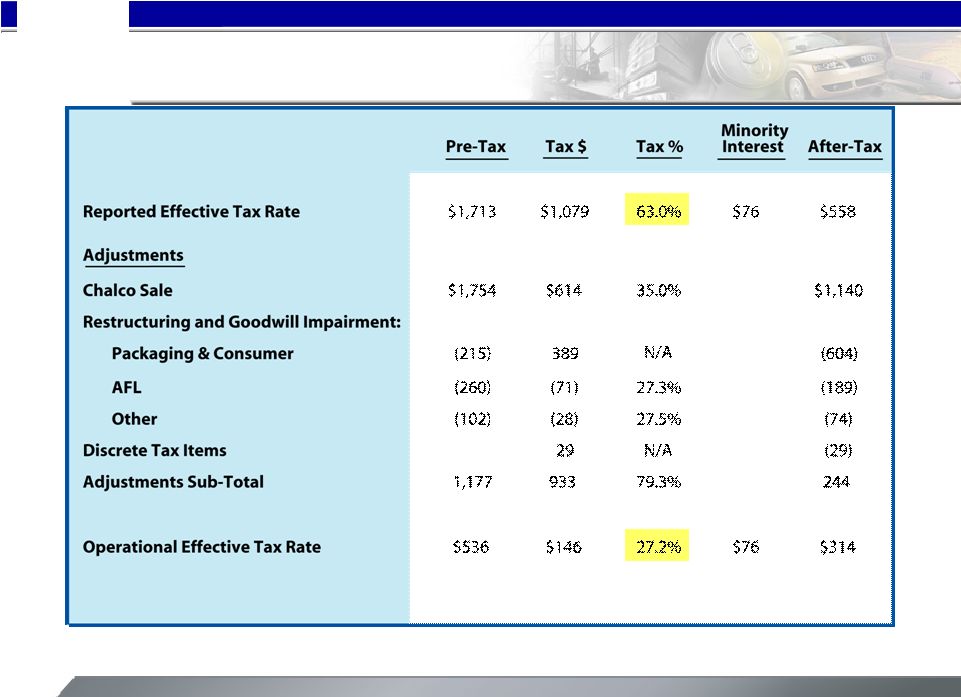 18 [Alcoa logo] 3rd Quarter Tax Rate Reconciliation 18 |
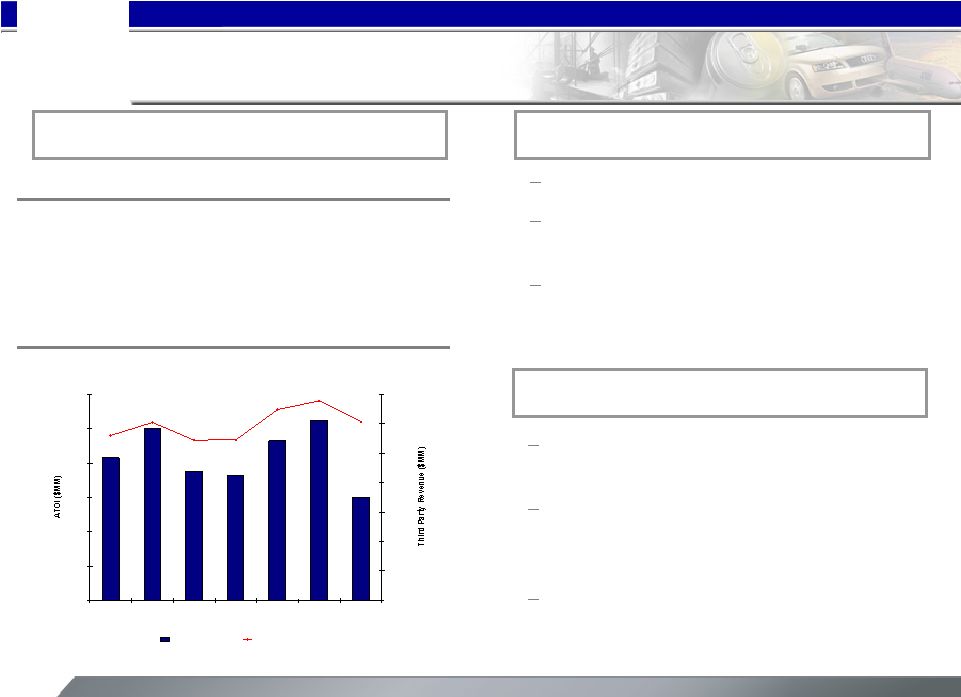
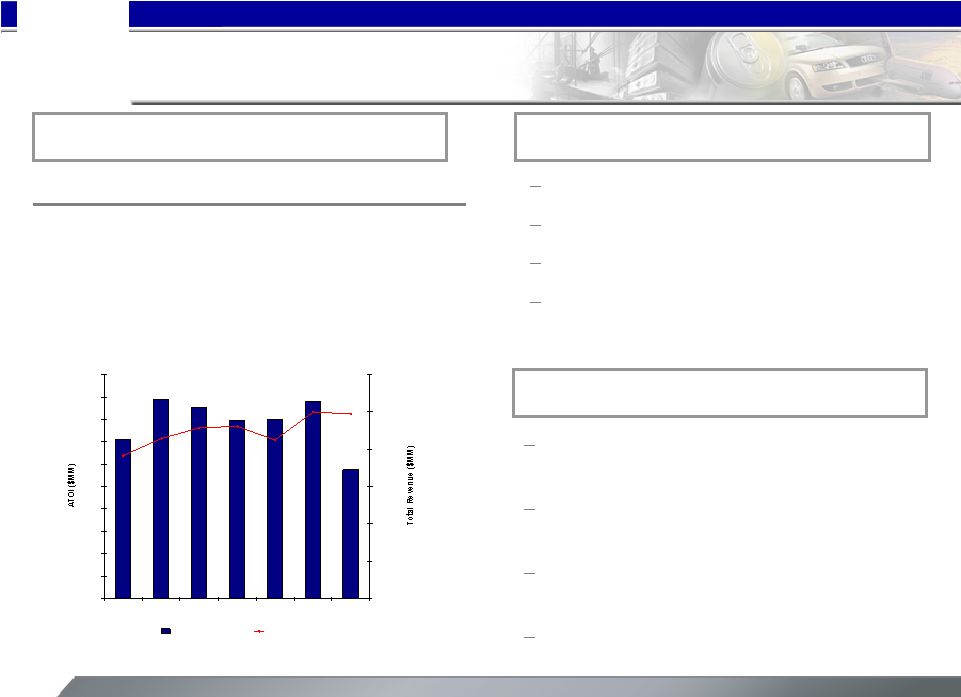 19 [Alcoa logo] 3Q’07 2Q’07 3Q’06 1,937 1,990 2,205 3 Party Shipments (kmt) 3,775 3,799 3,890 Production (kmt) 664 712 733 3 Party Revenue ($MM) 215 276 271 ATOI ($MM) Hurricane Dean impact at Jamalco Higher energy costs Unfavorable currency 2Q technology royalty not repeated Alumina 3 rd Quarter Highlights 4 th Quarter Outlook Prices to follow approximate two-month lag Anticipate 2-3% production increase sequentially Pressure from fuel oil and natural gas prices continue Australian dollar risk 3 rd Quarter Business Conditions $100 $120 $140 $160 $180 $200 $220 $240 $260 $280 $300 1Q06 2Q06 3Q06 4Q06 1Q07 2Q07 3Q07 $800 $900 $1,000 $1,100 $1,200 $1,300 $1,400 ATOI Total Revenue 19 rd rd |
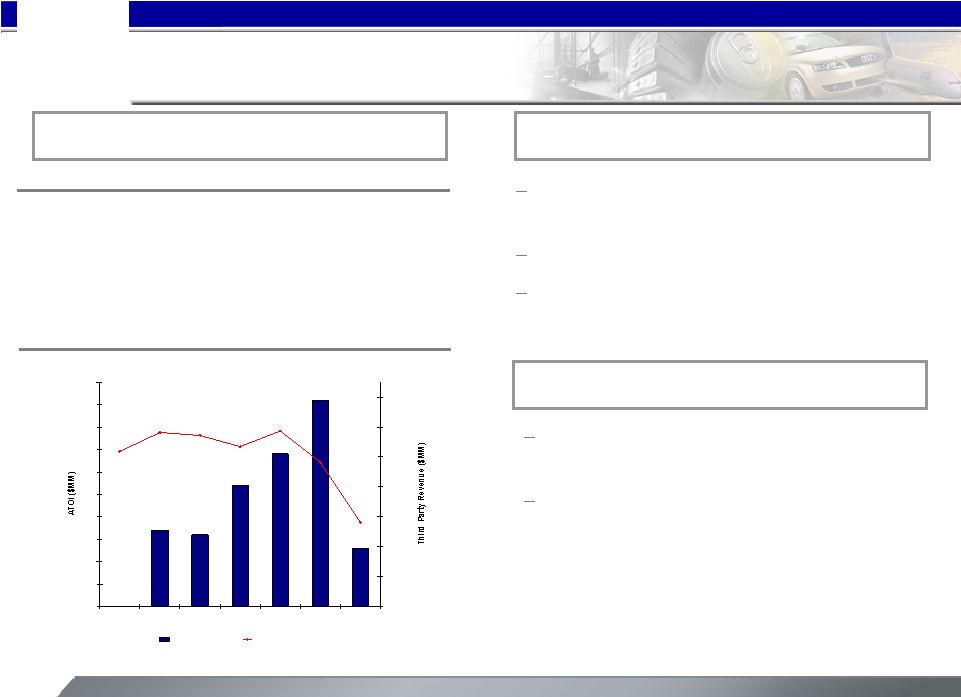
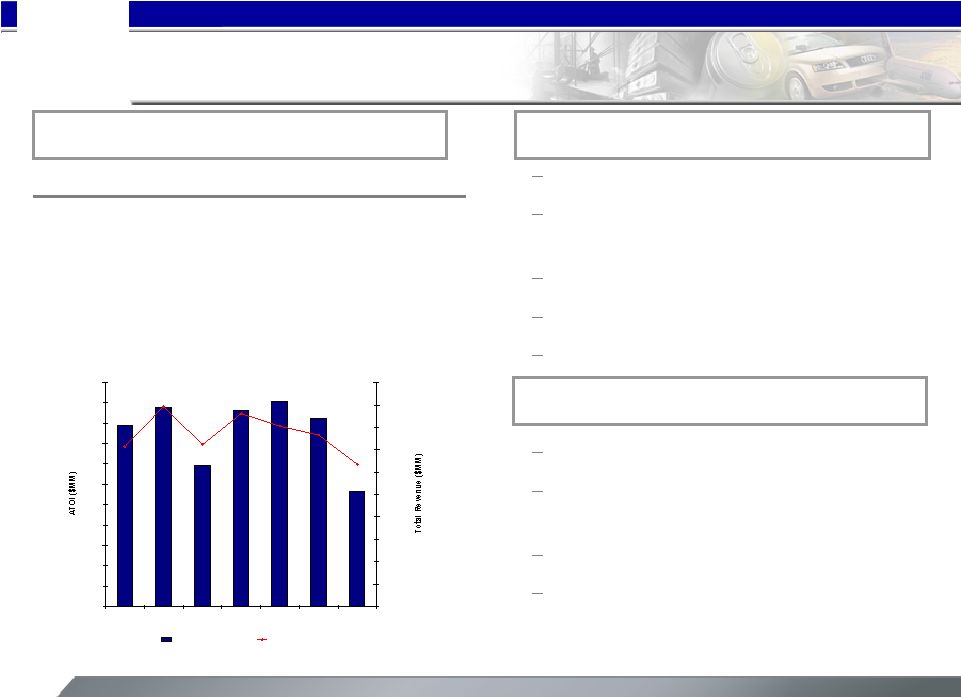 20 [Alcoa logo] 3 rd Quarter Highlights 283 462 346 ATOI ($MM) 2,734 2,879 2,620 3 Party Price ($/MT) 1,600 1,746 1,476 3 Party Revenue ($MM) 3Q’07 2Q’07 3Q’06 584 565 535 3 Party Shipments (kmt) 934 901 895 Production (kmt) Primary Metals 4 th Quarter Outlook 3 rd Quarter Business Conditions Lower realized pricing sequentially Tennessee and Rockdale curtailment costs Iceland start-up costs Seasonal energy increases Unfavorable currency Average Sept. cash LME = $2,391/MT Anticipate 3% production increase sequentially Iceland start-up costs at same level Tennessee and Rockdale at full strength by year end $0 $50 $100 $150 $200 $250 $300 $350 $400 $450 $500 $550 1Q06 2Q06 3Q06 4Q06 1Q07 2Q07 3Q07 $1,500 $1,700 $1,900 $2,100 $2,300 $2,500 $2,700 $2,900 $3,100 $3,300 $3,500 ATOI Total Revenue 20 rd rd rd |
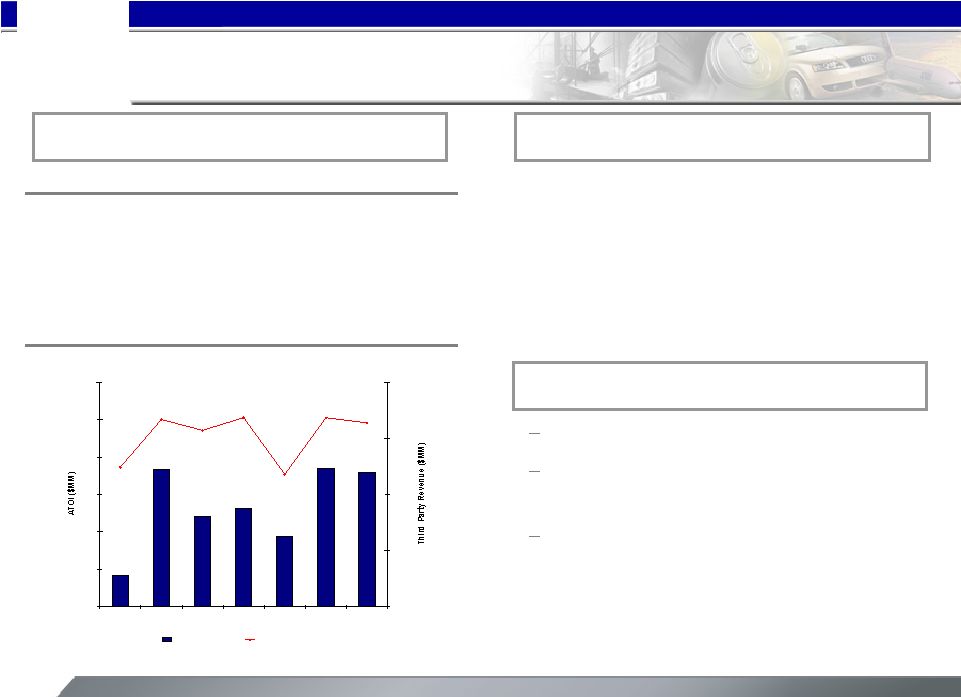
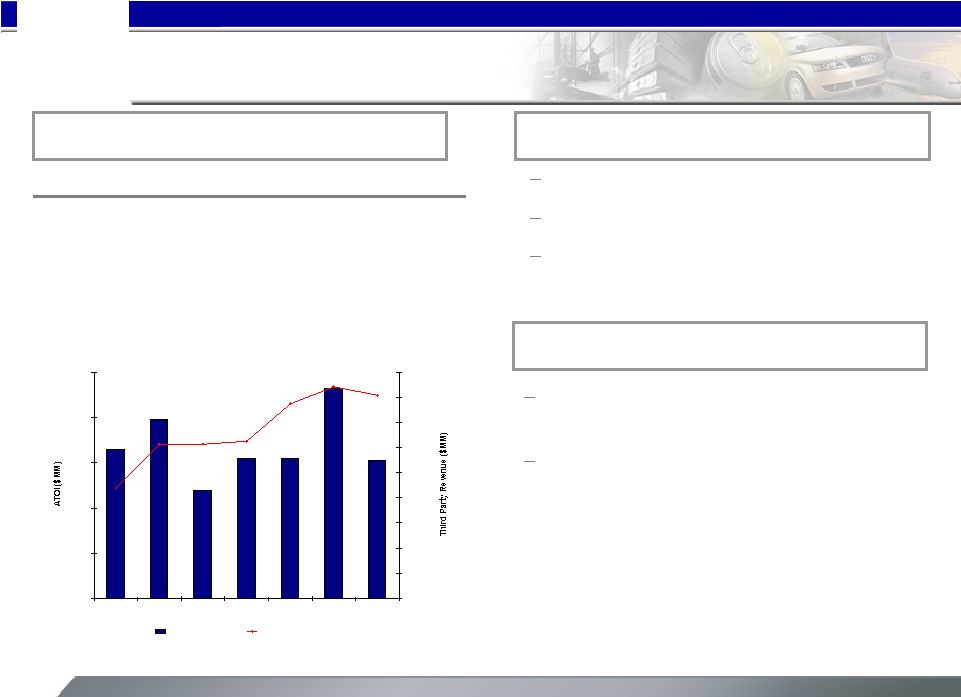 21 [Alcoa logo] Seasonality impact Distributor de-stocking Bohai pre-operating costs Flat-Rolled Products 3 rd Quarter Highlights 4 th Quarter Outlook 3 rd Quarter Business Conditions Continued short-term impact of distributor de-stocking Continued weakness in the North American and European distribution market $0 $20 $40 $60 $80 $100 1Q06 2Q06 3Q06 4Q06 1Q07 2Q07 3Q07 $1,500 $1,600 $1,700 $1,800 $1,900 $2,000 $2,100 $2,200 $2,300 $2,400 ATOI Third Party Revenue 21 3Q’07 2Q’07 3Q’06 61 93 48 ATOI ($MM) 2,309 2,344 2,115 3 rd Party Revenue ($MM) |
 22 [Alcoa logo] (7) (5) (2) Other 105 118 (8) 2Q’07 Total Investment Castings, Forgings, Fasteners AFL, Auto Castings and Structures 75 86 (9) 3Q’06 60 102 (35) 3Q’07 Negative impact of seasonality Statutory tax rate change and costs related to the restructuring in AFL Continued productivity improvement in the Investment Castings and Fasteners business Engineered Solutions ATOI ($MM) 3 rd Quarter Business Conditions 4 th Quarter Outlook Continued short-term impact of distributor de-stocking Decline in Class 8 truck will be marginally more pronounced vs. 3 rd quarter Restructuring will begin to improve AFL results $0 $20 $40 $60 $80 $100 $120 1Q06 2Q06 3Q06 4Q06 1Q07 2Q07 3Q07 $800 $900 $1,000 $1,100 $1,200 $1,300 $1,400 $1,500 ATOI Third Party Revenue 22 |
 23 [Alcoa logo] (7) 29 2 Soft Alloy Joint Venture and Other 3Q’07 2Q’07 3Q’06 13 46 16 Total 20 17 14 Global Hard Alloy Extrusions, Building & Construction Systems and Russia Soft Alloy joint venture depreciation re- started Seasonality in the Soft Alloy joint venture Commercial building and construction market remained strong Extruded and End Products ATOI ($MM) 3 rd Quarter Business Conditions 4 th Quarter Outlook Some recovery in the Soft Alloy volume likely Anticipate Hard Alloy and Building Construction Systems to remain strong $0 $5 $10 $15 $20 $25 $30 $35 $40 $45 $50 1Q06 2Q06 3Q06 4Q06 1Q07 2Q07 3Q07 $0 $200 $400 $600 $800 $1,000 $1,200 $1,400 ATOI Third Party Revenue 23 |
 24 [Alcoa logo] 0 (2) (2) Other 37 (1) 40 2Q’07 Total Reynolds Food Packaging and Flexible Packaging Closure Systems and Consumer Products 24 (4) 30 3Q’06 36 0 36 3Q’07 Packaging and Consumer ATOI ($MM) 3 rd Quarter Business Conditions 4 th Quarter Outlook Normal seasonal decrease in Closures Normal seasonal increase in Consumer Products Continued year over year productivity improvement – Year over year productivity improvement in all businesses – Slight sequential seasonality impact $0 $10 $20 $30 $40 $50 $60 1Q06 2Q06 3Q06 4Q06 1Q07 2Q07 3Q07 $500 $600 $700 $800 $900 ATOI Third Party Revenue 24 |
 25 [Alcoa logo] 3 rd Quarter 2007 Cash Flow Review $ In Millions 3Q'06 3Q'07 Net Income $537 $555 DD&A 324 338 Change in Working Capital 25 207 Other Adjustments 104 (302) Pension Contributions (242) (206) Cash From Operating Activities 748 592 Dividends to Shareholders (130) (150) Change in Debt 334 (494) Dividends to Minority Interests (81) (106) Contributions from Minority Interests 24 152 Share Repurchases (80) (1,295) Share Issuances 5 391 Other Financing Activities 1 41 Cash From Financing Activities 73 (1,461) Capital Expenditures (737) (941) Sale of Investments 0 1,954 Other Investing Activities 17 (5) Cash From Investing Activities ($720) $1,008 25 |
 26 [Alcoa logo] Share Repurchase Program Based on 870M Shares Outstanding As of January 19, 2007 5% repurchased as of 3Q’07 15% additional authorized – 10% repurchase program authorized January 2007 – ~43M shares repurchased through 3Q’07 – Authorization for increase of repurchase program to 25% Timeline 5% remaining on Jan ’07 Program Overview 130M 43M 44M 26 |
 27 [Alcoa logo] Tony Thene Director, Investor Relations Alcoa 390 Park Avenue New York, N.Y. 10022-4608 Telephone: (212) 836-2674 Facsimile: (212) 836-2813 www.alcoa.com For Additional Information, Contact: 27 |
 28 [Alcoa logo] [Alcoa logo] 28 |
 29 [Alcoa logo] APPENDIX [Alcoa logo] 29 |
 30 [Alcoa logo] (1) Certain amounts for the first and second quarter of 2006 have been reclassified to Other so that this line reflects only the impact of LIFO. Presenting the Impact of LIFO as a separate line in the Reconciliation of ATOI started in the third quarter of 2006. Financial information for the first and second quarter of 2006 has been reclassified to reflect the movement of the home exteriors business to discontinued operations in the third quarter of 2006. Reconciliation of ATOI to Consolidated Net Income $ 555 $ 715 $ 662 $ 2,248 $ 359 $ 537 $ 744 $ 608 Consolidated net income 456 (50) (10) 104 10 (7) 51 50 Other (3) (1) (11) 87 101 (3) (5) (6) Discontinued operations (311) 21 (18) (379) (386) 2 6 (1) Restructuring and other charges (101) (101) (86) (317) (82) (64) (82) (89) Corporate expense (76) (110) (115) (436) (98) (109) (124) (105) Minority interests (98) (56) (54) (250) (61) (66) (63) (60) Interest expense 10 9 11 58 14 23 10 11 Interest income 10 (16) (27) (170) (66) (19) (49) (36) Impact of LIFO (1) Unallocated amounts (net of tax): $ 668 $ 1,019 $ 972 $ 3,551 $ 927 $ 780 $ 1,000 $ 844 Total segment ATOI 3Q07 2Q07 1Q07 2006 4Q06 3Q06 2Q06 1Q06 30 |
 31 [Alcoa logo] Return on Capital (ROC) is presented based on Bloomberg Methodology which calculates ROC based on trailing four quarters. Reconciliation of Return on Capital 31 3Q'07 2Q'07 1Q'07 4Q'06 3Q'06 2Q'06 1Q'06 4Q'05 3Q'05 2Q'05 1Q'05 Bloomberg Bloomberg Bloomberg Bloomberg Bloomberg Bloomberg Bloomberg Bloomberg Bloomberg Bloomberg Bloomberg (In Millions) Method Method Method Method Method Method Method Method Method Method Method Net income $2,291 $2,273 $2,302 $2,248 $2,113 $1,865 1,581 $1,233 $1,270 $1,271 $1,215 Minority interests $399 $432 $446 $436 $418 $368 304 $259 $230 $239 $252 Interest expense (after-tax) $246 $270 $281 $291 $272 $268 $274 $261 $263 $234 $206 Numerator (sum total) $2,936 $2,975 $3,029 $2,975 $2,803 $2,501 $2,159 $1,753 $1,763 $1,744 $1,673 Average Balances Short-term borrowings $497 $451 $441 $386 $349 $303 $342 $279 $155 $152 $185 Short-term debt $525 $359 $360 $451 $449 $55 $53 $58 $272 $273 $269 Commercial paper $1,275 $1,169 $972 $1,192 $1,678 $1,501 $1,652 $771 $581 $553 $815 Long-term debt $5,390 $5,709 $5,767 $4,861 $4,915 $5,333 $5,243 $5,309 $5,746 $5,920 $6,023 Preferred stock $55 $55 $55 $55 $55 $55 $55 $55 $55 $55 $55 Minority interests $1,927 $1,809 $1,669 $1,583 $1,416 $1,340 $1,280 $1,391 $1,332 $1,253 $1,263 Common equity $15,255 $15,571 $14,621 $13,947 $14,120 $13,834 $13,611 $13,282 $13,045 $12,761 $12,766 Denominator (sum total) $24,924 $25,123 $23,885 $22,475 $22,982 $22,421 $22,236 $21,144 $21,185 $20,967 $21,376 Return on Capital 11.8% 11.8% 12.7% 13.2% 12.2% 11.2% 9.7% 8.3% 8.3% 8.3% 7.8% |
 32 [Alcoa logo] Return on capital, excluding growth investments is a non-GAAP financial measure. Management believes that this measure is meaningful to investors because it provides greater insight with respect to the underlying operating performance of the company’s productive assets. The company has significant growth investments underway in its upstream and downstream businesses, as previously noted, with expected completion dates over the next several years. As these investments generally require a period of time before they are productive, management believes that a return on capital measure excluding these growth investments is more representative of current operating performance. Reconciliation of Adjusted Return on Capital 32 3Q'07 2Q'07 1Q'07 4Q'06 3Q'06 2Q'06 1Q'06 4Q'05 3Q'05 2Q'05 1Q'05 Bloomberg Bloomberg Bloomberg Bloomberg Bloomberg Bloomberg Bloomberg Bloomberg Bloomberg Bloomberg Bloomberg (In Millions) Method Method Method Method Method Method Method Method Method Method Method Numerator (sum total) $2,936 $2,975 $3,029 $2,975 $2,803 $2,501 $2,159 $1,753 $1,763 $1,744 $1,673 Russia, Bohai, and Kunshan net losses ($57) ($51) ($79) ($74) ($85) ($78) ($86) ($71) ($48) ($41) ($12) Adjusted numerator $2,993 $3,026 $3,108 $3,049 $2,888 $2,579 $2,245 $1,824 $1,811 $1,785 $1,685 Average Balances Denominator (sum total) $24,924 $25,123 $23,885 $22,475 $22,982 $22,421 $22,236 $21,144 $21,185 $20,967 $21,376 Capital projects in progress and Russia, Bohai, and Kunshan capital base $4,430 $4,521 $3,945 $3,655 $2,540 $2,330 $2,139 $1,913 $1,776 $1,478 $1,403 Adjusted denominator $20,494 $20,602 $19,940 $18,820 $20,442 $20,091 $20,097 $19,231 $19,409 $19,489 $19,973 Return on capital, excluding growth investments 14.6% 14.7% 15.6% 16.2% 14.1% 12.8% 11.2% 9.5% 9.3% 9.2% 8.4% |
 33 [Alcoa logo] Reconciliation of EBITDA Margin 33 Year ended December 31, 2006 Ninemonths ended September30, 2007 Year ended December 31, 2006 Ninemonths ended September30, 2007 Year ended December 31, 2006 Ninemonths ended September30, 2007 Flat - Rolled Products Extruded and End Products Engineered Solutions After-tax operating income (ATOI)(1) $ 255 $ 216 $ 60 $ 93 $ 331 $ 258 Add: Income taxes 68 90 18 45 101 129 Less: Other income and (expenses), net (2) (26) (6) 2 24 (5) – Net margin 349 312 76 114 437 387 Add: Depreciation, depletion , and amortization 219 168 118 30 169 129 Earnings before interest, taxes, depreciation, and amortization (EBITDA) (3) $ 568 $ 480 $ 194 $ 144 $ 606 $ 516 Third-party sales $ 8,297 $ 6,928 $ 4,419 $ 2,703 $ 5,456 $ 4,334 Intersegment sales 246 182 99 81 – – Total Sales $ 8,543 $ 7,110 $ 4,518 $ 2,784 $ 5,456 $ 4,334 EBITDA Margin (4) 6.6% 6.8% 4.3% 5.2% 11.1% 11.9% (1) See Slide 33 for a reconciliation of segment ATOI to consolidated net income. (2) Other income and (expenses), net, include equity income (loss), gain or loss on sale of assets, markto-market activities and otheritems. -to-market activities and otheritems. (3) Alcoa’s definition of EBITDA is net margin plus depreciation, depletion, and amortization. Net margin is equivalent to sales minus the following items: cost of goods sold; selling, general administrative, and other expenses; and research and development expenses. (4) EBITDA Margin is calculated by dividing EBITDA by Total Sales. |
 34 [Alcoa logo] Reconciliation of EBITDA Margin – P&C Year ended December 31, 2006 Nine months ended September 30, 2007 Packaging and Consumer: After-tax operating income (ATOI) (1) $ 95 $ 92 Add: Income taxes 33 41 Less: Other income and (expenses), net (2) 6 2 Net margin 122 131 Add: Depreciation, depletion, and amortization 124 89 Earnings before interest, taxes, depreciation, and amortization (EBITDA) (3) $ 246 $ 220 Third-party sales $ 3,235 $ 2,401 EBITDA Margin (4) 7.6% 9.2% (1) See Slide 33 for a reconciliation of segment ATOI to consolidated net income. (2) Other income and (expenses), net, include equity income (loss), gain or loss on sale of assets, mark-to-market activities and other items. (3) Alcoa’s definition of EBITDA is net margin plus depreciation, depletion, and amortization. Net margin is equivalent to sales minus the following items: cost of goods sold; selling, general administrative, and other expenses; and research and development expenses. (4) EBITDA Margin is calculated by dividing EBITDA by Third-party Sales. 34 |
 35 [Alcoa logo] 45.3 43.1 47.7 Days of Working Capital $ 7,387 $ 8,066 $ 7,631 Sales $ 3,638 $ 3,819 $ 3,956 Working Capital 2,649 2,388 2,209 Less: Accounts payable, trade 3,311 3,216 3,363 Add: Inventories $ 2,976 $ 2,991 $ 2,802 Receivables from customers, less allowances September 30, 2007 June 30, 2007 (a) September 30, 2006 (a) Quarter ended Days of Working Capital = Working Capital divided by (Sales/number of days in the quarter) (a) Certain financial information for the quarters ended September 30, 2006 and June 30, 2007 has been reclassified to reflect the movement of the automotive castings and packaging and consumer businesses to held for sale in the third quarter of 2007. Also, certain financial information for the quarter ended September 30, 2006 has been reclassified to reflect the movement of the soft alloy extrusions business to held for sale in the fourth quarter of 2006. Days of Working Capital 35 |
 36 [Alcoa logo] Reconciliation of Income, excluding Restructuring Charges & Transaction Costs Income from continuing operations – excluding restructuring and other charges and transaction costs is a non-GAAP financial measure. Management believes that this measure is meaningful to investors because management reviews the operating results of Alcoa excluding the impacts of restructuring and other charges and transaction costs. There can be no assurances that additional restructuring and other charges and transaction costs will not occur in future periods. To compensate for this limitation, management believes that it is appropriate to consider both income from continuing operations determined under GAAP as well as income from continuing operations – excluding restructuring and other charges and transaction costs. * Transaction costs (investment banking, legal, audit-related, and other third-party expenses related to the Alcan offer) are included in Selling, general administrative, and other expenses on the Condensed Statement of Consolidated Income. $ 712 Income from continuing operations – excluding restructuring and other charges and transaction costs (21) Restructuring and other charges 17 Transaction costs* 716 Income from continuing operations (1) Loss from discontinued operations $ 715 Net income 2Q07 Quarter ended 36 |