![]() [Alcoa logo] January 9, 2008 4 Quarter 2007 Analyst Conference Exhibit 99.2 th |
![]() 2 [Alcoa logo] Today’s discussion may include “forward-looking statements” within the meaning of the Private Securities Litigation Reform Act of 1995. Such statements relate to future events and expectations and involve known and unknown risks and uncertainties. Alcoa’s actual results or actions may differ materially from those projected in the forward-looking statements. For a summary of the specific risk factors that could cause results to differ materially from those expressed in the forward-looking statements, please refer to Alcoa’s Form 10-K for the year ended December 31, 2006 and Forms 10-Q for the quarters ended March 31, 2007, June 30, 2007 and September 30, 2007 filed with the Securities and Exchange Commission. Forward Looking Statements |
![]() [Alcoa logo] Executive Vice President and Chief Financial Officer Charles D. McLane |
![]() 4 [Alcoa logo] Source: IAI and LME Global Days of Consumption |
![]() 5 [Alcoa logo] Primary Aluminum Consumption Growth Rates Source: Alcoa analysis |
![]() 6 [Alcoa logo] China Metal Balance Source: IAI and China Nonferrous Industry Association |
![]() 7 [Alcoa logo] 4Q07 and 2007 Global Market Dynamics |
![]() 8 [Alcoa logo] 4 th Quarter 2007 Financial Overview – Income from continuing operations of $624m or $0.74 per share – Revenues of $7.4b – Cash from operations of $643m – Debt-to-cap at 30.2% – Trailing four quarters ROC of 12.7% |
![]() 9 [Alcoa logo] 4 th Quarter 2007 Financial Overview $ In Millions 3Q'07 4Q'07 Change Sales $7,387 $7,387 $0 Cost of Goods Sold $5,910 $6,153 $243 % of Sales 80.0% 83.3% 3.3 pts. SG&A $365 $383 $18 % of Sales 4.9% 5.2% 0.3 pts. Restructuring and Other Charges $577 ($14) ($591) Interest Expense $151 $81 ($70) Other Income, Net ($1,731) ($78) $1,653 Effective Tax Rate 63.0% -44.8% 107.8 pts. Minority Interests $76 $64 ($12) GAAP Net Income $555 $632 $77 (Loss) Income from Discontinued Operations ($3) $8 $11 GAAP Income From Continuing Operations $558 $624 $66 |
![]() 10 [Alcoa logo] 3 rd Quarter vs. 4 th Quarter Comparison |
![]() 11 [Alcoa logo] 4 th Quarter 2007 Cash Flow Review $ In Millions 4Q'06 4Q'07 Net Income $359 $632 DD&A 325 310 Change in Working Capital 362 519 Other Adjustments 340 (793) Pension Contributions (53) (25) Cash From Operating Activities 1,333 643 Dividends to Shareholders (131) (143) Change in Debt (676) 467 Dividends to Minority Interests (119) (58) Contributions from Minority Interests 278 105 Share Repurchases 0 (948) Share Issuances 14 16 Other Financing Activities 1 2 Cash From Financing Activities (633) (559) Capital Expenditures (1,147) (1,021) Sales of Investments 28 30 Other Investing Activities 350 72 Cash From Investing Activities ($769) ($919) |
![]() 12 [Alcoa logo] 4Q’07 3Q’07 4Q’06 2,030 1,937 2,084 3 Party Shipments (kmt) 3,855 3,775 3,790 Production (kmt) 688 664 711 3 Party Revenue ($MM) 205 215 259 ATOI ($MM) 2% production increase sequentially Higher energy and freight costs Unfavorable currency Alumina 4 th Quarter Highlights 1 st Quarter Outlook Prices to follow approximate two-month lag Anticipate slight production increase Continued pressure from fuel oil and natural gas prices Currency risk 4 th Quarter Business Conditions rd rd |
![]() 13 [Alcoa logo] 4 th Quarter Highlights 196 283 480 ATOI ($MM) 2,646 2,734 2,766 3 Party Price ($/MT) 1,597 1,600 1,698 3 Party Revenue ($MM) 4Q’07 3Q’07 4Q’06 624 584 556 3 Party Shipments (kmt) 959 934 908 Production (kmt) Primary Metals 1 st Quarter Outlook 4 th Quarter Business Conditions Lower realized pricing sequentially Unfavorable currency 3% production increase sequentially Positive impact of recovery at Rockdale and Tennessee Anticipate 5% production increase sequentially Higher energy costs Currency risk rd rd rd |
![]() 14 [Alcoa logo] Higher Russia ramp-up costs Market weakness – especially in Europe Distributor de-stocking persists Impact of currency / restructuring efforts in Australia Rolled Products Startup costs at Bohai 4Q’07 3Q’07 4Q’06 (16) 61 62 ATOI ($MM) 2,243 2,309 2,127 3 Party Revenue ($MM) Flat-Rolled Products 4 th Quarter Highlights 1 st Quarter Outlook 4 th Quarter Business Conditions Improved market conditions Improved Russia performance Continued startup costs at Bohai rd |
![]() 15 [Alcoa logo] (7) (7) (4) Other 60 102 (35) 3Q’07 Total Investment Castings, Forgings, Fasteners AFL, Auto Castings and Structures 73 61 16 4Q’06 58 76 (11) 4Q’07 Aerospace market remains strong but shipments tempered by de-stocking Continued weakness in North American commercial transportation partially mitigated by share gains Decline in North American automotive AFL turnaround progressing as planned Engineered Solutions ATOI ($MM) 4 th Quarter Business Conditions 1 st Quarter Outlook Strong aerospace market to continue but de-stocking still could have some impact North American heavy truck downturn to extend into 2008 Stronger IGT market AFL restructuring to deliver improvement |
![]() 16 [Alcoa logo] 0 (7) 18 Soft Alloy Joint Venture and Other 4Q’07 3Q’07 4Q’06 16 13 27 Total 16 20 9 Global Hard Alloy Extrusions, Building & Construction Systems and Russia Comparable market and operating conditions as 3Q Extruded and End Products ATOI ($MM) 4 th Quarter Business Conditions 1 st Quarter Outlook Building & Construction markets could be slightly weaker Expect consistent operating conditions |
![]() 17 [Alcoa logo] 17 0 (1) Other 36 0 36 3Q’07 Total Reynolds Food Packaging and Flexible Packaging Closure Systems and Consumer Products 26 (9) 36 4Q’06 56 (3) 42 4Q’07 Packaging and Consumer ATOI ($MM) 4 th Quarter Business Conditions 1 st Quarter Outlook Sale expected to close by end of 1 st quarter – Seasonal decline in Closures business offset by seasonal improvement in Consumer business – Improved consumer product mix $0 $10 $20 $30 $40 $50 $60 1Q06 2Q06 3Q06 4Q06 1Q07 2Q07 3Q07 4Q07 $500 $600 $700 $900 ATOI Third Party Revenue |
![]() 18 [Alcoa logo] 2007 Financial Performance – Record income from continuing operations of $2.6b or $2.95 per share – Record revenues of $30.7b – Record cash from operations of $3.1b – Debt to cap of 30.2% – Trailing twelve months ROC of 16.1% excluding impact of growth projects – Dividend increase of 13% – Total Shareholder Return increase of 24% |
![]() 19 [Alcoa logo] 2007 vs. 2006 Bridge |
![]() 20 [Alcoa logo] 2007 Cash Flow Review $ In Millions 2006 2007 Net Income $2,248 $2,564 DD&A 1,280 1,269 Change in Working Capital (903) 782 Other Adjustments 339 (1,182) Pension Contributions (397) (322) Cash From Operating Activities 2,567 3,111 Dividends to Shareholders (523) (590) Change in Debt 679 654 Dividends to Minority Interests (400) (368) Contributions from Minority Interests 342 474 Share Repurchases (290) (2,496) Share Issuances 155 835 Other Financing Activities 17 (47) Cash From Financing Activities (20) (1,538) Capital Expenditures (3,205) (3,636) Sales of Investments 35 2,011 Other Investing Activities 329 0 Cash From Investing Activities ($2,841) ($1,625) |
![]() 21 [Alcoa logo] Share Repurchase Program Based on 870M Shares Outstanding As of January 19, 2007 ~8% repurchased as of 4Q 2007 ~17% additional authorized – 10% repurchase program authorized January 2007 – ~68M shares repurchased through 4Q 2007 – Expanded 25% repurchase program authorized October 2007 Timeline Overview 653M 68M 149M |
![]() 22 [Alcoa logo] 2007 Financial Targets |
![]() [Alcoa logo] Chairman and Chief Executive Officer Alain J.P. Belda |
![]() 24 [Alcoa logo] 2007 Accomplishments – Environmental, Health and Safety – Innovation and Technology – Portfolio Management – Long-Term Growth – Financial Performance |
![]() 25 [Alcoa logo] Sustainability, Environment, Health and Safety – Named a component of the Dow Jones Sustainability Index for the sixth year – Recognized as “Best in Class” in response to climate change by the Carbon Disclosure Project – Earned “Best in Class” status by Storebrand Investments – Ranked 1 st in the Metals and Mining sector and 5 th overall in the Covalence Ethical Ranking |
![]() 26 [Alcoa logo] – New generation of aluminum-lithium alloys – New generation of energy-efficient, environmentally friendly transportation – New market penetration in oil and gas – Stronger, lighter, faster defense solutions Innovation and Technology |
![]() 27 [Alcoa logo] Portfolio Management – Signed agreement to sell the packaging business – Monetized Chalco investment – Finalized the soft alloy extrusions joint venture – Restructured the Electrical and Electronic Solutions business – Closed on the auto castings sale |
![]() 28 [Alcoa logo] Portfolio Management |
![]() 29 [Alcoa logo] Long-Term Growth – Opened our 3 rd FRP facility (Kunshan) in China – Continued to expand the Bohai plant in China – Continued to make progress on the Russia assets – Continued the construction of the Juruti and Sao Luis projects – Invested in the Serra do Facao hydroelectric project – Opened the anode plant in Norway and our smelter in Iceland |
![]() 30 [Alcoa logo] Long-Term Growth Re-Powering the Smelter Portfolio |
![]() 31 [Alcoa logo] 2007 Financial Performance – Record income from continuing operations of $2.6b or $2.95 per share – Record revenues of $30.7b – Record cash from operations of $3.1b – Debt to cap of 30.2% – Trailing twelve months ROC of 16.1% excluding impact of growth projects – Dividend increase of 13% – Total Shareholder Return increase of 24% |
![]() 32 [Alcoa logo] 2007 Challenges – Higher input costs – Unfavorable currency – Primary curtailments – Progress in Russia – Higher construction costs |
![]() 33 [Alcoa logo] 2008 Outlook – Market Fundamentals – Market Conditions – Portfolio Improvements – Catalysts |
![]() 34 [Alcoa logo] LME Forward Price Curve Source: LME |
![]() 35 [Alcoa logo] Primary Aluminum Consumption Growth Rates Source: Alcoa analysis |
![]() 36 [Alcoa logo] 2008 Market Outlook and Impact |
![]() 37 [Alcoa logo] 2008 Catalysts |
![]() 38 [Alcoa logo] Tony Thene Director, Investor Relations Alcoa 390 Park Avenue New York, N.Y. 10022-4608 Telephone: (212) 836-2674 Facsimile: (212) 836-2813 www.alcoa.com For Additional Information, Contact: |
![]() 39 [Alcoa logo] [Alcoa logo] |
![]() 40 [Alcoa logo] APPENDIX [Alcoa logo] |
![]() 41 [Alcoa logo] Reconciliation of ATOI to Consolidated Net Income $ 2,564 $ 632 $ 555 $ 715 $ 662 $ 2,248 $ 359 Consolidated net income 702 306 456 (50) (10) 104 10 Other (7) 8 (3) (1) (11) 87 101 Discontinued operations (307) 1 (311) 21 (18) (379) (386) Restructuring and other charges (388) (100) (101) (101) (86) (317) (82) Corporate expense (365) (64) (76) (110) (115) (436) (98) Minority interests (261) (53) (98) (56) (54) (250) (61) Interest expense 40 10 10 9 11 58 14 Interest income (24) 9 10 (16) (27) (170) (66) Impact of LIFO Unallocated amounts (net of tax): $ 3,174 $ 515 $ 668 $ 1,019 $ 972 $ 3,551 $ 927 Total segment ATOI 2007 4Q07 3Q07 2Q07 1Q07 2006 4Q06 |
![]() 42 [Alcoa logo] Return on Capital (ROC) is presented based on Bloomberg Methodology which calculates ROC based on trailing four quarters. Reconciliation of Return on Capital 4Q'07 3Q'07 2Q'07 1Q'07 4Q'06 3Q'06 2Q'06 1Q'06 4Q'05 3Q'05 2Q'05 1Q'05 Bloomberg Bloomberg Bloomberg Bloomberg Bloomberg Bloomberg Bloomberg Bloomberg Bloomberg Bloomberg Bloomberg Bloomberg (In Millions) Method Method Method Method Method Method Method Method Method Method Method Method Net income $2,564 $2,291 $2,273 $2,302 $2,248 $2,113 $1,865 1,581 $1,233 $1,270 $1,271 $1,215 Minority interests $365 $399 $432 $446 $436 $418 $368 304 $259 $230 $239 $252 Interest expense (after-tax) $262 $246 $270 $281 $291 $272 $268 $274 $261 $263 $234 $206 Numerator (sum total) $3,191 $2,936 $2,975 $3,029 $2,975 $2,803 $2,501 $2,159 $1,753 $1,763 $1,744 $1,673 Average Balances Short-term borrowings $516 $497 $451 $441 $386 $349 $303 $342 $279 $155 $152 $185 Short-term debt $356 $525 $359 $360 $284 $449 $55 $53 $58 $272 $273 $269 Commercial paper $1,164 $1,275 $1,169 $972 $1,192 $1,678 $1,501 $1,652 $771 $581 $553 $815 Long-term debt $5,574 $5,390 $5,709 $5,767 $5,027 $4,915 $5,333 $5,243 $5,309 $5,746 $5,920 $6,023 Preferred stock $55 $55 $55 $55 $55 $55 $55 $55 $55 $55 $55 $55 Minority interests $2,130 $1,927 $1,809 $1,669 $1,583 $1,416 $1,340 $1,280 $1,391 $1,332 $1,253 $1,263 Common equity $15,269 $15,255 $15,571 $14,621 $13,947 $14,120 $13,834 $13,611 $13,282 $13,045 $12,761 $12,766 Denominator (sum total) $25,064 $24,924 $25,123 $23,885 $22,474 $22,982 $22,421 $22,236 $21,144 $21,185 $20,967 $21,376 Return on Capital 12.7% 11.8% 11.8% 12.7% 13.2% 12.2% 11.2% 9.7% 8.3% 8.3% 8.3% 7.8% |
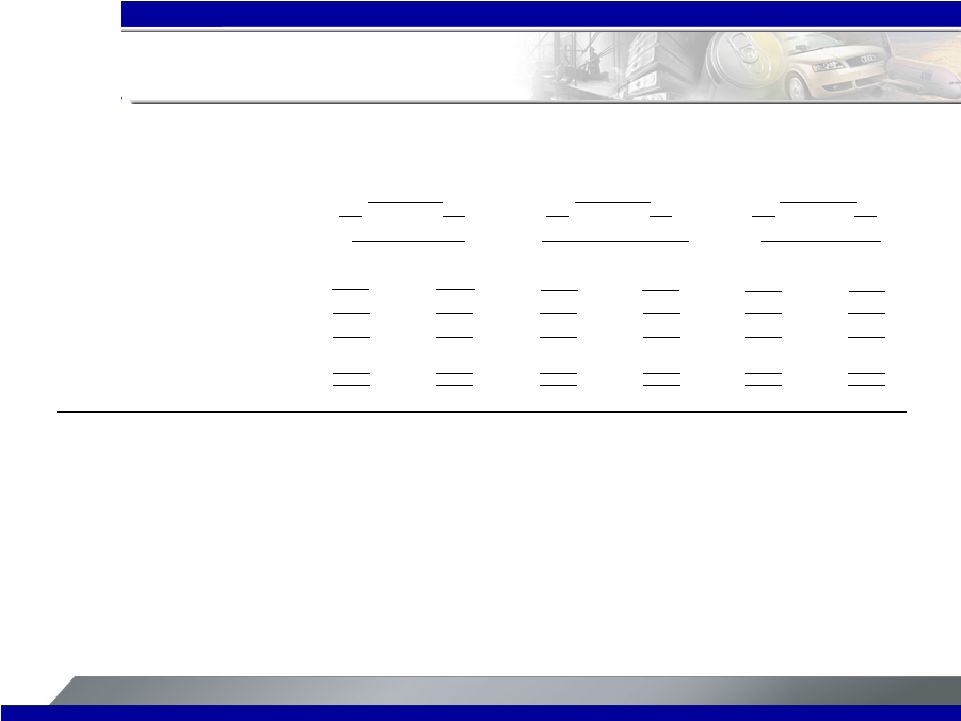
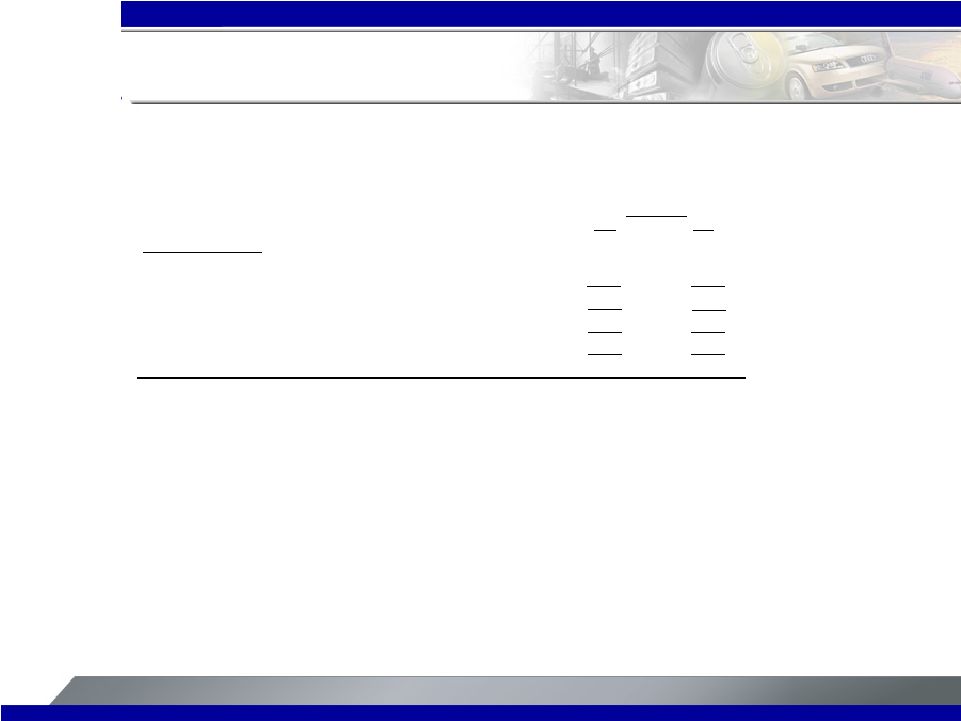
![]() 43 [Alcoa logo] Return on capital, excluding growth investments is a non-GAAP financial measure. Management believes that this measure is meaningful to investors because it provides greater insight with respect to the underlying operating performance of the company’s productive assets. The company has significant growth investments underway in its upstream and downstream businesses, as previously noted, with expected completion dates over the next several years. As these investments generally require a period of time before they are productive, management believes that a return on capital measure excluding these growth investments is more representative of current operating performance. Reconciliation of Adjusted Return on Capital 4Q'07 3Q'07 2Q'07 1Q'07 4Q'06 3Q'06 2Q'06 1Q'06 4Q'05 3Q'05 2Q'05 1Q'05 Bloomberg Bloomberg Bloomberg Bloomberg Bloomberg Bloomberg Bloomberg Bloomberg Bloomberg Bloomberg Bloomberg Bloomberg (In Millions) Method Method Method Method Method Method Method Method Method Method Method Method Numerator (sum total) $3,191 $2,936 $2,975 $3,029 $2,975 $2,803 $2,501 $2,159 $1,753 $1,763 $1,744 $1,673 Russia, Bohai, and Kunshan net losses ($91) ($57) ($51) ($79) ($74) ($85) ($78) ($86) ($71) ($48) ($41) ($12) Adjusted numerator $3,282 $2,993 $3,026 $3,108 $3,049 $2,888 $2,579 $2,245 $1,824 $1,811 $1,785 $1,685 Average Balances Denominator (sum total) $25,064 $24,924 $25,123 $23,885 $22,474 $22,982 $22,421 $22,236 $21,144 $21,185 $20,967 $21,376 Capital projects in progress and Russia, Bohai, and Kunshan capital base $4,620 $4,430 $4,521 $3,945 $3,655 $2,540 $2,330 $2,139 $1,913 $1,776 $1,478 $1,403 Adjusted denominator $20,444 $20,494 $20,602 $19,940 $18,819 $20,442 $20,091 $20,097 $19,231 $19,409 $19,489 $19,973 Return on capital, excluding growth investments 16.1% 14.6% 14.7% 15.6% 16.2% 14.1% 12.8% 11.2% 9.5% 9.3% 9.2% 8.4% |
![]() 44 [Alcoa logo] Reconciliation of EBITDA Margin Year ended December 31, Year ended December 31, Year ended December 31, 2006 2007 2006 2007 2006 2007 Flat-Rolled Products Extruded and End Products Engineered Solutions After-tax operating income (ATOI) (1) $ 255 $ 200 $ 60 $ 109 $ 331 $ 316 Add: Income taxes 68 95 18 54 101 140 Less: Other income and (expenses), net (2) (26) (4) 2 34 (5) (2) Net margin 349 299 76 129 437 458 Add: Depreciation, depletion, and amortization 219 223 118 39 169 172 Earnings before interest, taxes, depreciation, and amortization (EBITDA) (3) $ 568 $ 522 $ 194 $ 168 $ 606 $ 630 Third-party sales $ 8,297 $ 9,171 $ 4,419 $ 3,246 $ 5,456 $ 5,725 Inter segment sales 246 241 99 88 – – Total Sales $ 8,543 $ 9,412 $ 4,518 $ 3,334 $ 5,456 $ 5,725 EBITDA Margin (4) 6.6% 5.5% 4.3% 5.0% 11.1% 11.0% (1) See Slide 41 for a reconciliation of segment ATOI to consolidated net income. (2) Other income and (expenses), net, include equity income (loss), gain or loss on sale of assets, mark- to- market activities and other items. (3) Alcoa’s definition of EBITDA is net margin excludingdepreciation, depletion, and amortization. Net margin is equivalent to sales minus the following items: cost of goods sold; selling, general administrative, and other expenses; and research and development expenses. (4) EBITDA Margin is calculated by dividing EBITDA by Total Sales. |
![]() 45 [Alcoa logo] Reconciliation of EBITDA Margin – P&C Year ended December 31, 2006 2007 Packaging and Consumer: After-tax operating income (ATOI) (1) $ 95 $ 148 Add: Income taxes 33 68 Less: Other income and (expenses), net (2) 6 2 Net margin 122 214 Add: Depreciation, depletion, 124 89 Earnings before interest, taxes, depreciation, and amortization (EBITDA) (3) $ 246 $ 303 Third-party sales $ 3,235 $ 3,288 EBITDA Margin (4) 7.6% 9.2% See Slide 41 for a reconciliation of segment ATOI to consolidated net income. Other income and (expenses), net, include equity income (loss), gain or loss on sale of assets, mark-to-market activities and other items. Alcoa’s definition of EBITDA is net margin excluding depreciation, depletion, and amortization. Net margin is equivalent to sales minus the following items: cost of goods sold; selling, general administrative, and other expenses; and research and development expenses. EBITDA Margin is calculated by dividing EBITDA by Third-party Sales. The Packaging and Consumer segment does not have intersegment sales. (1) (2) (3) (4) and amortization |
![]() 46 [Alcoa logo] 39.1 45.3 44.1 Days of Working Capital $ 7,387 $ 7,387 $ 7,840 Sales $ 3,141 $ 3,638 $ 3,761 Working Capital 2,787 2,649 2,407 Less: Accounts payable, trade 3,326 3,311 3,380 Add: Inventories $ 2,602 $ 2,976 $ 2,788 Receivables from customers, less allowances December 31, 2007 September 30, 2007 December 31, 2006 (a) Quarter ended Days of Working Capital = Working Capital divided by (Sales/number of days in the quarter) (a) Certain financial information for the quarter ended December 31, 2006 has been reclassified to reflect the movement of the automotive castings and packaging and consumer businesses to held for sale in the third quarter of 2007. Days of Working Capital |
![]() 47 [Alcoa logo] Reconciliation of Adjusted Income - Quarter Quarter ended 3Q07 4Q07 Net income $ 555 $ 632 (Loss) income from discontinued operations (3) 8 Income from continuing operations 558 624 Gain on sale of Chalco investment (1,140) – Transaction costs* 55 1 Restructuring and other charges** 867 (323) Income from continuing operations – excluding restructuring and other charges, transaction costs and Chalco gain $ 340 $ 302 ** * Transaction costs include investment banking, legal, accounting, and other third-party expense, and interest expense related to the Alcan offer. All costs expect for interest expense are included in Selling, general administrative, and other expenses on the Statement of Consolidated Income. Restructuring and other charges include discrete income tax adjustments related to the sale of the Packaging and Consumer businesses. These tax adjustments are included in the Provision for taxes on income on the Statement of Consolidated Income. |
![]() 48 [Alcoa logo] Reconciliation of Adjusted Income – Annual Year ended 2006 2007 Net income $ 2,248 $ 2,564 Income (loss) from discontinued operations 87 (7) Income from continuing operations 2,161 2,571 Transaction costs* – 73 Restructuring and other charges** 379 542 Income from continuing operations – excluding restructuring and other charges and transaction costs $ 2,540 $ 3,186 Transaction costs include investment banking, legal, accounting, and other third-party expenses, and interest expense related to the Alcan offer. All costs except for interest expense are included in Selling, general administrative, and other expenses on the Statement of Consolidated Income. Restructuring and other charges include discrete income tax adjustments related to the sale of the Packaging and Consumer businesses. These tax adjustments are included in the Provision for taxes on income on the Statement of Consolidated Income. * * |
![]() 49 [Alcoa logo] Portfolio Management Soft Alloy Packaging Automotive 2007 2007 Extrusions & Consumer Castings As Adjusted Sales $ 30,748 $ 1,041 $ 3,288 $ 132 $ 26,287 Selling, general administrative, and other expenses (SG&A) $ 1,472 $ 30 $ 216 $ 3 $ 1,223 SG&A / Sales 4.8% 2.9% 6.6% 2.3% 4.7% EBITDA Margin: Net income (loss) $ 2,564 $ 69 $ 145 $ (50) $ 2,400 Add: Loss from discontinued operations 7 – – – 7 Minority interests 365 – 1 – 364 Provision (benefit) for taxes on income 1,555 35 67 (25) 1,478 Other income, net (1,913) (67) (2) – (1,844) Interest expense 401 – 1 1 399 Restructuring and other charges 399 (2) 2 71 328 Goodwill impairment charge 133 – – – 133 Provision for depreciation, depletion, and amortization 1,268 35 89 10 1,134 Earnings before interest, taxes, depreciation, and amortization (EBITDA) (1 ) $ 4,779 $ 70 $ 303 $ 7 $ 4,399 EBITDA Margin (EBITDA / Sales) 15.5% 6.7% 9.2% 5.3% 16.7% Return on Capital(2) : Numerator $ 3,191 $ 69 $ 145 $ (50) $ 3,027 Denominator $ 25,064 $ – $ 2,600 $ – $ 22,464 Return on Capital 12.7% 13.5% (1) Alcoa’s definition of EBITDA is net margin excluding depreciation, depletion, and amortization. Net margin is equivalent to sales minus the following items: cost of goods sold; selling, general administrative, and other expenses; and research and development expenses. (2) r See Slide 42 for the calculation of the numerator and denominator in the 2007 column. The $2,600 in the Packaging & Consumer column represents the estimated sale proceeds minus estimated cash taxes of $100 and is reducing the denominator as it is assumed that the net cash proceeds will be used to repay debt or repurchase stock . |
![]() 50 [Alcoa logo] [Alcoa logo] |