 [Alcoa logo] April 7, 2008 1 st Quarter 2008 Analyst Conference Exhibit 99.2 |
 2 [Alcoa logo] Forward Looking Statements Today’s discussion may include “forward-looking statements” within the meaning of the Private Securities Litigation Reform Act of 1995. Such statements relate to future events and expectations and involve known and unknown risks and uncertainties. Alcoa’s actual results or actions may differ materially from those projected in the forward-looking statements. For a summary of the specific risk factors that could cause results to differ materially from those expressed in the forward-looking statements, please refer to Alcoa’s Form 10-K for the year ended December 31, 2007 filed with the Securities and Exchange Commission. |
 [Alcoa logo] Executive Vice President and Chief Financial Officer Chuck McLane |
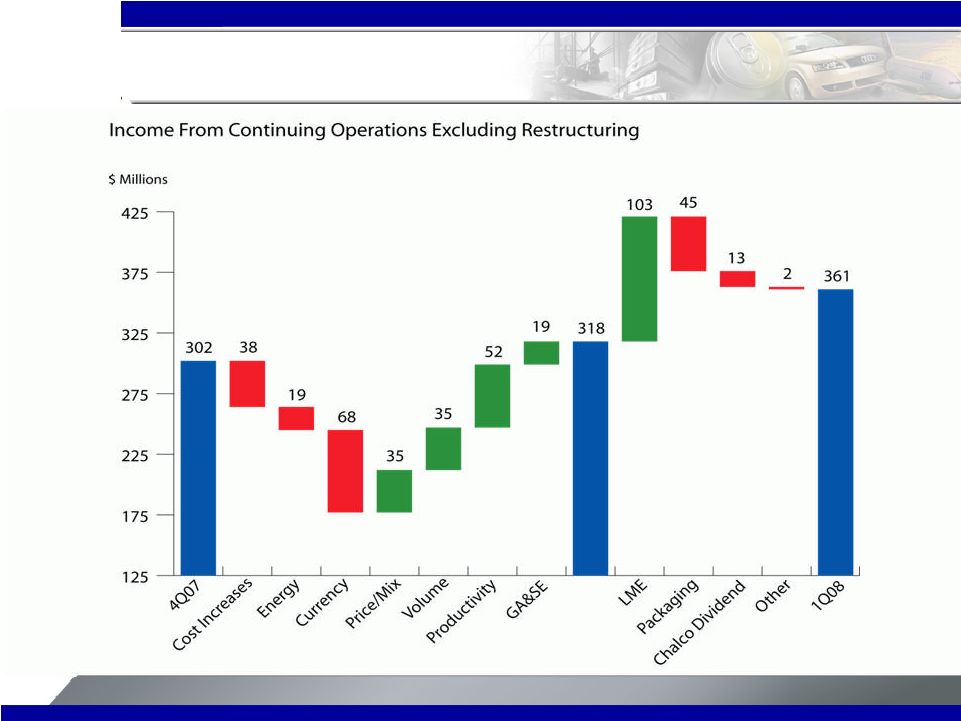
 4 [Alcoa logo] 1 st Quarter 2008 Financial Overview – Income from continuing operations of $303m or $0.37 per share - $361m or $0.44 per share excluding the impact of restructurings – Revenues of $7.4b – Currency impact of $68m or $0.08 per share sequentially, including $48m, or $0.06 per share non- cash translation – Segment ATOI increased 42% excluding Packaging – Debt-to-cap at 31.5% – Trailing four quarters ROC of 10.7%; 13.5% excluding growth |
 5 [Alcoa logo] 1 st Quarter 2008 Financial Overview $ In Millions 4Q'07 1Q'08 Change Sales $7,387 $7,375 ($12) Cost of Goods Sold $6,153 $5,892 ($261) % of Sales 83.3% 79.9% (3.4 pts) SG&A $383 $328 ($55) % of Sales 5.2% 4.4% (0.8 pts) Restructuring and Other Charges ($14) $38 $52 Interest Expense $81 $99 $18 Other (Income)/Expense ($78) $58 $136 Effective Tax Rate -44.8% 35.6% 80.4 pts Minority Interests $64 $67 $3 GAAP Net Income $632 $303 ($329) Income from Discontinued Operations $8 $0 ($8) GAAP Income From Continuing Operations $624 $303 ($321) |
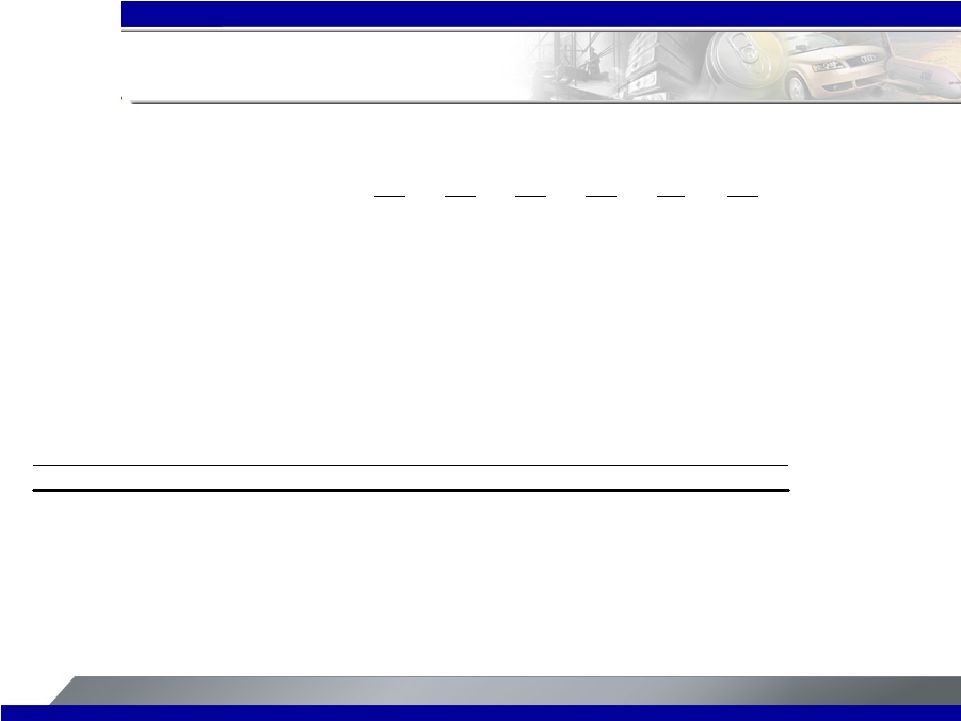
 6 [Alcoa logo] 4 th Quarter vs. 1 st Quarter Comparison |
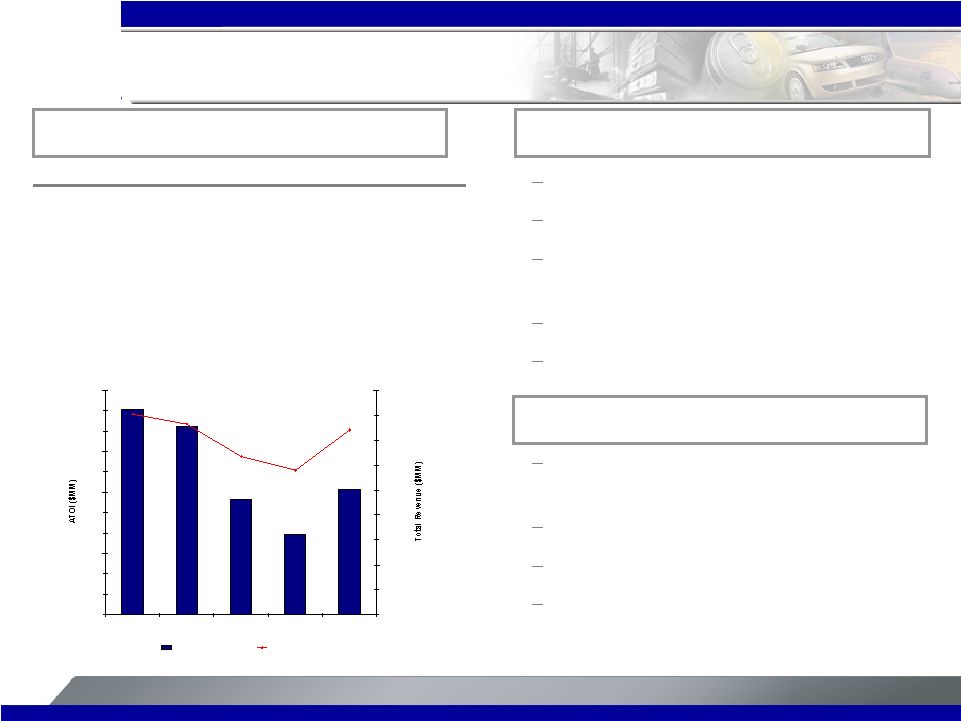
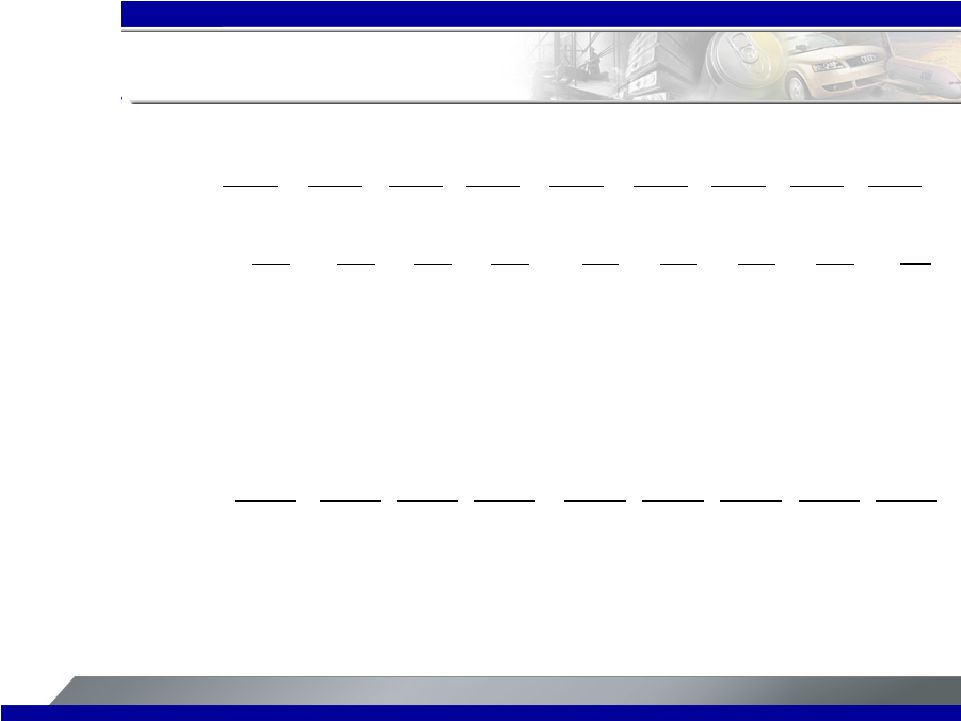
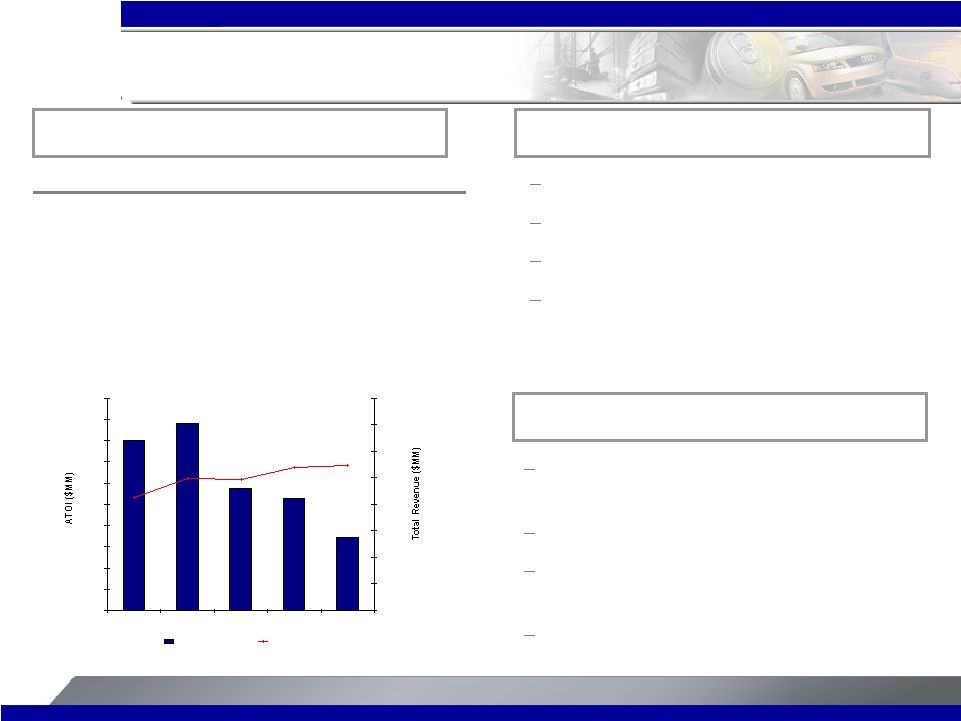 7 [Alcoa logo] 1Q’08 4Q’07 1Q’07 1,995 2,030 1,877 3 Party Shipments (kmt) 3,870 3,855 3,655 Production (kmt) 680 688 645 3 Party Revenue ($MM) 169 205 260 ATOI ($MM) Flat production sequentially Lower LME linked pricing Unfavorable currency & energy costs Pinjarra at targeted expansion production rate Alumina 1 st Quarter Highlights 2 nd Quarter Outlook Prices to follow approximate two-month lag Production at 1Q levels Continued pressure from fuel oil and natural gas prices Currency risk 1 st Quarter Business Conditions $100 $120 $140 $160 $180 $200 $220 $240 $260 $280 $300 1Q07 2Q07 3Q07 4Q07 1Q08 $800 $900 $1,000 $1,100 $1,200 $1,300 $1,400 $1,500 $1,600 ATOI Total Revenue rd rd |
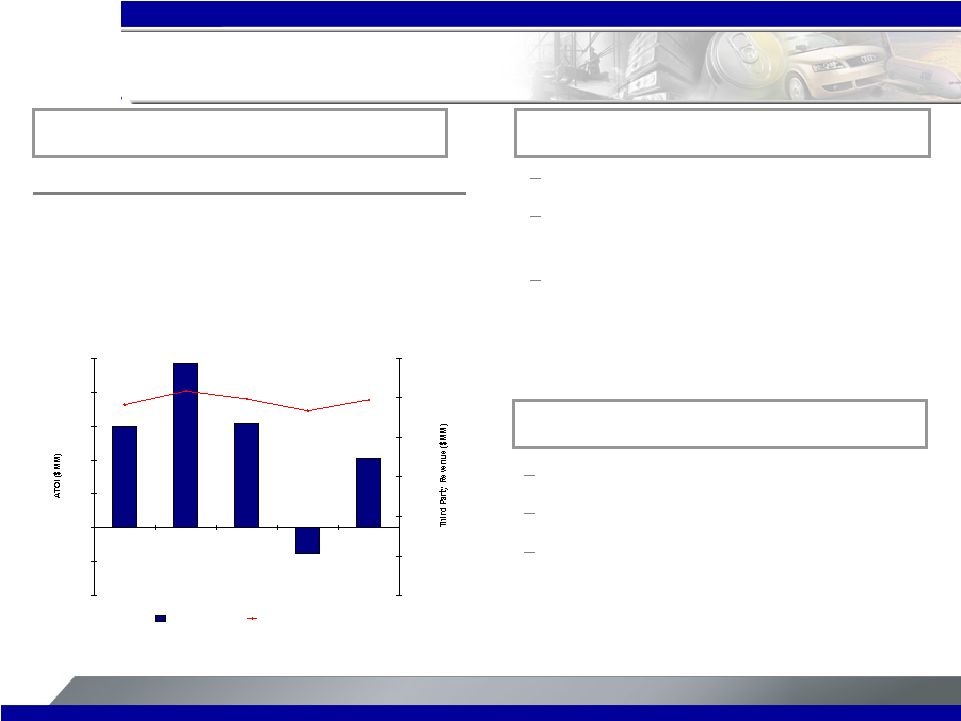
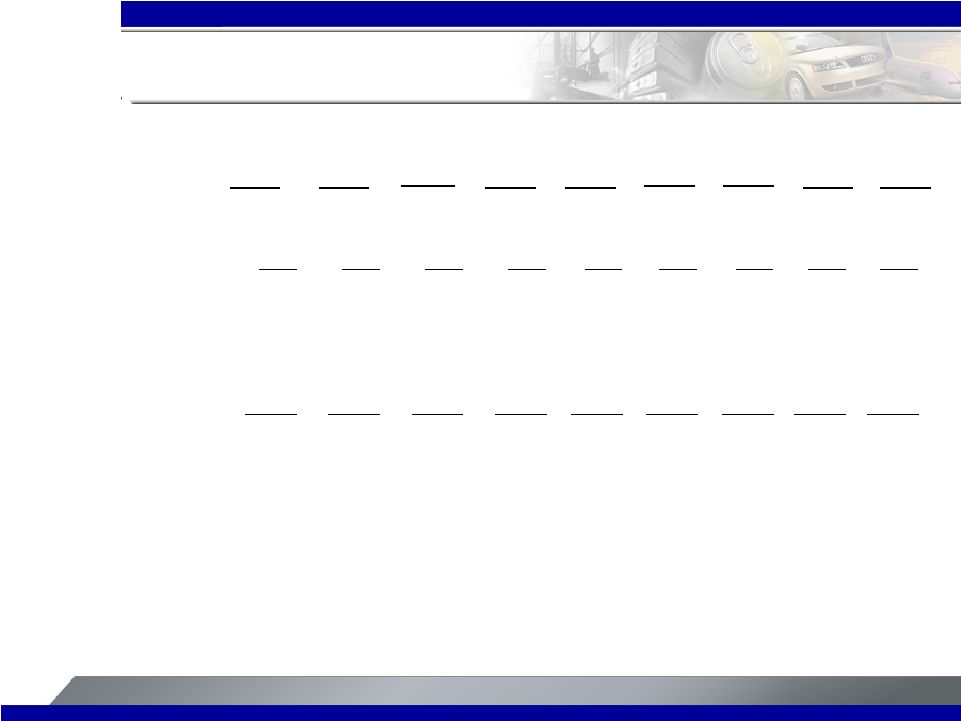
 8 [Alcoa logo] 1 st Quarter Highlights 307 196 504 ATOI ($MM) 2,801 2,646 2,902 3 Party Price ($/MT) 1,877 1,597 1,633 3 Party Revenue ($MM) 1Q’08 4Q’07 1Q’07 665 624 518 3 Party Shipments (kmt) 995 959 899 Production (kmt) Primary Metals 2 nd Quarter Outlook 1 st Quarter Business Conditions Higher realized pricing sequentially 4% production increase sequentially Iceland running at 70% capacity for the quarter; at 90% by quarter-end Unfavorable currency impact Higher costs for carbon products Anticipate 3% production increase sequentially Improved efficiencies at Iceland Currency risk Energy & input cost pressures $0 $50 $100 $150 $200 $250 $300 $350 $400 $450 $500 $550 1Q07 2Q07 3Q07 4Q07 1Q08 $1,500 $1,700 $1,900 $2,100 $2,300 $2,500 $2,700 $2,900 $3,100 $3,300 ATOI Total Revenue rd rd rd |
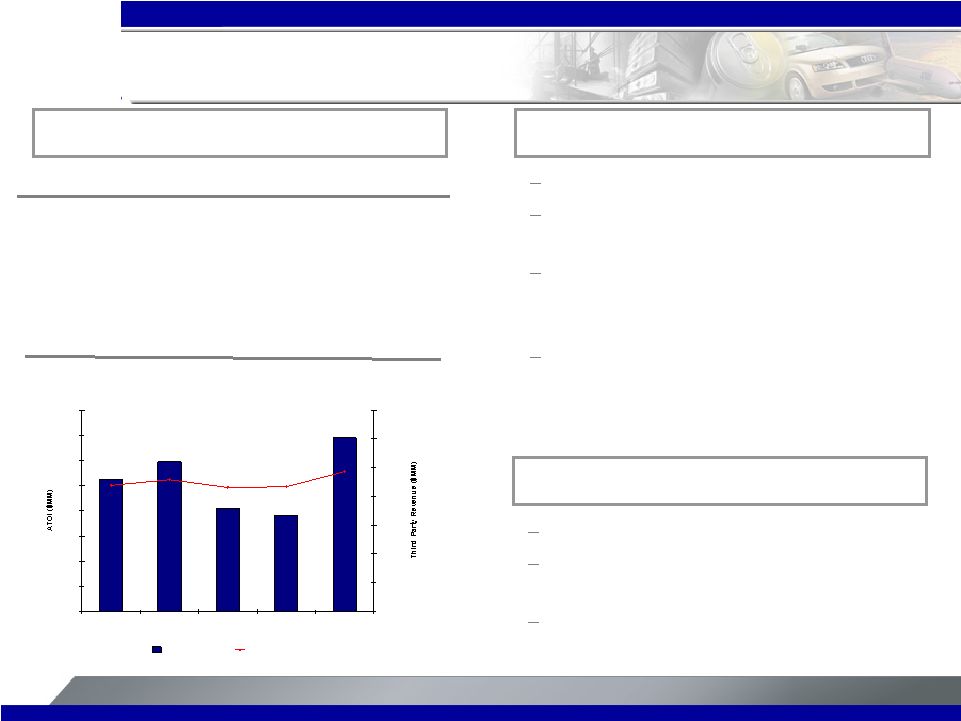
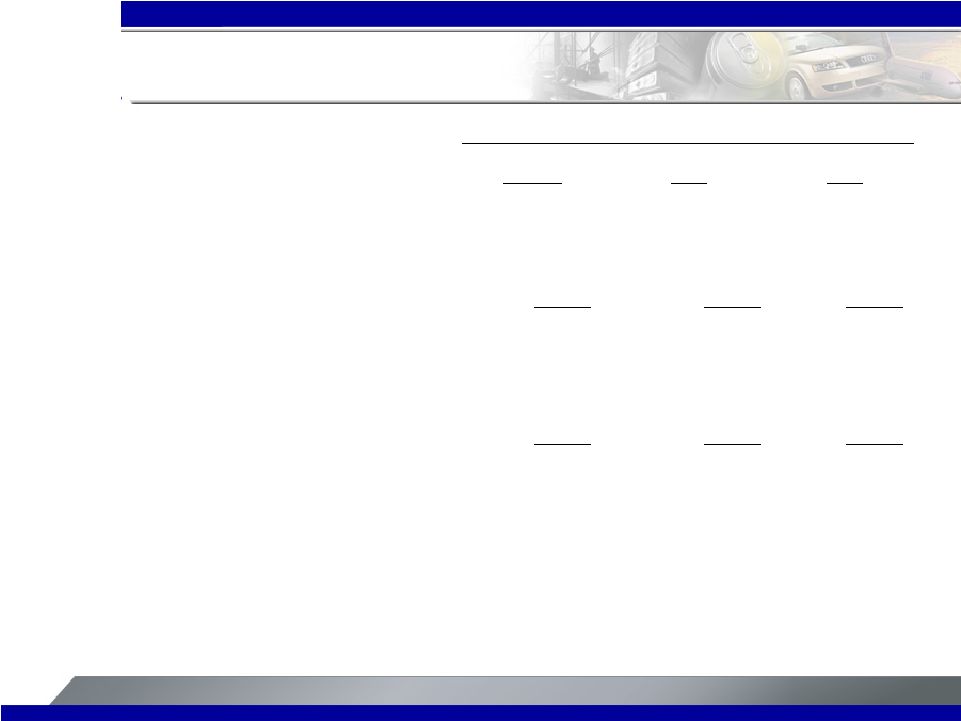
 9 [Alcoa logo] Improved Russia results Weak automotive demand in North America Higher costs for alloying materials & transportation 1Q’08 4Q’07 1Q’07 41 (15) 60 ATOI ($MM) 2,492 2,436 2,467 3 rd Party Revenue ($MM) Flat-Rolled Products 1 st Quarter Highlights 2 nd Quarter Outlook 1 st Quarter Business Conditions Improved Russia performance Seasonal increases in can sheet market General industrial climate weak in North America and Europe -$40 -$20 $0 $20 $40 $60 $80 $100 1Q07 2Q07 3Q07 4Q07 1Q08 $1,500 $1,700 $1,900 $2,100 $2,300 $2,500 $2,700 ATOI Third Party Revenue |
 10 [Alcoa logo] Engineered Products and Solutions 7 11 8 Building and Construction and Other 76 76 (11) 4Q’07 Total Investment Castings, Forgings, Fasteners AFL, Auto Castings and Structures 105 107 (10) 1Q’07 138 136 (5) 1Q’08 Revenue and ATOI record quarter Aerospace and IGT markets continue to show strength Deteriorating North American automotive market offset by restructuring efforts Strong productivity across Investment Castings, Fasteners, and Forgings ATOI ($MM) 1 st Quarter Business Conditions 2 nd Quarter Outlook Aerospace and IGT strength to continue Continued softness in North American automotive and heavy truck build rates Seasonal increase in building and construction revenues $0 $20 $40 $60 $80 $100 $120 $140 $160 1Q07 2Q07 3Q07 4Q07 1Q08 $800 $1,000 $1,200 $1,400 $1,600 $1,800 $2,000 $2,200 ATOI Third Party Revenue |
 11 [Alcoa logo] 1 st Quarter 2008 Cash Flow Review $ In Millions 1Q 07 1Q 08 Net Income $662 $303 DD&A 304 319 Change in Working Capital (187) (467) Other Adjustments (202) (424) Pension Contributions (50) (19) Cash From Operating Activities $527 ($288) Dividends to Shareholders (148) (140) Change in Debt 509 416 Dividends to Minority Interests (158) (39) Contributions from Minority Interests 114 118 Share Repurchases (88) (430) Share Issuances 82 22 Other Financing Activities (101) (2) Cash From Financing Activities $210 ($55) Capital Expenditures (783) (748) Sales of Assets 0 2,490 Other Investing Activities (45) (1,517) Cash From Investing Activities ($828) $225 |
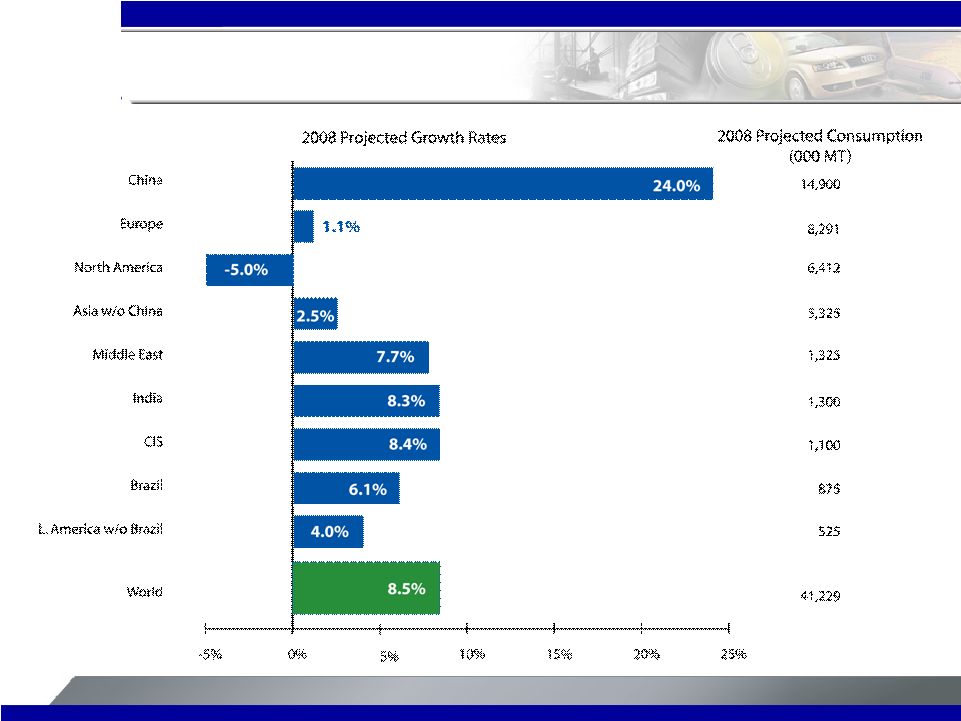 12 [Alcoa logo] Primary Aluminum Consumption Growth Rates Source: Alcoa analysis |
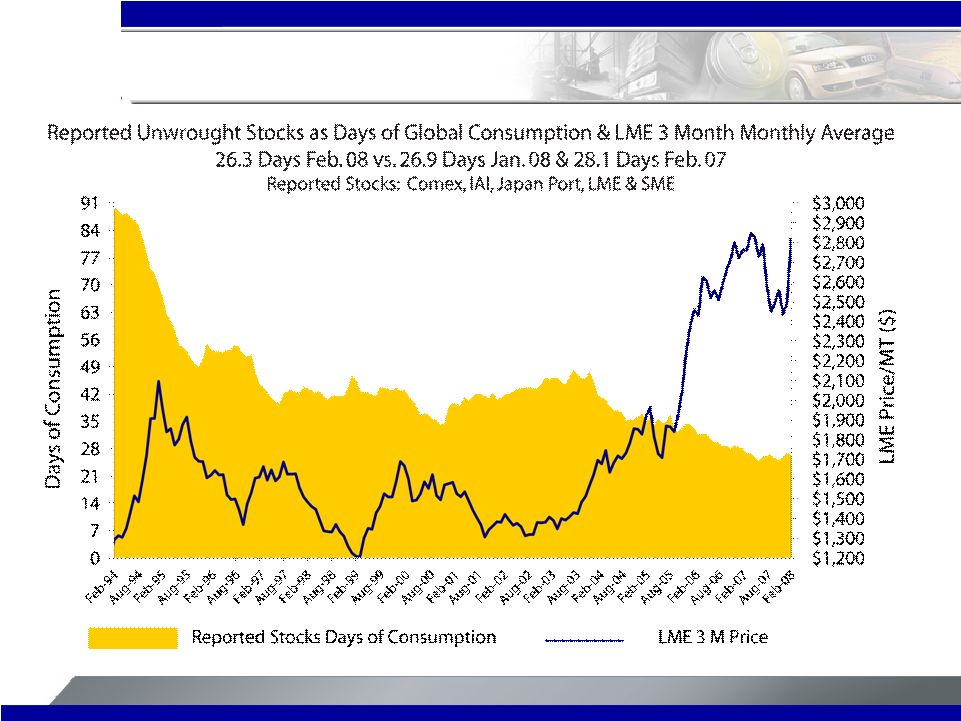 13 [Alcoa logo] Source: IAI and LME Global Days of Consumption |
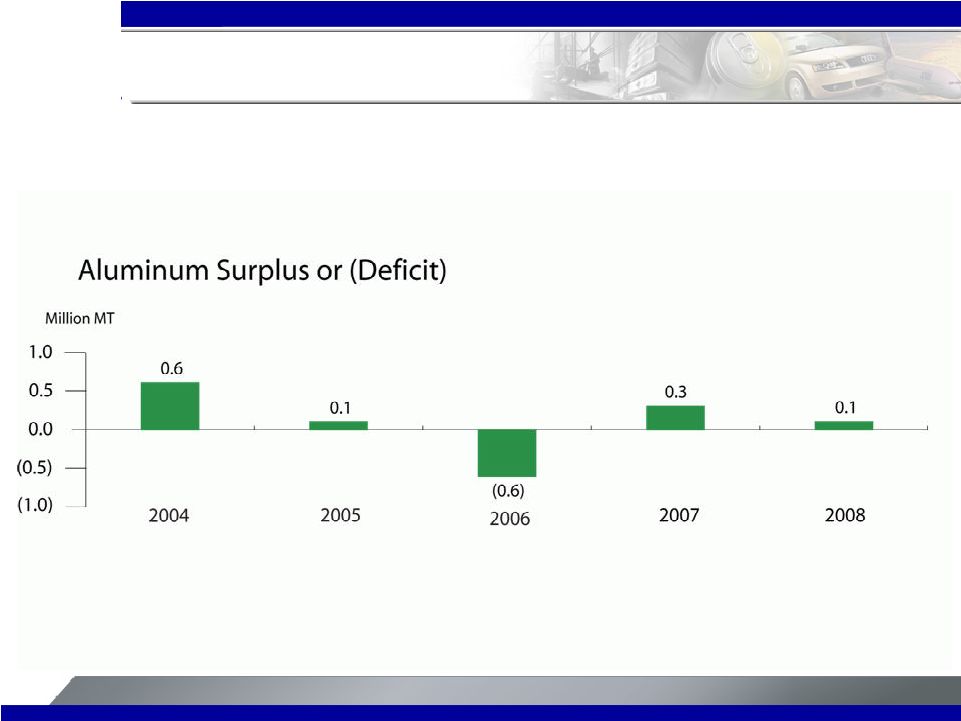 14 [Alcoa logo] Supply / Demand Projection Source: Alcoa analysis |
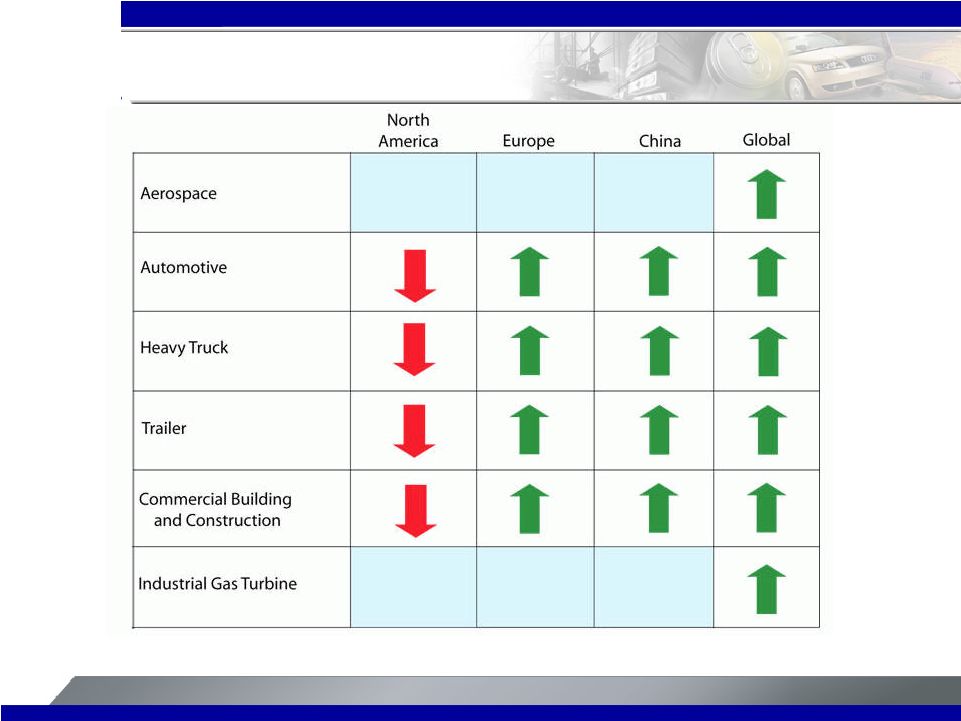 15 [Alcoa logo] 2008 Market Outlook and Impact |
 [Alcoa logo] Chairman and Chief Executive Officer Alain J.P. Belda |
 [Alcoa logo] President and Chief Operating Officer Klaus Kleinfeld |
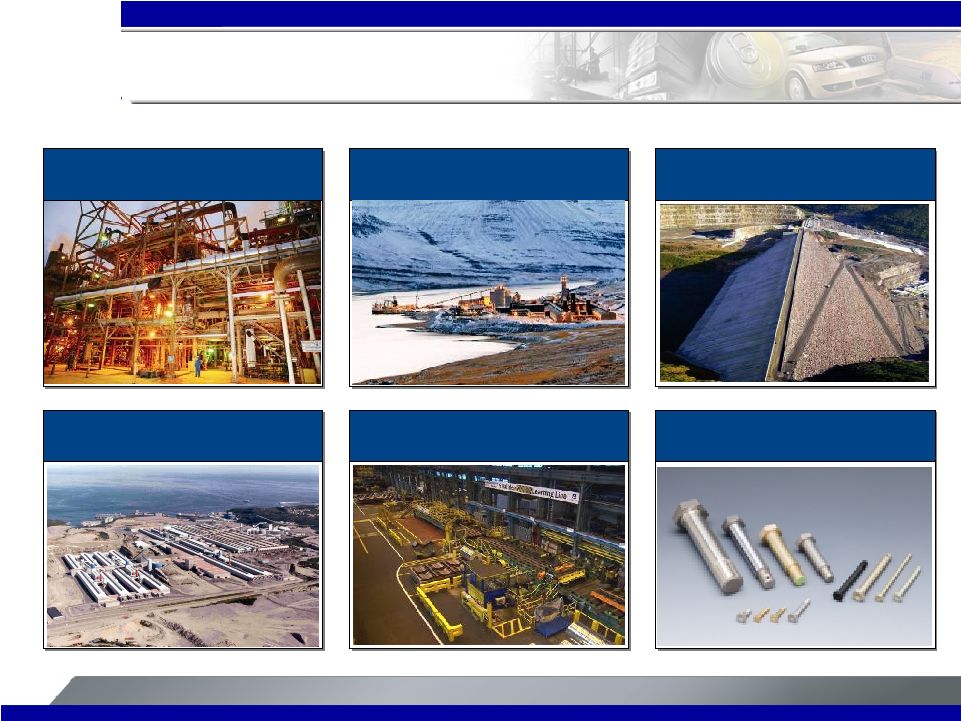
 18 [Alcoa logo] Global Mega Trends Generate Growth Opportunities Infrastructure Investment Increasing Mobility Shortening of Natural Resources Mega Trends Demographics Shifting Economies Demand for Safety & Security Aging Population Effects Globalization Urbanization Opportunities Global Warming Advanced Energy Exploration& Solutions Sustainable Construction Materials Growth of Mass Transportation Lightweight & Energy Efficient Transportation Aerospace Growth Recyclable Content |
 19 [Alcoa logo] 8.2 10.6 4.6 7.3 5.6 Strong Demand for Aluminum Continues World Aluminum Consumption (million metric tons) Source: Brook Hunt, Alcoa analysis 22 1998 China Rest of Asia 2.8 6.7 3.6 North 9.2 8.6 29.1 67 2017 East Eur/ Mid East/ Africa W.Europe South 6.7 5.2 12.0 38 2007 Europe/ME/ Africa Americas Asia 2.5 0.8 1.3 2.6 6% 6% CAGR 6% CAGR 1% 12% 5% 4% 8% |
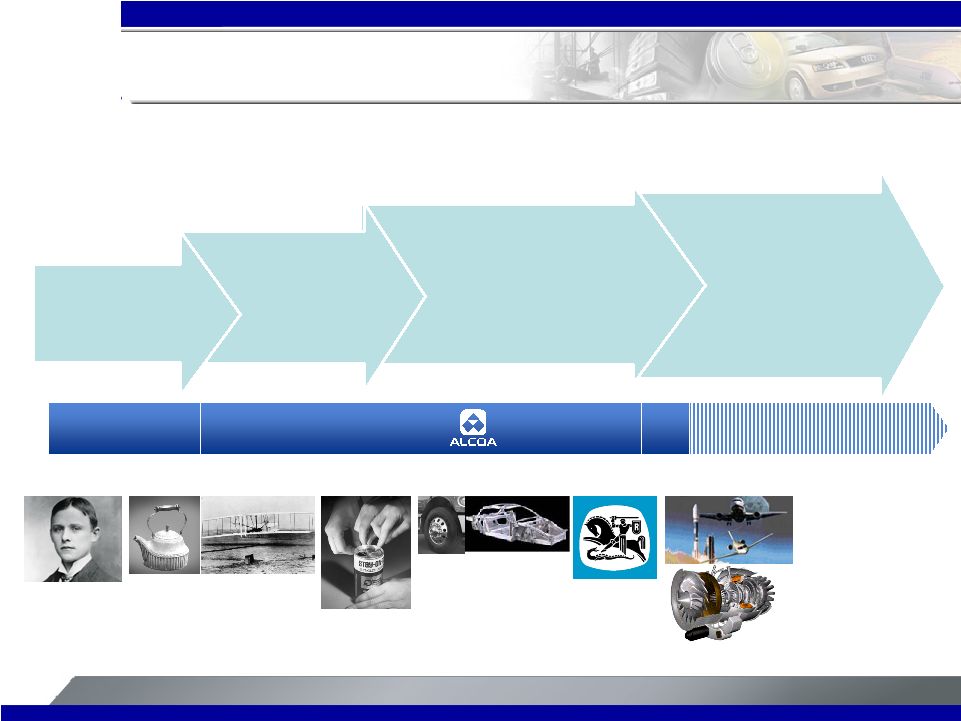
 20 [Alcoa logo] Alcoa: A History of Growth & Innovation 2008 1950 We reshaped the industry We innovated markets We invented the industry 1888 1900 |
 21 [Alcoa logo] We Have Strengthened the Foundation Executed Growth Projects Adjusted Portfolio Applied Disciplined Capital Management |
 22 [Alcoa logo] We Have Been Investing For Profitable Growth Expand Mining & Refining Start-up Fjaardaal Smelter Grow Power Self-Generation Power Contract Extensions Expand Rolling Footprint Two Fastening System Acquisitions |
 23 [Alcoa logo] Execution & completion 2008-2010 Feasibility 2010-2015 Future options Greenland Australia Surinam Vietnam Juruti Wagerup 3 Vietnam Sao Luis Jamaica Greenland Massena B. Comeau Mosjoen Sao Luis Fjardaal Pinjarra Mining Refining Power Smelting We Have a Robust Portfolio of Development Options N Iceland |
 24 [Alcoa logo] We Have Focused Our Portfolio Completed Packaging Sale Created Soft Alloy Extrusion JV Sold Auto Castings Business Chinalco Partnership |
 25 [Alcoa logo] Alcoa & Chinalco Have a History of Partnership Builds on a history of cooperation Global partners of choice Flexibility to deliver shareholder value Active dialogue on next steps |
 26 [Alcoa logo] We Demonstrate Disciplined Capital Management – Restructured debt portfolio – doubled average maturity at same cost – Increased dividend by 13% – Maintained target debt levels during peak capex period – Initiated & acting on 25% share repurchase Debt to Total Capital Percentage Target Debt/Cap Range 2006 2007 2008 $200 $350 $500 $650 $800 1Q 2Q 3Q 4Q 1Q 2Q 3Q 4Q 1Q 20% 25% 30% 35% 40% Growth Capex Debt/Cap |
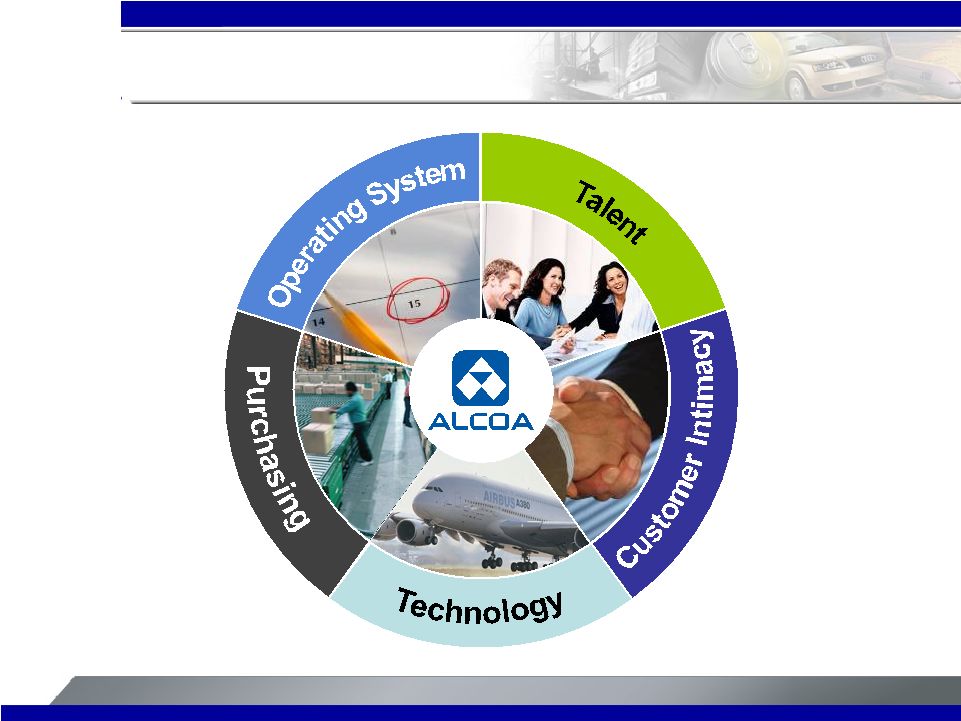
 27 [Alcoa logo] Driving Performance through Three Strategic Priorities Alcoa Advantage creating value for all businesses Profitable Growth in every business – Talent – Technology – Customer Intimacy – Purchasing – Operating System Business Programs that define: –3-year aspirations –Priority levers –Accountability Disciplined Execution across all activities Alcoa’s Three Strategic Priorities |
     28 [Alcoa logo] Strategic Priority #1: Profitable Growth Disciplined Execution across all activities – Talent – Technology – Customer Intimacy – Purchasing – Operating System Alcoa Advantage creating value for all businesses Alcoa’s Three Strategic Priorities Profitable Growth in every business Business Programs that define: –3-year aspirations –Priority levers –Accountability |
    29 [Alcoa logo] Great Opportunities for Primary Business – Attractive industry fundamentals – World class positions in bauxite and refining – Long-term energy supply – Balanced greenfield/brownfield growth opportunities – Sustainability Leader = Partner of Choice Operational Excellence Growth Asset Management Strategic Levers – Maximize repowered assets – Leading technology and project solutions – Drive industry- leading productivity – Ensure procurement excellence – Utilize varied equity & financing approaches – Progress continually on MOUs – Continue construction cost controls – Manage assets as global system Priorities Foundation |
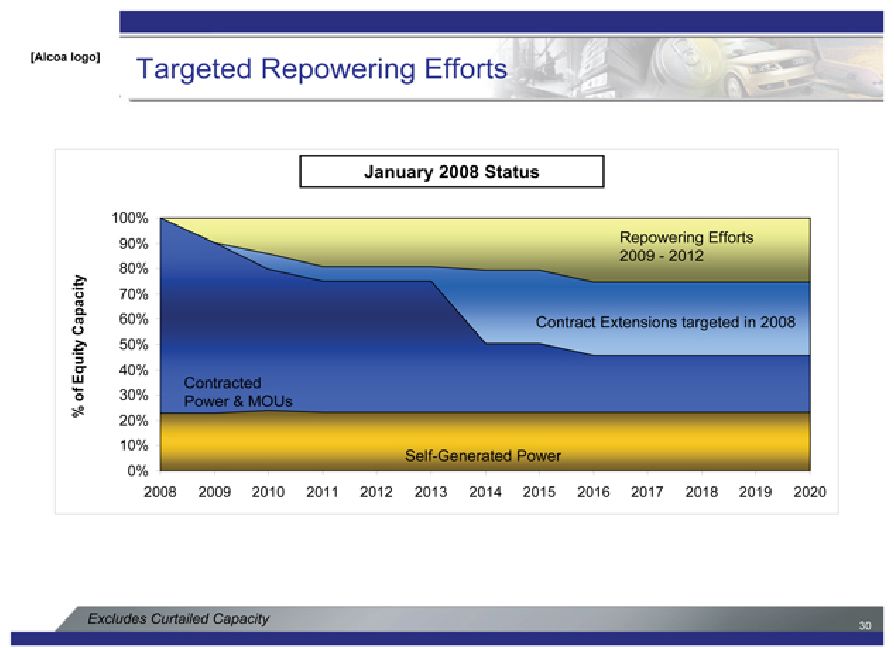 |
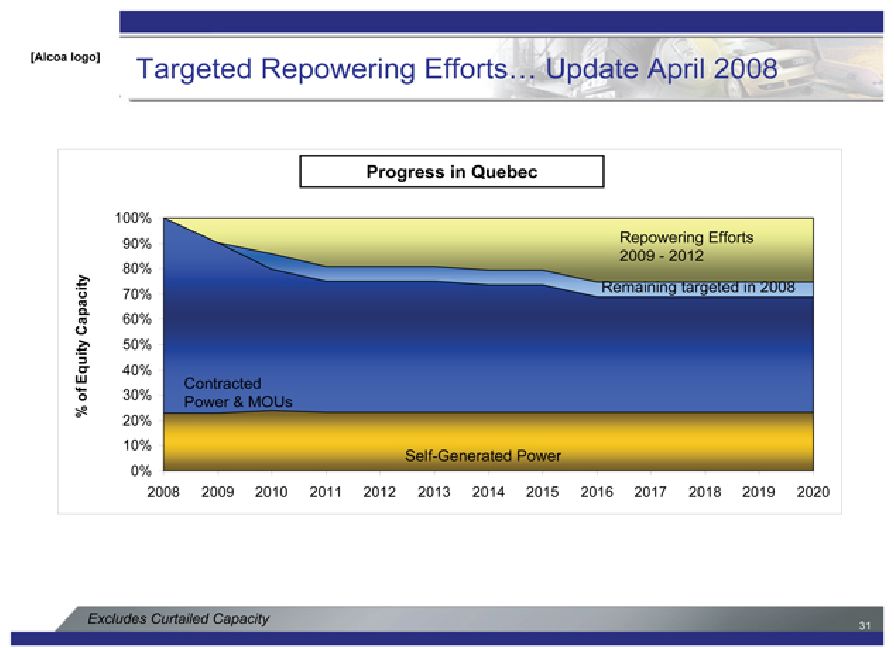 |
    32 [Alcoa logo] Flat Rolled Business is Excellently Positioned – Unique capabilities, equipment, and proprietary alloys – Demonstrated ability to achieve operational excellence – Global footprint to support expanding customers’ growth Operational Excellence Growth Asset Management Strategic Levers – Deliver on China & Russia – Leverage distinctive R&D capabilities – Extend best practices to global system – Continue to create and capture high-end segments: • Defense • Consumer Electronics • Oil & Gas – Optimize global presence Priorities Foundation |
    33 [Alcoa logo] Great Value Potential in Engineered Products & Solutions – Differentiated positions in attractive core markets • Aerospace & power generation components • Commercial transportation • Architectural solutions – Consistent growth in earnings & returns – New product focus Operational Excellence Growth Asset Management Strategic Levers – Pursue profitable growth targets – Restructure automotive businesses – Achieve Best in Class in each business – Capitalize on Megatrends • Transport. • Aero • B&C • Energy – Optimize global presence Priorities Foundation |
 34 [Alcoa logo] Alcoa Fastening Systems – Successful & Growing Profitable Growth Driven By: – Innovation leadership – Superior products – Customer intimacy – ABS deployment Republic/Van Petty Acquisitions: – Increased scale in aero-engine and airframe fasteners – Cost synergies through ABS deployment – Opportunity for increased product innovation 13 % CAGR 38 % CAGR Aerospace Revenue Aerospace Net Margin Indexed to 2003 = 100 0 100 200 2003 2004 2005 2006 2007 0 100 200 300 400 2003 2004 2005 2006 2007 |
     35 [Alcoa logo] Gain Traction Through More Disciplined Execution • Disciplined Execution across all activities Alcoa Advantage creating value for all businesses • Talent • Technology • Customer Intimacy • Purchasing • Operating System Alcoa’s Three Strategic Priorities Profitable Growth in every business Business Programs that define: • 3-year aspirations • Priority levers • Accountability |
        36 [Alcoa logo] Demonstrate More Alcoa Advantage Disciplined Execution across all activities Alcoa Advantage creating value for all businesses • Talent • Technology • Customer Intimacy • Purchasing • Operating System Alcoa’s Three Strategic Priorities Profitable Growth in every business Business Programs that define: • 3-year aspirations • Priority levers • Accountability |
   37 [Alcoa logo] Five Sources for More Alcoa Advantage |
 38 [Alcoa logo] Our Innovation & Technology Continue to Lead to Market Potential Recycling Alloy Development Surface Enhancements Process Improvements Design Expertise Customer Solutions |
   39 [Alcoa logo] Five Sources for More Alcoa Advantage |
 40 [Alcoa logo] Alcoa: Great Past, Present, and Future 2008 We reshaped the industry We innovated markets We invented the industry 1888 1900 Alcoa can’t wait Alcoa can’t wait for tomorrow for tomorrow |
 41 [Alcoa logo] Greg Aschman Director, Investor Relations Alcoa 390 Park Avenue New York, N.Y. 10022-4608 Telephone: (212) 836-2674 Facsimile: (212) 836-2813 www.alcoa.com For Additional Information, Contact: |
 42 [Alcoa logo] [Alcoa logo] |
 43 [Alcoa logo] APPENDIX [Alcoa logo] |
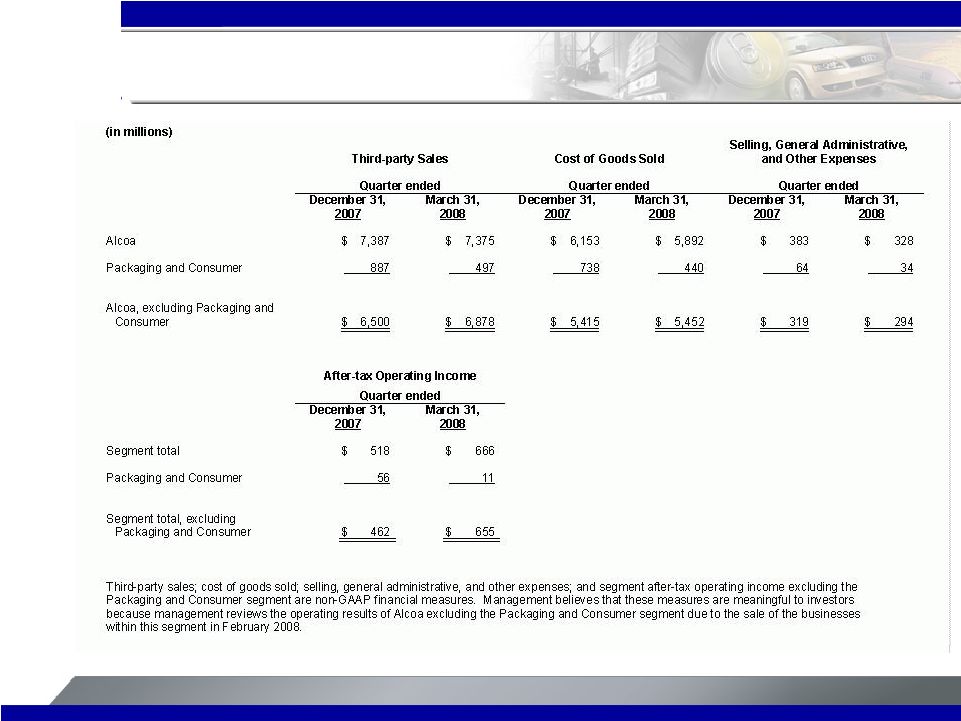
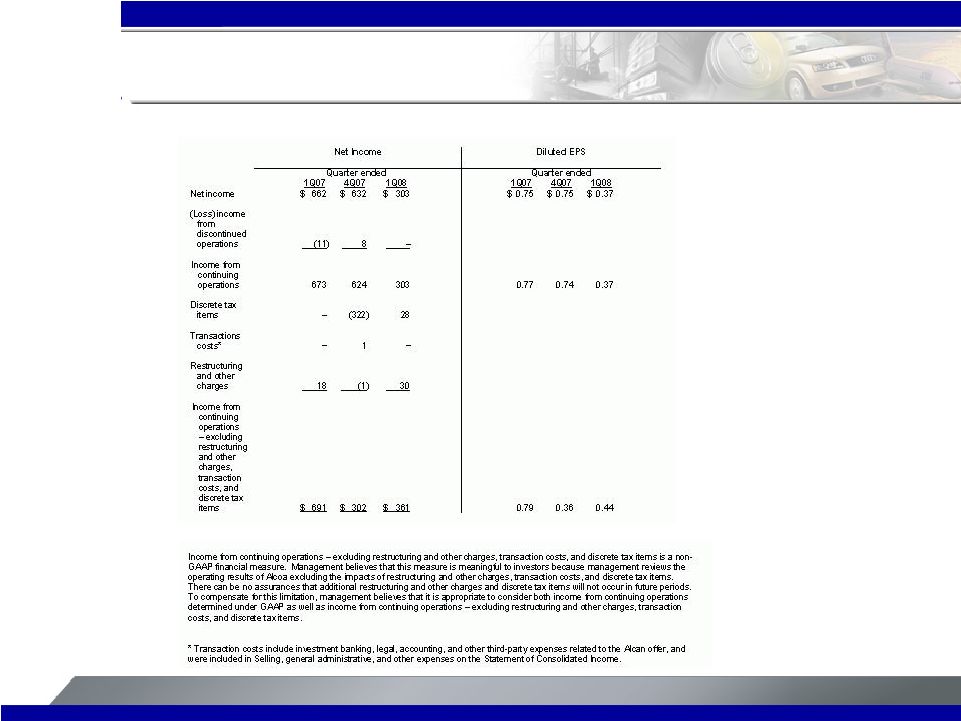 44 [Alcoa logo] Reconciliation of Adjusted Income (in millions, except per share amounts) |
 45 [Alcoa logo] Reconciliation of ATOI to Consolidated Net Income $ 303 $ 2,564 $ 632 $ 555 $ 715 $ 662 Consolidated net income (98) 741 303 446 (22) 14 Other – (7) 8 (3) (1) (11) Discontinued operations (30) (307) 1 (311) 21 (18) Restructuring and other charges (82) (388) (100) (101) (101) (86) Corporate expense (67) (365) (64) (76) (110) (115) Minority interests (64) (261) (53) (98) (56) (54) Interest expense 9 40 10 10 9 11 Interest income (31) (24) 9 10 (16) (27) Impact of LIFO Unallocated amounts (net of tax): $ 666 $ 3,135 $ 518 $ 678 $ 991 $ 948 Total segment ATOI 1Q08 2007 4Q07 3Q07 2Q07 1Q07 (in millions) In the first quarter of 2008, management approved a realignment of Alcoa's reportable segments to better reflect the core businesses in which Alcoa operates and how it is managed. This realignment consisted of eliminating the Extruded and End Products segment, and realigning its component businesses as follows: the building and construction systems business will be reported in the Engineered Products and Solutions segment; the hard alloy extrusions business and the Russian extrusions business will be reported in the Flat-Rolled Products segment; and the remaining segment components, consisting primarily of the equity investment/income of Alcoa's interest in the Sapa AB joint venture, and the Latin American extrusions business, will be reported in Corporate. Additionally, the Russian forgings business will be moved from the Engineered Products and Solutions segment to the Flat-Rolled Products segment, where total Russian operations will now be reported. Prior period amounts have been reclassified to reflect the new segment structure. Also, the Engineered Solutions segment was renamed the Engineered Products and Solutions segment. |
 46 [Alcoa logo] Return on Capital (ROC) is presented based on Bloomberg Methodology which calculates ROC based on trailing four quarters. Reconciliation of Return on Capital 1Q'08 4Q'07 3Q'07 2Q'07 1Q'07 4Q'06 3Q'06 2Q'06 1Q'06 Bloomberg Bloomberg Bloomberg Bloomberg Bloomberg Bloomberg Bloomberg Bloomberg Bloomberg (In Millions) Method Method Method Method Method Method Method Method Method Net income $2,205 $2,564 $2,291 $2,273 $2,302 $2,248 $2,113 $1,865 1,581 Minority interests $317 $365 $399 $432 $446 $436 $418 $368 304 Interest expense (after-tax) $266 $262 $246 $270 $281 $291 $272 $268 $274 Numerator (sum total) $2,788 $3,191 $2,936 $2,975 $3,029 $2,975 $2,803 $2,501 $2,159 Average Balances Short-term borrowings $524 $516 $497 $451 $441 $386 $349 $303 $342 Short-term debt $358 $356 $525 $359 $360 $284 $449 $55 $53 Commercial paper $864 $1,164 $1,275 $1,169 $972 $1,192 $1,678 $1,501 $1,652 Long-term debt $6,374 $5,574 $5,390 $5,709 $5,767 $5,027 $4,915 $5,333 $5,243 Preferred stock $55 $55 $55 $55 $55 $55 $55 $55 $55 Minority interests $2,320 $2,130 $1,927 $1,809 $1,669 $1,583 $1,416 $1,340 $1,280 Common equity $15,563 $15,269 $15,255 $15,571 $14,621 $13,947 $14,120 $13,834 $13,611 Denominator (sum total) $26,058 $25,064 $24,924 $25,123 $23,885 $22,474 $22,982 $22,421 $22,236 Return on Capital 10.7% 12.7% 11.8% 11.8% 12.7% 13.2% 12.2% 11.2% 9.7% |
 47 [Alcoa logo] Return on capital, excluding growth investments is a non-GAAP financial measure. Management believes that this measure is meaningful to investors because it provides greater insight with respect to the underlying operating performance of the company’s productive assets. The company has significant growth investments underway in its upstream and downstream businesses, as previously noted, with expected completion dates over the next several years. As these investments generally require a period of time before they are productive, management believes that a return on capital measure excluding these growth investments is more representative of current operating performance. Reconciliation of Adjusted Return on Capital 1Q'08 4Q'07 3Q'07 2Q'07 1Q'07 4Q'06 3Q'06 2Q'06 1Q'06 Bloomberg Bloomberg Bloomberg Bloomberg Bloomberg Bloomberg Bloomberg Bloomberg Bloomberg (In Millions) Method Method Method Method Method Method Method Method Method Numerator (sum total) $2,788 $3,191 $2,936 $2,975 $3,029 $2,975 $2,803 $2,501 $2,159 Russia, Bohai, and Kunshan net losses ($96) ($91) ($57) ($51) ($79) ($74) ($85) ($78) ($86) Adjusted numerator $2,884 $3,282 $2,993 $3,026 $3,108 $3,049 $2,888 $2,579 $2,245 Average Balances Denominator (sum total) $26,058 $25,064 $24,924 $25,123 $23,885 $22,474 $22,982 $22,421 $22,236 Capital projects in progress and Russia, Bohai, and Kunshan capital base $4,730 $4,620 $4,430 $4,521 $3,945 $3,655 $2,540 $2,330 $2,139 Adjusted denominator $21,328 $20,444 $20,494 $20,602 $19,940 $18,819 $20,442 $20,091 $20,097 Return on capital, excluding growth investments 13.5% 16.1% 14.6% 14.7% 15.6% 16.2% 14.1% 12.8% 11.2% |
 48 [Alcoa logo] Days of Working Capital $ 6,878 $ 6,482 $ 6,472 Adjusted Sales (b) 50.7 44.6 55.5 Days of Working Capital 497 905 1,436 Packaging and Consumer, Soft Alloy Extrusions, and Auto Castings $ 7,375 $ 7,387 $ 7,908 Sales $ 3,832 $ 3,141 $ 3,992 Working Capital 2,895 2,787 2,287 Less: Accounts payable, trade 3,679 3,326 3,309 Add: Inventories $ 3,048 $ 2,602 $ 2,970 Receivables from customers, less allowances March 31, 2008 December 31, 2007 March 31, 2007 (a) (in millions) Quarter ended Days of Working Capital = Working Capital divided by (Adjusted Sales/number of days in the quarter) (a) Certain financial information for the quarter ended March 31, 2007 has been reclassified to reflect the movement of the automotive castings and packaging and consumer businesses to held for sale in the third quarter of 2007. (b) Adjusted Sales is a non-GAAP financial measure and is being used to calculate Days of Working Capital to be consistent with the fact that the working capital components of the above mentioned divested businesses were classified as held for sale, and, therefore, are not included in the Working Capital amounts above. |
 49 [Alcoa logo] Segment Realignment Detail In the first quarter of 2008, management approved a realignment of Alcoa's reportable segments to better reflect the core businesses in which Alcoa operates and how it is managed. This realignment consisted of eliminating the Extruded and End Products segment, and realigning its component businesses as follows: the building and construction systems business will be reported in the Engineered Products and Solutions segment; the hard alloy extrusions business and the Russian extrusions business will be reported in the Flat-Rolled Products segment; and the remaining segment components, consisting primarily of the equity investment/income of Alcoa's interest in the Sapa AB joint venture, and the Latin American extrusions business, will be reported in Corporate. Additionally, the Russian forgings business will be moved from the Engineered Products and Solutions segment to the Flat-Rolled Products segment, where total Russian operations will now be reported. Prior period amounts have been reclassified to reflect the new segment structure. Also, the Engineered Solutions segment was renamed the Engineered Products and Solutions segment. FLAT-ROLLED PRODUCTS SEGMENT 1Q06 2Q06 3Q06 4Q06 2006 1Q07 2Q07 3Q07 4Q07 2007 Third-Party Shipments, as previously reported (kmt) 562 579 568 564 2,273 568 583 602 574 2,327 Add: Hard alloy extrusions, Russia forgings and extrusions 28 29 30 29 114 29 29 30 26 114 Third-Party Shipments, as reclassified 590 608 598 593 2,387 597 612 632 600 2,441 Third-Party Sales, as previously reported (in millions) 1,940 $ 2,115 $ 2,115 $ 2,127 $ 8,297 $ 2,275 $ 2,344 $ 2,309 $ 2,243 $ 9,171 $ Add: Hard alloy extrusions, Russia forgings and extrusions 160 166 178 194 698 192 191 185 193 761 Third-Party Sales, as reclassified 2,100 $ 2,281 $ 2,293 $ 2,321 $ 8,995 $ 2,467 $ 2,535 $ 2,494 $ 2,436 $ 9,932 $ ATOI, as previously reported (in millions) 66 $ 79 $ 48 $ 62 $ 255 $ 62 $ 93 $ 61 $ (16) $ 200 $ Add: Hard alloy extrusions, Russia forgings and extrusions (4) (5) (1) (0) (11) (2) 4 1 1 4 ATOI, as reclassified 62 $ 74 $ 47 $ 62 $ 244 $ 60 $ 97 $ 62 $ (15) $ 204 $ ENGINEERED PRODUCTS AND SOLUTIONS SEGMENT 1Q06 2Q06 3Q06 4Q06 2006 1Q07 2Q07 3Q07 4Q07 2007 Third-Party Shipments, as previously reported (kmt) 37 38 34 30 139 31 30 27 24 112 Add: Building and construction systems Less: Russia Forgings and other 20 22 22 23 88 24 22 24 25 94 Third-Party Shipments, as reclassified 57 60 56 53 227 55 52 51 49 207 Third-Party Sales, as previously reported (in millions) 1,360 $ 1,405 $ 1,345 $ 1,346 $ 5,456 $ 1,449 $ 1,478 $ 1,407 $ 1,391 $ 5,725 $ Add: Building and construction systems Less: Russia Forgings and other 184 210 234 222 850 227 237 255 275 994 Third-Party Sales, as reclassified 1,544 $ 1,615 $ 1,579 $ 1,568 $ 6,306 $ 1,676 $ 1,715 $ 1,662 $ 1,666 $ 6,719 $ ATOI, as previously reported (in millions) 83 $ 100 $ 75 $ 73 $ 331 $ 93 $ 105 $ 60 $ 58 $ 316 $ Add: Building and construction systems Less: Russia Forgings and other 11 13 12 15 51 12 14 22 18 66 ATOI, as reclassified 94 $ 113 $ 87 $ 88 $ 382 $ 105 $ 119 $ 82 $ 76 $ 382 $ |
 50 [Alcoa logo] Reconciliation of Segment Information (aluminum shipments in thousands of metric tons; dollars in millions) Reconciliation of third-party aluminum shipments: 1Q07 2Q07 3Q07 4Q07 2007 1Q08 Total segment third-party aluminum shipments 1,205 1,269 1,304 1,318 5,096 1,342 Corporate: Automotive Castings 6 6 5 4 21 – Soft Alloy Extrusions (contributed to Sapa AB) 136 70 – – 206 – Other U.S. Soft Alloy Extrusions 6 5 5 – 16 – Latin America Extrusions 12 14 14 14 54 15 Total Corporate 160 95 24 18 297 15 Consolidated third-party aluminum shipments 1,365 1,364 1,328 1,336 5,393 1,357 Reconciliation of third-party sales: 1Q07 2Q07 3Q07 4Q07 2007 1Q08 Total segment third-party sales $ 7,157 $ 7,545 $ 7,248 $ 7,274 $29,224 $ 7,318 Corporate: Automotive Castings 41 41 34 16 132 – Soft Alloy Extrusions (contributed to Sapa AB) 634 407 – – 1,041 – Other U.S. Soft Alloy Extrusions 25 24 23 2 74 – Latin America Extrusions 54 64 64 59 241 71 Other (3) (15) 18 36 36 (14) Total Corporate 751 521 139 113 1,524 57 Consolidated third-party sales $ 7,908 $ 8,066 $ 7,387 $ 7,387 $30,748 $ 7,375 |
 51 [Alcoa logo] Adjusted Income Statement Items |