![]() [Alcoa logo] July 8, 2008 2 nd Quarter 2008 Analyst Conference Exhibit 99.2 |
![]() [Alcoa logo] 2 Forward Looking Statements Today’s discussion may include “forward-looking statements” within the meaning of the Private Securities Litigation Reform Act of 1995. Such statements relate to future events and expectations and involve known and unknown risks and uncertainties. Alcoa’s actual results or actions may differ materially from those projected in the forward-looking statements. For a summary of the specific risk factors that could cause results to differ materially from those expressed in the forward-looking statements, please refer to Alcoa’s Form 10-K for the year ended December 31, 2007 and Form 10-Q for the quarter ended March 31, 2008 filed with the Securities and Exchange Commission. |
![]() [Alcoa logo] Executive Vice President and Chief Financial Officer Chuck McLane |
![]() [Alcoa logo] 4 Profitability improvement across all segments – Income from continuing operations of $546m or $0.66 per share – Revenues of $7.6 billion • 11% sequential increase, excluding Packaging • Higher revenue in all operating segments – Double digit profit increase across all operating segments sequentially – Input costs continue to climb – Cash from operations exceeds $1 billion – Debt-to-capital at 30.6% – ROC stands at 12.1%, excluding growth – Share repurchases reach 10% |
![]() [Alcoa logo] 5 Strong revenue growth leads to 80% increase in profits In Millions 1Q 08 2Q 08 Change Sales $7,375 $7,620 3% Cost of Goods Sold $5,892 $6,090 3% % of Sales 79.9% 79.9% -- SG&A $328 $306 (7%) % of Sales 4.4% 4.0% (0.4 pts) Restructuring and Other Charges $38 $2 (95%) Interest Expense $99 $87 (12%) Other Expense/(Income) $58 $(97) nm Effective Tax Rate 35.6% 27.3% (8.3 pts) Minority Interests $67 $70 4% Net Income $303 $546 80% Earnings per Diluted Share $0.37 $0.66 78% |
![]() [Alcoa logo] 6 Volume & LME pricing offset input cost pressures Income from Continuing Operations Excluding Restructuring millions 313 361 14 539 12 15 17 22 238 28 17 51 56 $0 $100 $200 $300 $400 $500 $600 |
![]() [Alcoa logo] $44 $82 1H 07 1H 08 $7.36 $10.03 1H 07 1H 08 5,310 8,557 1H 07 1H 08 7 The industry is facing significant input cost escalation Caustic Soda (per dmt) 67% Calcined Coke (per mt) 35% Ocean Freight (Baltic Dry Index) 61% Natural Gas (US Henry Hub per MMBtu) 36% Fuel Oil (Low Sulfur Oil Index per bbl) 86% Source: CMAI Source: PACE Source: Bloomberg Source: Bloomberg Source: Bloomberg US Dollar* (15%) Source: Bloomberg * Relative USD value vs weighted average of Alcoa exposure to AUD, CAD, BRL, & EUR $253 $342 1H 07 1H 08 85 100 1H 07 1H 08 $328 $547 1H 07 1H 08 |
![]() [Alcoa logo] 8 2Q 07 1Q 08 2Q 08 Production (kmt) 3,799 3,870 3,820 3 rd Party Shipments (kmt) 1,990 1,995 1,913 3 rd Party Revenue ($ million) 712 680 717 ATOI ($ million) 276 169 190 Higher LME pricing Net income impact of Western Australia gas disruption was approximately $17m Australian dollar up 4% vs USD Higher caustic & energy costs Alumina 2 nd Quarter Highlights 3 rd Quarter Outlook Prices to follow approximate two-month lag Higher caustic & energy costs anticipated Net income impact of Western Australia gas disruption expected to be $45m 2 nd Quarter Business Conditions $100 $120 $140 $160 $180 $200 $220 $240 $260 $280 $300 1Q 07 2Q 07 3Q 07 4Q 07 1Q 08 2Q 08 $800 $1,000 $1,200 $1,400 $1,600 $1,800 $2,000 ATOI Total Revenue |
![]() [Alcoa logo] 9 2 nd Quarter Highlights 2Q 07 1Q 08 2Q 08 Production (kmt) 901 995 1,030 3 rd Party Shipments (kmt) 565 665 750 3 rd Party Revenue ($ million) 1,746 1,877 2,437 3 rd Party Price ($/mt) 2,879 2,801 3,058 ATOI ($ million) 462 307 428 Primary Metals 3 rd Quarter Outlook 2 nd Quarter Business Conditions Higher realized pricing sequentially Record quarterly production Iceland running at capacity Higher input costs Net income impact of Rockdale power interruptions was $22m Additional efficiency gains anticipated in Iceland Higher input costs Net income impact of Rockdale outage expected to be $22m $0 $50 $100 $150 $200 $250 $300 $350 $400 $450 $500 $550 1Q 07 2Q 07 3Q 07 4Q 07 1Q 08 2Q 08 $2,000 $2,500 $3,000 $3,500 $4,000 $4,500 $5,000 ATOI Total Revenue |
![]() [Alcoa logo] 10 Flat-Rolled Products 3 rd Quarter Outlook 2 nd Quarter Business Conditions 2Q 07 1Q 08 2Q 08 Global Rolled Products, exc Russia & China 106 73 74 Hard Alloy Extrusions 8 8 7 Russia, China & Other (17) (40) (26) Total 97 41 55 ATOI ($ million) Higher costs expected for metals, energy & coatings Typical seasonal slowdown to impact results Weak end markets in North America & Europe Higher costs for magnesium & transportation Productivity gains in North America & Europe Improved Russia results ($20) $0 $20 $40 $60 $80 $100 $120 1Q 07 2Q 07 3Q 07 4Q 07 1Q 08 2Q 08 $1,600 $1,800 $2,000 $2,200 $2,400 $2,600 $2,800 $3,000 ATOI Third Party Revenue |
![]() [Alcoa logo] 11 Engineered Products and Solutions 2Q 07 1Q 08 2Q 08 AFL, Auto Castings & Structures (7) (5) (9) Investment Castings, Forgings & Fasteners 118 136 155 Building and Construction & Other 8 7 11 Total 119 138 157 Record quarterly revenue & ATOI Productivity improvements continue Volume improvements in aerospace, IGT, commercial transportation, & building & construction Weaker demand in automotive ATOI ($ million) 2 nd Quarter Business Conditions 3 rd Quarter Outlook Inventory adjustments affecting aerospace spares demand Declining demand in European heavy truck / trailer markets Additional automotive headwinds Typical seasonal slowdown to impact results $0 $20 $40 $60 $80 $100 $120 $140 $160 $180 1Q 07 2Q 07 3Q 07 4Q 07 1Q 08 2Q 08 $800 $1,000 $1,200 $1,400 $1,600 $1,800 $2,000 $2,200 ATOI Third Party Revenue |
![]() [Alcoa logo] 12 Strong cash generation driven by working capital improvements In Millions 2Q 07 1Q 08 2Q 08 Net Income $715 $303 $546 DD&A 317 319 321 Change in Working Capital 278 (467) 234 Other Adjustments 80 (424) (46) Pension Contributions (41) (19) (48) Cash From Operating Activities $1,349 $(288) $1,007 Dividends to Shareholders $(149) $(140) $(140) Change in Debt 172 416 199 Dividends to Minority Interests (46) (39) (78) Contributions from Minority Interests 103 118 181 Share Repurchases (165) (430) (175) Share Issuances 346 22 154 Other Financing Activities 11 (2) 11 Cash From Financing Activities $272 $(55) $152 Capital Expenditures $(891) $(748) $(796) Sales of Assets/Investments 36 2,492 149 Additions to Investments (30) (1,215) (22) Other Investing Activities (1) (304) (86) Cash From Investing Activities $(886) $225 $(755) |
![]() [Alcoa logo] 13 Share repurchase program reaches 10% Based on 870m Shares Outstanding As of January 19, 2007 25% Repurchase Program Authorized 10% Repurchased as of 2Q 08 – 10% repurchase program authorized January 2007 – ~68m shares, or 8%, repurchased in 2007 – Expanded 25% repurchase program authorized October 2007 Timeline Overview – ~18m shares, or 2%, repurchased YTD 2008 653m 86m 131m |
![]() [Alcoa logo] President and Chief Executive Officer Klaus Kleinfeld |
![]() [Alcoa logo] 15 Global growth expected despite US weakness Growth by Industry & Geography 2008 vs. 2007 Project +7.9% Global Aluminum Growth |
![]() [Alcoa logo] 16 Aluminum combines unique characteristics… High Strength Relative Price Recyclable Malleable Non-Corrosive Highly Conductive Durable Light Weight |
![]() [Alcoa logo] 17 …that create additional demand Transportation Packaging Defense Consumer Electronics Light Weight / Fuel Efficient Non-Corrosive / Durable Recyclable Light Weight / Logistics Cost Reduction Light Weight / Fuel Efficient Durable & Strong Aesthetics / Consumer Appeal Recyclable & Durable |
![]() [Alcoa logo] 18 8.2 10.6 4.6 7.3 5.6 Strong demand for aluminum will continue World Aluminum Consumption (million metric tons) Source: Brook Hunt, Alcoa analysis 22 1998 China Rest of Asia 2.8 6.7 3.6 North 9.2 8.6 29.1 67 2017 E. Europe/ Mid East/ Africa W.Europe South 6.7 5.2 12.0 38 2007 6% CAGR 6% CAGR Europe/ME/ Africa Americas Asia 12% 1% 6% 8% 4% 5% 2.5 0.8 1.3 2.6 |
![]() [Alcoa logo] 19 Competition for energy has intensified Energy/Infrastructure curtailments due to substantially increased local demand • China • South Africa • New Zealand Natural gas has changed from stranded to mobile energy source Smelter delays – all energy source related • 750 kmt Sarawak in Malaysia – power shortages in country • 750 kmt Ma’aden in Saudi Arabia – delay in power plant construction • 720 kmt Coega in South Africa – insufficient power supply • 700 kmt Ruwais in Abu Dhabi – unable to source adequate power • 150 kmt Datun Aluminum in China – insufficient power supply |
![]() [Alcoa logo] 20 Execution & completion 2008-2010 Feasibility 2010-2015 Future options Greenland Australia Surinam Juruti Wagerup 3 Vietnam Sao Luis Greenland Massena B. Comeau Mosjoen Fjardaal Pinjarra Mining Refining Power Smelting Well underway in securing growth N. Iceland Vietnam June 26 MOU Extended June 24 Cooperation Agreement Signed May 13 Parliament Agrees to Next Phase |
![]() [Alcoa logo] 21 An unmatched record in sustainability 2008 YTD LWD .08 TRR 1.07 |
![]() [Alcoa logo] 22 Cost pressures drive aluminum prices Smelting Cash Cost Curve Movement (per mt) 2005 2007 Increase 25 th percentile $ 1,281 $ 1,666 30% 50 th percentile $ 1,492 $ 1,851 24% 75 th percentile $ 1,808 $ 2,238 24% Refining Cash Cost Curve Movement (per mt) 2005 2007 Increase 25 th percentile $ 167 $ 210 26% 50 th percentile $ 196 $ 255 30% 75 th percentile $ 229 $ 308 34% Source: CRU, Alcoa analysis, Bloomberg Forward Curve of LME Aluminum Pricing (per mt) +42% $1,400 $1,600 $1,800 $2,000 $2,200 $2,400 $2,600 $2,800 $3,000 $3,200 $3,400 $3,600 3 mo 15 mo 27 mo 39 mo 51 mo 63 mo Jun 30 2008 Jun 30 2007 Jun 30 2006 Jun 30 2005 |
![]() [Alcoa logo] 23 Driving Performance Through Three Strategic Priorities Alcoa Advantage creating value for all businesses Profitable Growth in every business • Talent • Technology • Customer Intimacy • Purchasing • Operating System Business Programs that define: • 3-year aspirations • Priority levers • Accountability Disciplined Execution across all activities Alcoa’s Three Strategic Priorities |
![]() [Alcoa logo] Executive Vice-President Group President - Engineered Products & Solutions William Christopher |
![]() [Alcoa logo] 25 Diversified industrial products portfolio with leading market positions • #1 in Specialty Aerospace Fastener Systems • Broadest range of patented & proprietary products • Successful acquisition underway • #1 in Airfoils for aerospace • #1 in Airfoils for Industrial Gas Turbines • #1 producer of Aluminum Structural Forgings • #1 supplier of Aluminum Truck Wheels globally • Industry leader in new Aluminum Wheel products and finishes • Globally driving penetration vs steel wheels • #1 Commercial Building Exterior Systems supplier in North America (Kawneer) • Best in class customer service • Growing positions in Asia, Middle East and Russia • #1 supplier to the North America heavy truck & specialty vehicle industries $1.2 $0.9 $1.1 $1.5 Fastening Systems Power & Propulsion Wheel & Transportation Products Building & Construction Systems Electrical & Electronic Solutions $2.0 2007 Sales (in billions) Market Positions |
![]() [Alcoa logo] 26 A track record of profitable growth and productivity gains $850m of organic growth • $400m market growth • $450m share growth Portfolio management via divestiture, business exits & investments in rapidly growing segments Return on Capital Source: CMAI Sales (in billions) 8% p.a. ATOI (in millions) 28% p.a. 37% p.a. Cost of capital Productivity gains expand margin/sales ~ 36% via ABS, process improvements & low cost country expansions $5.7 $6.7 2005 2007 $232 $382 2005 2007 2005 2007 |
![]() [Alcoa logo] 27 Trend of record earnings and returns extends to 2008 Cost efficient capacity expansions in fasteners and investment castings Strong market positions in aerospace, IGT, B&C offsetting North American truck and automotive weakness Productivity improvements accelerating Return on Capital Sales (in billions) 6% ATOI (in millions) 30% 28% Cost of capital $3.4 $3.6 1H 07 1H 08 $224 $295 1H 07 1H 08 1H 07 1H 08 |
![]() [Alcoa logo] 28 Driving Performance Through Three Strategic Priorities Alcoa Advantage creating value for all businesses Profitable Growth in every business • Talent • Technology • Customer Intimacy • Purchasing • Operating System Business Programs that define: • 3-year aspirations • Priority levers • Accountability Disciplined Execution across all activities Alcoa’s Three Strategic Priorities |
![]() [Alcoa logo] 29 – Fasteners – Investment Castings – Forgings – Exterior Systems – Window Systems – Architectural Products Strong market demand provides significant growth opportunities – Fasteners – Wheels – Investment Castings – Electrical Systems – Forgings Global Large Aircraft Deliveries Global Heavy Truck Production (in thousands) Source: The Airline Monitor – July 2008 Source: Global Insight Global Non-Residential Structure Spend (in billions) Source: Global Insight 8% p.a. 8% p.a. 10% p.a. 575 888 1,065 2003 2007 2011(F) 975 1,575 1,820 2003 2007 2011(F) $1,244 $1,887 $2,693 2003 2007 2011(F) |
![]() [Alcoa logo] 30 – Investment Castings – Forgings Energy infrastructure provides opportunities for profitable growth – Fasteners – Forgings – Integrated Product Sub-components Global Rig Count Global Heavy Duty Turbine Builds Source: Howmet analysis Source: BHI, Spears 7% p.a. 15% p.a. 252 288 436 2003 2007 2011(F) 1,133 3,064 3,572 2003 2007 2011(F) |
![]() [Alcoa logo] 31 Defense • Joint Strike Fighter • Joint Light Tactical Vehicle Industrial Equipment • Mold Plate • LCD Vacuum Chambers Aerospace • A380 and 787 Fastening Systems • New Engine Programs Industrial Gas Turbines • High Gradient Single Crystal Ground Transportation • AVDC Door System • EES Electronics • Dura-Bright® Extensions • Huck Spin Fasteners • 5 th Wheel • Turbocharger Blades Oil and Gas • Riser Systems • Drill Pipe Systems Building and Construction • Ultra Thermal Doors and Windows • Integrated Exterior Systems • Advanced Surface Coatings New product portfolio will drive profitable growth Targeting $1.3b with new products and in adjacent markets |
![]() [Alcoa logo] 32 Oil & Gas – Aluminum Drilling Systems: 50% advantage over steel >10,000 ft Alcoa Advantage 50 ft 350 ft <6,000 ft 1,500 ft Steel limit 1,000 ft Steel limit Alcoa Advantage 5 miles (8 km) 2 miles (3.2 km) 1 mile (1.6 km) Aluminum riser systems and auxiliary equipment provides 20 - 50% extended depth for current ships at a fraction of new equipment costs & delivery time Aluminum drill pipe systems allow up to 40% increased lineal distances over steel systems Land Rig Barge Jackup Fixed Platform Semi Submersible Drill Ship: Deep Water (DW) Drill Ship: Ultra Deep Water (UDW) Landscape of Exploration Drilling Equipment |
![]() [Alcoa logo] 33 Joint Strike Fighter – Alcoa Advantage at work • Strong customer relationships provide early design involvement • Leveraging Alcoa 7085 alloy technology in forgings for weight reductions • “Multi – Wall” investment casting engine airfoils • High strength titanium Mark IV and Spline Lock Eddie Bolt fastening systems Sales of $1.4m/shipset $130m/year at full production |
![]() [Alcoa logo] 34 Disciplined execution will continue to drive productivity gains • Significant runway remains in ABS productivity and capacity improvements • Expand and grow investments in Hungary, China, Russia and Mexico • New process investments in BCS, fasteners and investment castings • Capital efficient brown-field expansion opportunities • Leveraging cost efficient Alcoa business systems for overhead productivity • Addressing structural changes in NA automotive demand in EES capacity ATOI (in millions) 28% p.a. $232 $382 2005 2007 |
![]() ![]() ![]() ![]() [Alcoa logo] 35 Unlocking the great value potential in Engineered Products & Solutions – Technically complex products & processes providing differentiation opportunities – Differentiated positions in attractive core markets • Aerospace & power generation components • Commercial transportation • Architectural solutions – Consistent growth in earnings & returns – New product focus Operational Excellence Growth Asset Management Strategic Levers – Disciplined deployment of profitable growth targets – Restructure automotive businesses – Achieve Best in Class in each business – Capitalize on Mega Trends • Transport • Aero • B&C • Energy – Optimize global presence – Efficient brown-field expansions Priorities Foundation |
![]() [Alcoa logo] 36 Driving Performance Through Three Strategic Priorities Alcoa Advantage creating value for all businesses Profitable Growth in every business • Talent • Technology • Customer Intimacy • Purchasing • Operating System Business Programs that define: • 3-year aspirations • Priority levers • Accountability Disciplined Execution across all activities Alcoa’s Three Strategic Priorities |
![]() [Alcoa logo] 37 Greg Aschman Director, Investor Relations Alcoa 390 Park Avenue New York, N.Y. 10022-4608 Telephone: (212) 836-2674 Facsimile: (212) 836-2813 www.alcoa.com For Additional Information, Contact: |
![]() [Alcoa logo] 38 [Alcoa logo] |
![]() [Alcoa logo] 39 APPENDIX [Alcoa logo] |
![]() [Alcoa logo] 40 Adjusted Income Statement Items (in millions) Third -party Sales Quarter ended March 31, 2008 June 30 , 2008 Alcoa $ 7,375 $ 7,620 Packaging and Consumer 497 19 Alcoa, excluding Packaging and Consumer $ 6,878 $ 7,601 After-tax Operating Income Quarter ended March 31, 2008 June 30 , 2008 Segment total $ 666 $ 830 Packaging and Consumer 11 – Segment total, excluding Packaging and Consumer $ 655 $ 830 Third-party sales and segment after-tax operating income excluding the Packaging and Consumer segment are non-GAAP financial measures. Management believes that these measures are meaningful to investors because management reviews the operating results of Alcoa excluding the Packaging and Consumer segment due to the sale of the businesses within this segment in February 2008. |
![]() [Alcoa logo] 41 Return on Capital (ROC) is presented based on Bloomberg Methodology which calculates ROC based on trailing four quarters. Reconciliation of Return on Capital 2Q'08 1Q'08 4Q'07 3Q'07 2Q'07 1Q'07 Bloomberg Bloomberg Bloomberg Bloomberg Bloomberg Bloomberg (In Millions) Method Method Method Method Method Method Net income $2,036 $2,205 $2,564 $2,291 $2,273 $2,302 Minority interests $277 $317 $365 $399 $432 $446 Interest expense (after-tax) $267 $266 $262 $246 $270 $281 Numerator (sum total) $2,580 $2,788 $3,191 $2,936 $2,975 $3,029 Average Balances Short-term borrowings $568 $524 $516 $497 $451 $441 Short-term debt $352 $358 $356 $525 $359 $360 Commercial paper $819 $864 $1,164 $1,275 $1,169 $972 Long-term debt $6,523 $6,374 $5,574 $5,390 $5,709 $5,767 Preferred stock $55 $55 $55 $55 $55 $55 Minority interests $2,519 $2,320 $2,130 $1,927 $1,809 $1,669 Common equity $16,695 $15,563 $15,269 $15,255 $15,571 $14,621 Denominator (sum total) $27,531 $26,058 $25,064 $24,924 $25,123 $23,885 Return on Capital 9.4% 10.7% 12.7% 11.8% 11.8% 12.7% |
![]() [Alcoa logo] 42 Return on capital, excluding growth investments is a non-GAAP financial measure. Management believes that this measure is meaningful to investors because it provides greater insight with respect to the underlying operating performance of the company’s productive assets. The company has significant growth investments underway in its upstream and downstream businesses, as previously noted, with expected completion dates over the next several years. As these investments generally require a period of time before they are productive, management believes that a return on capital measure excluding these growth investments is more representative of current operating performance. Reconciliation of Adjusted Return on Capital 2Q'08 1Q'08 4Q'07 3Q'07 2Q'07 1Q'07 Bloomberg Bloomberg Bloomberg Bloomberg Bloomberg Bloomberg (In Millions) Method Method Method Method Method Method Numerator (sum total) $2,580 $2,788 $3,191 $2,936 $2,975 $3,029 Russia, Bohai, and Kunshan net losses ($118) ($96) ($91) ($57) ($51) ($79) Adjusted numerator $2,698 $2,884 $3,282 $2,993 $3,026 $3,108 Average Balances Denominator (sum total) $27,531 $26,058 $25,064 $24,924 $25,123 $23,885 Capital projects in progress and Russia, Bohai, and Kunshan capital base $5,289 $4,730 $4,620 $4,430 $4,521 $3,945 Adjusted denominator $22,242 $21,328 $20,444 $20,494 $20,602 $19,940 Return on capital, excluding growth investments 12.1% 13.5% 16.1% 14.6% 14.7% 15.6% |
![]() [Alcoa logo] 43 Reconciliation of Adjusted Income (in mi llions ) Quarter ended 1Q08 2Q08 Net income $ 303 $ 546 Loss from discontinued operations – – Income from continuing operations 303 546 Discrete tax items 28 (9) Restructuring and other charges 30 2 Income from continuing operations – excluding restructuring and other charges and discrete tax items $ 361 $ 539 Income from continuing operations – excluding restructuring and other charges and discrete tax items is a non-GAAP financial measure. Management believes that this measure is meaningful to investors because management reviews the operating results of Alcoa excluding the impacts of restructuring and other charges and discrete tax items. There can be no assurances that additional restructuring and other charges and discrete tax items will not occur in future periods. To compensate for this limitation, management believes that it is appropriate to consider both income from continuing operations determined under GAAP as well as income from continuing operations – excluding restructuring and other charges and discrete tax items. |
![]() [Alcoa logo] 44 Quarter ended (in millions) June 30, 2007 (a) March 31, 2008 June 30, 2008 Receivables from customers, less allowances $ 2,991 $ 3,048 $ 3,063 Add: Inventories 3,216 3,679 3,813 Less: Accounts payable, trade 2,388 2,895 3,121 Working Capital $ 3,819 $ 3,832 $ 3,755 Sales $ 8,066 $ 7,375 $ 7,620 Packaging and Consumer, Soft Alloy Extrusions, and Auto Castings 1,309 497 19 Adjusted Sales (b) $ 6,757 $ 6,878 $ 7,601 Days of Working Capital 51.4 50.7 45.0 Days of Working Capital = Working Capital divided by (Adjusted Sales/number of days in the quarter) (a) Certain financial information for the quarter ended June 30, 2007 was reclassified to reflect the movement of the automotive castings and packaging and consumer businesses to held for sale in the third quarter of 2007. (b) Adjusted Sales is a non-GAAP financial measure and is being used to calculate Days of Working Capital to be consistent with the fact that the working capital components of the above-mentioned divested businesses were classified as held for sale, and, therefore, are not included in the Working Capital amounts above. Days of Working Capital |
![]() [Alcoa logo] 45 Reconciliation of ATOI to Consolidated Net Income (in millions) 1Q07 2Q07 3Q07 4Q07 2007 1Q08 2Q08 Total segment ATOI $ 948 $ 991 $ 678 $ 518 $ 3,135 $ 666 $ 830 Unallocated amounts (net of tax): Impact of LIFO (27) (16) 10 9 (24) (31) (44) Interest income 11 9 10 10 40 9 12 Interest expense (54) (56) (98) (53) (261) (64) (57) Minority interests (115) (110) (76) (64) (365) (67) (70) Corporate expense (86) (101) (101) (100) (388) (82) (91) Restructuring and other charges (18) 21 (311) 1 (307) (30) (2) Discontinued operations (11) (1) (3) 8 (7) – – Other 14 (22) 446 303 741 (98) (32) Consolidated net income $ 662 $ 715 $ 555 $ 632 $ 2,564 $ 303 $ 546 * In the first quarter of 2008, management approved a realignment of Alcoa's reportable segments to better reflect the core businesses in which Alcoa operates and how it is managed. This realignment consisted of eliminating the Extruded and End Products segment, and realigning its component businesses as follows: the building and construction systems business is reported in the Engineered Products and Solutions segment; the hard alloy extrusions business and the Russian extrusions business are reported in the Flat-Rolled Products segment; and the remaining segment components, consisting primarily of the equity investment/income of Alcoa's interest in the Sapa AB joint venture, and the Latin American extrusions business, are reported in Corporate. Additionally, the Russian forgings business was moved from the Engineered Products and Solutions segment to the Flat-Rolled Products segment, where total Russian operations are now reported. Prior period amounts were reclassified to reflect the new segment structure. Also, the Engineered Solutions segment was renamed the Engineered Products and Solutions segment. |
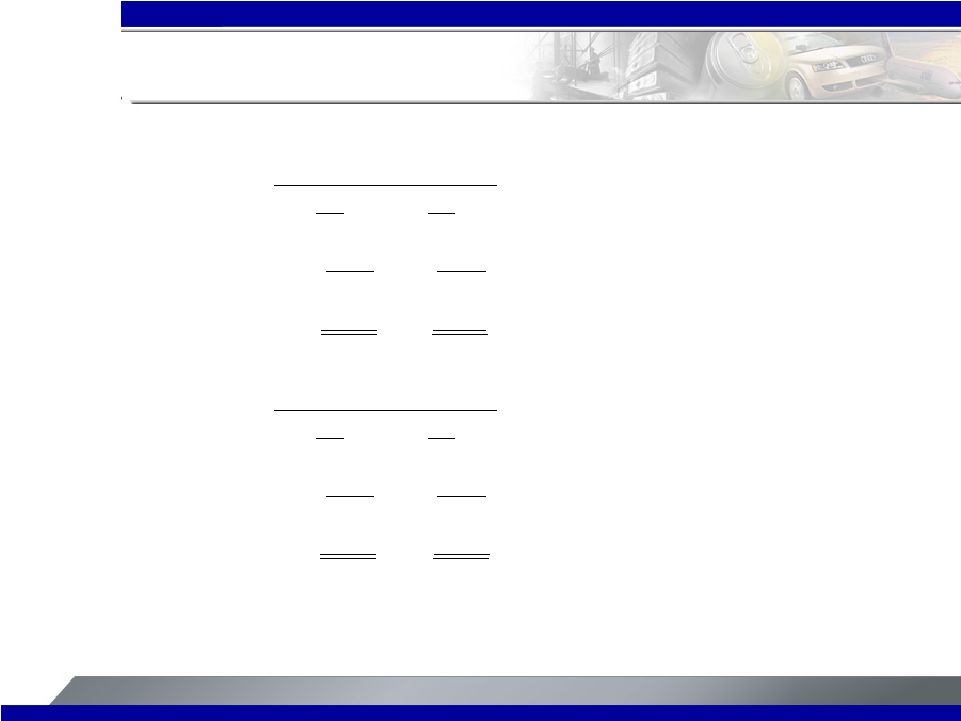
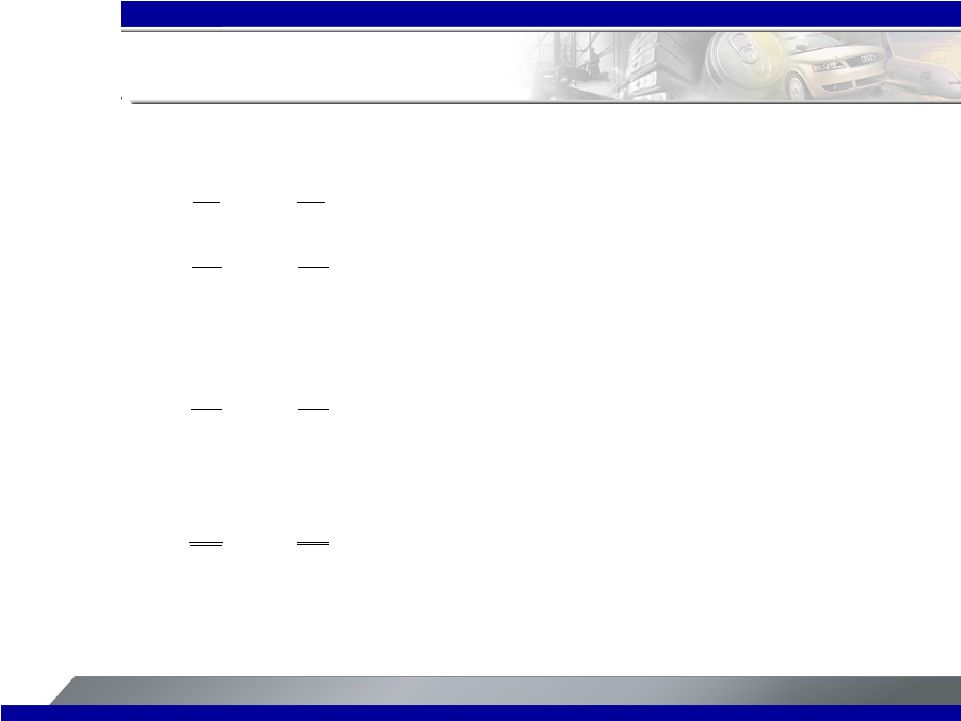
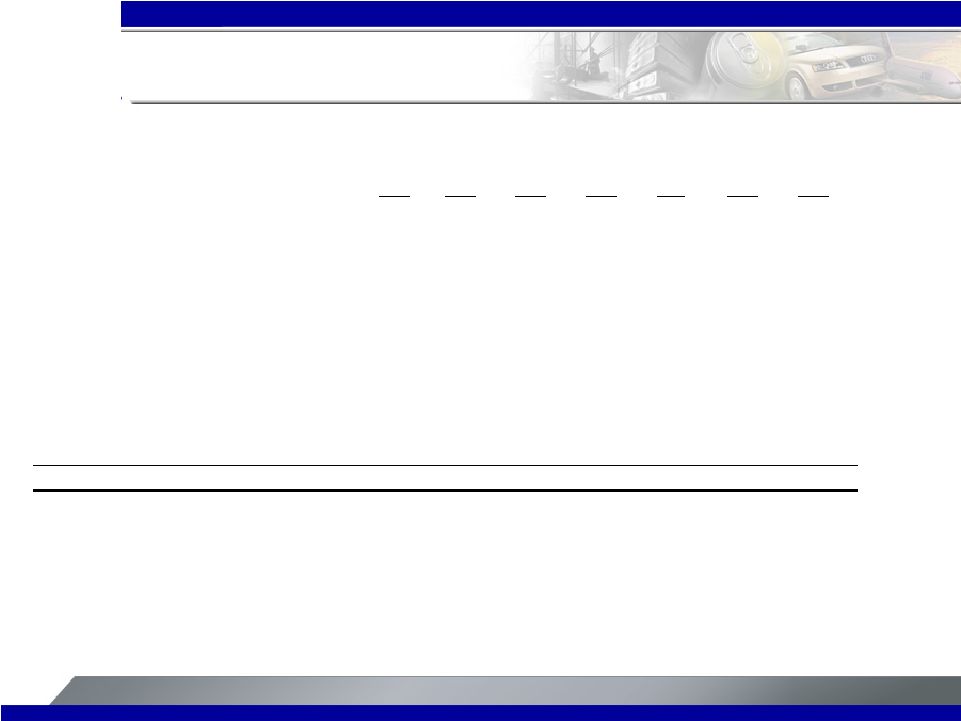
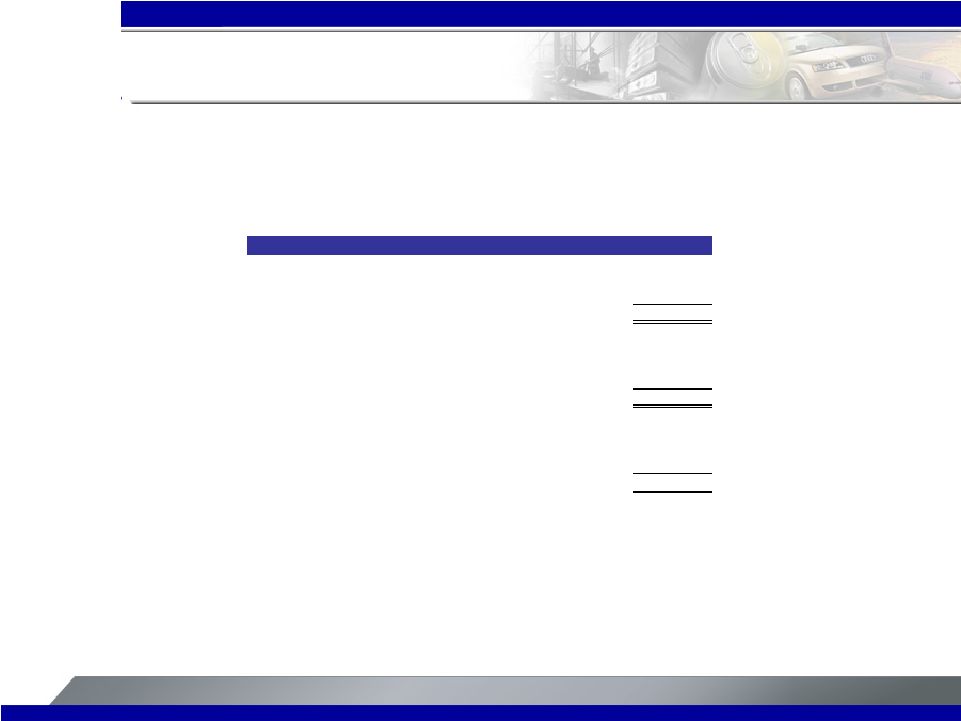
![]() [Alcoa logo] 46 Engineered Products & Solutions Segment Realignment Summary EPS SEGMENT RESTATED SEGMENT INFO - 2005 ($ in millions, shipments in thousands of metric tons) ENGINEERED PRODUCTS AND SOLUTIONS SEGMENT 2005 Third-Party Shipments, as previously reported 145 Add: Building and construction systems Less: Russia Forgings and other 77 Third-Party Shipments, as reclassified 222 Third-Party Sales, as previously reported 5,032 $ Add: Building and construction systems Less: Russia Forgings and other 685 Third-Party Sales, as reclassified 5,717 $ ATOI, as previously reported 203 $ Add: Building and construction systems Less: Russia Forgings and other 29 ATOI, as reclassified 232 $ In the first quarter of 2008, management approved a realignment of Alcoa's reportable segments to better reflect the core businesses in which Alcoa operates and how it is managed. This realignment consisted of eliminating the Extruded and End Products segment, and realigning its component businesses, which had the following effect on the Engineered Products and Solutions segment: the building and construction systems business is now reported in the Engineered Products and Solutions segment and the Russian forgings business was moved from the Engineered Products-and Solutions segment to the Flat-Rolled Products segment, where total Russian operations are now reported. Prior period amounts were reclassified to reflect the new segment structure. Also, the Engineered Solutions segment was renamed the Engineered Products and Solutions segment. |