 Alcoa Logo 1 st Quarter 2009 Analyst Conference April 7, 2009 Exhibit 99.2 |
 2 Alcoa Logo Alcoa Logo Forward-Looking Statements Today’s discussion may include “forward-looking statements” within the meaning of the Private Securities Litigation Reform Act of 1995. Such statements relate to future events and expectations and involve known and unknown risks and uncertainties. Alcoa’s actual results or actions may differ materially from those projected in the forward-looking statements. For a summary of the specific risk factors that could cause results to differ materially from those expressed in the forward-looking statements, please refer to Alcoa’s Form 10-K for the year ended December 31, 2008 and other reports filed with the Securities and Exchange Commission. |
 Alcoa Logo Chuck McLane Executive Vice President and Chief Financial Officer |
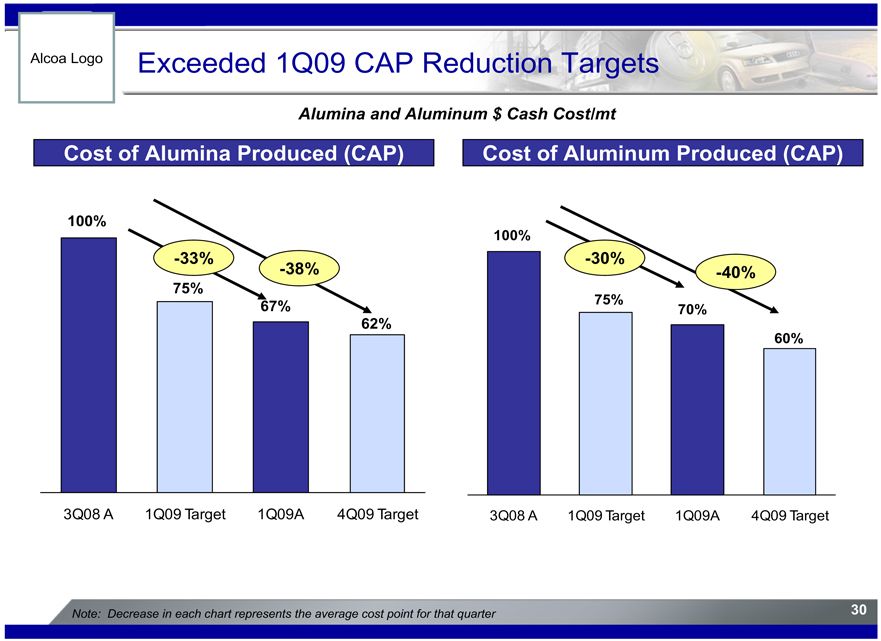
 4 Alcoa Logo 1st Quarter 2009 Financial Overview Loss from continuing operations $480 million or $0.59 per share Revenue of $4.1 billion Decrease of 27% sequentially Decrease of 41% year-over-year Average LME $1,359/mt Decrease of 25% sequentially Decrease of 50% year-over-year Cash on hand of $1.1 billion Debt-to-cap at 40.6%; down 190 basis points sequentially Cash costs per ton Alumina down 33% from 3Q08 Aluminum down 30% from 3Q08 |
 5 Alcoa Logo (in millions, except per share amounts) 4Q'08 1Q'09 Change Sales $5,688 $4,147 (27%) Cost of Goods Sold $5,277 $4,143 (21%) % of Sales 92.8% 99.9% 7.1 pts SG&A $273 $244 (11%) % of Sales 4.8% 5.9% 1.1 pts Restructuring and Other Charges $863 $69 (92%) Interest Expense $125 $114 (9%) Other (Income) Expenses $(36) $30 nm Effective Tax Rate 20.4% 39.5% 19.1 pts Benefit for Taxes on Loss $(238) $(307) 29% Loss from Continuing Operations $(929) $(470) $459 Less: Net Income Attributable to Noncontrolling Interests $0 $10 $10 Amounts Attributable to Alcoa Common Shareholders: Loss from Continuing Operations $(929) $(480) $449 Loss from Continuing Operations per Diluted Share $(1.16) $(0.59) $0.57 Loss from Discontinued Operations $(262) $(17) $245 Sequential Income Statement |
 6 Alcoa Logo Restructuring & Other Special Items (in millions, except per share amounts) After-Tax Amount Earnings Per Share Income Statement Classification Segment Loss from Continuing Operations $(480) $(0.59) Other Items: Restructuring and Other Charges $(46) $(0.06) Restructuring Corporate Gain on Elkem / SAPA Swap $133 $0.16 Other Income Primary / Corporate Loss on Shining Prospect (Rio Tinto) $(118) $(0.14) Other Income Corporate Discrete Tax Item $28 $0.03 Tax Corporate Total Other Items $(0.01) |
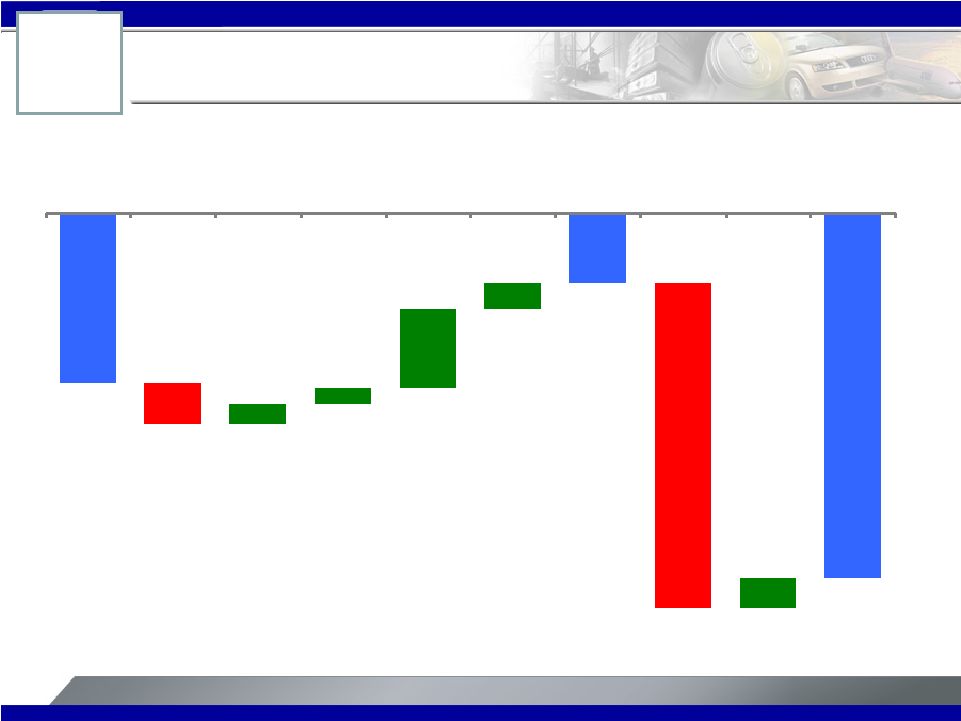 7 Alcoa Logo 1Q 2009 vs. 4Q 2008 Earnings Bridge Loss from Continuing Operations excluding Restructuring & Other Special Items (in millions) See Appendix for Reconciliation ($221) ($55) $27 $20 $103 $34 ($92) ($424) $39 ($477) 4Q08 Volume Price/Mix Currency Productivity SG&A / R&D LME Bohai & Other 1Q09 |
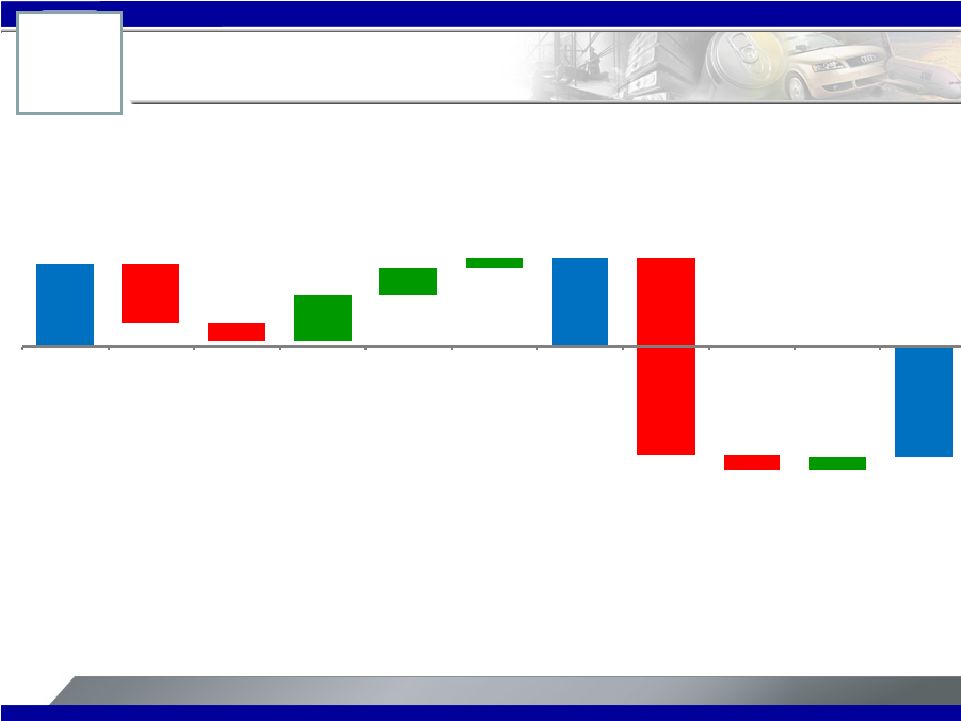 8 Alcoa Logo 1Q 2009 vs. 1Q 2008 Earnings Bridge Income (Loss) from Continuing Operations excluding Restructuring & Other Special Items (in millions) $356 $(258) $(74) $198 $115 $45 $382 $(849) $(67) $57 $(477) 1Q08 Volume Price/Mix Currency Productivity SG&A / R&D Curtailments Noncontrolling Interest See Appendix for Reconciliation LME 1Q09 |
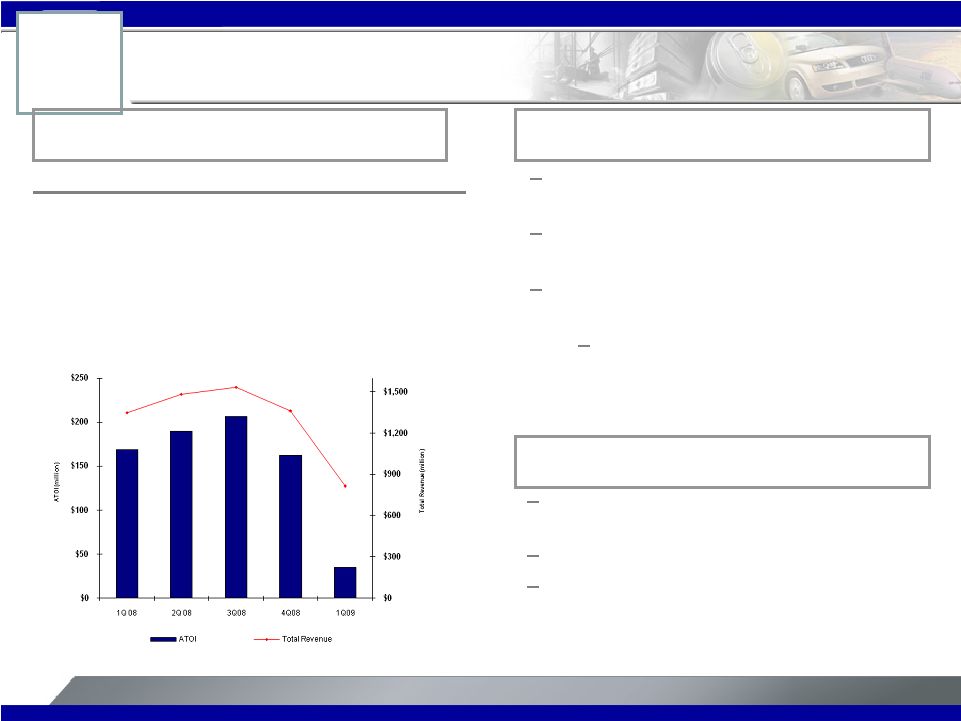 9 Alcoa Logo 1Q 08 4Q 08 1Q 09 Production (kmt) 3,870 3,776 3,445 3 rd Party Shipments (kmt) 1,995 2,123 1,737 3 rd Party Revenue ($ million) 680 722 430 ATOI ($ million) 169 162 35 34% lower realized pricing sequentially, matching LME decline on two-month lag Lower production of 9% sequentially mainly due to curtailments at Point Comfort Benefited from lower energy costs, productivity gains, and favorable currency impact Cost of alumina produced down approximately 33% from 3Q08 Alumina 1 st Quarter Highlights 2 nd Quarter Outlook 1 st Quarter Business Conditions Expect production to decline slightly as refinery production is matched to smelter demand Productivity programs continue to deliver results Impact of start-up costs at Brazilian growth projects |
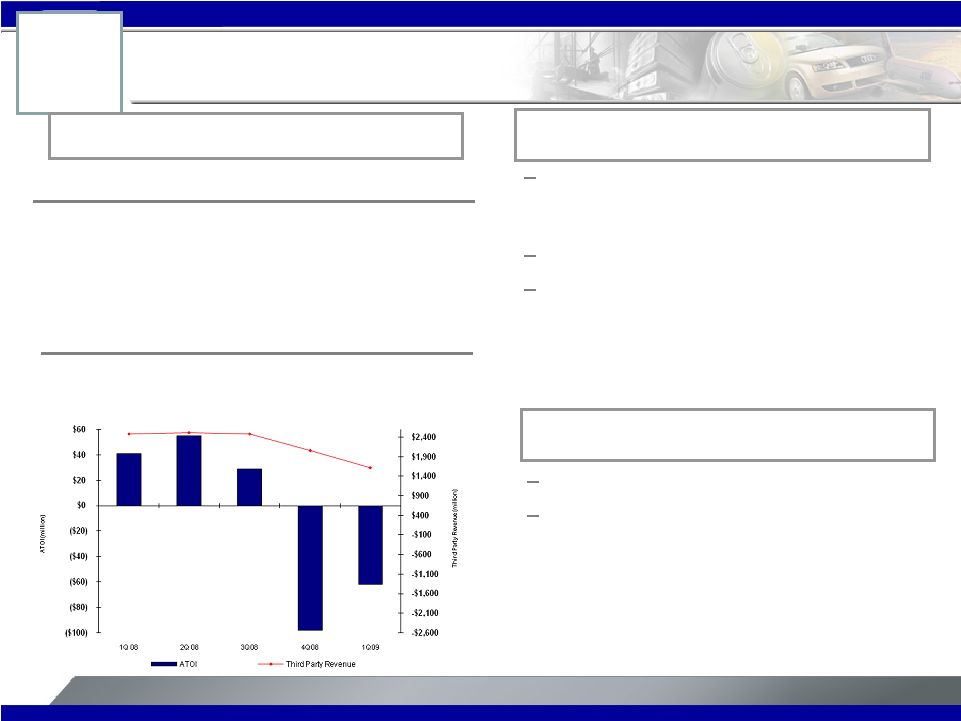
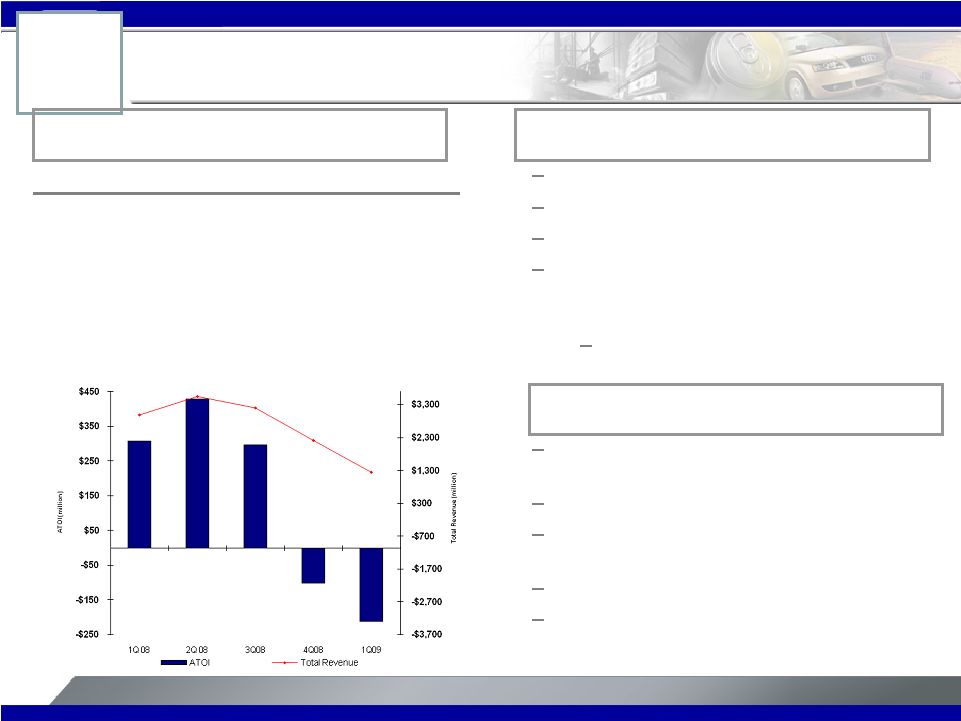 10 Alcoa Logo 1 st Quarter Highlights 1Q 08 4Q 08 1Q 09 Production (kmt) 995 971 880 3 rd Party Shipments (kmt) 665 807 683 3 rd Party Revenue ($ million) 1,877 1,580 844 3 rd Party Price ($/mt) 2,801 2,125 1,567 ATOI ($ million) 307 (101) (212) Primary Metals 2 nd Quarter Outlook 1 st Quarter Business Conditions Realized pricing down 26% sequentially 750kmt of production curtailments enacted Non-cash Elkem gain of $112 million Benefit from procurement initiatives, productivity improvements and LME linked input costs reaching bottom line Cost of aluminum produced down approximately 30% from 3Q08 Current cash LME $1,426/mt, $66/mt higher than 1 st quarter average Current USD slightly weaker than 1Q average Massena East full curtailment by end of quarter (100 kmt, net) Anglesea Power Plant maintenance outage Increasing benefit from procurement actions, productivity improvement and other cost controls |
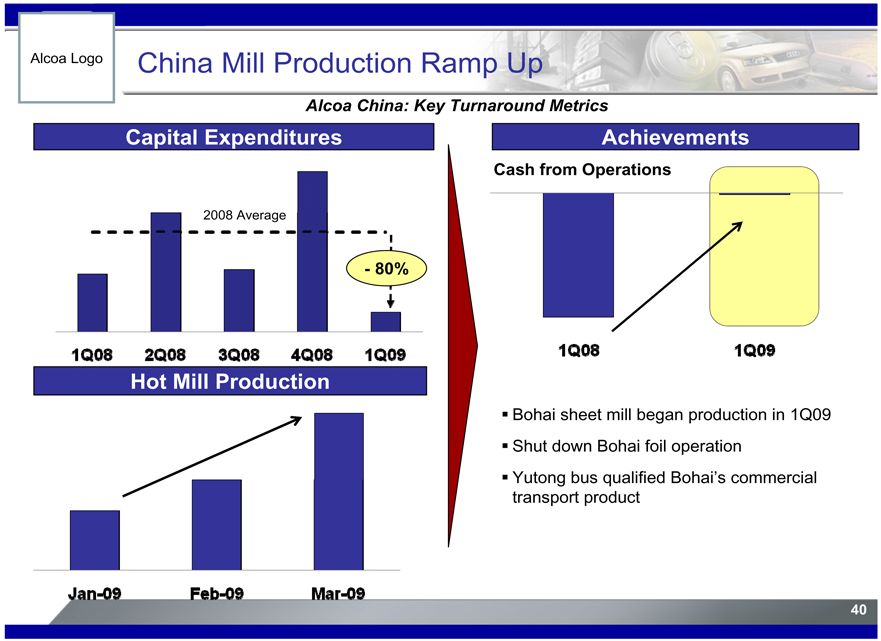
 11 Alcoa Logo Flat-Rolled Products 2 nd Quarter Outlook 1 st Quarter Business Conditions ($ million) 1Q 08 4Q 08 1Q 09 Global Rolled Products, excl Russia & China 72 (9) 6 Hard Alloy Extrusions 8 8 (1) Russia, China & Other (39) (97) (67) Total 41 (98) (62) ATOI Sequential improvement due to productivity gains in Global Rigid Packaging, closure of Bohai foil plant and favorable currency impact Continued customer destocking Significant volume declines across all market segments Continued weakness in end markets Gains from productivity and cost decreases |
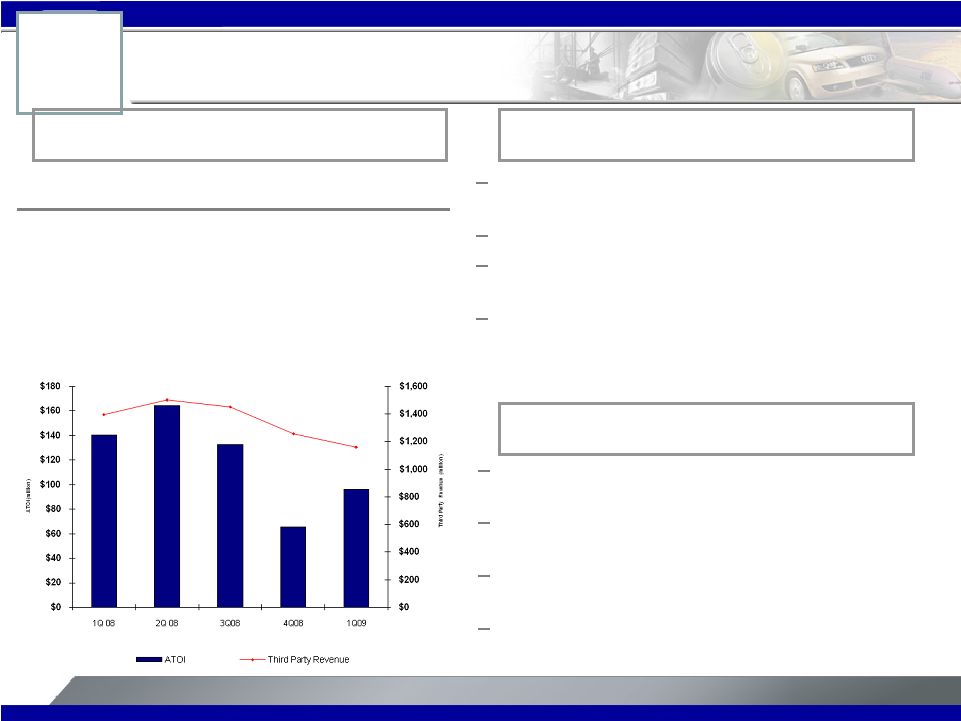 12 Alcoa Logo Engineered Products and Solutions 1Q 08 4Q 08 1Q 09 Third Party Revenue ($ million) 1,395 1,258 1,158 ATOI ($ million) 140 65 96 ATOI% / Revenue 10.0 5.2 8.3 Strong productivity gains more than offset weak market conditions Share gains helped mitigate sales decline Market conditions for Heavy Truck, Aerospace, and Building and Construction worse than anticipated Sales from the Automotive market less than expected, only accounted for 3% of total sales 1 st Quarter Highlights 1 st Quarter Business Conditions 2 nd Quarter Outlook Further weakness in Aerospace due to declining build rates Decline in Commercial Building and Construction demand expected to accelerate Continued weakness in global transportation markets Productivity gains expected, despite worsening market conditions |
 13 Alcoa Logo Cash Flow Statement (in millions) 1Q'08 4Q'08 1Q'09 Net Income (Loss) $303 $(1,191) $(497) DD&A 314 292 283 Change in Working Capital (581) 610 291 Taxes (16) (250) (303) Other Adjustments (289) 1,185 (11) Pension Contributions (19) (38) (34) Cash From Operating Activities $(288) $608 $(271) Dividends to Shareholders $(140) $(136) $(137) Change in Debt 416 444 (305) Dividends to Noncontrolling Interests (39) (102) (77) Contributions from Noncontrolling Interests 118 214 159 Share Repurchases (430) - - Share Issuances - - 876 Other Financing Activities 20 (43) (13) Cash From Financing Activities $(55) $377 $503 Capital Expenditures $(748) $(1,017) $(471) Sale of Investments 2 - 506 Proceeds from Sales of Assets 2,490 26 116 Additions to Investments (1,215) (27) (29) Acquisitions (291) - 18 Other Investing Activities (13) (5) (4) Cash From Investing Activities $225 $(1,023) $136 Debt-to-cap at 40.6% |
 14 Alcoa Logo Financial Plan Enhances Flexibility Common stock issued 172.5 million shares $876 million net proceeds Convertible notes issued $575 million 5.25% coupon and 22.5% conversion premium Maturity: March 15, 2014 Quarterly dividend cut to $0.03 per share Conserves $430 million of cash annually Shining Prospect joint venture unwind $500 million of $1 billion net proceeds received through 3/31/09 Strengthens Balance Sheet and Positions Alcoa to Capitalize on Strategic Opportunities |
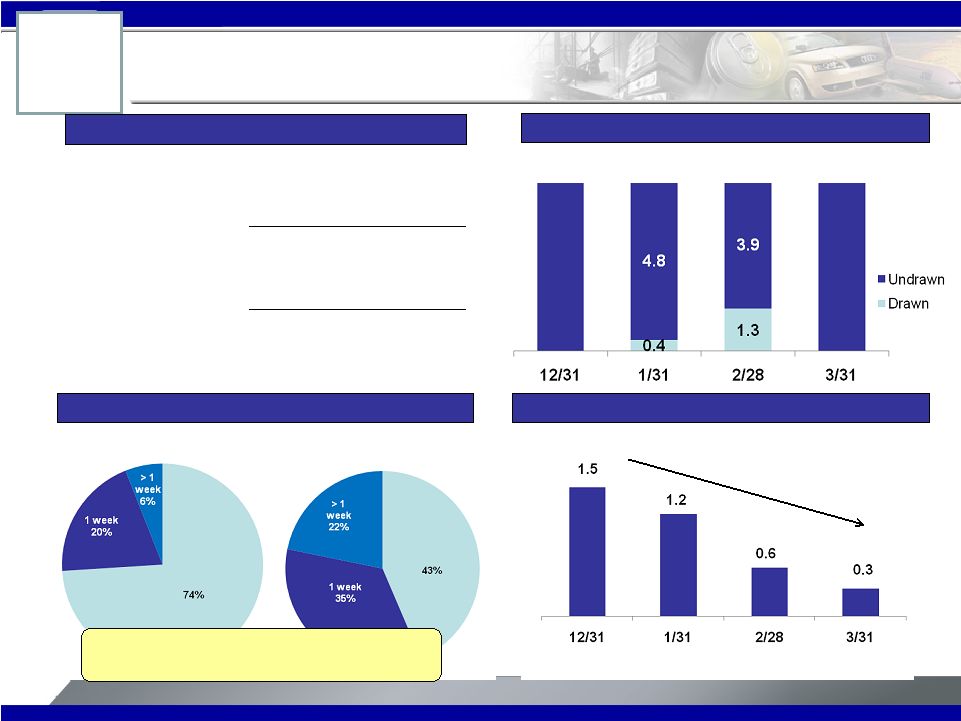 15 Alcoa Logo Balance Sheet / Liquidity Overview Capitalization Summary 12/31/2008 3/31/2009 Short-term debt $2,013 $1,013 Long-term debt 8,565 9,192 Total debt $10,578 $10,205 Noncontrolling interests $2,597 $2,500 Shareholders' equity $11,735 $ 12,437 Total capitalization $24,910 $25,142 Debt-to-capital ratio 42.5% 40.6% ($ million) Improved Commercial Paper 2 weeks prior to offering 2 weeks post offering Credit Revolvers ($ billion) 5.2 5.2 5.2 5.2 ($ billion) Commercial Paper Outstanding 15 bps improvement in overnight CP spread 56 bps improvement in 1-week CP spread Overnight Overnight |
 Alcoa Logo Klaus Kleinfeld President and Chief Executive Officer |
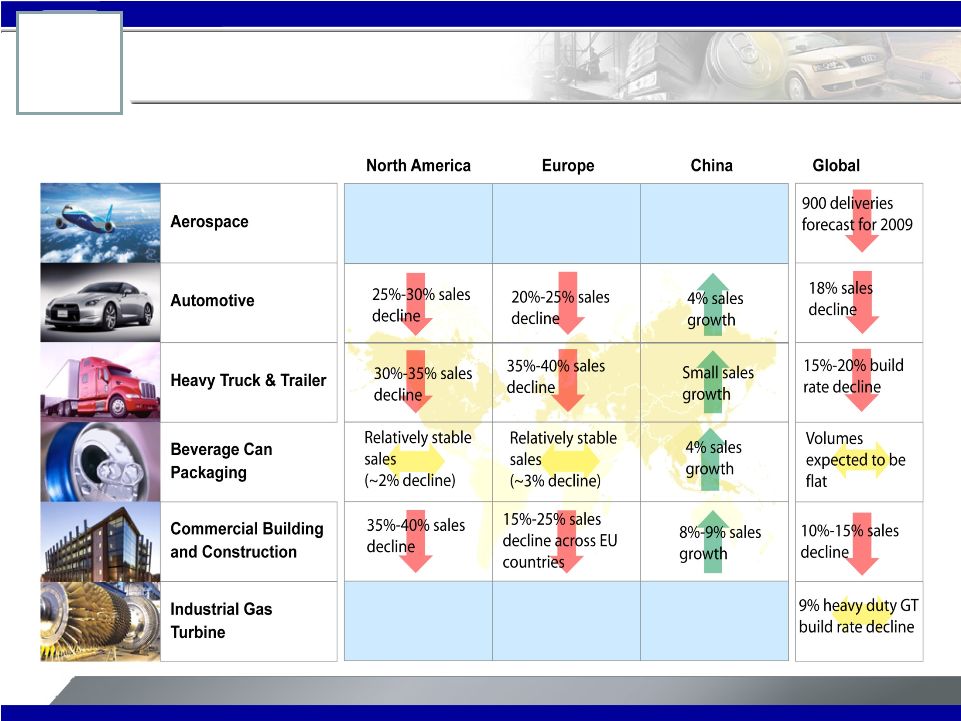 17 Alcoa Logo Alcoa Logo Challenging Market Conditions in 2009 Alcoa End Markets: Current Assessment of 2009 Conditions Source: Alcoa analysis |
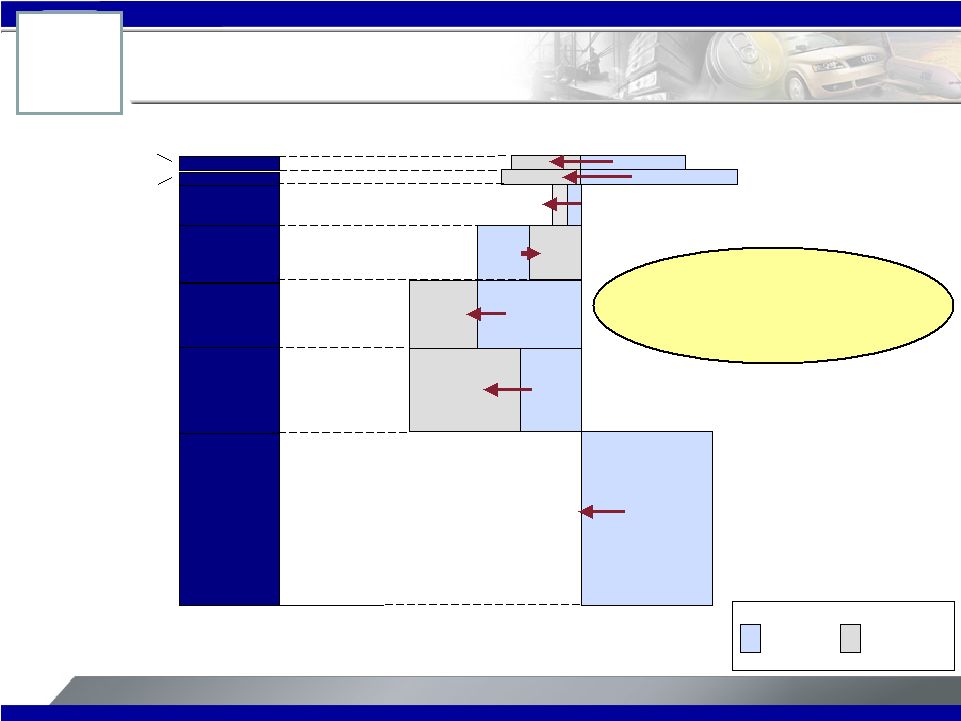 18 Alcoa Logo Alcoa Logo Global Demand Expected to Decline 7% in 2009 2008 Global Demand Growth Rate: -3% (2008 ex China: -8%) 2009 Global Demand Growth Rate: -7% (2009 ex China: -10%) Source: Alcoa analysis Brazil Russia Asia w/o China North America Europe China 2008 vs. 2009 Projected Growth Rates 2009 Projected Consumption 6.4 5.0 4.3 0% -15% -9% -15% -12% -12% -5% 13.1 9% 10% -5% -8% 0.9 5% Other* 4.0 -1% -2% * Other consists of: Middle East, India, Latin America ex Brazil and Rest of World 34.5 2008 Actual 2009 Forecast 0.8 2009 Projected Aluminum Consumption by Region (in mmt) |
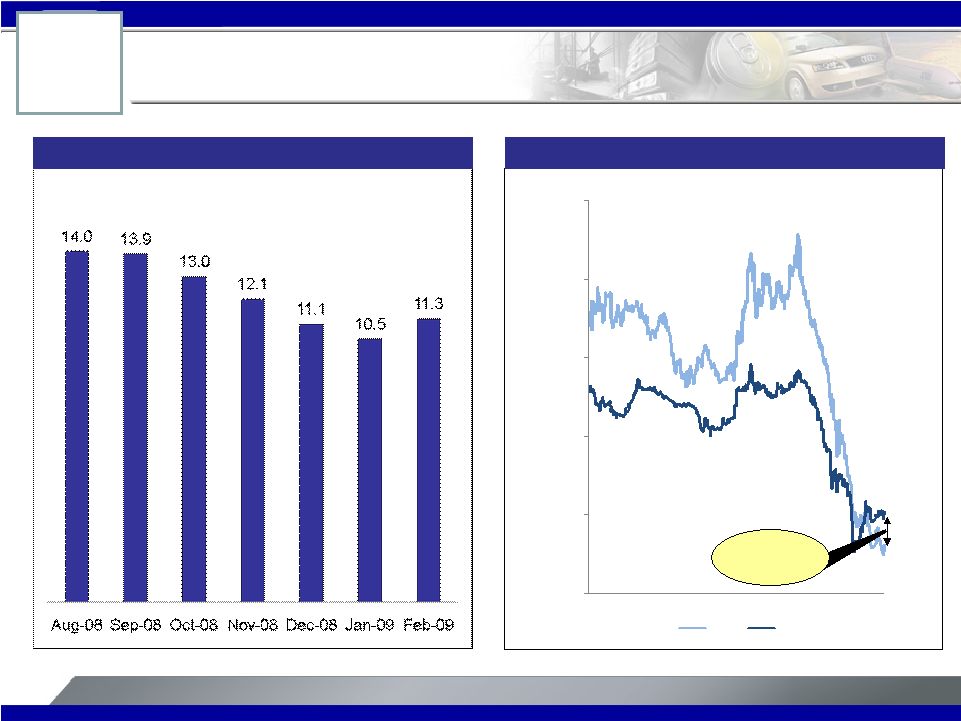
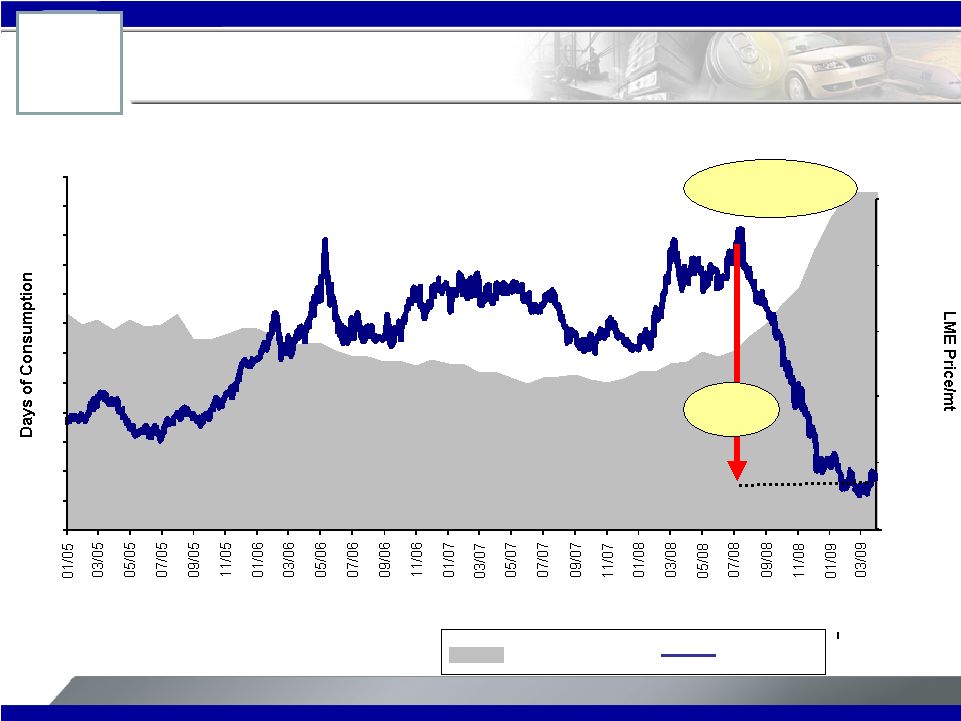 19 Alcoa Logo Alcoa Logo Historic Collapse in Metal Price - 57% $1,000 $1,500 $2,000 $2,500 $3,000 $3,500 LME cash price/ton, in US$ and global inventory 1) , in days 1) Reported Stocks : Comex, IAI, Japan Port , LME, & SME - 57% Reported Stocks, Days of Consumption LME Cash Price 57 Days of Consumption Source: IAI, Bloomberg 0 5 10 15 20 25 30 35 40 45 50 55 60 |
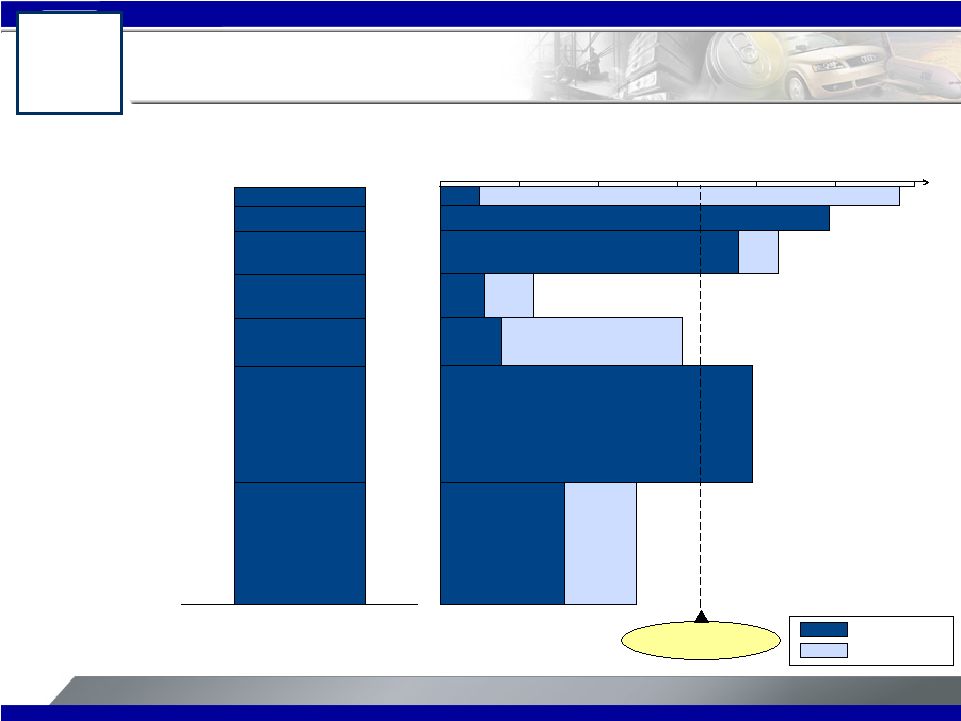
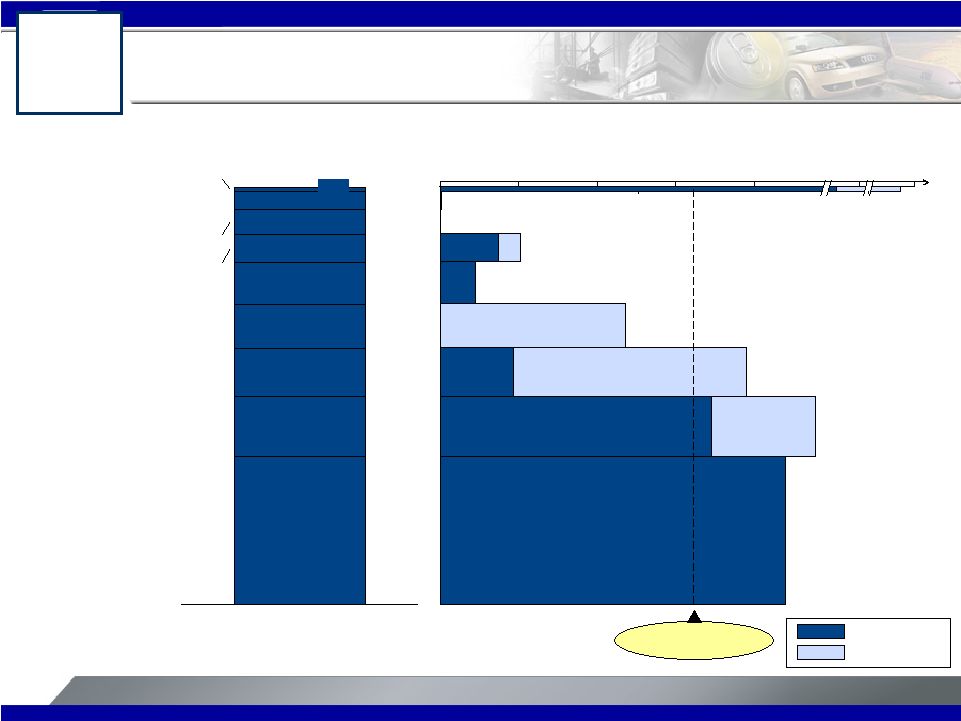 Alcoa Logo 20 Curtailment Announcements – 16% of 2008 Production Aluminum Supply: Curtailment Announcements by Region (annualized kmt) Note: As of 3/31/09 88 126 500 500 88 683 138 897 376 990 1,366 3,083 3,083 100 0% 10% 20% 50% 5% 15% Average = 16% 38 0 214 1 326 200 80% Curtailment % of Production Executed Not executed 412 1,719 2,296 3,933 5,722 Aug 08 Production 4,227 Africa 4,592 14,011 Eastern Europe Oceania North America Western Europe Russia 2,696 39,608 Asia / Middle East Latin America China Source: Production - CRU, IAI, and CNIA. Curtailments – Alcoa Analysis, Reuters, Bloomberg, Company Statements, Mitsui Bussan, Platts. |
 Alcoa Logo 21 Alcoa Ahead of Industry Average Aluminum Supply: Curtailment Announcements by Producer (annualized kmt) 1,769 2,317 3,990 4,049 4,494 10,788 11,352 38,759 2008 Production Hydro Chalco Alcoa Rio Tinto Alcan UC Rusal Other China Other ROW 513 570 570 100 752 852 127 113 15% 895 1,408 469 2,128 25% 0% 10% 20% 513 30% 5% 2,128 173 514 240 44 Curtailment % of Production Executed Not executed 687 Note: As of 3/31/09 Average = 17% Source: Production – CRU. Curtailments – Alcoa Analysis, Reuters, Bloomberg, Company Statements, Mitsui Bussan, Platts. |
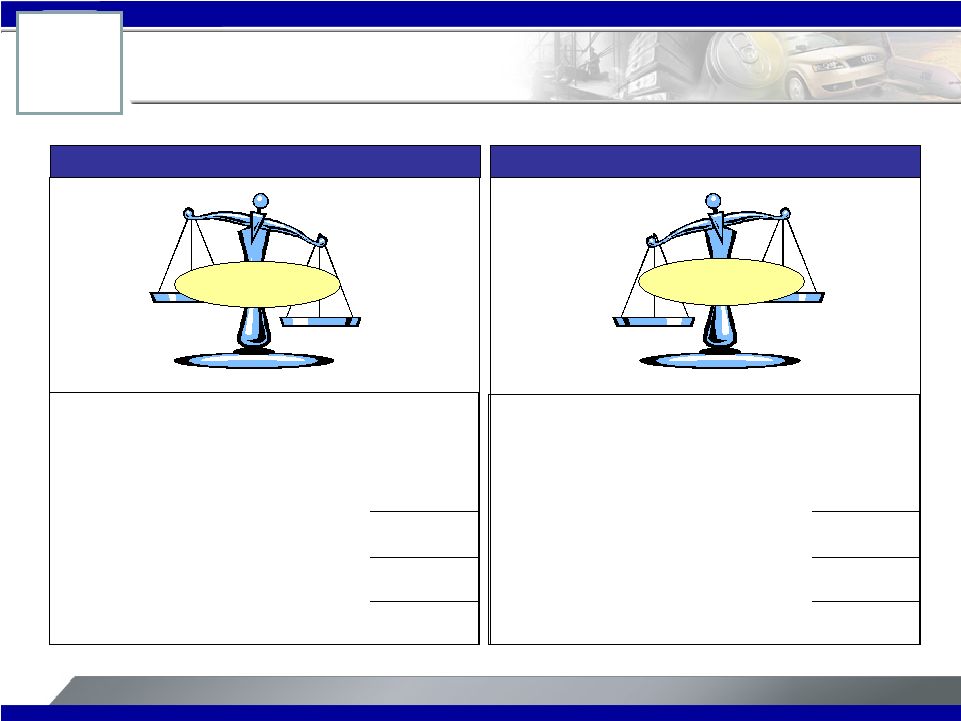 22 Alcoa Logo China Western World Western World in Surplus Position 2009E Aluminum Supply / Demand Balance (in kmt) Source: Alcoa analysis, CRU, IAI, as of 3/31/09 Jan-Feb 09 Primary Production Run Rate 11,000 Announced curtailments to be implemented 0 Supply 11,000 Demand (0% YOY change) (13,100) Deficit (2,100) Jan-Feb 09 Primary Production Run Rate 24,400 Announced curtailments to be implemented (1,600) Supply 22,800 Demand (10% YOY decrease) (21,400) Surplus 1,400 Deficit Surplus |
 23 Alcoa Logo China Western World 2009E Alumina Supply / Demand Balance (in kmt) Source: Alcoa analysis, CRU, IAI, as of 3/31/09 Jan-Feb 09 Alumina Production Run Rate 19,000 Announced curtailments to be implemented (2,500) Supply 16,500 Demand (21,100) Deficit (4,600) Jan-Feb 09 Alumina Production Run Rate 52,600 Announced curtailments to be implemented (4,200) Supply 48,400 Demand (43,800) Surplus 4,600 Global Equilibrium Alumina Market Reaches Equilibrium in 2009 Supply Demand Balance |
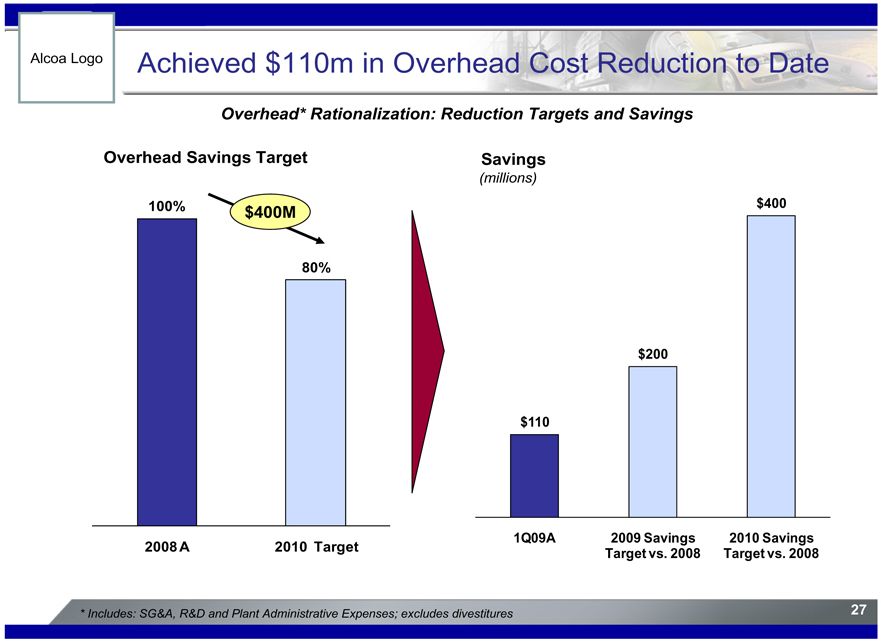
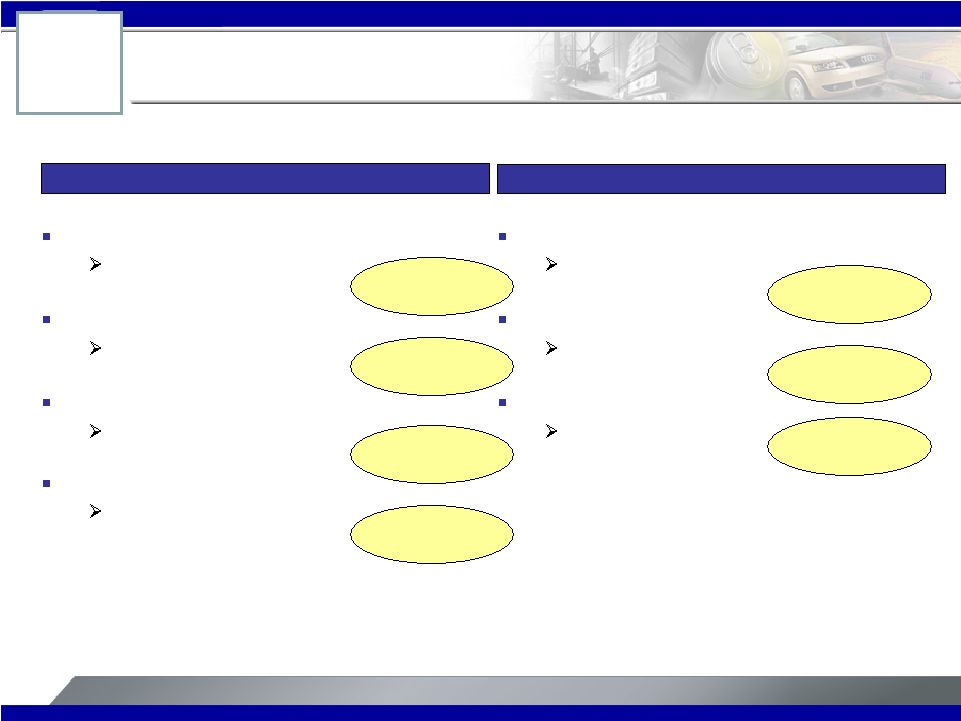 24 Alcoa Logo Alcoa Logo Improve Cash Flow and Balance Sheet Operational Financial Procurement Efficiencies Cost savings by 2010 Overhead Rationalizations Cost savings by 2010 CapEx Reductions Annual CapEx post 2009 Working Capital Initiatives Cash Impact 2009 Equity and Equity-Linked Financings Gross proceeds Dividend Reduction Annual cash savings Asset Dispositions Net proceeds Holistic Alcoa Approach: Improved Cost Structure and Balance Sheet $2,000M $400M $850M $800M $1,400M $430M $1,100M |
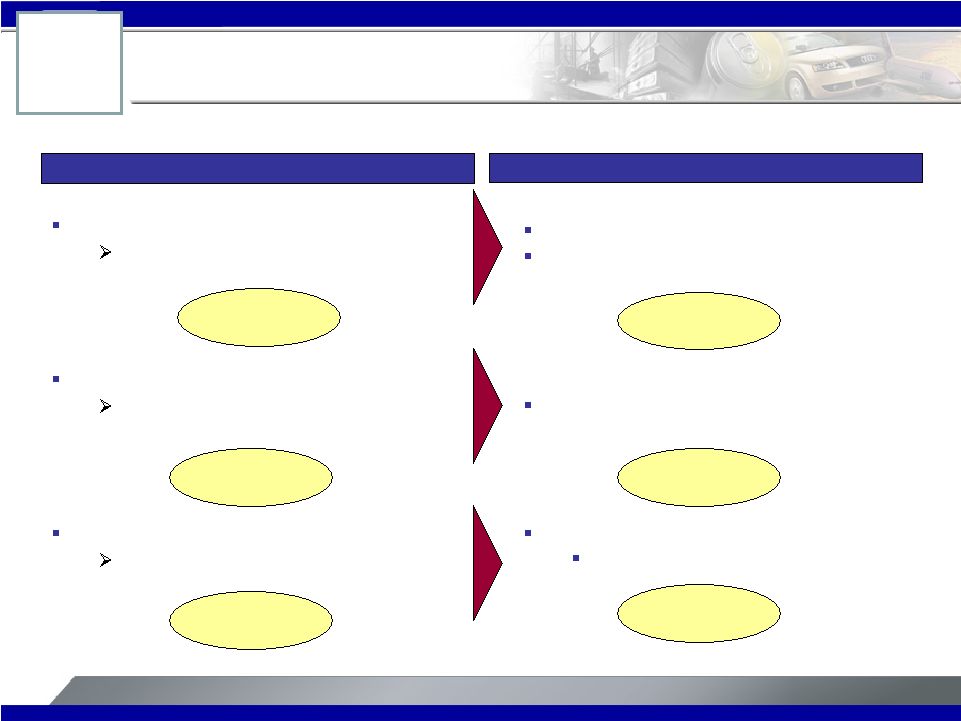 25 Alcoa Logo Alcoa Logo Financial Actions Strengthen Liquidity Position Initiative Results / Status Equity and Equity-Linked Financings Target gross proceeds Dividend Reduction $0.03 per common share per quarter from $0.17 Asset Dispositions $1,100M net proceeds $1,400M gross proceeds Convertible offering oversubscribed multiple times $1,000M from Shining Prospect unwind $500M received to date $430M annual cash savings Financial Initiatives: Targets and Results $1,000M $430M $1,400M $1,100M $0.03 per share $1,100M |
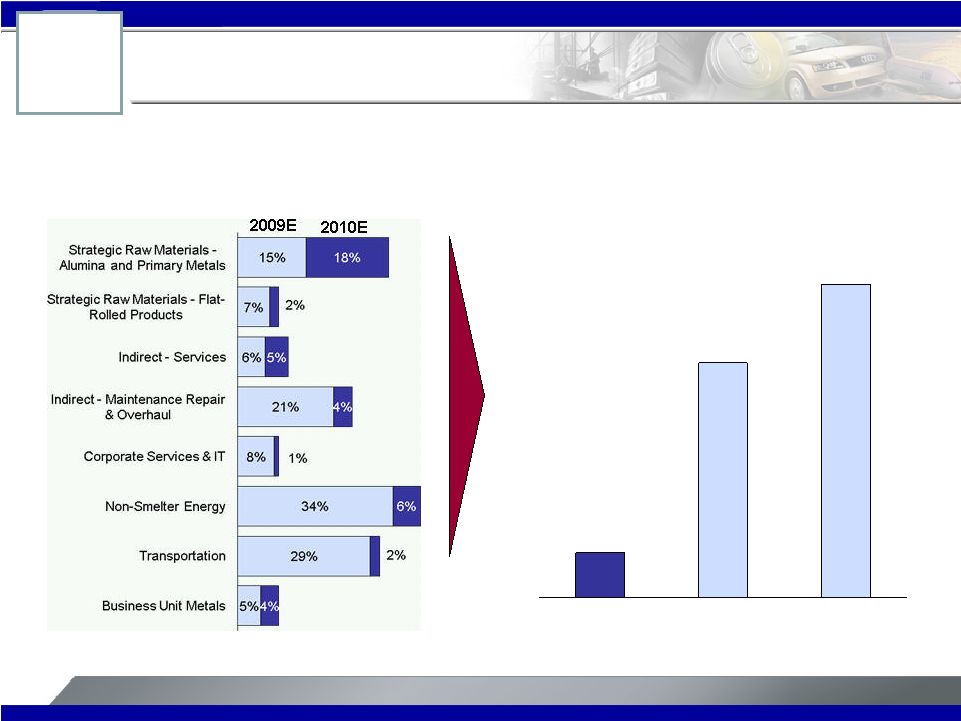 26 Alcoa Logo Alcoa Logo $293m Procurement Savings Realized to Date Procurement Efficiencies: Reduction Targets (millions) Reduction Targets by Spend Category Savings $293 $1,500 $2,000 1Q09A 2009 Savings Target vs. 2008 2010 Savings Target vs. 2008 |
 |
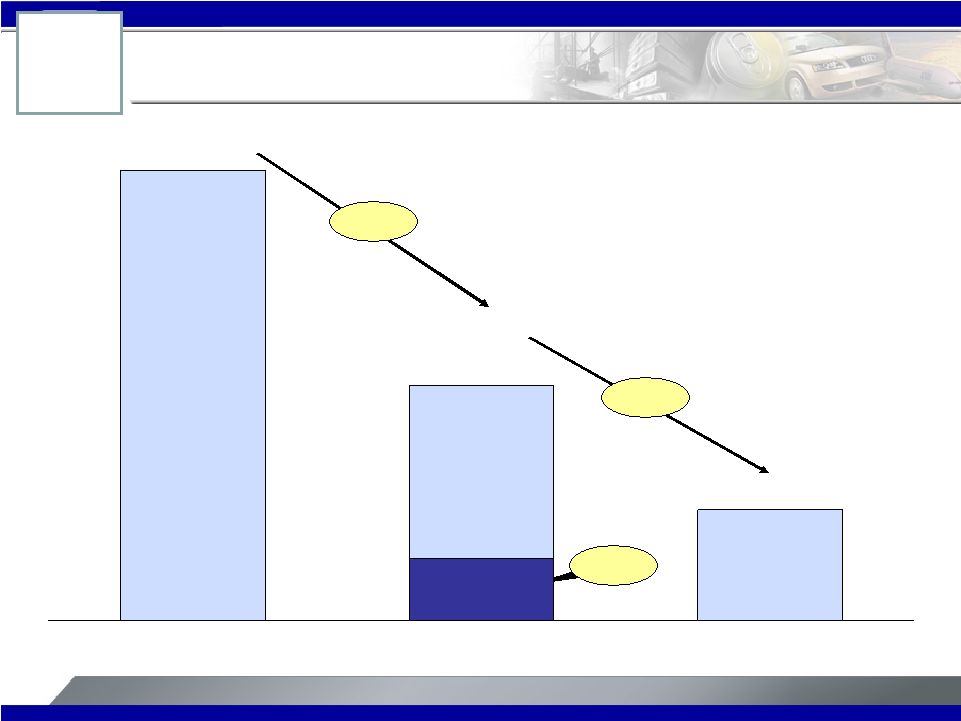 28 Alcoa Logo Alcoa Logo 2010 Capital Expenditures Will Decrease to $850M -48% -53% Capital Expenditure Reduction: Annual CapEx ($ millions) 1Q09A 1,800 471 3,438 1,329 850 2008 2009E 2010E |
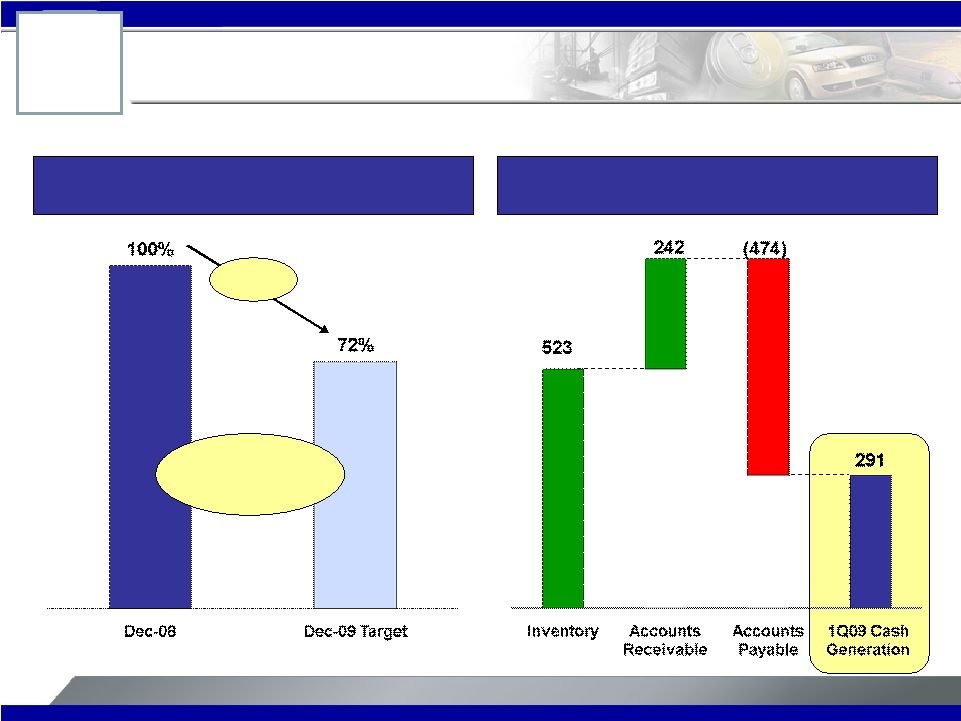 29 Alcoa Logo $291M of Working Capital Generated Working Capital Days Reduction Targets -28% 1Q09 Working Capital Change ($ millions) $800M decrease in working capital in 2009 Working Capital Initiatives: Targets and 1Q09 Results |
 |
 31 |
 |
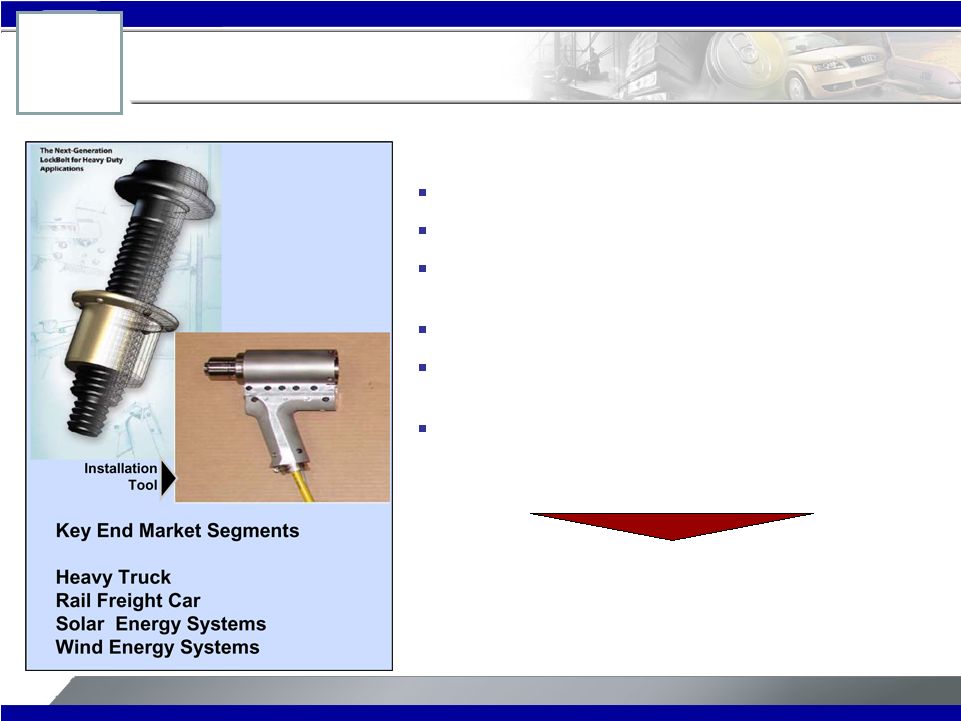 33 Alcoa Logo Benefits Cost Reduction – warranty, service and maintenance Patented Thread Geometry – superior vibration resistance Fast and Quiet Installation – 2 sec installation time with noise levels of <70dB Shorter Assembly Time – due to patented technology Ergonomic Installation Tool – 50 - 70% lighter than standard tools Health and Safety – low noise, non-vibrating installation tool reduces hand, wrist and hearing injuries First Results 14% Installation Cost Reduction at Large US Truck Manufacturer BobTail ® Fastening System – Revolutionary Technology Alcoa BobTail ® Fastening System: Benefits & First Results |
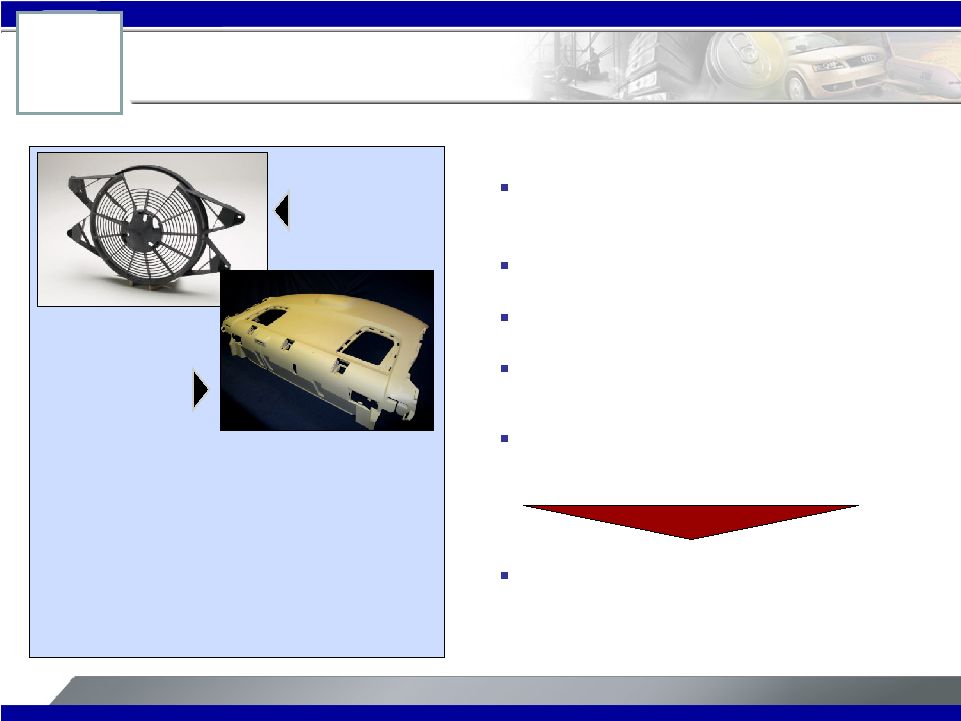 34 Alcoa Logo New QC-10 ® Mold Block – Saving 30% off the Bottom Line Benefits Up to 30% Lower Tool Costs – QC-10 machines eight times faster than steel Reduced Scrap Cost– due to less warpage Durable Alternative to Steel – in 6+ inches Up to 40% Faster Cycle Times – due to better thermal properties, Faster Time to Market – quicker mold production, fewer design iterations Better Bottom Line – up to 30% savings per unit produced vs. steel Automotive Rear Deck Fan Shroud Key End Market Segments Automotive Consumer Electronics Agriculture Appliances Furniture Alcoa QC-10 ® Forged Mold Block: Sample Products & Benefits |
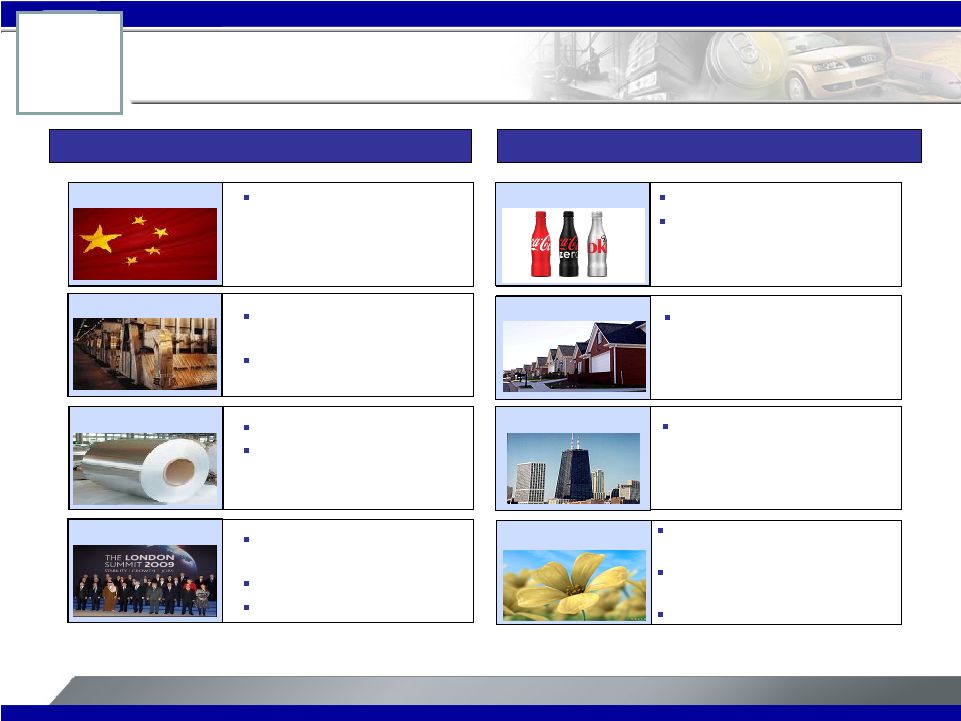 35 Alcoa Logo Supply / demand balance Unsustainable levels Rapid drawdown of inventories when economy rebounds Alternative fuel efficient buses New construction Transmission lines for grid Remain Optimistic Near-Term and Long-Term Continued execution of announced curtailments Expect additional curtailments in the Spring Near-Term Consumer electronics Aluminum bottle Population Living in Cities – 2006: > 50% – 2030: > 60% Global Population Growth – 2006: 6.6 billion – 2025: 7.9 billion – 2050: 9.1 billion Long-Term Energy consumption up 54% by 2025 Person Transport rates +40% by 2030 Greenhouse gas regulation China Curtailment Stimulus Programs De-Stocking New Applications Environment Urbanization Demographics Catalysts for Aluminum Industry Growth Source: United Nations, World Health Organization, World Bank, UNEP (United Nations Environment Program), FAO (Food and Agriculture Organization of the United Nations), Max Planck Institute |
 36 Alcoa Logo Elizabeth Besen Director, Investor Relations Alcoa 390 Park Avenue New York, NY 10022-4608 Telephone: (212) 836-2674 Facsimile: (212) 836-2813 www.alcoa.com For Additional Information, Contact: |
 37 Alcoa Logo Alcoa Logo |
 38 Alcoa Logo APPENDIX Alcoa Logo |
 39 Alcoa Logo China Aluminum Prices Supported by Market Factors China Aluminum Production (mmtpy) * * Source: IAI and CNIA. 1 As of 3/27/09 $1,000 $1,500 $2,000 $2,500 $3,000 $3,500 1/1/07 7/1/07 1/1/08 7/1/08 1/1/09 LME SHFE Metal Price Gap: SHFE vs LME China Aluminum Industry: Production and Price SHFE premium $364 1 |
 |
 41 Alcoa Logo Refining Cost Overview Fuel Oil 14% Natural gas 15% Caustic 10% Bauxite 25% Conversion 36% Input Cost Inventory flow Pricing convention Fuel oil 1 – 2 months Prior month Natural gas 1 – 2 months Rolling 16 quarters Caustic soda 3 - 6 months Spot & semi-annual Bauxite 2 - 3 months 6 - 9 month lag Composition of Refining Production Costs |
 42 Alcoa Logo Smelting Cost Overview Power 26% Materials 3% Conversion 22% Alumina 36% Carbon 13% Input Cost Inventory flow Pricing convention Alumina 1 – 2 months 2 – 3 month lags Power 1 – 2 months 40% LME linked – 3 month lag Carbon 1 - 2 months Spot & semi-annual Materials 1 - 2 months 1 – 3 month lag Conversion 1 month Immediate Several significant input costs lag average primary metal revenue by up to 3 months Composition of Smelting Production Costs |
 43 Alcoa Logo (in millions) 1Q08 2Q08 3Q08 4Q08 2008 1Q09 Total segment ATOI $ 668 $ 838 $ 665 $ 28 $ 2,199 $ (143) Unallocated amounts (net of tax): Impact of LIFO (31) (44) (5) 73 (7) 29 Interest income 9 12 10 4 35 1 Interest expense (64) (57) (63) (81) (265) (74) Noncontrolling interests (1) (67) (70) (84) – (221) (10) Corporate expense (82) (91) (77) (78) (328) (71) Restructuring and other charges (30) (1) (25) (637) (693) (46) Discontinued operations 4 (7) (38) (262) (303) (17) Other (104) (34) (115) (238) (491) (166) Consolidated net income (loss) attributable to Alcoa $ 303 $ 546 $ 268 $ (1,191) $ (74) $ (497) Prior period information was reclassified to reflect the movement of the Electrical and Electronic Solutions business to discontinued operations in the fourth quarter of 2008. (1) On January 1, 2009, Alcoa adopted Statement of Financial Accounting Standards No. 160, “Noncontrolling Interests in Consolidated Financial Statements – an amendment of ARB No. 51,” the provisions of which, among others, requires that minority interests be renamed noncontrolling interests for all periods presented. Reconciliation of ATOI to Consolidated Net Income (Loss) Attributable to Alcoa |
 44 Alcoa Logo (in millions) Quarter ended March 31, 2008* December 31, 2008 March 31, 2009 Net income (loss) attributable to Alcoa $ 303 $ (1,191) $ (497) Income (loss) from discontinued operations 4 (262) (17) Income (loss) from continuing operations attributable to Alcoa 299 (929) (480) Restructuring and other charges 29 614 46 Other special items** 28 94 (43) Income (loss) from continuing operations attributable to Alcoa – as adjusted $ 356 $ (221) $ (477) * Financial information for the quarter ended March 31, 2008 was reclassified to reflect the movement of the Electrical and Electronic Solutions business to discontinued operations in the fourth quarter of 2008. ** Other special items include the following: a discrete income tax charge related to the sale of the Packaging and Consumer businesses for the quarter ended March 31, 2008; obsolete inventory ($16), environmental reserve ($26), accounts receivable reserve ($11), non-cash tax on repatriated earnings ($65), and refund of indemnification payment (-$24) for the quarter ended December 31, 2008; and gain on Elkem/SAPA swap (-$133), loss on sale of Shining Prospect ($118), and discrete income tax benefit related to a tax law change in Canada (-$28) for the quarter ended March 31, 2009. Reconciliation of Adjusted Income |