 3 Quarter 2009 Earnings Conference October 7, 2009 Alcoa Logo Exhibit 99.2 rd |
 2 Alcoa Logo Forward-Looking Statements Today’s discussion may include “forward-looking statements” within the meaning of the Private Securities Litigation Reform Act of 1995. Such statements relate to future events and expectations and involve known and unknown risks and uncertainties. Alcoa’s actual results or actions may differ materially from those projected in the forward-looking statements. For a summary of the specific risk factors that could cause results to differ materially from those expressed in the forward-looking statements, please refer to Alcoa’s Form 10-K for the year ended December 31, 2008, Forms 10-Q for the quarters ended March 31, 2009 and June 30, 2009, and other reports filed with the Securities and Exchange Commission. |
 Chuck McLane Executive Vice President and Chief Financial Officer Alcoa Logo |
 4 Alcoa Logo 3 Quarter 2009 Financial Overview Income from continuing operations of $73 million, or $0.07 per share – Excluding restructuring and special items income from continuing operations of $39 million, or $0.04 per share Revenue up 9% sequentially Cash Sustainability initiatives exceeding targets Initiatives offsetting currency and energy headwinds EBITDA of $454 million Cash from operations of $184 million Received $520 million of final proceeds from Shining Prospect venture Debt-to-cap at 38.3%, down 140 basis points sequentially – Cash on hand of $1.1 billion rd , |
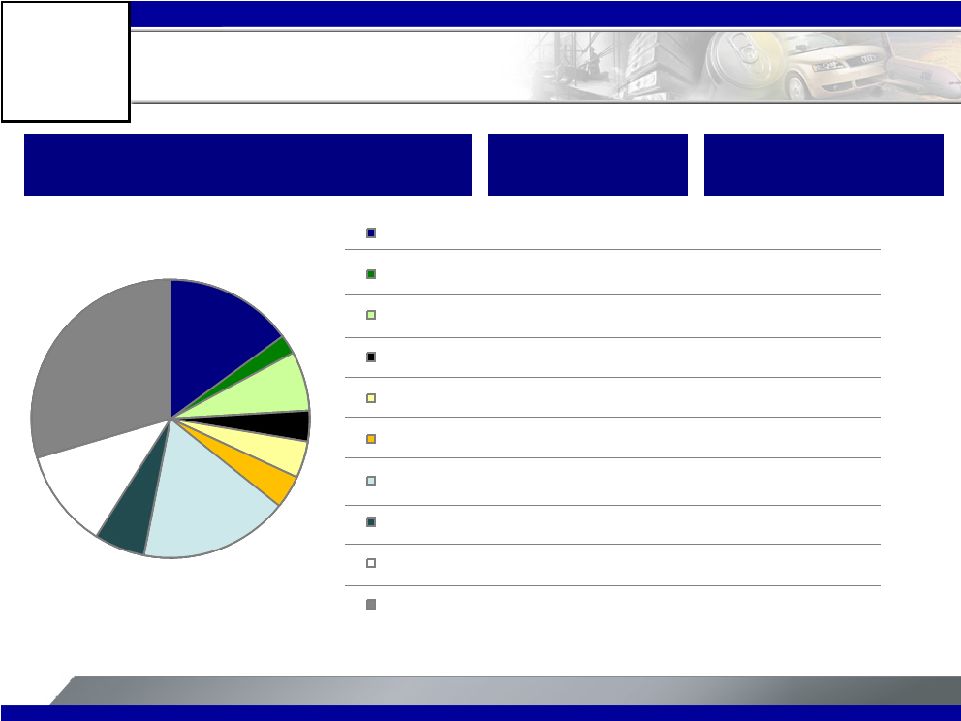 5 Alcoa Logo Revenue Change by Market (9%) 13% 3% 14% 24% (5%) 5% 10% 20% 19% (27%) (41%) (36%) (41%) (39%) (8%) (24%) (52%) (34%) (36%) 3Q’09 Third Party Revenue Sequential Change Year-Over-Year Change 15% 2% 7% 4% 4% 4% 17% 6% 11% 30% Aerospace Automotive B&C Comm. Transport Industrial Products IGT Packaging Distribution/Other Alumina Primary Metals |
 6 Alcoa Logo Sequential Income Statement Summary $ Millions 2Q’09 3Q’09 Change Sales $4,244 $4,615 $371 Cost of Goods Sold $3,966 $3,888 ($78) COGS % Sales 93.4% 84.2% (9.2 % pts.) Selling, General Administrative, Other $240 $234 ($6) SGA % Sales 5.7% 5.1% (0.6 % pts.) Restructuring and Other Charges $82 $17 ($65) Effective Tax Rate 25.4% (22.4%) (47.8 % pts.) Income (Loss) from Continuing Operations ($312) $73 $385 Income (Loss) from Discontinued Operations ($142) $4 $146 |
 7 Alcoa Logo 3 Quarter Restructuring and Special Items $ Millions After-Tax and Non-controlling Interests EPS ($/Share) Segment Restructuring ($1) ($0.00) Corporate Gain on Suralco Transaction $35 $0.04 Alumina / Corporate Total Restructuring and Special Items $34 $0.03 rd |
 8 Alcoa Logo Rapid Reduction in Headcount In 2009 Charges ($ Millions) 224 48 38 5 315 2009 cash savings of $320 million - Run rate savings of $540 million Headcount Reductions Announced by Quarter Completed Not Yet Completed 15,300 4,400 1,950 550 22,200 2H'08 Q1'09 Q2'09 Q3'09 Total |
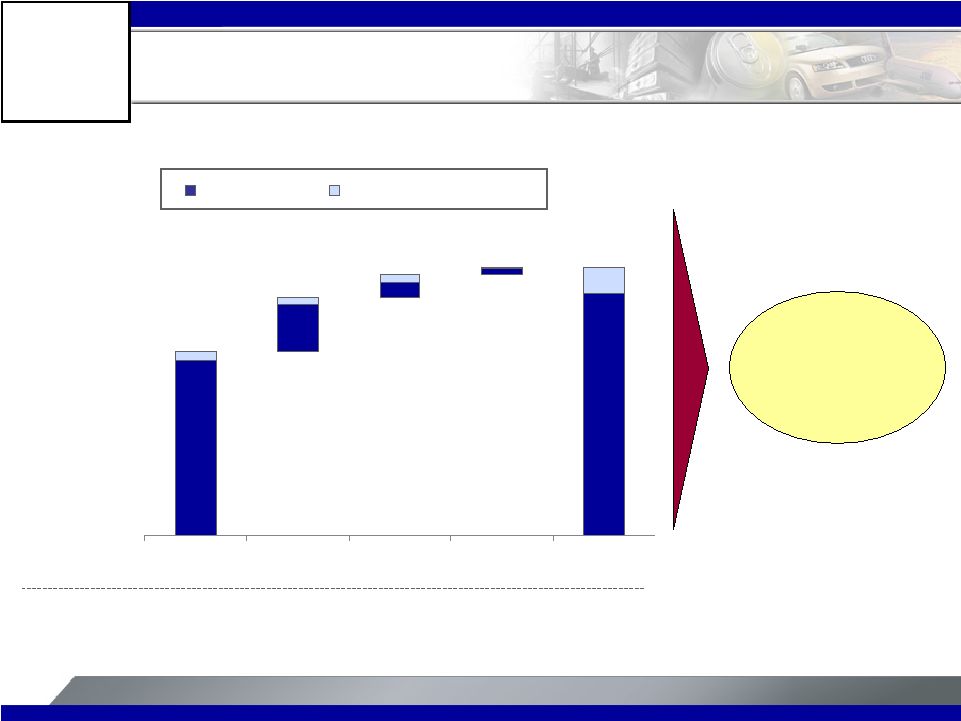
 9 Alcoa Logo 3Q 2009 vs. 2Q 2009 Earnings Bridge Income (Loss) from Continuing Operations excluding Restructuring & Other Special Items ($ millions) See Appendix for Reconciliation ($256) $16 $7 ($11) ($78) $74 $244 $43 $39 |
 10 Alcoa Logo YTD 2009 vs. YTD 2008 Earnings Bridge Income (Loss) from Continuing Operations excluding Restructuring & Other Special Items ($ millions) See Appendix for Reconciliation $1,232 ($2,378) ($670) ($201) $117 $350 $867 ($113) $102 ($694) |
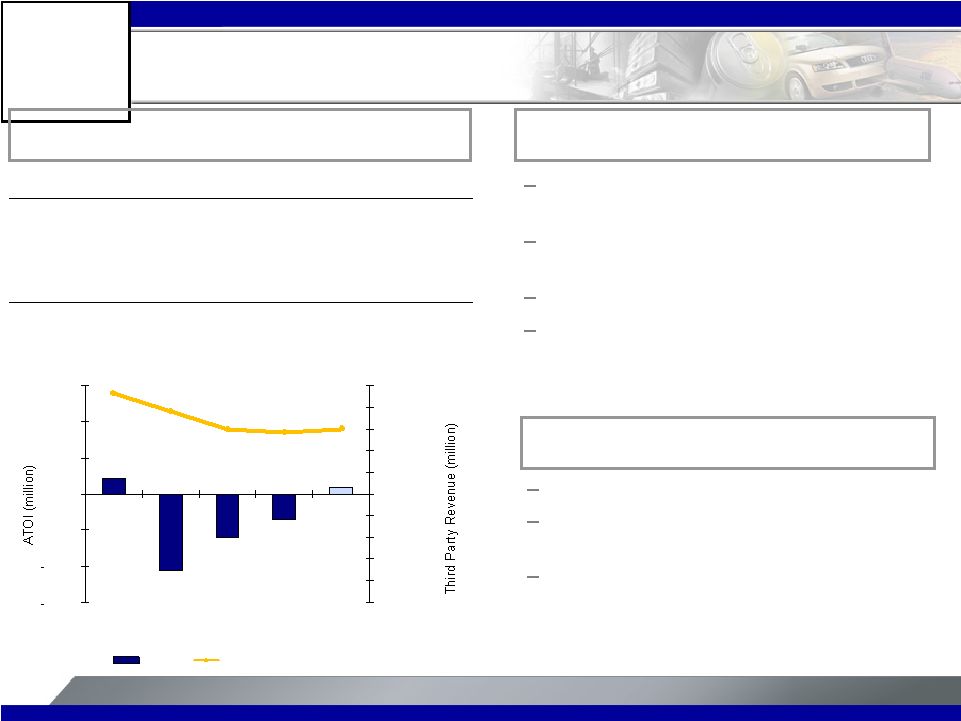
 11 Alcoa Logo 3Q 08 2Q 09 3Q 09 Production (kmt) 3,790 3,309 3,614 3 Party Shipments (kmt) 2,010 2,011 2,191 3 Party Revenue ($MM) 805 441 530 ATOI ($MM) 206 (7) 65 Production up 9% on improved 3 party demand and the inclusion of Suralco at 100% Realized 3 party Alumina price up 13% versus previous quarter Suralco transaction benefit to ATOI of $58 million Negative currency impact of $28 million Higher energy costs of $13 million Alumina 3 Quarter Highlights 4 Quarter Outlook 3 Quarter Business Conditions Continued benefits from cash sustainability initiatives Benefit of lower caustic price accelerates Ramp-up costs of Brazil projects will negatively impact results -$500 $0 $500 $1,000 $1,500 $2,000 $2,500 -$50 $0 $50 $100 $150 $200 $250 3Q08 4Q08 1Q09 2Q09 3Q09 ATOI Third Party Revenue rd rd th rd rd rd rd |
 12 Alcoa Logo 3 Quarter Highlights 3Q 08 2Q 09 3Q 09 Production (kmt) 1,011 906 881 3 Party Shipments (kmt) 704 779 698 3 Party Revenue ($MM) 2,127 1,146 1,362 3 Party Price ($/MT) 2,945 1,667 1,972 ATOI ($MM) 297 (178) (8) Primary Metals 4 Quarter Outlook 3 Quarter Business Conditions Realized pricing up 18% Production down 3% as the full impact of curtailments is realized Negative currency impact of $29 million Continued benefits from cash sustainability initiatives especially in key raw materials Pricing will continue to follow a 15-day lag on LME Energy costs increasing -$1,500 -$1,000 -$500 $0 $500 $1,000 $1,500 $2,000 $2,500 -$300 -$200 -$100 $0 $100 $200 $300 $400 $500 3Q08 4Q08 1Q09 2Q09 3Q09 ATOI Third Party Revenue rd rd th rd rd rd |
 13 Alcoa Logo Flat-Rolled Products 4 Quarter Outlook 3 Quarter Business Conditions ATOI $ Millions 3Q 08 2Q 09 3Q 09 Flat-Rolled Products, excl Russia, China & Other 56 2 37 Russia, China & Other (34) (37) (27) Total ATOI 22 (35) 10 Improved order intake – shipments up 6% versus last quarter Moderate revenue increases in all key end markets Gains from cash sustainability initiatives Year-to-date headcount reduction of 19% Cautious demand outlook for all end markets Continued benefits from cash sustainability initiatives Seasonal impact from year-end holiday shutdowns 3 Quarter Highlights -$2,500 -$2,000 -$1,500 -$1,000 -$500 $0 $500 $1,000 $1,500 $2,000 $2,500 $150 $100 -$50 $0 $50 $100 $150 3Q08 4Q08 1Q09 2Q09 3Q09 ATOI Third Party Revenue rd rd th |
 14 Alcoa Logo Engineered Products and Solutions Weaker Aerospace market as destocking continues throughout the supply chain Decline in Commercial Building and Construction and IGT demand Wheels business uptick on heavy truck orders Gains from cash sustainability initiatives 3 Quarter Business Conditions 4 Quarter Outlook Aerospace, Commercial Building and Construction and IGT markets continue weak Improved performance in the Commercial Transportation market Seasonal impact from year-end holiday shutdowns Continued benefits from cash sustainability initiatives $ Millions 3Q 08 2Q 09 3Q 09 3 Party Revenue 1,596 1,194 1,128 ATOI 140 88 75 ATOI % of Revenue 8.8% 7.4% 6.6% 3 Quarter Highlights $0 $500 $1,000 $1,500 $2,000 $0 $50 $100 $150 $200 3Q08 4Q08 1Q09 2Q09 3Q09 ATOI Third Party Revenue rd rd th rd |
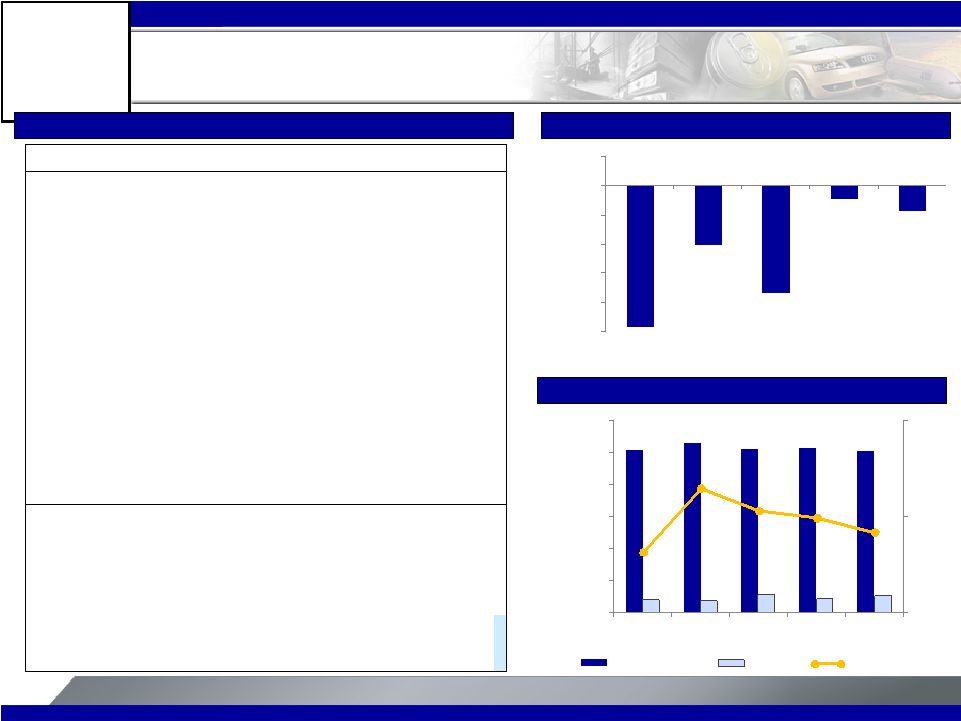  15 Alcoa Logo Strengthened Liquidity and Cash Position ($ Millions) 3Q'08 2Q'09 3Q'09 Net Income (Loss) $352 ($459) $124 DD&A 312 317 342 Change in Working Capital (361) 329 100 Taxes 146 (138) (69) Pension Contributions (418) (35) (33) Other Adjustments (124) 314 (280) Cash From Operations ($93) $328 $184 Capital Expenditures (877) (418) (370) Free Cash Flow ($970) ($90) ($186) Cash Flow Cash and Debt (in millions) Free Cash Flow (in millions) -$1,000 -$800 -$600 -$400 -$200 $0 $200 3Q'08 4Q'08 1Q'09 2Q'09 3Q'09 10,125 10,578 10,205 10,265 10,073 831 762 1,131 851 1,066 30% 40% 50% $0 $2,000 $4,000 $6,000 $8,000 $10,000 $12,000 3Q'08 4Q'08 1Q'09 2Q'09 3Q'09 Gross Debt Cash Debt to Cap |
 16 Alcoa Logo Strengthened Capital Market Position Source: Bloomberg Alcoa Debt & Equity Alcoa Credit Default Swaps 4.00 5.00 6.00 7.00 8.00 9.00 10.00 11.00 12.00 13.00 14.00 15.00 16.00 17.00 Alcoa Share Price ($) Alcoa July 2013 Debt Yield (%) 0 100 200 300 400 500 600 700 800 900 1,000 1,100 1,200 1,300 Alcoa 5-Year CDS (basis points) |
 Klaus Kleinfeld President and Chief Executive Officer Alcoa Logo |
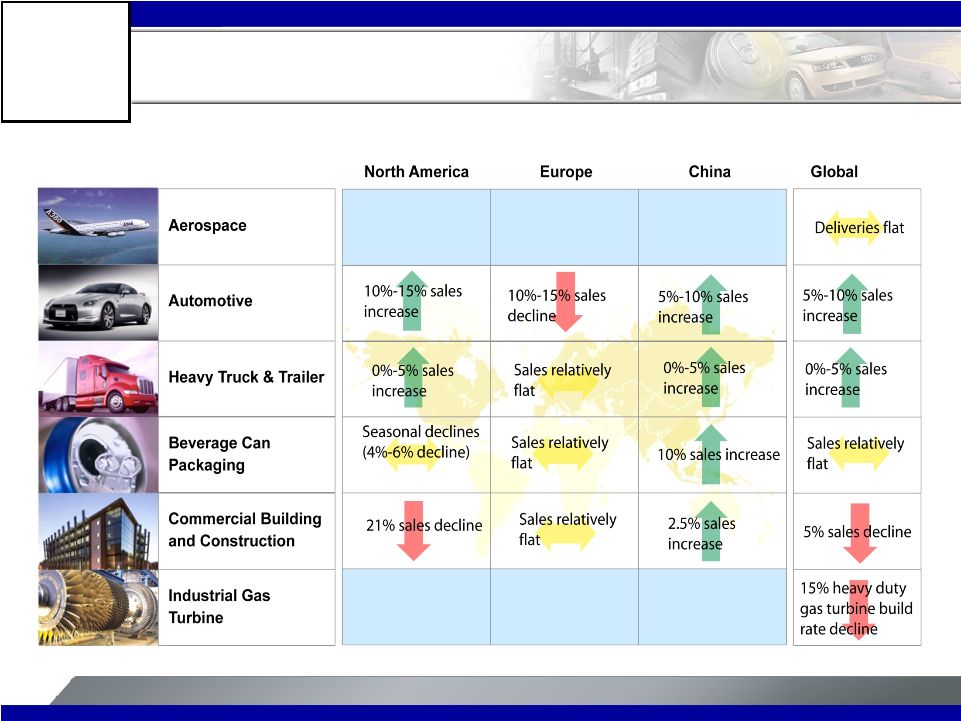
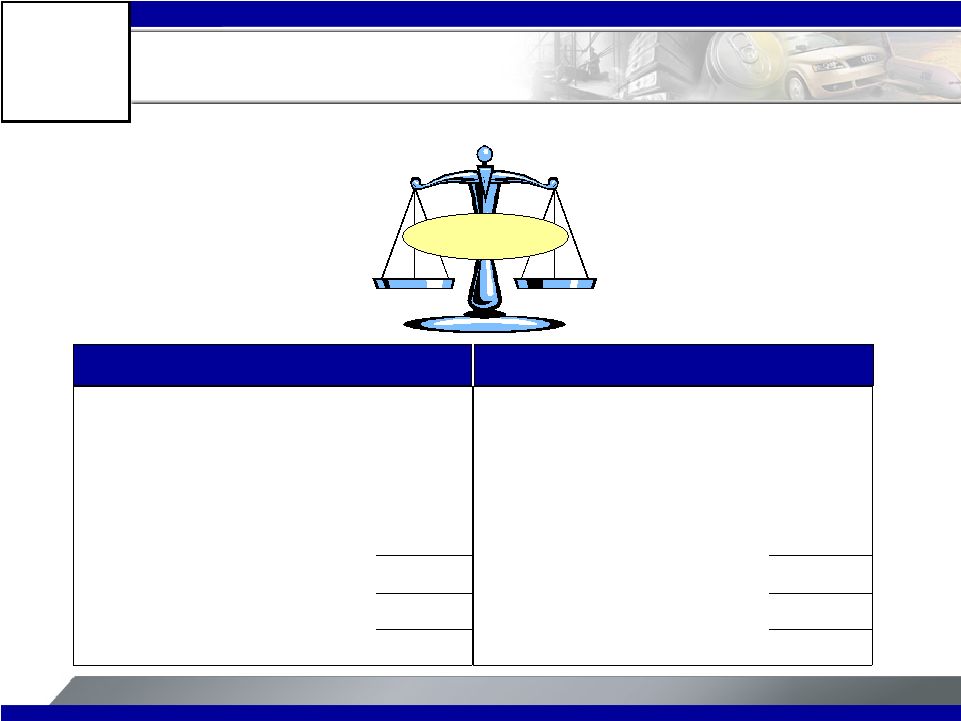
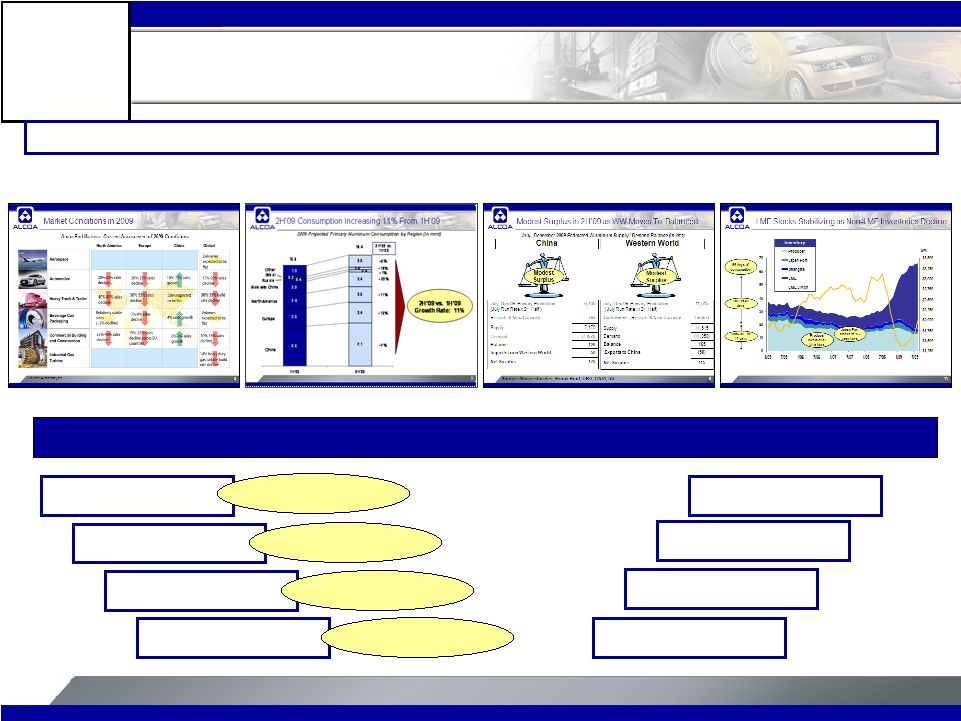
 18 Alcoa Logo Market Conditions in 2009 Source: Alcoa analysis Alcoa End Markets: Current Assessment of 2009 Conditions |
 19 Alcoa Logo Improving Market Conditions in 2 nd Half 2009 Source: Alcoa analysis Alcoa End Markets: Assessment of 2 Half 2009 VS 1 Half 2009 Conditions nd st |
 20 Alcoa Logo Consumption Outlook Slightly Improved 2008 Global Demand Growth Rate: -3% (2008 ex China: -8%) 2009 Global Demand Growth Rate: -6% (2009 ex China: -10%) Source: Alcoa analysis Brazil Russia Asia w/o China North America Europe China 2008 vs. 2009 Projected Growth Rates 2009 Projected Consumption -12% 13.6 9% -5% -15% 0.9 5% Other* 4.0 -1% -2% *Other consists of: Middle East, India, Latin America ex Brazil and Rest of World 35.0 2008 Actual 2009 Forecast 0.8 2009 Projected Primary Aluminum Consumption by Region (in mmt) 4% - 5% - 12% - 15% - 15% - 9% 6.4 5.0 4.3 10% |
 21 Alcoa Logo 2H’09 Consumption Increasing 11% From 1H’09 16.6 18.4 2H’09 vs. 1H’09 Growth Rate: 11% +6% +18% +1% +22% +11% +16% +7% 2H’09 vs. 1H’09 2009 Projected Primary Aluminum Consumption by Region (in mmt) Source: Alcoa analysis *Other consists of: Middle East, India, Latin America ex Brazil and Rest of World 6.6 7.1 3.0 3.4 2.4 2.6 2.0 2.4 0.4 0.4 0.3 0.4 1.9 2.0 1H'09 2H'09 Other* Brazil Russia Asia w/o China North America Europe China |
 22 Alcoa Logo China Western World Aluminum Market in Surplus 2009E Primary Metal Supply / Demand Balance (in kmt) Jan-July 09 Primary Production Run Rate (Annualized) 12,000 Announced Restarts & New Capacity Effect Aug - December 2009 850 Supply 12,850 Demand (13,650) Deficit (800) Imports from Western World 1,250 Net Surplus 450 Jan-July 09 Primary Production Run Rate (Annualized) 23,375 Announced Curtailments, Restarts & New Capacity Effect Aug - December 2009 160 Supply 23,535 Demand (21,360) Surplus 2,175 Exports to China (1,250) Net Surplus 925 Surplus Surplus Source: Alcoa estimates, Brook Hunt, CRU, CNIA, IAI |
 23 Alcoa Logo July – December 2009 Estimated Primary Metal Supply / Demand Balance (in kmt) July-Dec 09 Primary Production (July Run Rate x 2 nd Half ) 6,405 Restarts & New Capacity 765 Supply 7,170 Demand (7,050) Balance 120 Imports from Western World 50 Net Surplus 170 July-Dec 09 Primary Production (July Run Rate x 2 nd Half) 11,515 Curtailments ,Restarts & New Capacity Limited Supply 11,515 Demand (11,350) Balance 165 Exports to China (50) Net Surplus 115 Source: Alcoa estimates, Brook Hunt, CRU, CNIA, IAI Modest Surplus in 2H’09 as WW Moves To Balanced Modest Surplus Modest Surplus China Western World |
 24 Alcoa Logo 2009E Alumina Supply / Demand Balance (in kmt) Source: Alcoa estimates, CRU, CNIA, IAI Alumina Market Reaches Equilibrium in 2009 Jan-Jul 09 Alumina Production Run Rate (Annualized) 20,200 Announced restarts 400 Imports from Western World 5,000 Supply 25,600 Demand (25,000) Net Surplus 600 Jan-Jul 09 Alumina Production Run Rate (Annualized) 49,100 Announced restarts 450 Exports to China (5,000) Supply 44,550 Demand (45,300) Net Deficit (750) Balanced China Western World |
 25 Alcoa Logo 2009E Alumina Supply / Demand Balance (in kmt) Source: Alcoa estimates, CRU, CNIA, IAI Alumina Market in Balance in 2H’09 Jul-Dec 09 Alumina Production Run Rate 10,700 Announced restarts 400 Imports from Western World 2,300 Supply 13,400 Demand (12,700) Net Surplus 700 Jul-Dec 09 Alumina Production Run Rate 24,600 Announced restarts 450 Exports to China (2,300) Supply 22,750 Demand (23,200) Net Deficit (450) Balanced China Western World |
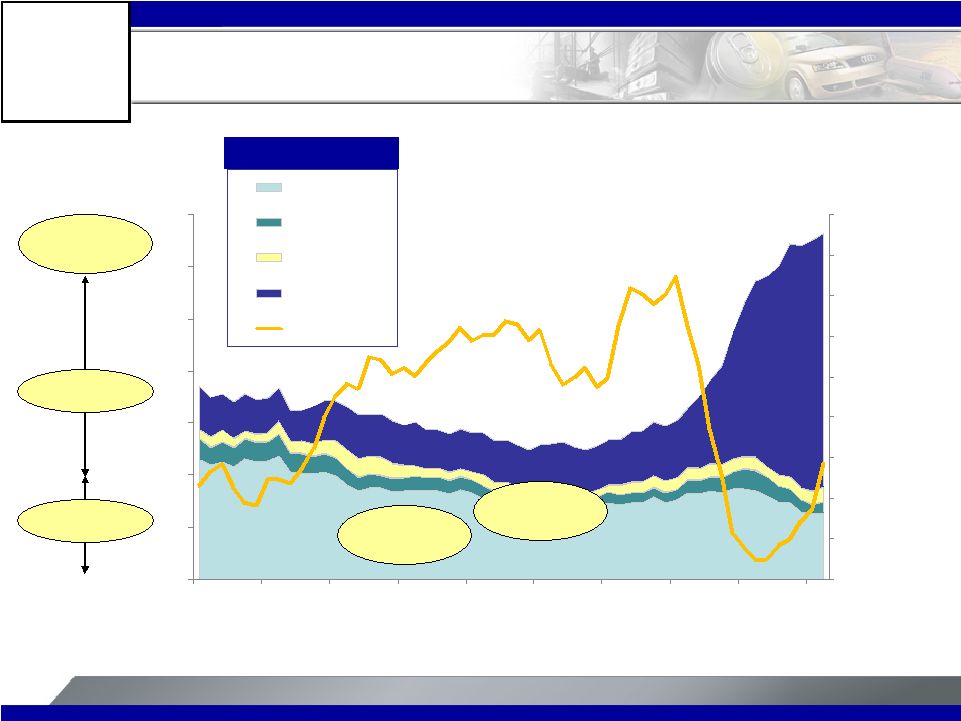 26 Alcoa Logo $1,250 $1,500 $1,750 $2,000 $2,250 $2,500 $2,750 $3,000 $3,250 $3,500 0 10 20 30 40 50 60 70 1/05 7/05 1/06 7/06 1/07 7/07 1/08 7/08 1/09 7/09 Producer Japan Port Shanghai LME LME 3 Mon Rise In LME Stocks Slows As Non-LME Stocks Decline $/MT Producer levels at all time lows Japan Port stocks at 15- year lows Inventory Source: Bloomberg, IAI 67 days of consumption LME at 49 days Non-LME at 18 days |
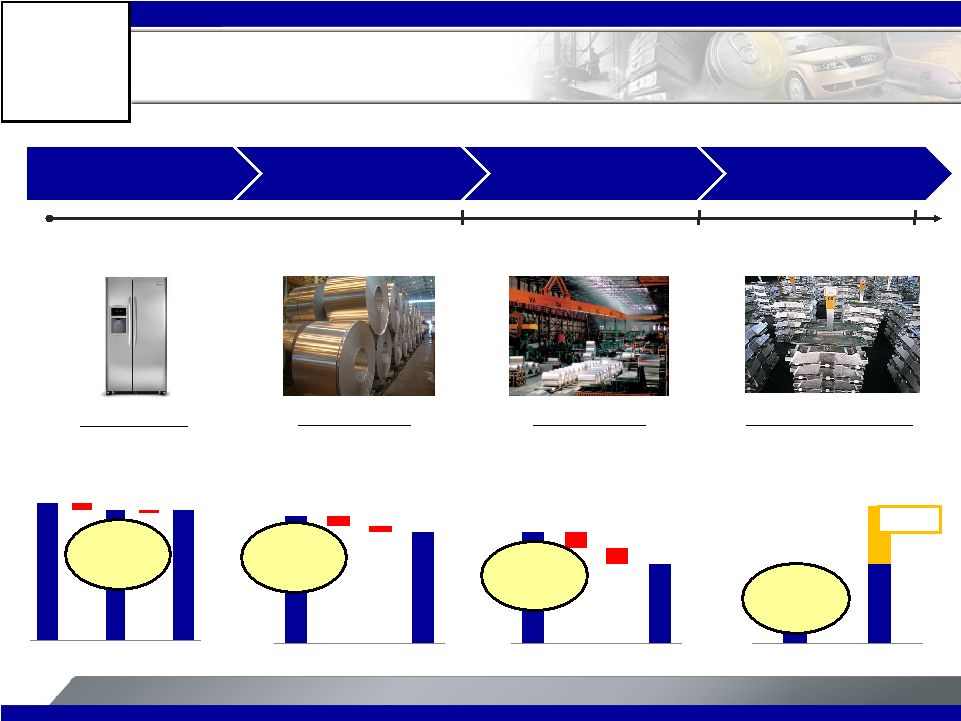 27 Alcoa Logo Destocking Has Left The Supply Chain Depleted – 1 Week of Inventory – Minimal Lead-time – 3 months of Inventory – 3 Month Lead-time – 2 months of Inventory – 3 Month Lead-time Distributor Rolling Mill Smelter OEM The Impact of Destocking on the Supply Chain – Continuous Flow Excess Old Order Order Reduction New Order Order to Service Center On Floor New Order In Process On Floor Order to Rolling Mill New Order In Process On Floor Order to Smelter New Order Production Volume -7% -17% -42% -5% Time Line 3 Months 6 Months 9 Months Source: Davenport & Company; Alcoa analysis Refrigerator Rolled Sheet Rolled Sheet Primary Aluminum |
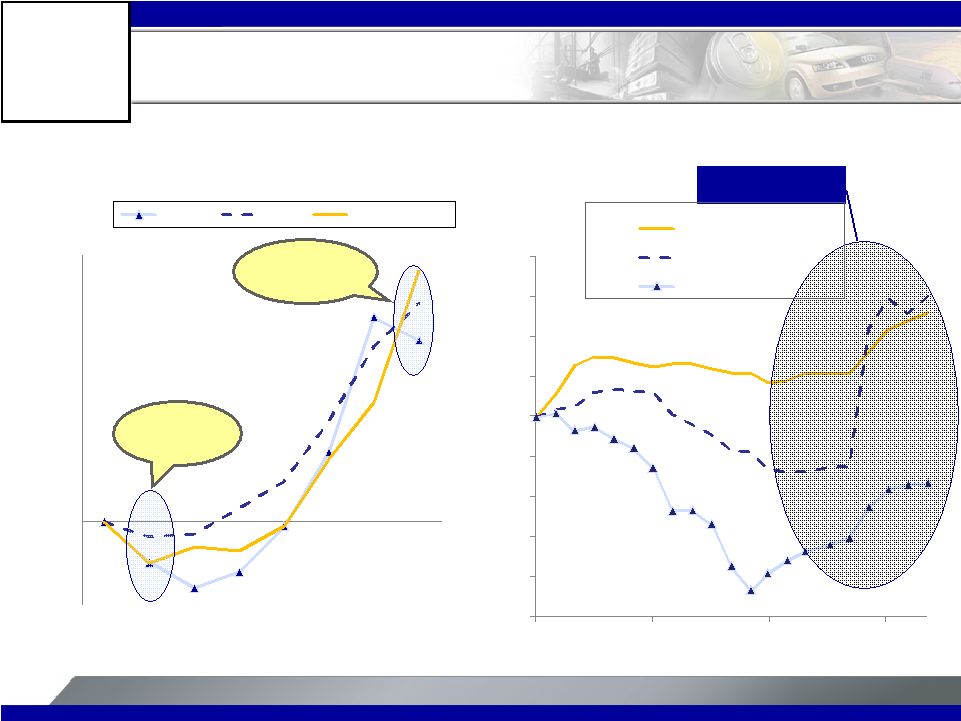   28 Alcoa Logo 0% 20% 40% 60% 80% 100% 120% 140% 160% 180% Jan-08 Jul-08 Jan-09 Jul-09 Midwest Japan Europe (50) 0 50 100 150 Jan Feb Mar Apr May Jun July Aug Europe Japan United States Thin Supply Chain, Rising Shipments Driving Premiums Regional Premiums Beginning to Improve Source: Aluminum Association Source: Metal Bulletin, Platts 2009 YTD Change +30% +114% +209% 2009 Cumulative Change in Shipments Cumulative Shipments KMT February Bottom Shipments +14% |
 29 Alcoa Logo Procurement Efficiencies – Cost savings by 2010 Overhead Rationalizations – Cost savings by 2010 CapEx Reductions – Annual CapEx post 2009 Working Capital Initiatives – Cash Impact 2009 Asset Dispositions – Net proceeds Dividend Reduction – Annual cash savings Equity and Equity-Linked Financings – Gross proceeds Holistic Alcoa Approach: Improved Cost Structure and Balance Sheet $2,000M $400M $850M $800M Demonstrating Solid Execution of Holistic Approach $1,100M $430M $1,400M Operational Financial |
 30 Alcoa Logo Overcoming Headwinds to Exceed Procurement Target Procurement Efficiencies: Reduction Targets 2009E (millions) Reduction Targets by Spend Category Savings 2010E 15% 7% 6% 21% 34% 29% 5% 18% 2% 5% 4% 6% 2% 4% Strategic Raw Materials - Alumina and Primary Metals Strategic Raw Materials - Flat-Rolled Products Indirect - Services Indirect - Maintenance Repair & Overhaul Non-Smelter Energy Transportation Business Unit Metals $1,610 $1,500 $2,000 2009 YTD 2009 Savings Target vs. 2008 2010 Savings Target vs. 2008 107% of 2009 target |
 31 Alcoa Logo $375 $200 $400 2009 YTD 2009 Savings Target vs. 2008 2010 Savings Target vs. 2008 Achieved 94% of 2010 Overhead Reduction Target Overhead includes SG&A, R&D and Plant Administrative Expenses; excludes divestitures Overhead Rationalization: Reduction Targets and Savings $400M (millions) Overhead Savings Target Savings 188% of 2009 target 94% of 2010 target 100% 80% 2008 A 2010 Target |
 32 Alcoa Logo Year-to-date 2009 Capital Expenditures of $1.3 Billion -48% -53% Capital Expenditure Reduction: Annual CapEx ($ millions) $1,800 $3,438 $541 $850 2008 2009E 2010E |
 33 Alcoa Logo 100% 72% Dec-08 Dec-09 Target Working Capital Days Reduction Targets -28% 2009 YTD Working Capital Change ($ millions) $800M decrease in working capital in 2009 Working Capital Initiatives: Targets and Year-to-date Results Working Capital Savings Despite Increases in LME 98% of 2009 target $1,053 $780 $800 $463 ($736) Inventory Receivables Accounts Payable 2009 YTD Cash Generation 2009 Target |
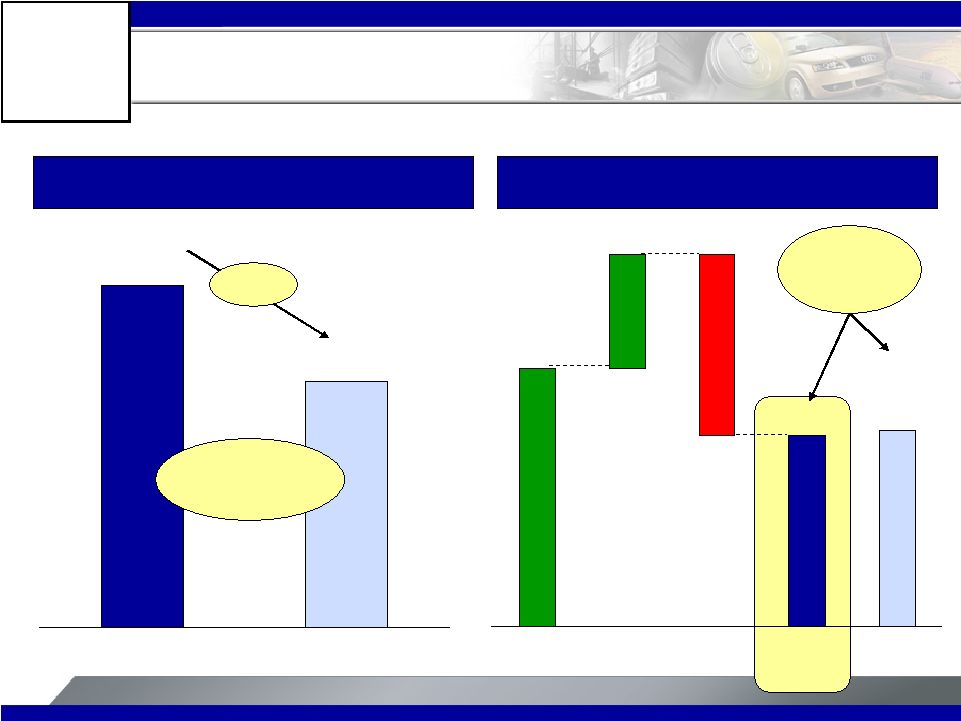
 34 Alcoa Logo Strengthening Our Upstream Position In the Downturn Juruti Mine and Alumar Refinery Expansion Commissioned in Q3’09 Alcoa share of capex $1.2 billion 2.6 MMT of production; opportunities to expand as demand grows Low-cost bauxite to serve Alcoa refineries in Brazil and beyond Alcoa share of capex $1.0 billion 2.1 MMT expansion; 1.1 MMT Alcoa share Expansion capacity in first quintile of cost curve Juruti Alumar Combined investment of $2.2 billion places Alcoa Refining in the first quartile Railroad Washing Plant Ship loader Benchmark in Sustainable Development Strengthened Refining Position in Brazil Alumina Silo Cogeneration Calciners |
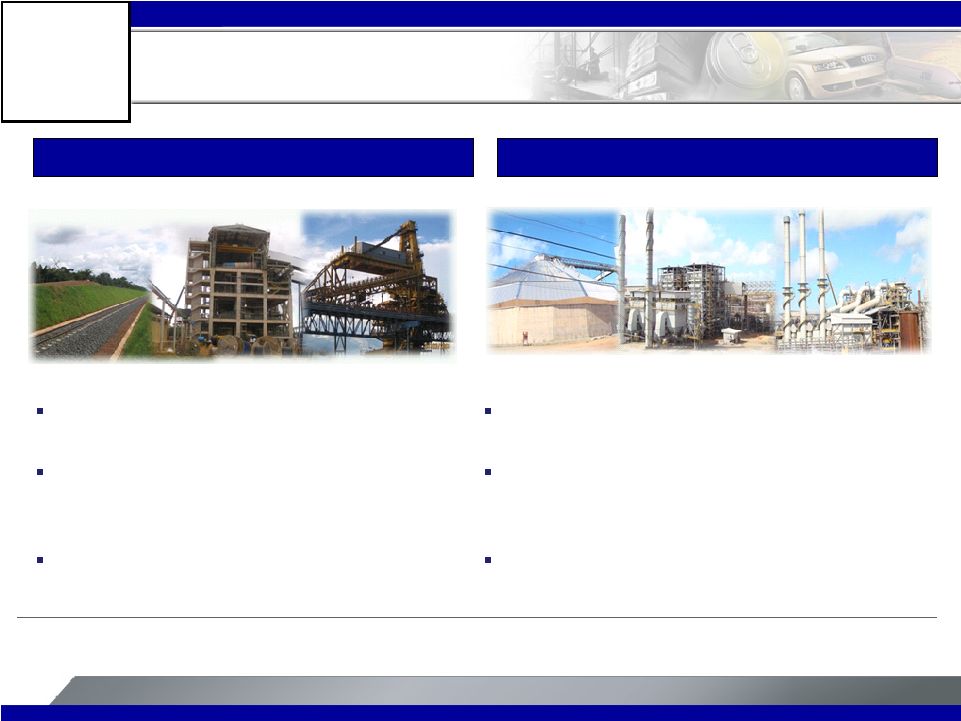
 35 Alcoa Logo Alcoa Bohai Facility Alcoa Bohai Operations Launched in Q3’09 Strong footing to serve Chinese domestic market for lithographic, transportation, electronic and packaging markets World’s most sophisticated lithographic line will help replace most imported lithographic sheet Combines strong regional partnerships, leading-edge technology and Alcoa know how Alcoa Bohai Well Positioned to Serve Chinese Markets Lithographic Transportation Packaging Electronics |
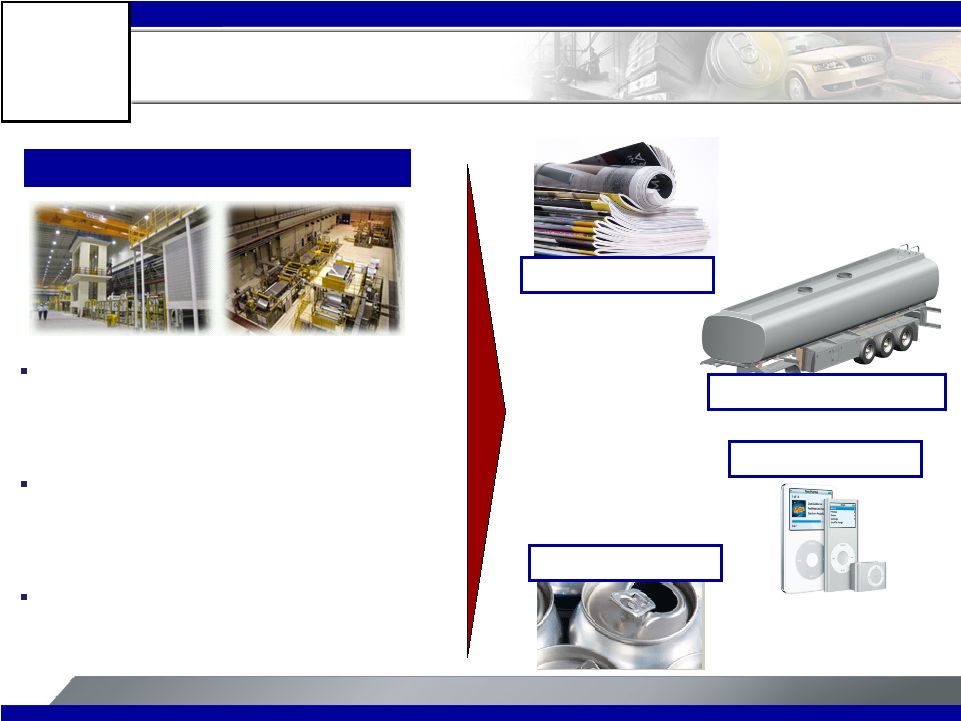
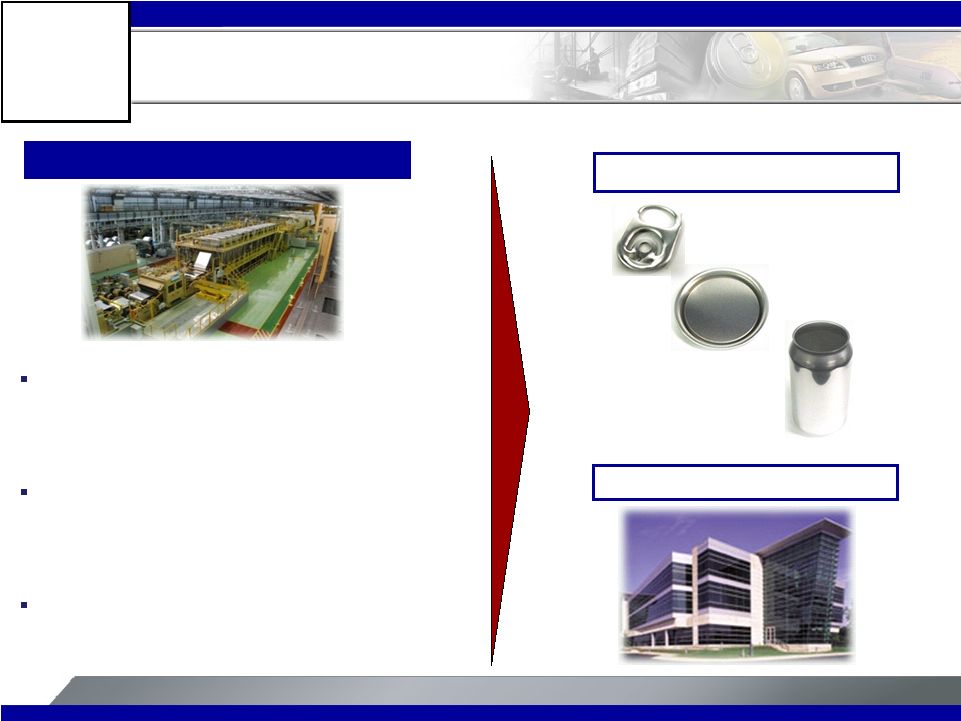 36 Alcoa Logo Samara Coating Line Alcoa Samara Coating Line Commissioned in Q2’09 State-of-the-art coating line serving Russian and European packaging and building & construction markets Only domestic can sheet producer in Russia capable of supplying full range of body, end and tab products New line raises Alcoa to the worldwide leadership position in all aspects of can material production Russian Coating Line Makes Alcoa the Can Leader Consumer Packaging Building & Construction Tab Stock EndStock Body Stock |
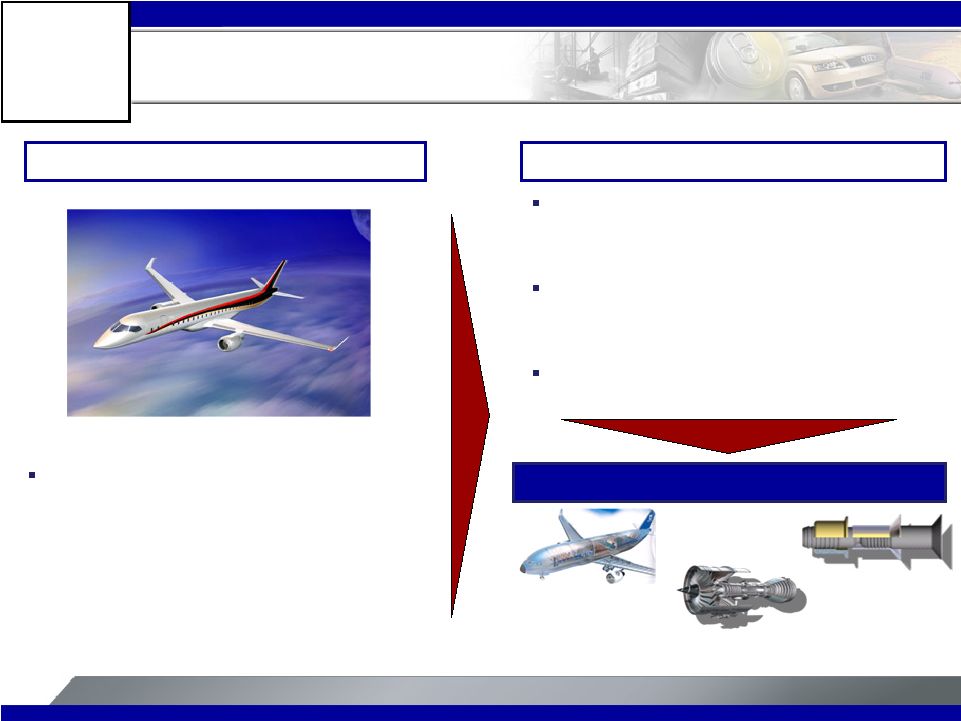 37 Alcoa Logo Mitsubishi Regional Jet Japan's first wholly built commercial aircraft in more than 45 years – Initial Design: Composite wings – Sept’09 Redesign: Aluminum wings Aluminum is a superior solution for the transportation sector Nearly 100 years of proven structural performance Unparalleled strength, weight and cost characteristics Equal fuel efficiency to composites at lower cost across multiple platforms Aluminum in Aerospace Aluminum is The Material of Choice in Aerospace Alcoa Aerospace #1 in Advanced Structures #1 in Fasteners #1 in Power and Propulsion |
 38 Alcoa Logo Strengthening Our Position As Industry Stabilizes Aluminum Fundamentals Alcoa Strengthening in the Downturn Demand Improving Supply / Demand Balance LME Stocks Stabilizing Markets Stabilizing Procurement Overhead Capex Working Capital 107% of Target 188% of Target On Target 98% of Target Juruti Alumar Bohai Samara |
 39 Alcoa Logo Matthew E. Garth Director, Investor Relations Alcoa 390 Park Avenue New York, NY 10022-4608 Telephone: (212) 836-2674 www.alcoa.com For Additional Information, Contact: |
 Alcoa Logo 40 |
 41 Alcoa Logo Effective Tax Rate Effective tax rate, excluding discrete tax items is a non-GAAP financial measure. Management believes that the Effective tax rate, excluding discrete tax items is meaningful to investors because it provides a view of Alcoa’s operational tax rate. $ Millions 1Q’09 2Q’09 3Q’09 YTD 2009 Income (loss) from continuing operations before taxes on income ($777) ($425) $98 ($1,104) Provision (benefit) for taxes on income ($307) ($108) ($22) ($437) Effective tax rate 39.5% 25.4% (22.4%) 39.6% Discrete tax provisions (benefits): Tax rate changes ($28) ($28) After tax restructuring items ($11) ($8) ($19) Subtotal - Discrete tax provisions (benefits) ($39) $0 ($8) ($47) Provision (benefit) for taxes on income excluding discrete tax provisions (benefits) ($268) ($108) ($14) ($390) Effective tax rate excluding discrete tax provisions (benefits) 34.5% 25.4% (14.3%) 35.3% Charge (benefit) for adjustments to year-to-date effective tax rate N/A $25 ($48) ($23) |
 42 Alcoa Logo Reconciliation of ATOI to Consolidated Net Income (Loss) Attributable to Alcoa (in millions) 1Q08 2Q08 3Q08 4Q08 2008 1Q0 9 2Q09 3Q09 Total segment ATOI $ 668 $ 838 $ 665 $ 28 $ 2,199 $ (143) $ (132) $ 142 Unallocated amounts (net of tax): Impact of LIFO (31) (44) (5) 73 (7 ) 29 39 80 Interest income 9 12 10 4 35 1 8 (1) Interest expense (64) (57) (63) (81 ) (265 ) (74 ) (75 ) (78 ) Noncontrolling interests (1) (67) (70) (84) – (221 ) (10 ) 5 (47) Corporate expense (82) (91) (77) (78) (32 8) (71) (70) (71) Restructuring and other charges (30) (1) (25 ) (637) (693) (46) (56) (3) Discontinued operations 4 (7) (38 ) (26 2) (303) (17 ) (142) 4 Other (104 ) (34 ) (115 ) (2 38) (491 ) (16 6) (3 1) 51 Consolidated net income (loss) attributable to Alcoa $ 303 $ 546 $ 268 $ (1,191) $ (74) $ (497 ) $ (454 ) $ 77 (1) On January 1, 2009, Alcoa adopted changes issued by the Financial Accounting Standards Board to consolidation accounting and reporting. These changes, among others, require that minority interests be renamed noncontrolling interests for all periods presented. Prior period information was reclassified to reflect the movement of the Electrical and Electronic Solutions business to discontinued operations in the fourth quarter of 2008. |
 43 Alcoa Logo Reconciliation of Adjusted Income (Loss) (in millions, except per share amounts) (Loss) Income (Loss) Earnings per Diluted Share Quarter ended Nine months ended Quarter ended Nine months ended June 30, 2009 September 30, 2009 September 30, 2008* September 30, 2009 June 30, 2009 September 30, 2009 September 30, 2008* September 30, 2009 Net (loss) income attributable to Alcoa $ (454) $ 77 $ 1,117 $ (874) $ (0.47) $ 0.08 $ 1.35 $ (0.95) (Loss) income from discontinued operations (142) 4 (41) (155) (Loss) income from continuing operations attributable to Alcoa (312) 73 1,158 (719) (0.32) 0.07 1.40 (0.78) Restructuring and other charges 56 1 55 103 Other special items** – (35) 19 (78) (Loss) income from continuing operations attributable to Alcoa – as adjusted $ (256) $ 39 $ 1,232 $ (694) (0.26) 0.04 1.49 (0.75) (Loss) income from continuing operations attributable to Alcoa – as adjusted is a non-GAAP financial measure. Management believes that this measure is meaningful to investors because management reviews the operating results of Alcoa excluding the impacts of restructuring and other charges and other special items. There can be no assurances that additional restructuring and other charges and other special items will not occur in future periods. To compensate for this limitation, management believes that it is appropriate to consider both (Loss) income from continuing operations attributable to Alcoa determined under GAAP as well as (Loss) income from continuing operations attributable to Alcoa – as adjusted. * Financial information for the nine months ended September 30, 2008 was reclassified to reflect the movement of the Electrical and Electronic Solutions business to discontinued operations in the fourth quarter of 2008. Earnings per diluted share for the nine months ended September 30, 2008 were also revised to reflect Alcoa’s adoption of changes issued by the Financial Accounting Standards Board to the calculation of earnings per share effective January 1, 2009. ** Other special items include the following: a gain on an acquisition in Suriname for the quarter ended September 30, 2009; the previously mentioned item for the quarter ended September 30, 2009, a gain on the Elkem/SAPA swap (-$133), a loss on the sale of Shining Prospect ($118), and a discrete income tax benefit related to a tax law change in Canada (-$28) for the nine months ended September 30, 2009; and a net discrete income tax charge related to the sale of the Packaging and Consumer businesses for the nine months ended September 30, 2008. |
 44 Alcoa Logo Reconciliation of Free Cash Flow (in millions) Quarter ended September 30, 2008 December 31, 2008 March 31, 2009 June 30, 2009 September 30, 2009 Cash from operations $ (93) $ 608 $ (271) $ 328 $ 184 Total capital expenditures (877) (1,017) (471) (418) (370) Free cash flow $ (970) $ (409) $ (742) $ (90) $ (186) Free Cash Flow is a non-GAAP financial measure. Management believes that this measure is meaningful to investors because management reviews cash flows generated from operations after taking into consideration capital expenditures due to the fact that these expenditures are considered necessary to maintain and expand Alcoa’s asset base and are expected to generate future cash flows from operations. It is important to note that Free Cash Flow does not represent the residual cash flow available for discretionary expenditures since other non-discretionary expenditures, such as mandatory debt service requirements, are not deducted from the measure. |
 45 Alcoa Logo Reconciliation of EBITDA (in millions) Earnings before interest, taxes, depreciation, and amortization (EBITDA) Quarter ended June 30, 2009 September 30, 2009 Change (Loss) income from continuing operations $ (317) $ 120 $ 437 Benefit for income taxes (108) (22) 86 Other income, net (89) (123) (34) Interest expense 115 120 5 Restructuring and other charges 82 17 (65) Net margin (317) 112 429 Provision for depreciation, depletion, and amortization 317 342 25 EBITDA $ – $ 454 $ 454 Alcoa’s definition of EBITDA is net margin plus depreciation, depletion, and amortization. Net margin is equivalent to Sales minus the following items: Cost of goods sold; Selling, general administrative, and other expenses; Research and development expenses; and Provision for depreciation, depletion, amortization. EBITDA is a non-GAAP financial measure. Management believes that this measure is meaningful to investors because EBITDA provides additional information with respect to Alcoa’s operating performance and the Company’s ability to meet its financial obligations. . |