 4th Quarter Earnings Conference 1 January 9, 2014 [Alcoa logo] [Alcoa logo] Exhibit 99.2 |
 Cautionary Statement 2 o[Alcoa logo] Forward-Looking Statements This presentation contains statements that relate to future events and expectations and as such constitute forward-looking statements. Forward-looking statements include those containing such words as “anticipates,” “estimates,” “expects,” “forecasts,” “intends,” “outlook,” “plans,” “projects,” “should,” “targets,” “will,” or other words of similar meaning. All statements that reflect Alcoa’s expectations, assumptions, or projections about the future other than statements of historical fact are forward-looking statements, including, without limitation, forecasts concerning global demand growth for aluminum, end-market conditions, supply/demand balances, and growth opportunities for aluminum in automotive, aerospace and other applications, trend projections, targeted financial results or operating performance, and statements about Alcoa’s strategies, outlook, and business and financial prospects. Forward-looking statements are subject to a number of known and unknown risks, uncertainties, and other factors and are not guarantees of future performance. Important factors that could cause actual results to differ materially from those in the forward-looking statements include: (a) material adverse changes in aluminum industry conditions, including global supply and demand conditions and fluctuations in London Metal Exchange-based prices and premiums, as applicable for primary aluminum, alumina, and other products, and fluctuations in indexed-based and spot prices for alumina; (b) deterioration in global economic and financial market conditions generally; (c) unfavorable changes in the markets served by Alcoa, including automotive and commercial transportation, aerospace, building and construction, distribution, packaging, defense, and industrial gas turbine; (d) the impact of changes in foreign currency exchange rates on costs and results, particularly the Australian dollar, Brazilian real, Canadian dollar, euro, and Norwegian kroner; (e) increases in energy costs, including electricity, natural gas, and fuel oil, or the unavailability or interruption of energy supplies; (f) increases in the costs of other raw materials, including calcined petroleum coke, caustic soda, and liquid pitch; (g) Alcoa’s inability to achieve the level of revenue growth, cash generation, cost savings, improvement in profitability and margins, fiscal discipline, or strengthening of competitiveness and operations (including moving its alumina refining and aluminum smelting businesses down on the industry cost curves and increasing revenues in its Global Rolled Products and Engineered Products and Solutions segments) anticipated from its restructuring programs and productivity improvement, cash sustainability, and other initiatives; (h) Alcoa's inability to realize expected benefits, in each case as planned and by targeted dates, from sales of non-core assets, or from newly constructed, expanded, or acquired facilities, including facilities supplying auto sheet capacity or aluminum-lithium capacity, or from international joint ventures, including the joint venture in Saudi Arabia; (i) political, economic, and regulatory risks in the countries in which Alcoa operates or sells products, including unfavorable changes in laws and governmental policies, civil unrest, or other events beyond Alcoa’s control; (j) the outcome of contingencies, including legal proceedings, government investigations, and environmental remediation; (k) the business or financial condition of key customers, suppliers, and business partners; (l) adverse changes in tax rates or benefits; (m) adverse changes in discount rates or investment returns on pension assets; (n) the impact of cyber attacks and potential information technology or data security breaches; and (o) the other risk factors summarized in Alcoa's Form 10-K for the year ended December 31, 2012 and other reports filed with the Securities and Exchange Commission. Alcoa disclaims any obligation to update publicly any forward-looking statements, whether in response to new information, future events or otherwise, except as required by applicable law. Non-GAAP Financial Measures Some of the information included in this presentation is derived from Alcoa’s consolidated financial information but is not presented in Alcoa’s financial statements prepared in accordance with U.S. generally accepted accounting principles (GAAP). Certain of these data are considered “non-GAAP financial measures” under SEC rules. These non-GAAP financial measures supplement our GAAP disclosures and should not be considered an alternative to the GAAP measure. Reconciliations to the most directly comparable GAAP financial measures and management’s rationale for the use of the non-GAAP financial measures can be found in the Appendix to this presentation and on our website at www.alcoa.com under the “Invest” section. Any reference during the discussion today to EBITDA means adjusted EBITDA, for which we have provided calculations and reconciliations in the Appendix and on our website. |
 Putting Legacy Matters behind us, continuing Transformation Non-cash Goodwill write-down ($1.7B) for legacy acquisitions in smelting Discrete Tax items ($361M) Legacy Legal Matter ($243M) Capital projects write-off ($13M) Putting Legacy Matters behind us Building out Value-Add Businesses & Lowering cost base of our Commodity Businesses Today: Value-add businesses account for 57% of revenues and 80% of segment profits Record Downstream results (record 4th quarter; ATOI up 20% YOY) Lower cost position Upstream and nine consecutive quarters of improved performance Improved Productivity across all segments (2013 $1.1B); Record Days Working Capital (4 days lower = $240M) Strengthening Balance Sheet ($1.4B cash on hand; $8.3B debt; $6.9B net debt, lowest year-end level since 2006) Investing in the Future (e.g. Automotive, Saudi Arabia JV, Al Lithium) Annual Earnings increased (excluding special items) despite lower metal prices Repositioning the Company in the face of Headwinds 3 o[Alcoa logo] th |
 William Oplinger Executive Vice President and Chief Financial Officer 4 January 9, 2014 [Alcoa logo] [Alcoa logo] |
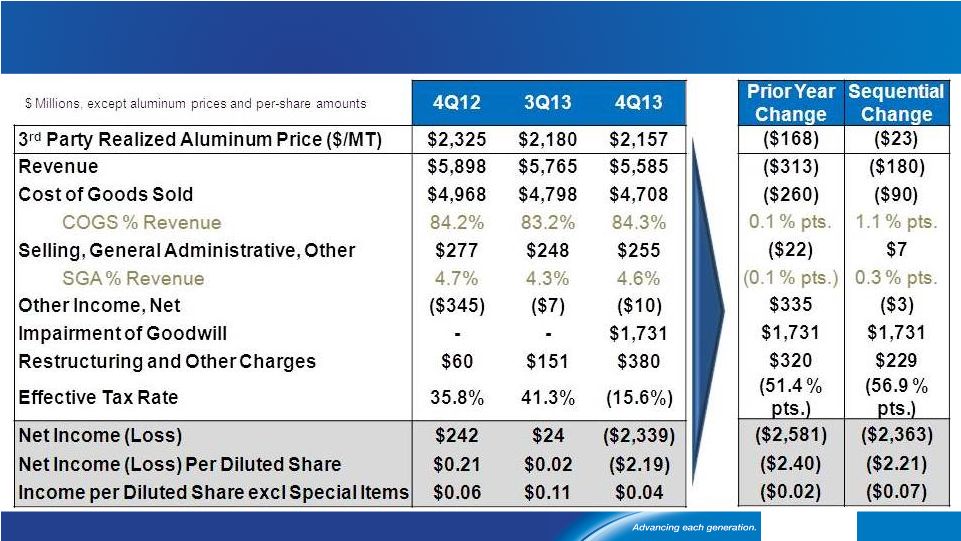 Income Statement Summary See appendix for Adjusted Income reconciliation 5 o[Alcoa logo] |
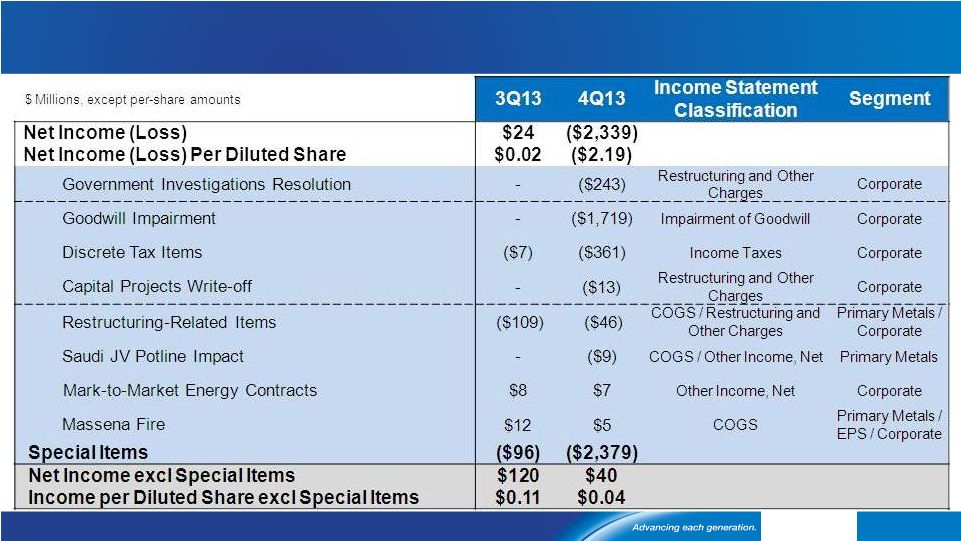 6 See appendix for Adjusted Income reconciliation Special Items o[Alcoa logo] |
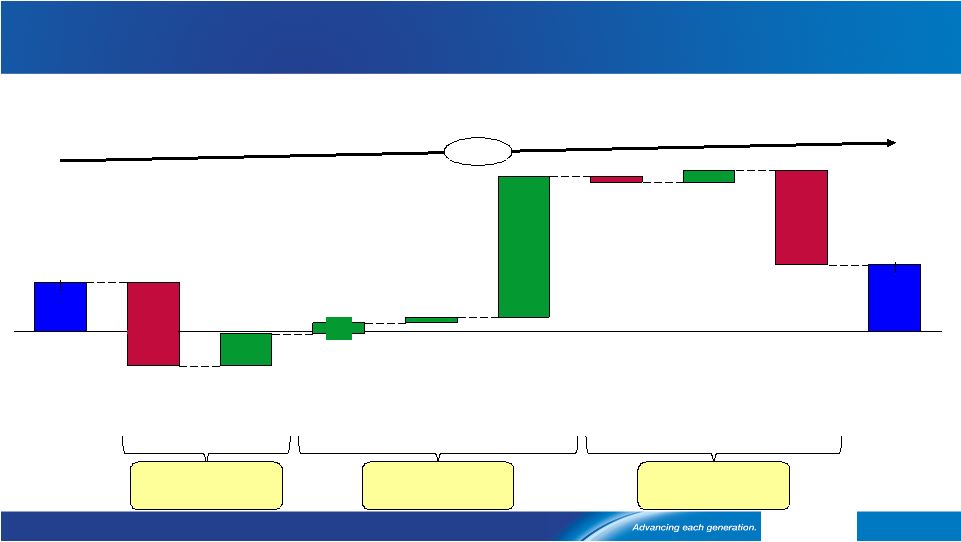
 Market, volume, and cost headwinds lower earnings sequentially 7 See appendix for Adjusted Income reconciliation Net Income excluding Special Items ($ Millions) Market -$26 Performance -$6 Cost Headwinds -$48 40 120 Currency 4 30 3Q 13 4Q 13 Cost Increases / Other 38 Raw Materials 3 Energy 13 Productivity 36 Price / Mix 10 Volume 32 LME o[Alcoa logo] |
 See appendix for Free Cash Flow and Days Working Capital reconciliations 4 th Quarter Cash Flow Overview 8 o[Alcoa logo] ($ Millions) 4Q12 3Q13 4Q13 Net Income (Loss) $257 $44 ($2,310) DD&A $363 $348 $350 Change in Working Capital $536 ($61) $522 Pension Contributions ($46) ($173) ($108) Taxes / Other Adjustments ($177) $56 $2,466 Cash from Operations $933 $214 $920 Dividends to Shareholders ($33) ($33) ($33) Change in Debt ($692) ($5) ($14) Contributions (Distributions) to Noncontrolling Interest $15 ($53) ($29) Other Financing Activities ($2) ($2) $11 Cash from Financing Activities ($712) ($93) ($65) Capital Expenditures ($398) ($250) ($422) Other Investing Activities $605 ($54) ($3) Cash from Investing Activities $207 ($304) ($425) 4Q13 FCF $498 million $1.4 billion of cash 4 Day DWC reduction vs. 4Q 2012 4 th Quarter 2013 Cash Flow Overview |
 Engineered Products & Solutions year-over-year ATOI increase of 20% Any reference in our presentations to EBITDA means adjusted EBITDA, for which we have provided calculations and reconciliations in the appendix. See appendix for Adjusted EBITDA reconciliation. * Prior period amounts have been revised to conform to the current period presentation. See appendix for additional information. 9 o[Alcoa logo] $ Millions Revenue up 4% year-over-year driven by strong share gains across all markets Record 4Q ATOI and EBITDA margin 4Q EBITDA margin at 20.3%,up 2.3 percentage points year-over-year Quarterly ATOI up 20% year-over-year to $168M driven by productivity and volume Days working capital improved 3 days year-over-year Aerospace strong, impacted by lower U.S. Defense spare parts demand Gradual recovery in N.A. Non-Residential Construction continues; European market decline is slowing Stronger N.A. Heavy Duty Truck build rates offset by Europe Softening Global Industrial Gas Turbine market Productivity improvements continue ATOI expected to be up 8%-10% sequentially $ Millions 4Q 12 3Q 13 4Q 13 3 rd Party Revenue 1,348 1,437 1,405 ATOI* 140 192 168 EBITDA Margin* 18.0% 22.5% 20.3% 4 th Quarter Results 4 th Quarter Business Highlights 1 st Quarter Outlook 4 th Quarter Performance Bridge $168 4Q 13 -$5 Volume -$6 Productivity $12 3Q 13 -$25 $192 Cost Increase Price / Mix 4Q13 Actual and 1Q14 Outlook - EPS |
 See appendix for Adjusted EBITDA reconciliation. * Prior period amounts have been revised to conform to the current period presentation. See appendix for additional information. Unfavorable volume and cost impact Global Rolled Products results 10 o[Alcoa logo] |
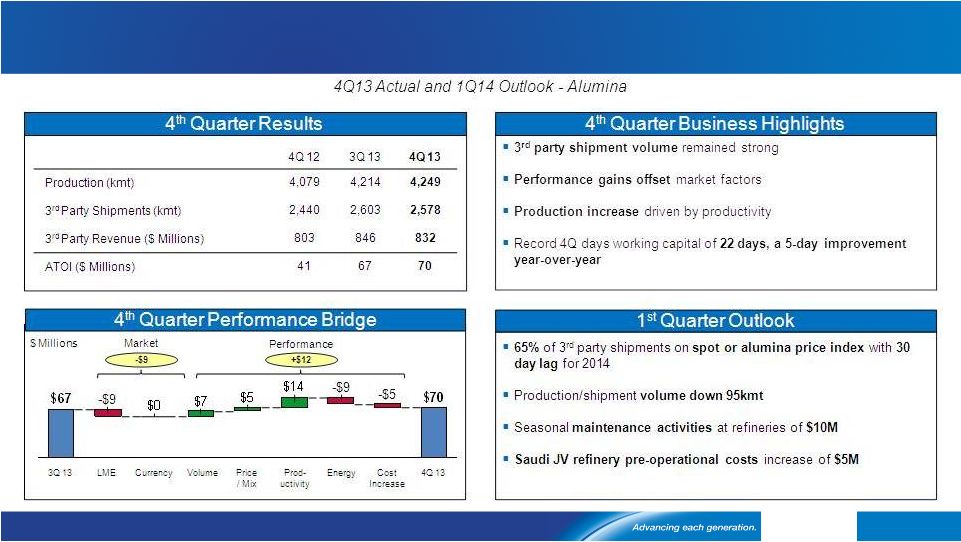 Strong Alumina performance offsets negative market impacts 11 o[Alcoa logo] |
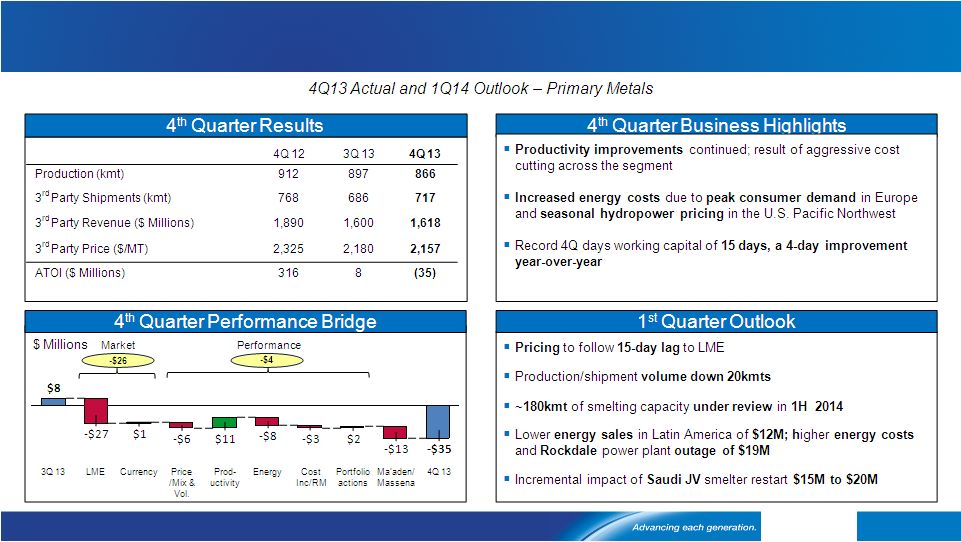 Continued Primary productivity gains offset sequential cost increases 12 o[Alcoa logo] |
 Robust demand continues, regional premiums responding 13 o[Alcoa logo] |
 2013 Full Year Results 14 o[Alcoa logo] |
 Earnings rise 36% year-over-year despite $273M of market headwinds 15 See appendix for Adjusted Income reconciliation Net Income excluding Special Items ($ Millions) Market -$273 Performance +$842 Cost Headwinds -$474 357 262 Price / Mix 32 Volume 57 Currency 172 LME 445 2012 2013 Cost Increases / Other 507 Raw Materials 62 Energy 29 Productivity +36% 753 o[Alcoa logo] |
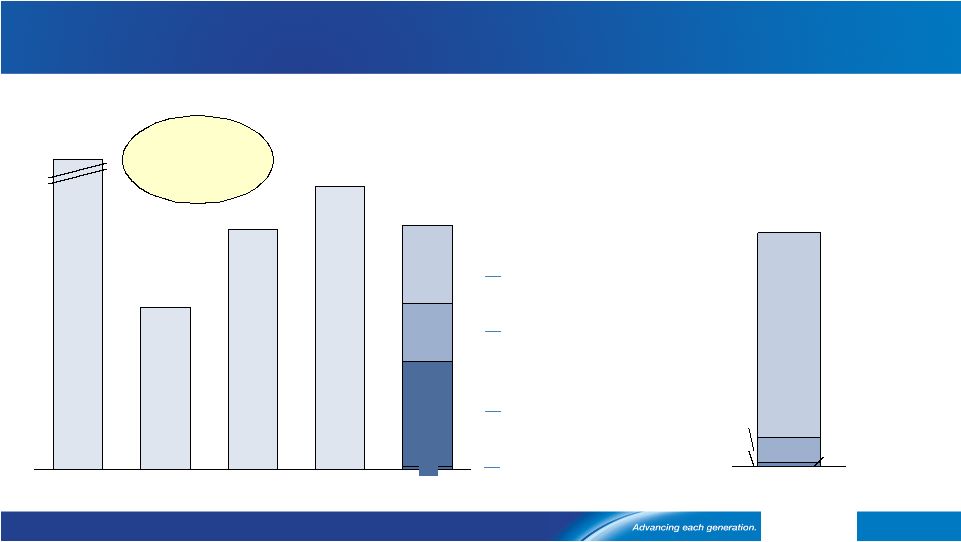 Continued strong productivity; $1.1 billion captured in 2013 GPP: Combined Alumina and Primary Metals segments; GRP: Global Rolled Products; EPS: Engineered Products and Solutions *All figures are pretax and pre-minority interest. 2009/2010 represent net productivity; 2011-2013 represent gross productivity 16 268 356 742 2009 2,410 2013 1,117 12 481 2012 1,291 2011 1,099 2010 Year-over-year productivity* savings, $M and 2013 ideas by category EPS (32%) GRP (24%) GPP (43%) Other (1%) Over $6.6B of productivity in 2009-2013 10,700 Asset Mgmt Growth Productivity 12,200 200 1,300 Current number of ideas in the system o[Alcoa logo] |
 Achieved record low Days Working Capital See appendix for days working capital reconciliation 17 o[Alcoa logo] |
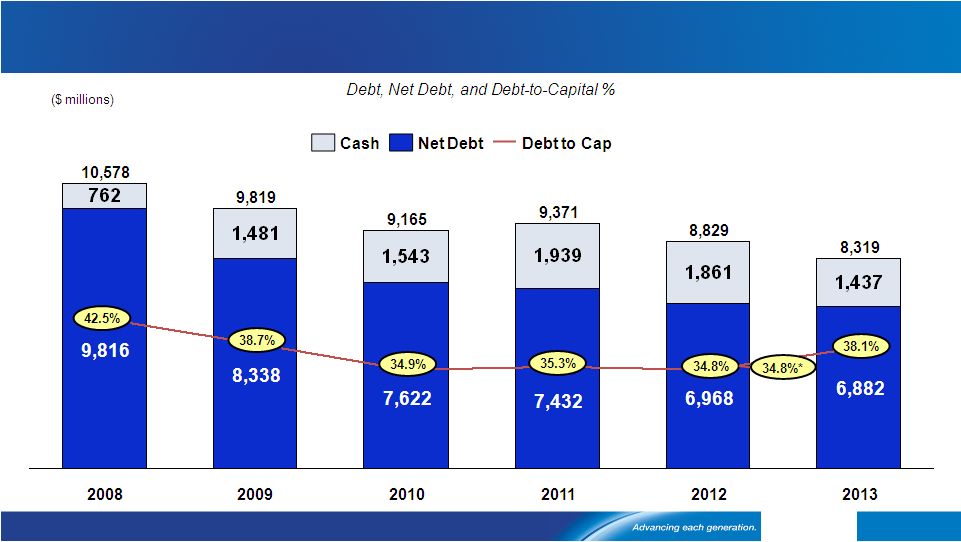 Strengthened our balance sheet; lowest year-end net debt since 2006 See appendix for Net Debt-to-Capital reconciliation * Excludes goodwill impairment and deferred tax valuation allowances recorded in fourth quarter 2013 18 o[Alcoa logo] |
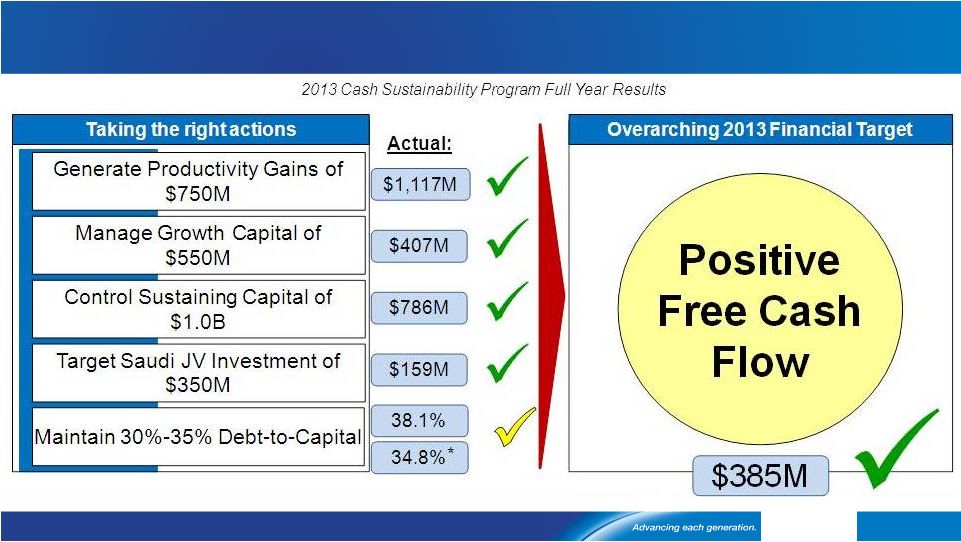 Executed against targets to achieve Positive FCF in a tough environment *Excludes goodwill impairment and deferred tax valuation allowances recorded in fourth quarter 2013 19 o[Alcoa logo] |
 2014 annual financial targets The right actions drive growth and operational performance in 2014 Deliver Operational Performance Drive Productivity Gains of $850M Process productivity Procurement savings Overhead cost reductions Invest in the Future; Actively Manage the Base Build Value-Add with Growth Capital of $500M Invest in Saudi JV of $125M Manage Sustaining Capital of $750M Strengthen the Balance Sheet Generate Positive Free Cash Flow Attain 30%-35% Debt-to-Capital 20 o[Alcoa logo] |
 Klaus Kleinfeld Chairman and Chief Executive Officer 21 January 9, 2014 [Alcoa logo] [Alcoa logo] |
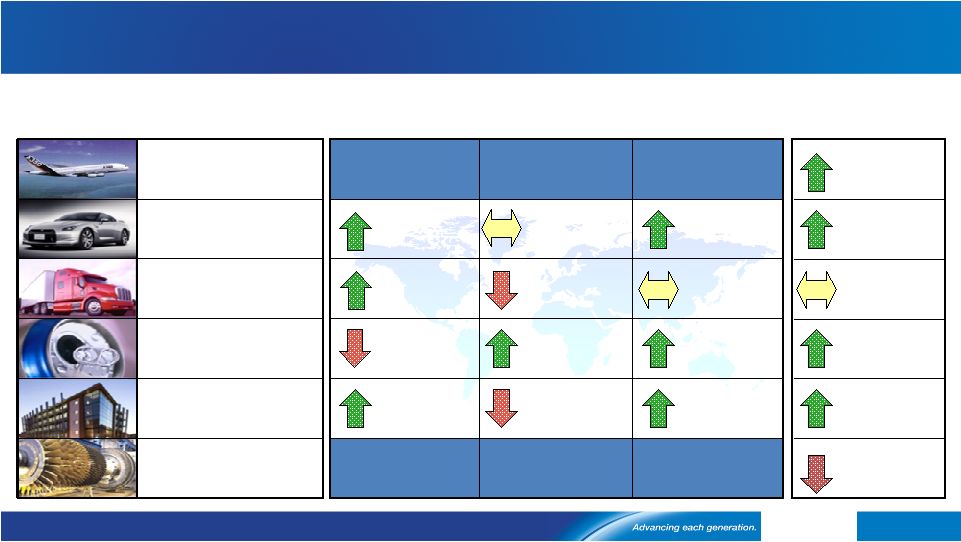 Source: Alcoa analysis North America China Global Europe 7% to 8% sales growth 2% to 3% sales growth 4% to 6% sales growth 8% to 12% airfoil market decline 6% to 10% prod growth 8% to 12% sales growth 7% to 9% sales growth 2% to 3% sales growth 2% to 3% sales decline -1% to 3% prod flat/growth 6% to 10% prod decline 2% to 5% prod growth 1% to 2% sales decline Aerospace Automotive Heavy Truck & Trailer Beverage Can Packaging Commercial Building and Construction Industrial Gas Turbine 1% to 5% prod growth -1% to 3% prod flat/growth 3% to 4% sales growth 1% to 4% prod growth -1% to 3% prod flat/growth 2014 Market Conditions Alcoa End Markets: Current Assessment of 2014 vs. 2013 22 o[Alcoa logo] |
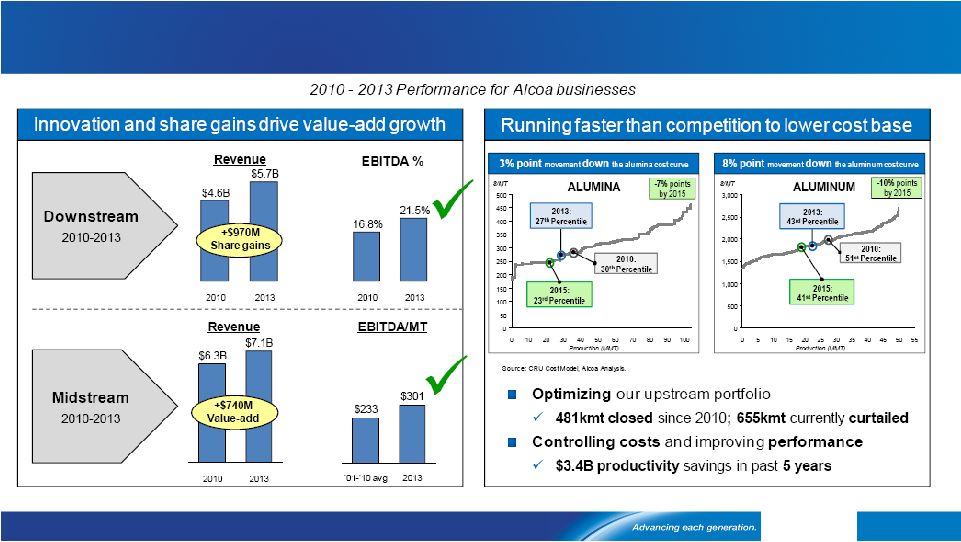 Repositioning working: Growing value-add and lowering cost base CRU Cost Model, Alcoa Analysis. Any reference in our presentations to EBITDA means adjusted EBITDA, for which we have provided calculations and reconciliations in the appendix 23 o[Alcoa logo] |
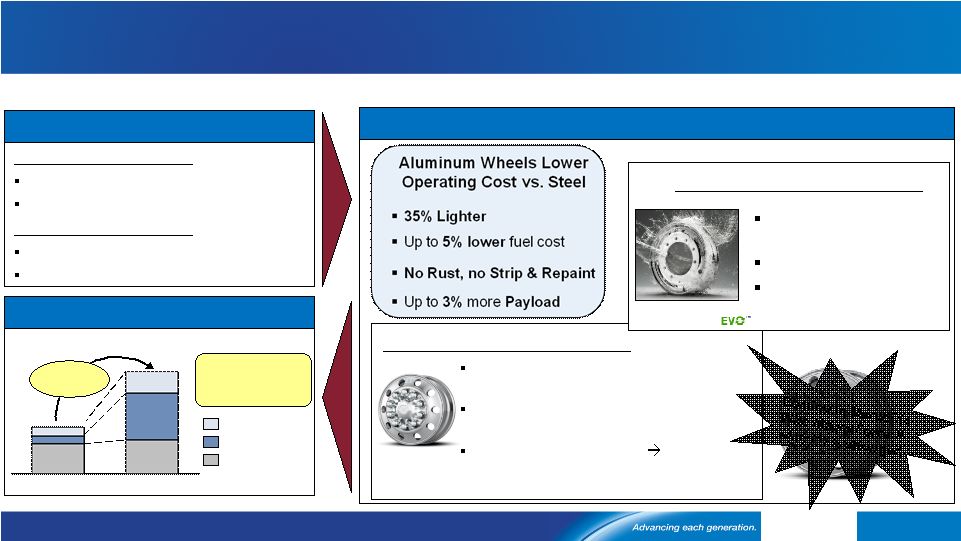   Trucking Industry Needs… …and Drives Growth for Alcoa wheels No Mechanical or Chemical Cleaning Corrosion Resistant Looks New Longer 58% 73% Aluminum wheel innovation meets industry needs and drives value-add growth Alcoa solutions for improved truck fuel efficiency and lowered maintenance cost drive Wheels sales growth Regulatory Requirements (1) 20% Fuel Efficiency Improvement 20% Lower Greenhouse Gas Emissions Improved Competiveness Operating Cost Reduction Payload Increase Alcoa wheel sales and growth (%) LvL ONE ® - Introduced in 2009 Light Weight & Flexible: LvL ONE ® Low Maintenance: Dura-Bright ® Lightest Wheel at 45 lbs (41% lighter than steel; 8% lighter than avg. Al) 6X Brighter than even aluminum competition Two sided polished finish Allows use on truck and trailer; reduces number of spare parts …Alcoa Technology Offers Solutions… Dura-Bright ® Oct’13: 10X Improved Corrosion Other LvL ONE® Dura-Bright® 22% CAGR 2009 2013 67% of sales are driven by proprietary technology (1) Greenhouse Gas Emissions and Fuel Efficiency Standards for Medium and Heavy Duty Engines and Vehicles - 2014 to 2018 24 o[Alcoa logo] |
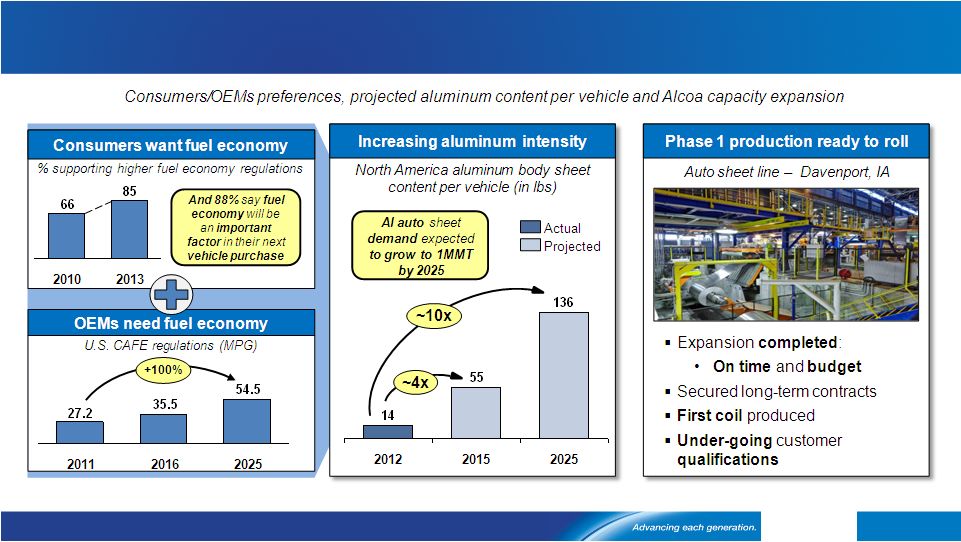 Capitalizing on historic Auto industry shift to lightweight vehicles Sources: Consumer Federation of America (CFA) survey April 2013; Ducker Worldwide CAFE = Corporate Average Fuel Economy 25 o[Alcoa logo] |
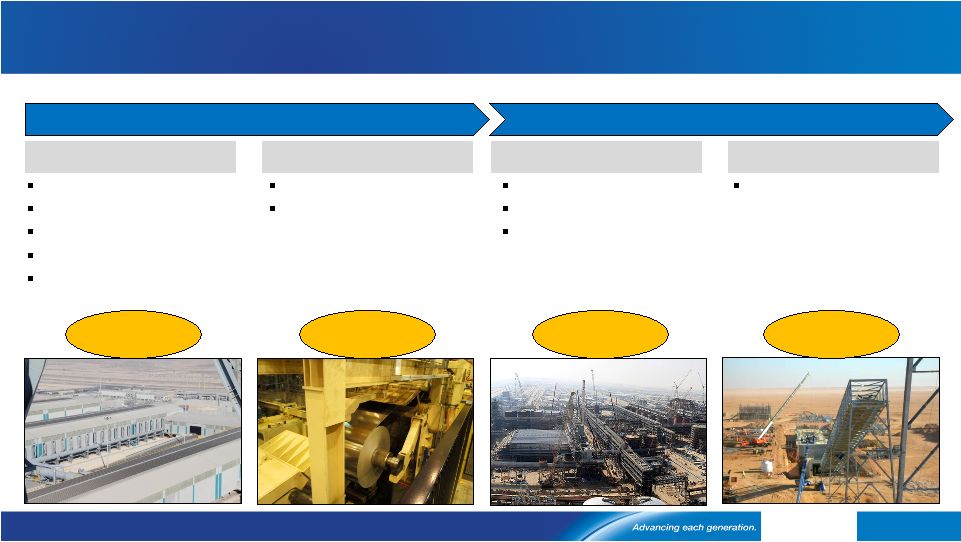 Smelter Rolling Mill Mine Refinery Phase 1 Phase 2 Saudi Arabia JV construction progressing as planned; world’s lowest cost 77% complete 190kmt production in 2013 550kmt production in 2014 At full capacity in 2014 Lowest cost smelter 2% point reduction on the smelting cost curve First hot coil in 4Q 2013 First auto coil in 4Q 2014 First alumina 4Q 2014 Lowest cost refinery 2% point reduction on the refining cost curve On track to provide bauxite in 2014 93% complete Saudi Arabia JV construction update 100% complete 52% complete 26 o[Alcoa logo] |
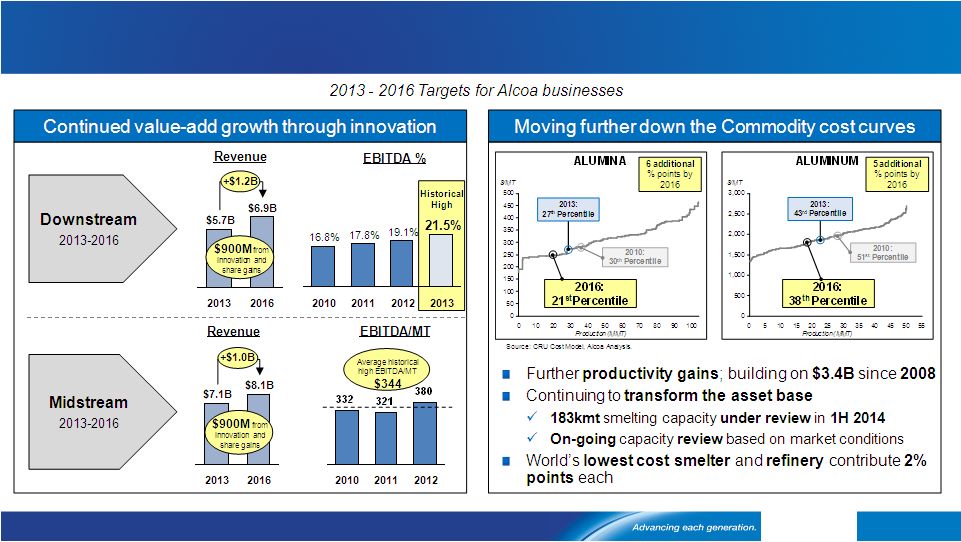 Repositioning accelerates with new three-year targets CRU Cost Model, Alcoa Analysis. Any reference in our presentations to EBITDA means adjusted EBITDA, for which we have provided calculations and reconciliations in the appendix 27 o[Alcoa logo] |
 2014 annual financial targets The right actions drive growth and operational performance in 2014 Deliver Operational Performance Drive Productivity Gains of $850M Process productivity Procurement savings Overhead cost reductions Invest in the Future; Actively Manage the Base Build Value-Add with Growth Capital of $500M Invest in Saudi JV of $125M Manage Sustaining Capital of $750M Strengthen the Balance Sheet Generate Positive Free Cash Flow Attain 30%-35% Debt-to-Capital 28 o[Alcoa logo] |
 Repositioning gaining traction and creating value for the future Alcoa Advantage and Disciplined Execution drive profitable growth in 2014 Building out the value-add businesses while lowering cost base in the commodity businesses Putting legacy matters behind us 29 o[Alcoa logo] |
 o[Alcoa logo] |
 Kelly Pasterick Director, Investor Relations Alcoa 390 Park Avenue New York, NY 10022-4608 Telephone: (212) 836-2674 www.alcoa.com Additional Information 31 o[Alcoa logo] |
 Annual Sensitivity Summary Currency Annual Net Income Sensitivity +/- $100/MT = +/- $240 million LME Aluminum Annual Net Income Sensitivity Australian $ +/- $11 million per 0.01 change in USD / AUD Brazilian $ +/- $ 3 million per 0.01 change in BRL / USD Euro € +/- $ 2 million per 0.01 change in USD / EUR Canadian $ +/- $ 5 million per 0.01 change in CAD / USD Norwegian Kroner +/- $ 5 million per 0.10 change in NOK / USD 32 o[Alcoa logo] |
 Revenue Change by Market 33 0% 1% (7%) (6%) (8%) 1% (14%) 13% (2%) 1% 4% 6% 2% 12% (13%) (8%) (9%) (17%) 4% (14%) 18% 3% 6% 6% 7% 2% 12% 2% 15% 29% Aerospace Automotive B&C Comm. Transport Industrial Products IGT Packaging Distribution/Other Alumina Primary Metals 4Q’13 Third-Party Revenue Sequential Change Year-Over-Year Change o[Alcoa logo] |
 Reconciliation of ATOI to Consolidated Net Income (Loss) Attributable to Alcoa 34 (in millions) 4Q12 2012 1Q13 2Q13 3Q13 4Q13 2013 Total segment ATOI* $ 574 $ 1,357 $ 351 $ 304 $ 338 $ 224 $ 1,217 Unallocated amounts (net of tax): Impact of LIFO 8 20 (2) 5 9 40 52 Interest expense (78) (319) (75) (76) (70) (73) (294) Noncontrolling interests (15) 29 (21) 29 (20) (29) (41) Corporate expense (87) (282) (67) (71) (74) (72) (284) Impairment of goodwill – – – – – (1,731) (1,731) Restructuring and other charges (56) (75) (5) (211) (108) (283) (607) Other* (104) (539) (32) (99) (51) (415) (597) Consolidated net income (loss) attributable to Alcoa $ 242 $ 191 $ 149 $ (119) $ 24 $ (2,339) $ (2,285) * On January 1, 2013, management revised the inventory-costing method used by certain locations within the Global Rolled Products and Engineered Products and Solutions segments, which affects the determination of the respective segment’s profitability measure, ATOI. Management made the change in order to improve internal consistency and enhance industry comparability. This revision does not impact the consolidated results of Alcoa. Segment information for all prior periods presented was revised to reflect this change. o[Alcoa logo] |
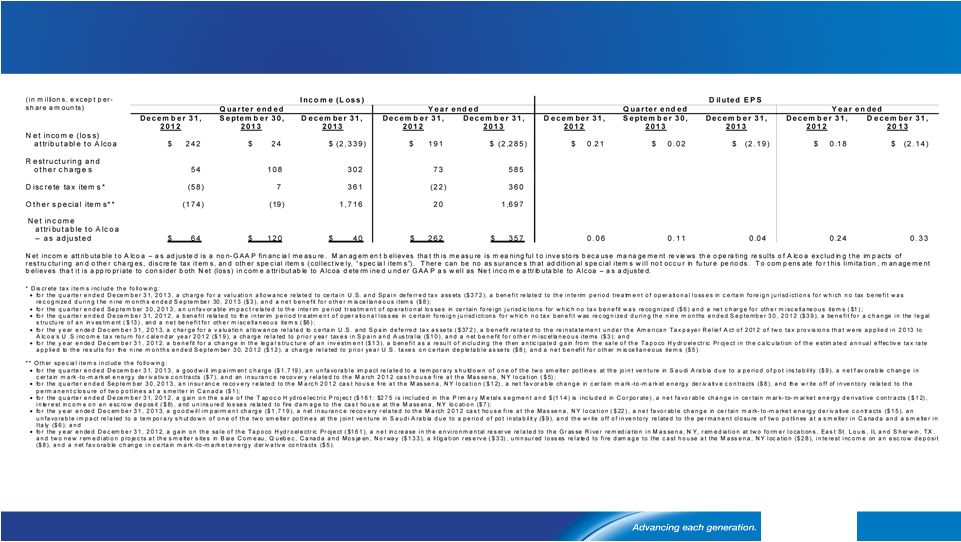 Reconciliation of Adjusted Income 35 o[Alcoa logo] |
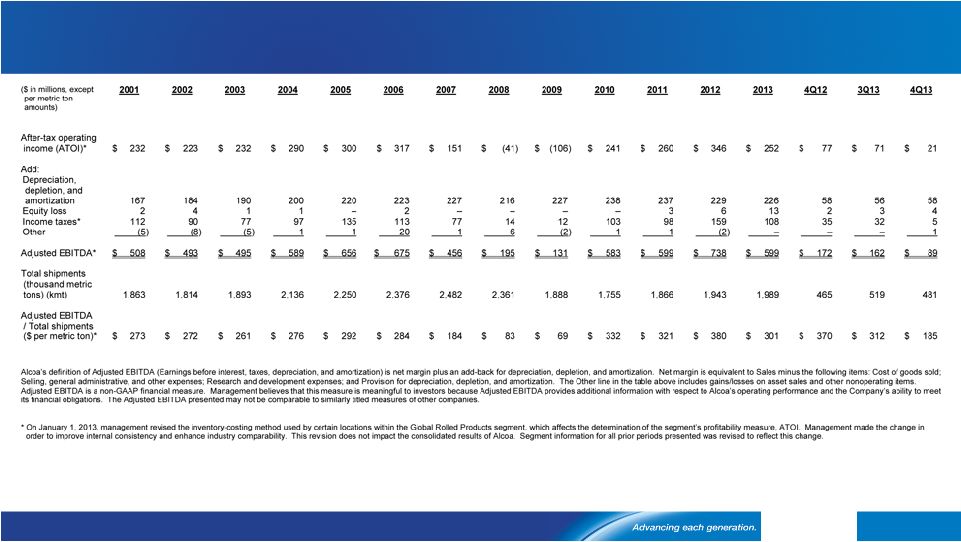
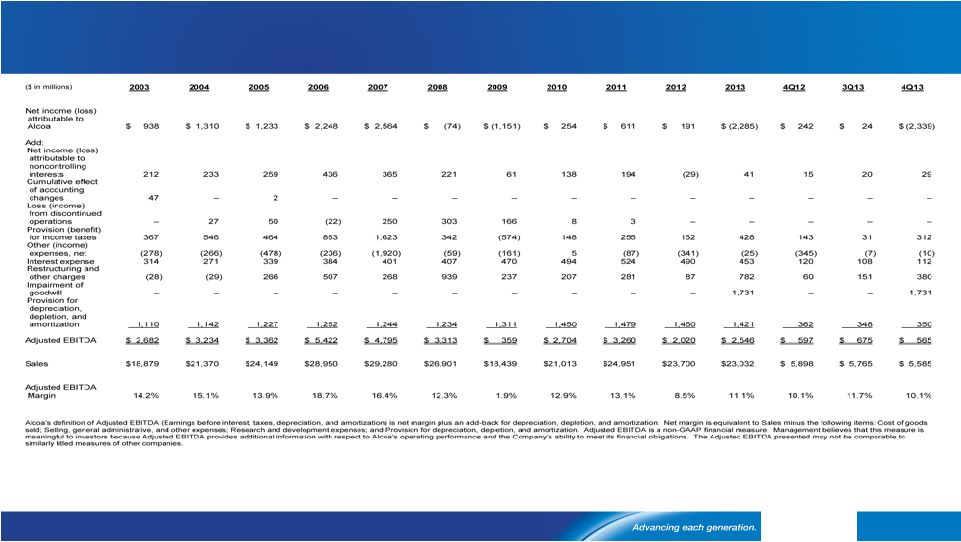 Reconciliation of Alcoa Adjusted EBITDA o[Alcoa logo] |
 Reconciliation of Alumina Adjusted EBITDA 37 o[Alcoa logo] |
 Reconciliation of Primary Metals Adjusted EBITDA 38 o[Alcoa logo] |
 Reconciliation of Global Rolled Products Adjusted EBITDA 39 o[Alcoa logo] |
 Reconciliation of Engineered Products and Solutions Adjusted EBITDA 40 ($ in millions) 2003 2004 2005 2006 2007 2008 2009 2010 2011 2012 2013 4Q12 3Q13 4Q13 After-tax operating income (ATOI)* $ 126 $ 161 $ 276 $ 382 $ 423 $ 522 $ 311 $ 419 $ 537 $ 612 $ 726 $ 140 $ 192 $ 168 Add: Depreciation, depletion, and amortization 166 168 160 152 163 165 177 154 158 158 159 40 40 40 Equity loss (income) – – – 6 – – (2) (2) (1) – – – – – Income taxes* 57 70 120 164 184 215 138 198 258 297 348 71 91 79 Other* 11 106 (11) (2) (7) 2 1 – (1) (9) (2) (9) – (2) Adjusted EBITDA* $ 360 $ 505 $ 545 $ 702 $ 763 $ 904 $ 625 $ 769 $ 951 $ 1,058 $ 1,231 $ 242 $ 323 $ 285 Third-party sales $ 3,905 $ 4,283 $ 4,773 $ 5,428 $ 5,834 $ 6,199 $ 4,689 $ 4,584 $ 5,345 $ 5,525 $ 5,733 $ 1,348 $ 1,437 $ 1,405 Adjusted EBITDA Margin* 9.2% 11.8% 11.4% 12.9% 13.1% 14.6% 13.3% 16.8% 17.8% 19.1% 21.5% 18.0% 22.5% 20.3% Alcoa’s definition of Adjusted EBITDA (Earnings before interest, taxes, depreciation, and amortization) is net margin plus an add-back for depreciation, depletion, and amortization. Net margin is equivalent to Sales minus the following items: Cost of goods sold; Selling, general administrative, and other expenses; Research and development expenses; and Provision for depreciation, depletion, and amortization. The Other line in the table above includes gains/losses on asset sales and other nonoperating items. Adjusted EBITDA is a non-GAAP financial measure. Management believes that this measure is meaningful to investors because Adjusted EBITDA provides additional information with respect to Alcoa’s operating performance and the Company’s ability to meet its financial obligations. The Adjusted EBITDA presented may not be comparable to similarly titled measures of other companies. * On January 1, 2013, management revised the inventory-costing method used by certain locations within the Engineered Products and Solutions segment, which affects the determination of the segment’s profitability measure, ATOI. Management made the change in order to improve internal consistency and enhance industry comparability. This revision does not impact the consolidated results of Alcoa. Segment information for all prior periods presented was revised to reflect this change. o[Alcoa logo] |
 Reconciliation of Free Cash Flow 41 o[Alcoa logo] |
 Reconciliation of Free Cash Flow, con’t 42 o[Alcoa logo] |
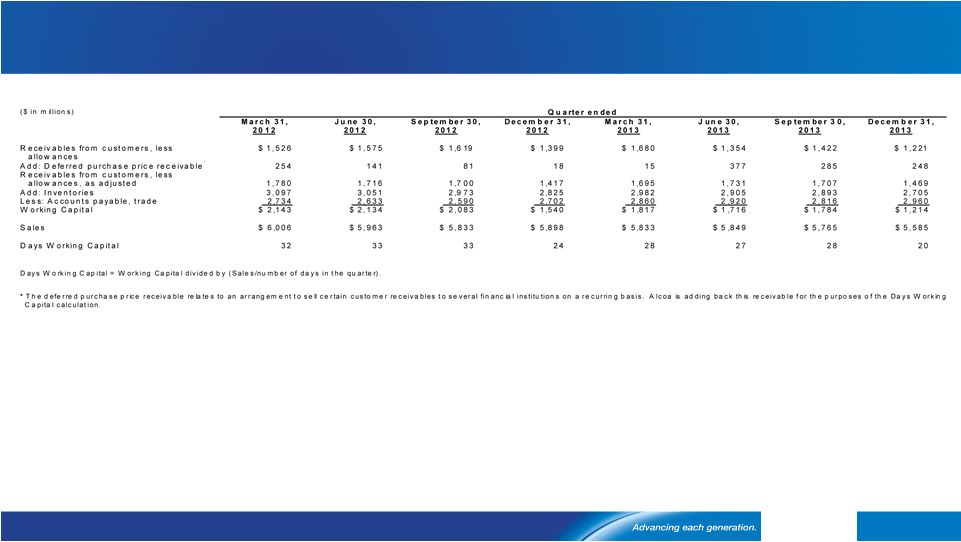 Days Working Capital 43 o[Alcoa logo] |
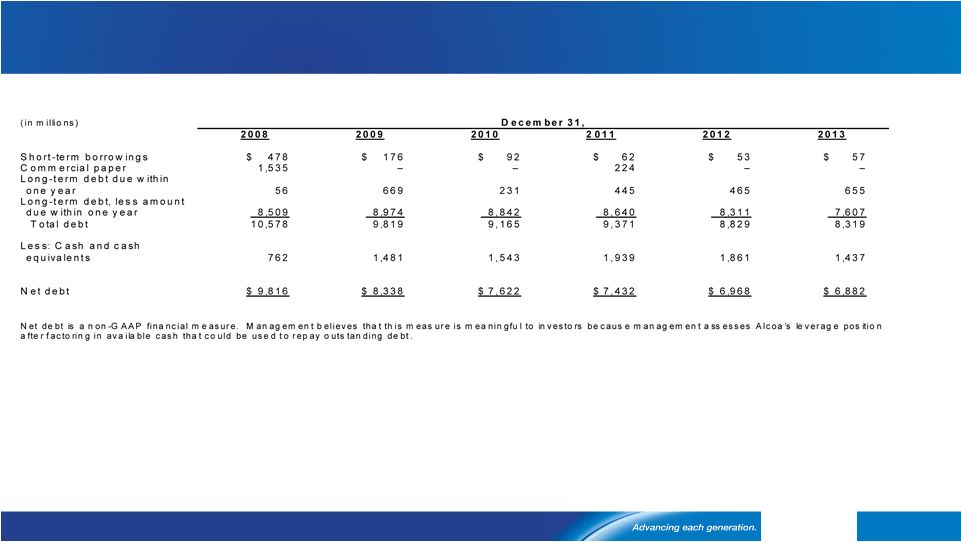 Reconciliation of Net Debt 44 o[Alcoa logo] |
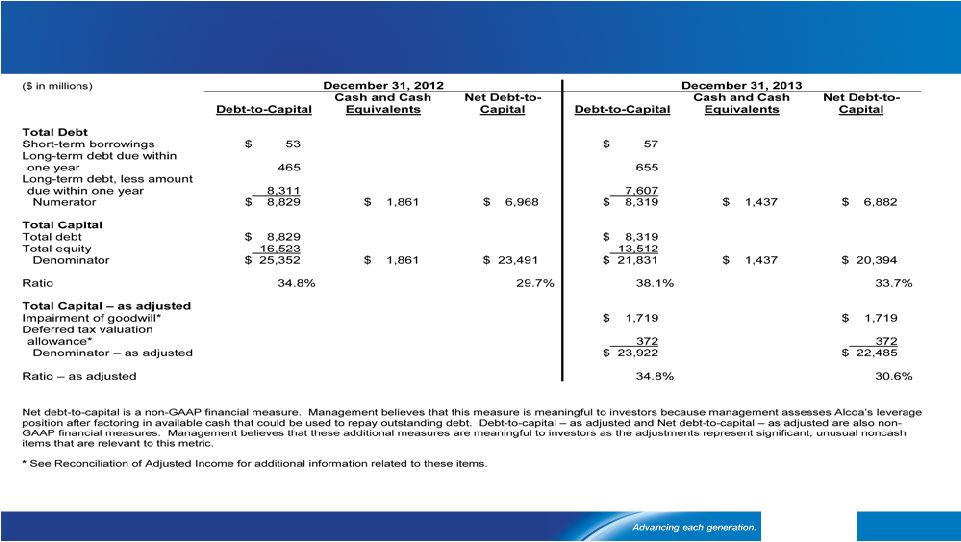 Reconciliation of Debt-to-Capital 45 o[Alcoa logo] |
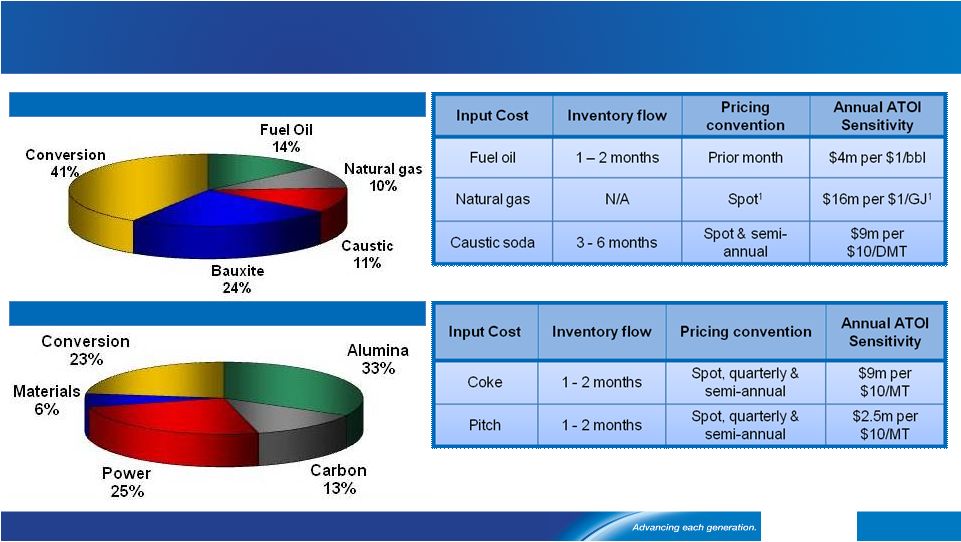 Composition of Upstream Production Costs Refining Cost Structure Smelting Cost Structure 1 Natural gas information corresponds to Point Comfort, as Australia is priced on a rolling 16 quarter average 46 o[Alcoa logo] |
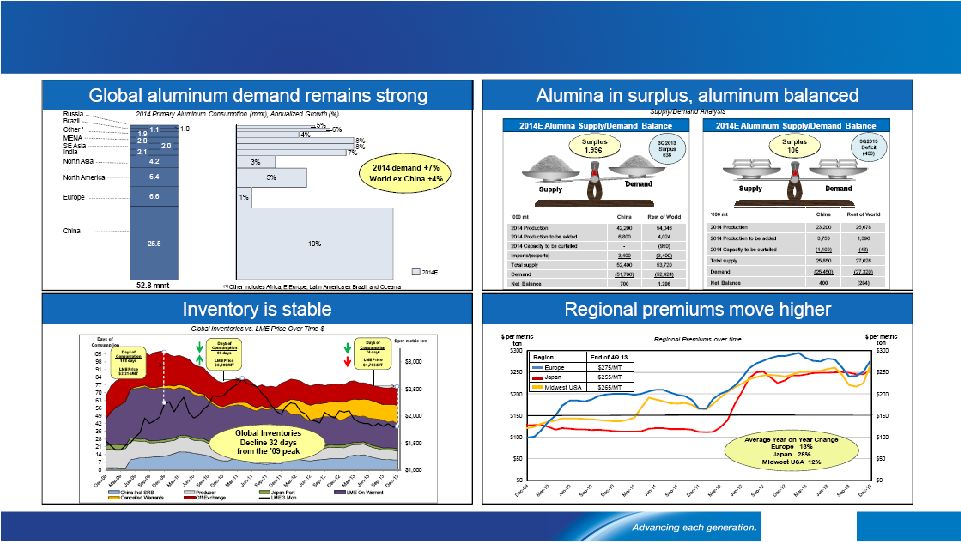
 1.0 6.6 25.5 6.4 4.2 2.1 2.0 2.0 1.1 10% 1% 5% 3% 7% 8% 8% 4% 5% 6% 2014E 52.8 mmt (1) Other includes Africa, E.Europe, Latin America ex Brazil, and Oceania 2014 Primary Aluminum Consumption (mmt), Annualized Growth (%) China Europe North America North Asia India SE Asia MENA Russia Brazil Other ¹ 1.9 Source: Alcoa estimates, Brook Hunt, CRU, Harbor 2014 global aluminum demand growth outlook remains strong 2014 demand +7% World ex China +4% 47 o[Alcoa logo] |
 48 Source: Alcoa analysis, Brook Hunt, CRU, CNIA, NBS, Chinese Customs Alumina moves to surplus in 2014; aluminum market balanced o[Alcoa logo] |
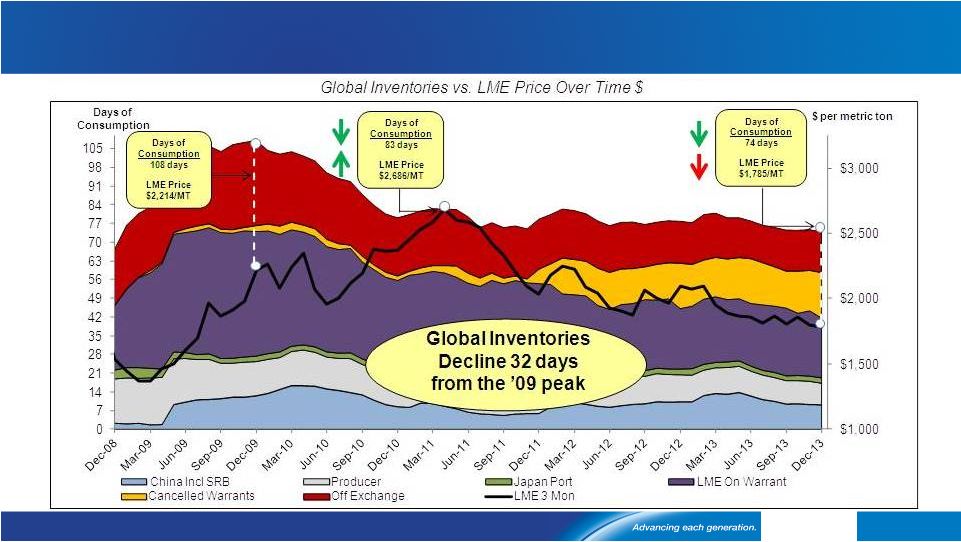 Inventory is stable with LME cancelled warrants rising 49 o[Alcoa logo] |
 Regional premiums move higher 50 Source: Monthly average of daily prices - Platts Metals Week o[Alcoa logo] |