![]() 1st Quarter Earnings Conference 1 April 8, 2014 [Alcoa logo] Exhibit 99.2 |
![]() Cautionary Statement 2 o[Alcoa logo] This presentation contains statements that relate to future events and expectations and as such constitute forward-looking statements. Forward-looking statements include those containing such words as “anticipates,” “estimates,” “expects,” “forecasts,” “intends,” “outlook,” “plans,” “projects,” “should,” “targets,” “will,” or other words of similar meaning. All statements that reflect Alcoa’s expectations, assumptions, or projections about the future other than statements of historical fact are forward-looking statements, including, without limitation, forecasts concerning global demand growth for aluminum, end-market conditions, supply/demand balances, and growth opportunities for aluminum in automotive, aerospace and other applications, trend projections, targeted financial results or operating performance, and statements about Alcoa’s strategies, outlook, and business and financial prospects. Forward-looking statements are subject to a number of known and unknown risks, uncertainties, and other factors and are not guarantees of future performance. Important factors that could cause actual results to differ materially from those in the forward-looking statements include: (a) material adverse changes in aluminum industry conditions, including global supply and demand conditions and fluctuations in London Metal Exchange-based prices and premiums, as applicable, for primary aluminum, alumina, and other products, and fluctuations in indexed-based and spot prices for alumina; (b) deterioration in global economic and financial market conditions generally; (c) unfavorable changes in the markets served by Alcoa, including automotive and commercial transportation, aerospace, building and construction, packaging, defense, and industrial gas turbine; (d) the impact of changes in foreign currency exchange rates on costs and results, particularly the Australian dollar, Brazilian real, Canadian dollar, euro, and Norwegian kroner; (e) increases in energy costs, including electricity, natural gas, and fuel oil, or the unavailability or interruption of energy supplies; (f) increases in the costs of other raw materials, including calcined petroleum coke, caustic soda, and liquid pitch; (g) Alcoa’s inability to achieve the level of revenue growth, cash generation, cost savings, improvement in profitability and margins, fiscal discipline, or strengthening of competitiveness and operations (including moving its alumina refining and aluminum smelting businesses down on the industry cost curves and increasing revenues and improving margins in its Global Rolled Products and Engineered Products and Solutions segments) anticipated from its restructuring programs and productivity improvement, cash sustainability, and other initiatives; (h) Alcoa's inability to realize expected benefits, in each case as planned and by targeted completion dates, from sales of non-core assets, or from newly constructed, expanded, or acquired facilities, including facilities supplying auto sheet capacity or aluminum-lithium capacity, or from international joint ventures, including the joint venture in Saudi Arabia; (i) political, economic, and regulatory risks in the countries in which Alcoa operates or sells products, including unfavorable changes in laws and governmental policies, civil unrest, imposition of sanctions, expropriation of assets, or other events beyond Alcoa’s control; (j) the outcome of contingencies, including legal proceedings, government investigations, and environmental remediation; (k) the business or financial condition of key customers, suppliers, and business partners; (l) adverse changes in tax rates or benefits; (m) adverse changes in discount rates or investment returns on pension assets; (n) the impact of cyber attacks and potential information technology or data security breaches; and (o) the impact of union disputes, strikes or work stoppages; and (p) the other risk factors summarized in Alcoa's Form 10-K for the year ended December 31, 2013 and other reports filed with the Securities and Exchange Commission. Alcoa disclaims any obligation to update publicly any forward-looking statements, whether in response to new information, future events or otherwise, except as required by applicable law. Forward-Looking Statements Non-GAAP Financial Measures Some of the information included in this presentation is derived from Alcoa’s consolidated financial information but is not presented in Alcoa’s financial statements prepared in accordance with accounting principles generally accepted in the United States of America (GAAP). Certain of these data are considered “non-GAAP financial measures” under SEC rules. These non- GAAP financial measures supplement our GAAP disclosures and should not be considered an alternative to the GAAP measure. Reconciliations to the most directly comparable GAAP financial measures and management’s rationale for the use of the non-GAAP financial measures can be found in the Appendix to this presentation and on our website at www.alcoa.com under the “Invest” section. Any reference during the discussion today to EBITDA means adjusted EBITDA, for which we have provided calculations and reconciliations in the Appendix and on our website. |
![]() 3 Solid results in the first quarter – Transformation accelerates 1) Excludes gain from sale of Suriname gold mine interest o[Alcoa logo] Strong Operational Performance Strong earnings (excluding special items) increase sequentially – Downstream: Record performance - ATOI up 9% YoY – Midstream: Earnings rebound - ATOI nearly triples QoQ; record auto revenue – Upstream: Improved performance - 10 consecutive quarters ; highest Alumina 1Q ATOI 1 since 2011 Productivity: $250 million across all segments YoY 1Q 2014 Overview Accelerating Portfolio Transformation Commissioned $300 million Davenport automotive expansion Investing $40 million in value-add specialty packaging facility in Brazil Expanding proprietary wheel facility in Hungary Announced ~$300 million after -tax restructuring Australia, U.S. and Brazil smelting capacity totaling 421 kmt; can sheet rolling capacity of 200 kmt |
![]() William Oplinger Executive Vice President and Chief Financial Officer 4 April 8, 2014 [Alcoa logo] |
![]() Income Statement Summary 5 See appendix for Adjusted Income reconciliation o[Alcoa logo] $ Millions, except aluminum prices and per-share amounts 1Q13 4Q13 1Q14 Prior Year Change Sequential Change Realized Aluminum Price ($/MT) $2,398 $2,157 $2,205 ($193) $48 Revenue $5,833 $5,585 $5,454 ($379) ($131) Cost of Goods Sold $4,847 $4,708 $4,495 ($352) ($213) COGS % Revenue 83.1% 84.3% 82.4% (0.7% pts) (1.9 % pts.) Selling, General Administrative, Other $251 $255 $236 ($15) ($19) SGA % Revenue 4.3% 4.6% 4.3% 0.0 % pts (0.3 % pts.) ($27) ($10) $25 $52 $35 Restructuring and Other Charges $7 $2,111 $461 $454 ($1,650) Effective Tax Rate 27.4% (15.6%) 28.1% 0.7 % pts 43.7 % pts. Net Income (Loss) $149 ($2,339) ($178) ($327) $2,161 Net Income (Loss) Per Diluted Share $0.13 ($2.19) ($0.16) ($0.29) $2.03 Income per Diluted Share excl Special Items $0.11 $0.04 $0.09 ($0.02) $0.05 Other (Income) Expense, Net |
![]() Special Items 1) Total restructuring-related charges of $296 million expected to be approximately 55 percent cash, 45 percent non-cash See appendix for Adjusted Income reconciliation 6 o[Alcoa logo] $ Millions, except per-share amounts 4Q13 1Q14 Income Statement Classification Segment Net Loss from Continuing Operations ($2,339) ($178) Net Loss Per Diluted Share ($2.19) ($0.16) Restructuring-Related 1 ($302) ($296) Restructuring/COGS/ Other Expenses (Income), Net Corporate / Primary Metals/ GRP Tax Items ($361) $22 Income Taxes Corporate Saudi Arabia Smelter Potline ($9) ($13) COGS/ Other Expenses (Income), Net Primary Metals Massena Fire $5 $0 COGS Primary Metals/EPS/Corp Goodwill Impairment ($1,719) $0 Goodwill Impairment Charge Corporate Mark-to-Market Energy Contracts $7 $0 Other Expenses (Income), Net Corporate Surgold Gain $0 $11 Other Expenses (Income), Net Alumina Special Items ($2,379) ($276) Net Income from Continuing Ops excl Special Items $40 $98 Net Income per Diluted Share excl Special Items $0.04 $0.09 |
![]() Performance more than offsets cost headwinds and market impacts 7 See appendix for Adjusted Income reconciliation o[Alcoa logo] |
![]() LME drives Y-O-Y earnings decline; net productivity is positive 8 See appendix for Adjusted Income reconciliation o[Alcoa logo] |
![]() 9 Any reference in our presentations to EBITDA means adjusted EBITDA, for which we have provided calculations and reconciliations in the appendix. See appendix for Adjusted EBITDA reconciliation EPS generates record 1Q ATOI and EBITDA Margin o[Alcoa logo] Aerospace market remains strong, but impacted by lower U.S. Defense spare parts demand Gradual recovery in N.A. Non-Residential Construction continues; European market decline is slowing Stronger N.A. Heavy Duty Truck build rates partially offset by Europe Share Gains through innovation and productivity continues across all sectors ATOI is expected to increase 4-6% year-over-year; first-time +$200M ATOI Revenue up 3% sequentially driven by share gains across all markets Record 1Q ATOI and EBITDA margin 1Q EBITDA margin at 22.2%, up 1.3 percentage points year-over-year Quarterly ATOI up 9% year-over-year to $189M driven by productivity and strong Aerospace and Commercial Transportation demand, offsetting unfavorable weather impacts in North America 1Q 14 $189 Cost Increases -$7 Productivity $19 Price / Mix $2 Volume $7 4Q 13 $168 1Q 13 4Q 13 1Q 14 3 rd Party Revenue ($ Millions) 1,423 1,405 1,443 ATOI ($ Millions) 173 168 189 EBITDA Margin 20.9% 20.3% 22.2% 1 st Quarter Results 1 st Quarter Business Highlights 1 st Quarter Performance Bridge 1Q14 Actual and 2Q14 Outlook – Engineered Products and Solutions $ Millions 2 nd Quarter Outlook |
![]() 10 GRP nearly triples profitability from productivity and higher mill utilization See appendix for Adjusted EBITDA reconciliation o[Alcoa logo] $ Millions 1Q14 Actual and 2Q14 Outlook – Global Rolled Products 1 st Quarter Results 1 st Quarter Business Highlights 1 st Quarter Performance Bridge 1Q 14 $59 Portfolio Actions -$11 Cost Decreases $28 Prod- uctivity $6 Price / Mix -$8 Volume $6 Currency $2 Metal $15 4Q 13 $21 Record automotive sheet revenue – continued high shipments Pricing and volume pressures in Packaging Productivity gains through strong focus on cost reduction Favorable fixed cost absorption from higher mill utilization Costs associated with Australia portfolio actions of $11M Auto demand expected to stay strong Continued pressure on packaging prices and volumes Unfavorable cost impact from business continuity preparation ATOI is expected to increase ~20% sequentially, excluding FX and assuming no change in metal price 1Q 13 4Q 13 1Q 14 3 rd Party Revenue ($ Millions) 1,779 1,645 1,677 ATOI ($ Millions) 81 21 59 Adjusted EBITDA/MT 385 185 315 2 nd Quarter Outlook Strengthening demand for Industrial; pricing pressures continue Industrial volumes expected to strengthen; continued pricing pressures |
![]() Alumina pricing and productivity drive highest 1Q ATOI since 2011 11 o[Alcoa logo] $ Millions 1Q14 Actual and 2Q14 Outlook – Alumina 1 st Quarter Results 1 st Quarter Business Highlights 1 st Quarter Performance Bridge $18 $8 $37 $9 $92 $70 -$7 1Q 14 Portfolio Actions Cost Inc/RM Energy -$4 Prod - uctivity Price / Mix Volume -$15 Currency LME -$24 4Q 13 Sixth straight quarter of increased profits; highest 1Q ATOI since 2011, $74M before Surgold sale gain Performance gains offset market factors Strong Alumina index (API) pricing increases ATOI by $37M Sale of Surgold generated $18M ATOI 65% of 3 rd party shipments on spot or API for 2014; API pricing follows 30-day lag and LME pricing follows 60-day lag Production decline due to reduction at Pocos refinery in Brazil Gain from Surgold sale does not repeat Saudi JV refinery pre-operational costs increase $5M Productivity gains will offset energy and cost increases, excluding Saudi JV 1Q 13 4Q 13 1Q 14 Production (kmt) 3,994 4,249 4,172 3 rd Party Shipments (kmt) 2,457 2,578 2,649 3 rd Party Revenue ($ Millions) 826 832 845 ATOI ($ Millions) 58 70 92 2 nd Quarter Outlook -$15 +$19 Market Performance |
![]() Primary Metals aggressively executing portfolio actions 12 o[Alcoa logo] Pricing to follow 15-day lag to LME Volumes impacted by Massena East and Brazilian curtailments Saudi JV smelter restart completed Productivity gains will offset energy and cost increases Two fewer days in the quarter reduce volume by $8M sequentially Regional premiums, mix and product pricing drive performance $70M higher than 4Q Energy improvements of $24M from lower Spanish power prices, partially offset by higher costs in other regions Combined portfolio actions and Saudi JV smelter restart total $21M 1Q14 Actual and 2Q14 Outlook – Primary Metals 1 st Quarter Business Highlights 2 nd Quarter Outlook $ Millions 1 st Quarter Results 1 st Quarter Performance Bridge -$15 Portfolio Actions -$14 Saudi JV/ Massena -$7 Cost Inc/RM Currency $4 LME -$25 4Q 13 -$35 1Q 14 Price /Mix & Vol. $2 Prod - uctivity $24 Energy -$26 $62 1Q 13 4Q 13 1Q 14 Production (kmt) 891 866 839 3 rd Party Shipments (kmt) 705 717 617 3 rd Party Revenue ($ Millions) 1,758 1,618 1,424 3 rd Party Price ($/MT) 2,398 2,157 2,205 ATOI ($ Millions) 39 (35) (15) Market Performance -$21 +$62 |
![]() Two day year-over-year improvement in average DWC See appendix for days working capital reconciliation 13 o[Alcoa logo] Average Days Working Capital since First Quarter 2009 30 28 31 29 32 30 36 35 34 36 40 40 40 37 44 43 42 47 51 55 37 25 days; $1.6 Billion |
![]() 1 st Quarter Cash Flow Overview 14 See appendix for Free Cash Flow reconciliation o[Alcoa logo] ($ Millions) 1Q13 4Q13 1Q14 Net Income before Noncontrolling Interests $170 ($2,310) ($197) DD&A $361 $350 $340 Change in Working Capital ($323) $522 ($687) Pension Contributions ($83) ($108) ($91) Other Adjustments ($195) $2,466 $84 Cash from Operations ($70) $920 ($551) Dividends to Shareholders ($33) ($33) ($33) Change in Debt $90 ($14) ($14) Distributions to Noncontrolling Interests ($25) ($29) ($35) Contributions from Noncontrolling Interests $15 $0 $20 Other Financing Activities $0 $11 $72 Cash from Financing Activities $47 ($65) $10 Capital Expenditures ($235) ($422) ($209) Other Investing Activities ($50) ($3) ($31) Cash from Investing Activities ($285) ($425) ($240) 1Q13, 4Q13 & 1Q14 Cash Flow |
![]() 15 See appendix for Net Debt-to-Capital reconciliation Lowest debt since 3Q 2007; Debt-to-Cap down to target range 762 1,481 1,543 1,939 1,861 1,437 665 1Q14 7,747 7,082 2013 8,319 6,882 2012 8,829 6,968 2011 9,371 7,432 2010 9,165 7,622 2009 9,819 8,338 2008 10,578 9,816 (millions) Debt to Cap Net Debt Cash 38.1% 42.5% 38.7% 34.9% 35.3% 34.8% 35.0% Debt, Net Debt, and Debt-to-Capital % o[Alcoa logo] |
![]() Aggressive targets drive growth and operational performance in 2014 16 o[Alcoa logo] 2014 Annual Financial Targets Deliver Operational Performance Drive Productivity Gains of $850M Process productivity Procurement savings Overhead cost reductions Invest in the Future; Actively Manage the Base Build Value-Add with Growth Capital of $500M Invest in Saudi JV of $125M Manage Sustaining Capital of $750M Strengthen the Balance Sheet Generate Positive Free Cash Flow Attain 30%-35% Debt -to-Capital |
![]() Robust demand continues; regional premiums at record levels 17 Global Aluminum Demand Growth at 7% Aluminum Deficit Emerging Inventory is Stable High Regional Premiums See appendix for full scale charts o[Alcoa logo] |
![]() Klaus Kleinfeld Chairman and Chief Executive Officer 18 April 8, 2014 [Alcoa logo] |
![]() Source: Alcoa analysis 19 2014 Market Conditions remain solid o[Alcoa logo] North America China Global Europe 8% to 9% sales growth 2% to 3% sales growth 4% to 6% sales growth 8% to 12% airfoil market decline 6% to 10% prod growth 8% to 12% sales growth 7% to 9% sales growth 2% to 3% sales growth 2% to 3% sales decline 0% to 4% prod growth 1% to 5% prod decline 2% to 5% prod growth 1% to 2% sales decline Aerospace Automotive Heavy Truck & Trailer Beverage Can Packaging Commercial Building and Construction Industrial Gas Turbine 5% to 9% prod growth -1% to 3% prod flat/growth 3% to 4% sales growth 1% to 4% prod growth -1% to 3% prod flat/growth Alcoa End Markets: Current Assessment of 2014 vs. 2013 |
![]() More to Alcoa than meets the eye, exciting Value-Add Portfolio 20 Source: Alcoa analysis 1) Based on dollar value. Global commercial vehicle wheel market includes trucks, trailers and buses o[Alcoa logo] 2013 Alcoa value-add revenue by market ($B) 0.6 Other 1.5 Commercial Building and Construction 1.8 Industrial Products 3.1 Packaging 1.3 Commercial Transportation 0.8 Automotive 4.0 Aerospace Revenues: $13.1B Aerospace |
![]() Advanced Aerospace Structures Aluminum sheet, plate and extrusions Aluminum and titanium forgings Structural castings; ~50% titanium , ~30% aluminum , and ~20% nickel alloys High Performance Engine Investment Castings Global leader in jet engine airfoils 100% nickel super alloys Innovative Fastening Systems Global leader in aerospace fastening systems Both airframe and engine applications ~40% titanium , ~25% steel and ~35% nickel alloys 43% $1.74 26% $1.03 31% $1.23 $4B Aerospace Portfolio; Multi-material Innovation Leader 21 o[Alcoa logo] |
![]() Re-Inventing the Wheel: Lighter & Brighter 22 1) Based on conversion from Standard Steel to Wide-Base Aluminum o[Alcoa logo] Most innovative solutions for improved truck fuel efficiency and lowered maintenance cost Alcoa’s Innovation Leadership is on a roll $400 Heavy duty without the “Heavy” : Ultra ONE™ New 17% Stronger Proprietary MagnaForce™ Alloy World’s Lightest wheel at 40 pounds 47% Lighter than Steel, 18% Lighter than avg. Aluminum Helps Save up to 1,400 pounds per rig¹ Replacing 18 Steel wheels with Aluminum offsets Annual Carbon Footprint of average Family of Four 10x Improved Corrosion Resistance No Mechanical or Chemical Cleaning Looks New Longer Investing to double capacity in Europe 67% of 2013 Alcoa Wheel Sales driven by Proprietary Technology Never loses its Shine: Dura-Bright ® Lower GHG emissions Reduced operating cost Improved fuel efficiency Increased payload Customer needs |
![]() Growth for the long haul, winning out of the gate with Ultra ONE™ 23 Source: Alcoa analysis 1) Based on dollar value; Commercial Vehicle Market = Truck, Trailer & Bus o[Alcoa logo] Global commercial vehicle wheel market and customer conversion to Ultra ONE ™ Undisputed market leader, deep customer reach Global Commercial Vehicle Wheel Market ($B) and Penetration Rates¹ Al gaining ground in a growing market Over 150 fleets specifying 67,000 Ultra ONE™ wheels since introduction TMC Transportation converting to Ultra ONE™ wheels starting in 2014 2018 2.7 50% 50% 2014 2.0 60% 40% 2010 1.5 70% 30% Aluminum Steel |
![]() Auto going aluminum: From Audi A100 in 1985… 24 1994 to Today: ~700,000 Aluminum Space Frame Audi’s Source: Audi o[Alcoa logo] |
![]() 25 Source: IHS o[Alcoa logo] As much as 700 lbs. lighter than its predecessor Accelerates, brakes, tows and resists corrosion like never before Source: Ford Motor Company website 2013: ~700,000 F-150s Produced “With my background in aerospace and commercial airplanes, aluminum is the material of choice .” Alan Mulally, President and CEO Ford Motor Company CBS News “The F -150 establishes aluminum as a primary choice mainstream auto use.” Automotive News for “When we put it all together, to have the truck do what we wanted, there was only one answer: aluminum Raj Nair, VP Global Product Development Ford Motor Company Wall Street Journal “A stamped aluminum body can equal or outperform steel in overall strength , dent resistance and crash protection …” The New York Times …to 2015: going Mass-Market with the Ford F-150 Military - grade aluminum alloys in body and bed .” |
![]() * Total investment relates to rolling mill capability expansion to include auto sheet, building and construction sheet and foil stock. Alcoa’s investment portion is ~$95M Capitalizing on our Leading Position as Auto goes Lightweight 26 o[Alcoa logo] 136 55 14 2012 2025 2015 North America Aluminum Body Sheet Content Per Vehicle (in lbs) 1,300 580 330 229 166 2018 2015 2014 2013 2012 Projected Alcoa Auto Sheet Revenues ($M) Projected aluminum content per vehicle, Alcoa automotive growth projects and Alcoa auto sheet revenue Increasing Aluminum Intensity 6X Revenue Increase by 2018 ~$300M investment completed in 4Q 2013 Undergoing customer qualifications ~$300M investment; completion in mid-2015 Enables flexible production Positioned to Capture Growth ~$400M total investment*; First auto coil by December 2014 to reach over 1MMT by 2025 Source: Ducker Worldwide ~6x ~2.5x Al auto sheet demand expected ~10x ~4x |
![]() Re-Packaging Midstream Portfolio: Shifting mix to Grow Value-Add Source: Alcoa analysis 1) According to the Brazilian Aluminum Association PE = Polyethylene 27 o[Alcoa logo] Aluminum Inner PE coating Middle PE coating Paperboard Outer PE coating Bud Light re-closable aluminum bottle, investment in aseptic foil packaging and closure of Australia RM facilities Alcoa puts a cool twist on a cold one… Uses Alcoa aluminum sheet Patented bottle technology Licensed by Anheuser-Busch Suite of proprietary Alcoa technology offers premium aluminum packaging options for brands Differentiated Product: - Re-Closable - 84% lighter than glass bottle - Infinitely Recyclable U.S. Al bottle growth expected to more than double by 2015 Material Expertise Metal-forming know-how Closure of two Australia can sheet Rolling Mills 200 kmt closed by year-end 2014 $40 million Specialty Packaging investment in Brazil All additional Capacity has been Fully Committed Most Highly Differentiated type of container in Packaging 7% annual growth rate in Latin America over the next 3 years 1 …While reducing commodity capacity …And adds more differentiation to the mix… |
![]() Upstream Restructuring advances Transformation (1) Operating capacity = Alcoa total base capacity less idled capacity (2) Announced but not executed 28 -198 After executing announcements -253 2012 +61 2,964 -239 2011 -418 +234 2010 1Q 2014 2009 2008 2013 -344 2007 4,121 Tennessee: -215 Massena East: -125 Other: -113 Portland: -15 Fusina: -12 Mosjoen: +188 Lista: +94 Pt. Henry: -190 (2) Sao Luis: -85 (2) Massena East: -84 Pocos: -62 (2) Other: +3 Baie Comeau: -105 Sao Luis: -97 Massena East: -41 Pocos: -34 Other: -3 Spanish system: +27 Portovesme: -150 Spanish system: -90 Other: +1 Massena East: +125 Intalco: +47 Wenatchee: +43 Other: +19 Rockdale: -267 Baie Comeau: -53 Portland: -15 Other: -9 Fusina: -32 Other: +93 Bridge of Total Smelting Operating Capacity (1) 2007 to 1Q 2014, kmt -28% =1,157kmt o[Alcoa logo] |
![]() Saudi Arabia JV Progressing as Planned - World’s Lowest Cost 29 o[Alcoa logo] Smelter Rolling Mill Mine Refinery Phase 1 Phase 2 86% complete 190 kmt production in 2013 550 kmt production in 2014 At full capacity in 2014 Lowest cost smelter 2% point reduction on the smelting cost curve First hot coil in 4Q 2013 First auto coil in 4Q 2014 First alumina 4Q 2014 Lowest cost refinery 2% point reduction on the refining cost curve On track to provide bauxite in 2014 97% complete Saudi Arabia JV construction update 100% complete 63% complete |
![]() Alcoa’s Transformation Accelerates Building out Alcoa’s Value-Add Businesses; Capturing growing Demand Lowering Upstream Cost Base Accelerating launch of Innovative Products; Applying the Alcoa Advantage 30 o[Alcoa logo] |
![]() o[Alcoa logo] |
![]() Kelly Pasterick Director, Investor Relations Alcoa 390 Park Avenue New York, NY 10022-4608 Telephone: (212) 836-2674 www.alcoa.com Additional Information 32 o[Alcoa logo] |
![]() Annual Sensitivity Summary 33 Currency Annual Net Income Sensitivity +/- $100/MT = +/- $240 million LME Aluminum Annual Net Income Sensitivity Australian $ +/- $11 million per 0.01 change in USD / AUD Brazilian $ +/- $ 3 million per 0.01 change in BRL / USD Euro € +/- $ 2 million per 0.01 change in USD / EUR Canadian $ +/- $ 5 million per 0.01 change in CAD / USD Norwegian Kroner +/- $ 5 million per 0.10 change in NOK / USD o[Alcoa logo] |
![]() Revenue Change by Market 2% 3% (1%) 7% 11% (14%) (0%) (29%) 2% (12%) 1% 5% 2% 9% (6%) (23%) (9%) (5%) 2% (19%) 19% 4% 7% 6% 8% 2% 12% 1% 15% 26% Aerospace Automotive B&C Comm. Transport Industrial Products IGT Packaging Distribution/Other Alumina Primary Metals 1Q’14 Third-Party Revenue Sequential Change Year-Over-Year Change 34 o[Alcoa logo] |
![]() Special Items See appendix for Adjusted Income reconciliation. 35 Pre-tax, Before NCI After-tax, After NCI $ Millions, except per-share amounts 4Q13 1Q14 4Q13 1Q14 Income Statement Classification Segment Net Loss from Continuing Operations ($1,998) ($274) ($2,339) ($178) Net Loss Per Diluted Share ($1.87) ($0.25) ($2.19) ($0.16) Restructuring-Related ($380) ($499) ($302) ($296) Restructuring/COGS/ Other Expenses (Income), Net Corporate / Primary Metals/ GRP Tax Items $0 $0 ($361) $22 Income Taxes Corporate Saudi Arabia Smelter Potline ($10) ($13) ($9) ($13) COGS/ Other Expenses (Income), Net Primary Metals Massena Fire $9 $0 $5 $0 COGS Primary Metals/EPS/Corp Goodwill Impairment ($1,731) $0 ($1,719) $0 Goodwill Impairment Charge Corporate Mark-to-Market Energy Contracts $14 $0 $7 $0 Other Expenses (Income), Net Corporate Surgold Gain $0 $28 $0 $11 Other Expenses (Income), Net Alumina Special Items ($2,098) ($484) ($2,379) ($276) Net Income from Continuing Ops excl Special Items $100 $210 $40 $98 Net Income per Diluted Share excl Special Items $0.09 $0.19 $0.04 $0.09 o[Alcoa logo] |
![]() Composition of Regional Premium Pricing Convention 36 o[Alcoa logo] 2014E Shipments Regional Premiums Estimated Pricing Convention 55% Midwest – Platts 15-day lag 30% Rotterdam DDP – Metal Bulletin 45-day lag 10% CIF Japan – Platts Month prior to Quarter start 5% Negotiated Annual |
![]() Alcoa smelting closures and curtailments when announced actions are complete 37 (1) Pocos (62 kmt) and Sao Luis (85 kmt) have been announced, but not fully executed (2) Announced, but not executed o[Alcoa logo] Location Year kmt Baie Comeau 2008 53 Eastalco 2010 195 Badin 2010 60 Warrick 2010 40 Tennessee 2011 215 Rockdale 2011 76 Baie Comeau 2013 105 Fusina 2013 44 Massena East 2013 41 Massena East 2014 84 Point Henry (2) 2014 190 Total 1,103 Alcoa smelting capacity closures, since Dec 2007 Location kmt Rockdale 191 Sao Luis (1) 182 Portovesme 150 Pocos (1) 96 Intalco 49 Wenatchee 41 Aviles 35 Portland 30 La Coruna 25 Total 799 Alcoa smelting capacity curtailments |
![]() Reconciliation of ATOI to Consolidated Net Income (Loss) Attributable to Alcoa o[Alcoa logo] 38 (in millions) 1Q13 2Q13 3Q13 4Q13 2013 1Q14 Total segment ATOI $ 351 $ 304 $ 338 $ 224 $ 1,217 $ 325 Unallocated amounts (net of tax): Impact of LIFO (2) 5 9 40 52 (7) Interest expense (75) (76) (70) (73) (294) (78) Noncontrolling interests (21) 29 (20) (29) (41) 19 Corporate expense (67) (71) (74) (72) (284) (67) Impairment of goodwill – – – (1,731) (1,731) – Restructuring and other charges (5) (211) (108) (283) (607) (321) Other (32) (99) (51) (415) (597) (49) Consolidated net income (loss) attributable to Alcoa $ 149 $ (119) $ 24 $ (2,339) $ (2,285) $ (178) |
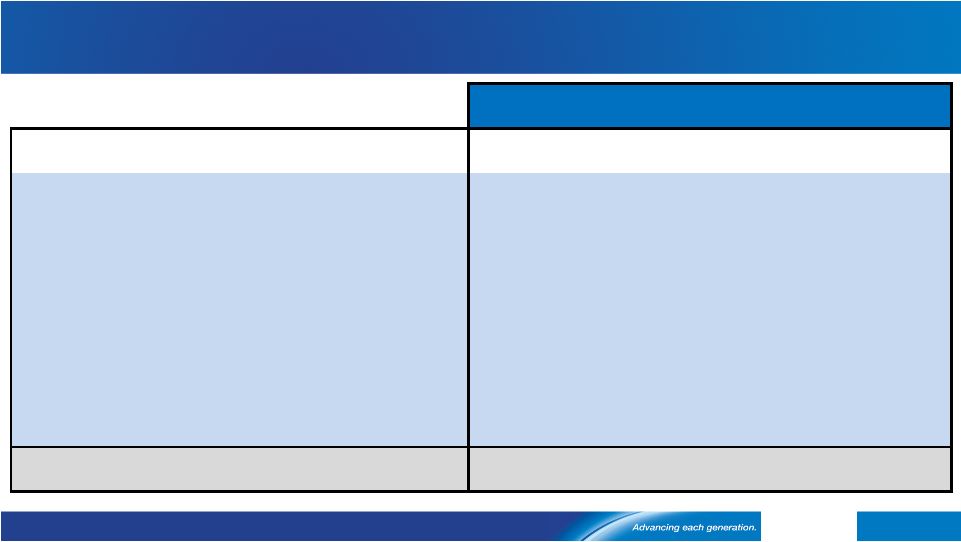
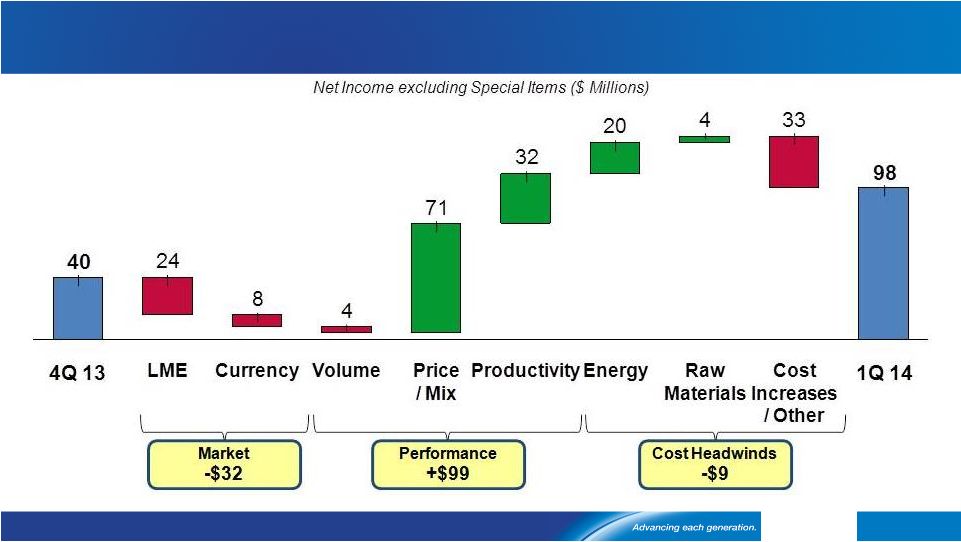
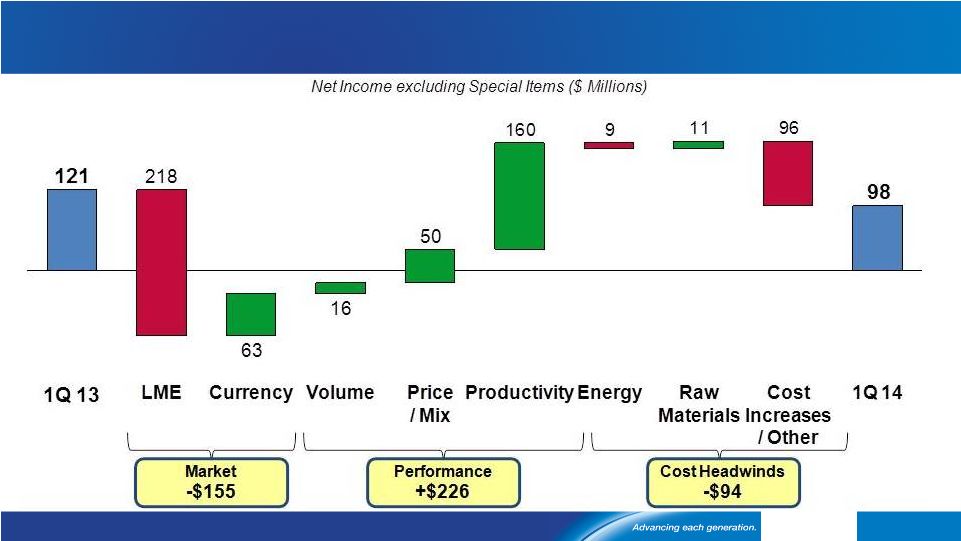
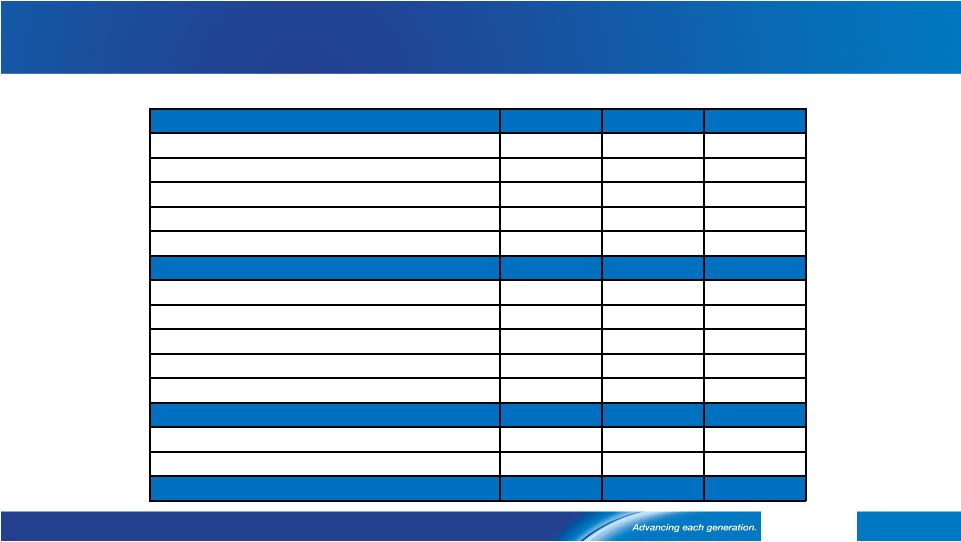
![]() Reconciliation of Adjusted Income 39 o[Alcoa logo] (in millions, except per- share amounts) Income (Loss) Diluted EPS Quarter ended Quarter ended March 31, December 31, March 31, March 31, December 31, March 31, 2013 2013 2014 2013 2013 2014 Net income (loss) attributable to Alcoa $ 149 $ (2,339) $ (178) $ 0.13 $ (2.19) $ (0.16) Restructuring and other charges 5 302 274 Discrete tax items* (19) 364 (6) Other special items** (14) 1,713 8 Net income attributable to Alcoa – as adjusted $ 121 $ 40 $ 98 0.11 0.04 0.09 Net income attributable to Alcoa – as adjusted is a non-GAAP financial measure. Management believes that this measure is meaningful to investors because management reviews the operating results of Alcoa excluding the impacts of restructuring and other charges, discrete tax items, and other special items (collectively, “special items”). There can be no assurances that additional special items will not occur in future periods. To compensate for this limitation, management believes that it is appropriate to consider both Net (loss) income attributable to Alcoa determined under GAAP as well as Net income attributable to Alcoa – as adjusted. * Discrete tax items include the following: • for the quarter ended March 31, 2014, a net benefit for a number of small items ($6); • for the quarter ended December 31, 2013, a charge for valuation allowances related to certain Spain and U.S. deferred tax assets ($372) and a net benefit for other miscellaneous items ($8); and • for the quarter ended March 31, 2013, a benefit related to the reinstatement under the American Taxpayer Relief Act of 2012 of two tax provisions that were applied in 2013 to Alcoa’s U.S. income tax return for calendar year 2012 ($19). ** Other special items include the following: • for the quarter ended March 31, 2014, a tax benefit representing the difference between Alcoa’s consolidated estimated annual effective tax rate and the statutory rates applied to restructuring and other charges ($72), an unfavorable tax impact related to the interim period treatment of operational losses in certain foreign jurisdictions for which no tax benefit was recognized ($56), the write-off of inventory related to the permanent closure of a smelter and two rolling mills in Australia and a smelter in the United States ($20), an unfavorable impact related to the restart of one potline at the joint venture in Saudi Arabia that was previously shut down due to a period of pot instability ($13), a gain on the sale of a mining interest in Suriname ($11), and a loss on the writedown of an asset to fair value ($2); • for the quarter ended December 31, 2013, an impairment of goodwill ($1,719), an unfavorable impact related to a temporary shutdown of one of the two smelter potlines at the joint venture in Saudi Arabia due to a period of pot instability ($9), a net favorable change in certain mark-to-market energy derivative contracts ($7), an insurance recovery related to the March 2012 cast house fire at the Massena, NY location ($5), and a favorable tax impact related to the interim period treatment of operational losses in certain foreign jurisdictions for which no tax benefit was recognized during the nine months ended September 30, 2013 ($3); and • for the quarter ended March 31, 2013, a net favorable change in certain mark-to-market energy derivative contracts ($9) and a net insurance recovery related to the March 2012 cast house fire at the Massena, NY location ($5). |
![]() ($ in millions) 2003 2004 2005 2006 2007 2008 2009 2010 2011 2012 2013 1Q13 4Q13 1Q14 Net income (loss) attributable to Alcoa $ 938 $ 1,310 $ 1,233 $ 2,248 $ 2,564 $ (74) $(1,151) $ 254 $ 611 $ 191 $(2,285) $ 149 $(2,339) $ (178) Add: Net income (loss) attributable to noncontrolling interests 212 233 259 436 365 221 61 138 194 (29) 41 21 29 (19) Cumulative effect of accounting changes 47 – 2 – – – – – – – – – – – Loss (income) from discontinued operations – 27 50 (22) 250 303 166 8 3 – – – – – Provision (benefit) for income taxes 367 546 464 853 1,623 342 (574) 148 255 162 428 64 312 (77) Other (income) expenses, net (278) (266) (478) (236) (1,920) (59) (161) 5 (87) (341) (25) (27) (10) 25 Interest expense 314 271 339 384 401 407 470 494 524 490 453 115 112 120 Restructuring and other charges (28) (29) 266 507 268 939 237 207 281 172 782 7 380 461 Impairment of goodwill – – – – – – – – – – 1,731 – 1,731 – Provision for depreciation, depletion, and amortization 1,110 1,142 1,227 1,252 1,244 1,234 1,311 1,450 1,479 1,460 1,421 361 350 340 Adjusted EBITDA $ 2,682 $ 3,234 $ 3,362 $ 5,422 $ 4,795 $ 3,313 $ 359 $ 2,704 $ 3,260 $ 2,105 $ 2,546 $ 690 $ 565 $ 672 Sales $18,879 $21,370 $24,149 $28,950 $29,280 $ 26,901 $18,439 $21,013 $24,951 $23,700 $23,032 $ 5,833 $ 5,585 $ 5,454 Adjusted EBITDA Margin 14.2% 15.1% 13.9% 18.7% 16.4% 12.3% 1.9% 12.9% 13.1% 8.9% 11.1% 11.8% 10.1% 12.3% Reconciliation of Alcoa Adjusted EBITDA 40 o[Alcoa logo] Alcoa’s definition of Adjusted EBITDA (Earnings before interest, taxes, depreciation, and amortization) is net margin plus an add-back for depreciation, depletion, and amortization. Net margin is equivalent to Sales minus the following items: Cost of goods sold; Selling, general administrative, and other expenses; Research and development expenses; and Provision for depreciation, depletion, and amortization. Adjusted EBITDA is a non-GAAP financial measure. Management believes that this measure is meaningful to investors because Adjusted EBITDA provides additional information with respect to Alcoa’s operating performance and the Company’s ability to meet its financial obligations. The Adjusted EBITDA presented may not be comparable to similarly titled measures of other companies. |
![]() Reconciliation of Alumina Adjusted EBITDA 41 o[Alcoa logo] ($ in millions, except per metric ton amounts) 2003 2004 2005 2006 2007 2008 2009 2010 2011 2012 2013 1Q13 4Q13 1Q14 After-tax operating income (ATOI) $ 415 $ 632 $ 682 $ 1,050 $ 956 $ 727 $ 112 $ 301 $ 607 $ 90 $ 259 $ 58 $ 70 $ 92 Add: Depreciation, depletion, and amortization 147 153 172 192 267 268 292 406 444 455 426 109 102 97 Equity (income) loss -- (1) -- 2 (1) (7) (8) (10) (25) (5) 4 (1) 2 5 Income taxes 161 240 246 428 340 277 (22) 60 179 (27) 66 14 21 40 Other (55) (46) (8) (6) 2 (26) (92) (5) (44) (8) (6) (3) (1) (28) Adjusted EBITDA $ 668 $ 978 $ 1,092 $ 1,666 $ 1,564 $ 1,239 $ 282 $ 752 $ 1,161 $ 505 $ 749 $ 177 $ 194 $ 206 Production (thousand metric tons) (kmt) 13,841 14,343 14,598 15,128 15,084 15,256 14,265 15,922 16,486 16,342 16,618 3,994 4,249 4,172 Adjusted EBITDA / Production ($ per metric ton) $ 48 $ 68 $ 75 $ 110 $ 104 $ 81 $ 20 $ 47 $ 70 $ 31 $ 45 $ 44 $ 46 $ 49 Alcoa’s definition of Adjusted EBITDA (Earnings before interest, taxes, depreciation, and amortization) is net margin plus an add-back for depreciation, depletion, and amortization. Net margin is equivalent to Sales minus the following items: Cost of goods sold; Selling, general administrative, and other expenses; Research and development expenses; and Provision for depreciation, depletion, and amortization. The Other line in the table above includes gains/losses on asset sales and other nonoperating items. Adjusted EBITDA is a non-GAAP financial measure. Management believes that this measure is meaningful to investors because Adjusted EBITDA provides additional information with respect to Alcoa’s operating performance and the Company’s ability to meet its financial obligations. The Adjusted EBITDA presented may not be comparable to similarly titled measures of other companies. |
![]() ($ in millions, except per metric ton amounts) 2003 2004 2005 2006 2007 2008 2009 2010 2011 2012 2013 1Q13 4Q13 1Q14 After-tax operating income (ATOI) $ 657 $ 808 $ 822 $ 1,760 $ 1,445 $ 931 $ (612) $ 488 $ 481 $ 309 $ (20) $ 39 $ (35) $ (15) Add: Depreciation, depletion, and amortization 310 326 368 395 410 503 560 571 556 532 526 135 128 124 Equity (income) loss (55) (58) 12 (82) (57) (2) 26 (1) 7 27 51 9 22 28 Income taxes 256 314 307 726 542 172 (365) 96 92 106 (74) 1 (34) (11) Other 12 20 (96) (13) (27) (32) (176) (7) 2 (422) (8) (1) (6) – Adjusted EBITDA $ 1,180 $ 1,410 $ 1,413 $ 2,786 $ 2,313 $ 1,572 $ (567) $ 1,147 $ 1,138 $ 552 $ 475 $ 183 $ 75 $ 126 Production (thousand metric tons) (kmt) 3,508 3,376 3,554 3,552 3,693 4,007 3,564 3,586 3,775 3,742 3,550 891 866 839 Adjusted EBITDA / Production ($ per metric ton) $ 336 $ 418 $ 398 $ 784 $ 626 $ 392 $ (159) $ 320 $ 301 $ 148 $ 134 $ 205 $ 87 $ 150 Reconciliation of Primary Metals Adjusted EBITDA 42 o[Alcoa logo] Alcoa’s definition of Adjusted EBITDA (Earnings before interest, taxes, depreciation, and amortization) is net margin plus an add-back for depreciation, depletion, and amortization. Net margin is equivalent to Sales minus the following items: Cost of goods sold; Selling, general administrative, and other expenses; Research and development expenses; and Provision for depreciation, depletion, and amortization. The Other line in the table above includes gains/losses on asset sales and other nonoperating items. Adjusted EBITDA is a non-GAAP financial measure. Management believes that this measure is meaningful to investors because Adjusted EBITDA provides additional information with respect to Alcoa’s operating performance and the Company’s ability to meet its financial obligations. The Adjusted EBITDA presented may not be comparable to similarly titled measures of other companies. |
![]() Reconciliation of Global Rolled Products Adjusted EBITDA 43 o[Alcoa logo] ($ in millions, except per metric ton amounts) 2001 2002 2003 2004 2005 2006 2007 2008 2009 2010 2011 2012 2013 1Q13 4Q13 1Q14 After-tax operating income (ATOI) $ 232 $ 223 $ 232 $ 290 $ 300 $ 317 $ 151 $ (41) $ (106) $ 241 $ 260 $ 346 $ 252 $ 81 $ 21 $ 59 Add: Depreciation, depletion, and amortization 167 184 190 200 220 223 227 216 227 238 237 229 226 57 58 58 Equity loss 2 4 1 1 – 2 – – – – 3 6 13 4 4 5 Income taxes 112 90 77 97 135 113 77 14 12 103 98 159 108 39 5 34 Other (5) (8) (5) 1 1 20 1 6 (2) 1 1 (2) – (1) 1 (2) Adjusted EBITDA* $ 508 $ 493 $ 495 $ 589 $ 656 $ 675 $ 456 $ 195 $ 131 $ 583 $ 599 $ 738 $ 599 $ 89 $ 154 Total shipments (thousand metric tons) (kmt) 1,863 1,814 1,893 2,136 2,250 2,376 2,482 2,361 1,888 1,755 1,866 1,943 1,989 468 481 489 Adjusted EBITDA / Total shipments ($ per metric ton)* $ 273 $ 272 $ 261 $ 276 $ 292 $ 284 $ 184 $ 83 $ 69 $ 332 $ 321 $ 380 $ 301 $ 385 $ 185 $ 315 Alcoa’s definition of Adjusted EBITDA (Earnings before interest, taxes, depreciation, and amortization) is net margin plus an add-back for depreciation, depletion, and amortization. Net margin is equivalent to Sales minus the following items: Cost of goods sold; Selling, general administrative, and other expenses; Research and development expenses; and Provision for depreciation, depletion, and amortization. The Other line in the table above includes gains/losses on asset sales and other nonoperating items. Adjusted EBITDA is a non-GAAP financial measure. Management believes that this measure is meaningful to investors because Adjusted EBITDA provides additional information with respect to Alcoa’s operating performance and the Company’s ability to meet its financial obligations. The Adjusted EBITDA presented may not be comparable to similarly titled measures of other companies. In 1Q14, the Adjusted EBITDA of Global Rolled Products includes a $13 charge for the write-off of inventory related to the permanent closure of two rolling mills in Australia. Excluding this charge, Adjusted EBITDA was $167 and the resulting EBITDA per metric ton was $342 for 1Q14. * |
![]() Reconciliation of Engineered Products and Solutions Adjusted EBITDA 44 o[Alcoa logo] Alcoa’s definition of Adjusted EBITDA (Earnings before interest, taxes, depreciation, and amortization) is net margin plus an add-back for depreciation, depletion, and amortization. Net margin is equivalent to Sales minus the following items: Cost of goods sold; Selling, general administrative, and other expenses; Research and development expenses; and Provision for depreciation, depletion, and amortization. The Other line in the table above includes gains/losses on asset sales and other nonoperating items. Adjusted EBITDA is a non-GAAP financial measure. Management believes that this measure is meaningful to investors because Adjusted EBITDA provides additional information with respect to Alcoa’s operating performance and the Company’s ability to meet its financial obligations. The Adjusted EBITDA presented may not be comparable to similarly titled measures of other companies. ($ in millions) 2003 2004 2005 2006 2007 2008 2009 2010 2011 2012 2013 1Q13 4Q13 1Q14 After-tax operating income (ATOI) $ 126 $ 161 $ 276 $ 382 $ 423 $ 522 $ 311 $ 419 $ 537 $ 612 $ 726 $ 173 $ 168 $ 189 Add: Depreciation, depletion, and amortization 166 168 160 152 163 165 177 154 158 158 159 40 40 40 Equity loss (income) – – – 6 – – (2) (2) (1) – – – – – Income taxes 57 70 120 164 184 215 138 198 258 297 348 84 79 91 Other 11 106 (11) (2) (7) 2 1 – (1) (9) (2) – (2) – Adjusted EBITDA $ 360 $ 505 $ 545 $ 702 $ 763 $ 904 $ 625 $ 769 $ 951 $ 1,058 $ 1,231 $ 297 $ 285 $ 320 Third-party sales $ 3,905 $ 4,283 $ 4,773 $ 5,428 $ 5,834 $ 6,199 $ 4,689 $ 4,584 $ 5,345 $ 5,525 $ 5,733 $ 1,423 $ 1,405 $ 1,443 Adjusted EBITDA Margin 9.2% 11.8% 11.4% 12.9% 13.1% 14.6% 13.3% 16.8% 17.8% 19.1% 21.5% 20.9% 20.3% 22.2% |
![]() Reconciliation of Free Cash Flow 45 o[Alcoa logo] Free Cash Flow is a non-GAAP financial measure. Management believes that this measure is meaningful to investors because management reviews cash flows generated from operations after taking into consideration capital expenditures due to the fact that these expenditures are considered necessary to maintain and expand Alcoa’s asset base and are expected to generate future cash flows from operations. It is important to note that Free Cash Flow does not represent the residual cash flow available for discretionary expenditures since other non-discretionary expenditures, such as mandatory debt service requirements, are not deducted from the measure. (in millions) Quarter ended September 30, 2011 December 31, 2011 March 31, 2012 June 30, 2012 September 30, 2012 December 31, 2012 March 31, 2013 June 30, 2013 September 30, 2013 December 31, 2013 March 31, 2014 Cash from operations $ 489 $ 1,142 $ (236) $ 537 $ 263 $ 933 $ (70) $ 514 $ 214 $ 920 $ (551) Capital expenditures (325) (486) (270) (291) (302) (398) (235) (286) (250) (422) (209) Free cash flow $ 164 $ 656 $ (506) $ 246 $ (39) $ 535 $ (305) $ 228 $ (36) $ 498 $ (760) |
![]() Reconciliation of Free Cash Flow, con’t 46 o[Alcoa logo] Free Cash Flow is a non-GAAP financial measure. Management believes that this measure is meaningful to investors because management reviews cash flows generated from operations after taking into consideration capital expenditures due to the fact that these expenditures are considered necessary to maintain and expand Alcoa’s asset base and are expected to generate future cash flows from operations. It is important to note that Free Cash Flow does not represent the residual cash flow available for discretionary expenditures since other non-discretionary expenditures, such as mandatory debt service requirements, are not deducted from the measure. (in millions) Quarter ended December 31, March 31, June 30, September 30, December 31, March 31, June 30, September 30, December 31, March 31, June 30, 2008 2009 2009 2009 2009 2010 2010 2010 2010 2011 2011 Cash from operations $ 608 $ (271) $ 328 $ 184 $ 1,124 $ 199 $ 300 $ 392 $ 1,370 $ (236) $ 798 Capital expenditures (1,017) (471) (418) (370) (363) (221) (213) (216) (365) (204) (272) Free cash flow $ (409) $ (742) $ (90) $ (186) $ 761 $ (22) $ 87 $ 176 $ 1,005 $ (440) $ 526 |
![]() Days Working Capital 47 o[Alcoa logo] Days Working Capital = Working Capital divided by (Sales/number of days in the quarter). ($ in millions) Quarter ended March 31, June 30, September 30, December 31, March 31, June 30, September 30, December 31, March 31, 2012 2012 2012 2012 2013 2013 2013 2013 2014 Receivables from customers, less allowances $ 1,709 $ 1,650 $ 1,600 $ 1,573 $ 1,704 $ 1,483 $ 1,427 $ 1,383 $ 1,391 Add: Deferred purchase price receivable* 85 144 104 53 50 223 347 339 238 Receivables from customers, less allowances, as adjusted 1,794 1,794 1,704 1,626 1,754 1,706 1,774 1,722 1,629 Add: Inventories 3,079 3,097 3,051 2,894 2,961 2,949 2,932 2,783 2,974 Less: Accounts payable, trade 2,660 2,594 2,496 2,587 2,656 2,820 2,746 2,816 2,813 Working Capital** $ 2,213 $ 2,297 $ 2,259 $ 1,933 $ 2,059 $ 1,835 $ 1,960 $ 1,689 $ 1,790 Sales $ 6,006 $ 5,963 $ 5,833 $ 5,898 $ 5,833 $ 5,849 $ 5,765 $ 5,585 $ 5,454 Days Working Capital 34 35 36 30 32 29 31 28 30 * The deferred purchase price receivable relates to an arrangement to sell certain customer receivables to several financial institutions on a recurring basis. Alcoa is adding back this receivable for the purposes of the Days Working Capital calculation. ** Beginning January 1, 2014, management changed the manner in which Working Capital is measured by moving from an end of quarter Working Capital to an average quarter Working Capital. This change will now reflect the capital tied up during a given quarter. As such, the components of Working Capital for each period presented represent the average of the ending balances in each of the three months during the respective quarter. |
![]() Reconciliation of Net Debt (in millions) December 31, March 31, 2008 2009 2010 2011 2012 2013 2014 Short-term borrowings $ 478 $ 176 $ 92 $ 62 $ 53 $ 57 $ 53 Commercial paper 1,535 – – 224 – – – Long-term debt due within one year 56 669 231 445 465 655 85 Long-term debt, less amount due within one year 8,509 8,974 8,842 8,640 8,311 7,607 7,609 Total debt 10,578 9,819 9,165 9,371 8,829 8,319 7,747 Less: Cash and cash equivalents 762 1,481 1,543 1,939 1,861 1,437 665 Net debt $ 9,816 $ 8,338 $ 7,622 $ 7,432 $ 6,968 $ 6,882 $ 7,082 48 o[Alcoa logo] Net debt is a non-GAAP financial measure. Management believes that this measure is meaningful to investors because management assesses Alcoa’s leverage position after factoring in available cash that could be used to repay outstanding debt. |
![]() Reconciliation of Net Debt-to-Capital 49 o[Alcoa logo] Net debt-to-capital is a non-GAAP financial measure. Management believes that this measure is meaningful to investors because management assesses Alcoa’s leverage position after factoring in available cash that could be used to repay outstanding debt. ($ in millions) December 31, 2013 March 31, 2014 Debt-to-Capital Cash and Cash Net Debt-to- Debt-to-Capital Cash and Cash Net Debt-to- Equivalents Capital Equivalents Capital Total Debt Short-term borrowings $ 57 $ 53 Long-term debt due within one year 655 85 Long-term debt, less amount due within one year 7,607 7,609 Numerator $ 8,319 $ 1,437 $ 6,882 $ 7,747 $ 665 $ 7,082 Total Capital Total debt $ 8,319 $ 7,747 Total equity 13,512 14,374 Denominator $ 21,831 $ 1,437 $ 20,394 $ 22,121 $ 665 $ 21,456 Ratio 38.1 % 33.7 % 35.0 % 33.0 % |
![]() Composition of Upstream Production Costs Refining Cost Structure Smelting Cost Structure 1 Natural gas information corresponds to Point Comfort, as Australia is priced on a rolling 16 quarter average 50 o[Alcoa logo] |
![]() 2014 global aluminum demand growth continues 51 Source: Alcoa estimates, Brook Hunt, CRU, Harbor 1.0 25.2 6.6 6.4 4.2 2.1 2.0 2.0 1.1 3% 10% 4% 2% 5% 5% 8% 8% 4% 5% 2014E 52.6 mmt * Other includes Africa, E.Europe, Latin America ex Brazil, and Oceania 2014 Primary Aluminum Consumption (mmt), Annualized Growth (%) China Europe North America North Asia India SE Asia MENA Russia Brazil Other * 2.0 2014 demand +7% World ex China +4% o[Alcoa logo] |
![]() 52 Source: Alcoa analysis, Brook Hunt, CRU, CNIA, NBS, Chinese Customs Alumina surplus persists, global metal deficit emerging o[Alcoa logo] 2014E Aluminum Supply/Demand Balance ’000 mt China Rest of World 2014 Production 23,800 25,155 2014 Production to be added 3,150 1,300 2014 Capacity to be curtailed (1,100) (240) Total supply 25,850 26,215 Demand (25,450) (27,345) Net Balance 400 (1,130) 2014E Alumina Supply/Demand Balance ’000 mt China Rest of World 2014 Production 42,200 54,134 2014 Production to be added 6,800 3,300 2014 Capacity to be curtailed - (950) Imports/(exports) 3,400 (3,400) Total supply 52,400 53,084 Demand (51,700) (51,527) Net Balance 700 1,557 Supply/Demand Analysis SURPLUS 2,257 DEFICIT (730) 4Q13 Surplus 1,996 4Q13 Surplus 106 |
![]() 53 Source: Alcoa estimates, IAI, LME, Marubeni, Shanghai Metal Exchange Global inventories increase as China stocks rise, ROW declining o[Alcoa logo] Global Inventories vs. LME Price Over Time $ |
![]() Regional premiums move higher 54 Source: Monthly average of daily prices - Platts Metals Week $0 $50 $100 $150 $200 $250 $300 $350 $400 $450 $500 $0 $50 $100 $150 $200 $250 $300 $350 $400 $450 $500 Regional Premiums over time $ per metric ton $ per metric ton Region End of 1Q 14 Europe $360/MT Japan $371/MT Midwest USA $409/MT 1Q 14 vs. 1Q 13 Change Europe 20% Japan 33% Midwest USA 69% o[Alcoa logo] |