 2 nd Quarter Earnings Conference 12 July 8, 2015 [Alcoa logo] Exhibit 99.2 |
 Important Information 2 [Alcoa logo] Forward-Looking Statements This communication contains statements that relate to future events and expectations and as such constitute forward-looking statements within the meaning of the Private Securities Litigation Reform Act of 1995. Forward-looking statements include those containing such words as “anticipates,” “believes,” “could,” “estimates,” “expects,” “forecasts,” “intends,” “may,” “outlook,” “plans,” “projects,” “seeks,” “sees,” “should,” “targets,” “will,” “would,” or other words of similar meaning. All statements that reflect Alcoa’s expectations, assumptions or projections about the future other than statements of historical fact are forward-looking statements, including, without limitation, forecasts concerning global demand growth for aluminum, end market conditions, supply/demand balances, and growth opportunities for aluminum in automotive, aerospace, and other applications; targeted financial results or operating performance; statements about Alcoa’s strategies, outlook, and business and financial prospects; and statements regarding the acceleration of Alcoa’s portfolio transformation, including the expected benefits of acquisitions, including the completed acquisition of the Firth Rixson business and TITAL, and the pending acquisition of RTI International Metals, Inc. (RTI). These statements reflect beliefs and assumptions that are based on Alcoa’s perception of historical trends, current conditions, and expected future developments, as well as other factors management believes are appropriate in the circumstances. Forward-looking statements are not guarantees of future performance and are subject to risks, uncertainties, and changes in circumstances that are difficult to predict. Important factors that could cause actual results to differ materially from those expressed or implied in the forward-looking statements include: (a) material adverse changes in aluminum industry conditions, including global supply and demand conditions and fluctuations in London Metal Exchange-based prices and premiums, as applicable, for primary aluminum, alumina, and other products, and fluctuations in indexed-based and spot prices for alumina; (b) deterioration in global economic and financial market conditions generally; (c) unfavorable changes in the markets served by Alcoa, including aerospace, automotive, commercial transportation, building and construction, packaging, defense, and industrial gas turbine; (d) the impact of changes in foreign currency exchange rates on costs and results, particularly the Australian dollar, Brazilian real, Canadian dollar, euro, and Norwegian kroner; (e) increases in energy costs or the unavailability or interruption of energy supplies; (f) increases in the costs of other raw materials; (g) Alcoa’s inability to achieve the level of revenue growth, cash generation, cost savings, improvement in profitability and margins, fiscal discipline, or strengthening of competitiveness and operations (including moving its alumina refining and aluminum smelting businesses down on the industry cost curves and increasing revenues and improving margins in its Global Rolled Products and Engineered Products and Solutions segments) anticipated from its restructuring programs and productivity improvement, cash sustainability, technology, and other initiatives; (h) Alcoa’s inability to realize expected benefits, in each case as planned and by targeted completion dates, from acquisitions (including achieving the expected levels of synergies, revenue growth, or EBITDA margin improvement), sales of assets, closures or curtailments of facilities, newly constructed, expanded, or acquired facilities, or international joint ventures, including the joint venture in Saudi Arabia; (i) political, economic, and regulatory risks in the countries in which Alcoa operates or sells products, including unfavorable changes in laws and governmental policies, civil unrest, imposition of sanctions, expropriation of assets, or other events beyond Alcoa’s control; (j) the outcome of contingencies, including legal proceedings, government or regulatory investigations, and environmental remediation; (k) the impact of cyber attacks and potential information technology or data security breaches; (l) failure to receive the required votes of RTI’s shareholders to approve the merger of RTI with Alcoa, or the failure to satisfy the other closing conditions to the acquisition; (m) the risk that acquisitions (including Firth Rixson, TITAL and RTI) will not be integrated successfully or such integration may be more difficult, time-consuming or costly than expected; (n) the possibility that certain assumptions with respect to RTI or the acquisition could prove to be inaccurate, including the expected timing of closing; (o) the loss of customers, suppliers and other business relationships as a result of acquisitions, competitive developments, or other factors; (p) the potential failure to retain key employees of Alcoa or acquired businesses; (q) the effect of an increased number of Alcoa shares outstanding as a result of the acquisition of RTI; (r) the impact of potential sales of Alcoa common stock issued in the RTI acquisition; (s) failure to successfully implement, to achieve commercialization of, or to realize expected benefits from, new or innovative technologies, equipment, processes, or products, including the Micromill™, innovative aluminum wheels, and advanced alloys; and (t) the other risk factors discussed in Alcoa’s Form 10-K for the year ended December 31, 2014, and other reports filed with the Securities and Exchange Commission (SEC). Alcoa disclaims any obligation to update publicly any forward-looking statements, whether in response to new information, future events or otherwise, except as required by applicable law. Market projections are subject to the risks discussed above and other risks in the market. Nothing on Alcoa’s website is included or incorporated by reference herein. |
 Important Information (continued) 3 [Alcoa logo] Non-GAAP Financial Measures Some of the information included in this presentation is derived from Alcoa’s consolidated financial information but is not presented in Alcoa’s financial statements prepared in accordance with accounting principles generally accepted in the United States of America (GAAP). Certain of these data are considered “non-GAAP financial measures” under SEC rules. These non-GAAP financial measures supplement our GAAP disclosures and should not be considered an alternative to the GAAP measure. Reconciliations to the most directly comparable GAAP financial measures and management’s rationale for the use of the non-GAAP financial measures can be found in the Appendix to this presentation. Any reference to historical EBITDA means adjusted EBITDA, for which we have provided calculations and reconciliations in the Appendix. Alcoa has not provided a reconciliation of any forward-looking non-GAAP financial measure to the most directly comparable GAAP financial measure, due primarily to variability and difficulty in making accurate forecasts and projections, as not all of the information necessary for a quantitative reconciliation is available to Alcoa without unreasonable effort. Additional Information and Where to Find It This communication does not constitute an offer to sell or the solicitation of an offer to buy any securities or a solicitation of any vote or approval nor shall there be any sale of securities in any jurisdiction in which such offer, solicitation or sale would be unlawful prior to registration or qualification under the securities laws of any such jurisdiction. The proposed business combination transaction between Alcoa and RTI will be submitted to the shareholders of RTI for their consideration. Alcoa has filed with the SEC a Registration Statement on Form S-4 (Registration No. 333-203275) containing a definitive proxy statement of RTI that also constitutes a prospectus of Alcoa, and RTI has mailed the proxy statement/prospectus to its shareholders. Alcoa and RTI also plan to file other documents with the SEC regarding the proposed transaction. INVESTORS AND SECURITY HOLDERS OF RTI ARE URGED TO READ THE PROXY STATEMENT/PROSPECTUS AND ANY OTHER RELEVANT DOCUMENTS FILED WITH THE SEC CAREFULLY AND IN THEIR ENTIRETY BECAUSE THEY CONTAIN IMPORTANT INFORMATION ABOUT THE PROPOSED TRANSACTION. You may obtain copies of all documents filed with the SEC regarding this transaction, free of charge, at the SEC’s website (www.sec.gov). You may also obtain these documents, free of charge, from Alcoa’s website (www.alcoa.com). You may also obtain these documents, free of charge, from RTI’s website (www.rtiintl.com). Participants in the Solicitation Alcoa, RTI, and certain of their respective directors, executive officers and other members of management and employees may be deemed to be participants in the solicitation of proxies from RTI shareholders in connection with the proposed transaction. You can find information about Alcoa’s executive officers and directors in its definitive proxy statement filed with the SEC on March 19, 2015, its Annual Report on Form 10-K filed with the SEC on February 19, 2015 and in the above-referenced Registration Statement on Form S-4. You can find information about RTI’s executive officers and directors in the proxy statement/prospectus and in RTI’s Annual Report on Form 10-K filed with the SEC on February 26, 2015. You can obtain free copies of these documents from Alcoa and RTI as described in the preceding paragraph. |
 Klaus Kleinfeld Chairman and Chief Executive Officer 4 July 8, 2015 [Alcoa logo] |
 Driving Solid Operational Results + Transformation On Track 5 1) Reported earnings of $140 million in 2Q15 vs 2Q14 of $138 million, up 1.4%. See appendix for adjusted earnings reconciliation. [Alcoa logo] Adjusted Earnings 1 up nearly 16% Driven by: Downstream: Record ATOI of $210 million, up 4%; aerospace revenue up 29% YoY Midstream: ATOI of $76 million, up 9%; auto sheet revenue up ~180% YoY Upstream: Solid Performance in face of significant market headwinds Productivity Gains: $324 million across all segments Free Cash Flow: $205 million; Cash from Operations $472 million, after $300 million prepayment for gas supply contract Cash on Hand: $1.3 billion Firth Rixson integration on track $1.6 billion revenue and $350 million EBITDA in 2016 Micromill : Qualification agreements in place with 8 major automotive customers from three continents Progress on 12-month capacity review: 2.8 MMT Refining, 500 kmt Smelting Expected to close by end of July Completed 12-year Western Australia Gas Supply Contract Curtailed Suriname alumina refining capacity and São Luís aluminum smelting capacity Permanently closed Poços de Caldas primary aluminum smelter in Brazil Announced permanent closure of Anglesea power station & coal mine in Australia 2Q 2015 Overview Driving Solid Operational Performance Portfolio Transformation On Track Obtained regulatory approvals for RTI acquisition – RTI Shareholder Vote July 21 TM Alumina segment: ATOI of $215 million; Best First Half ATOI result since 2007 Primary Metals segment: ATOI of $67 million; as Midwest transaction price lower by 22%, YTD 2015 |
 William Oplinger Executive Vice President and Chief Financial Officer 6 July 8, 2015 [Alcoa logo] |
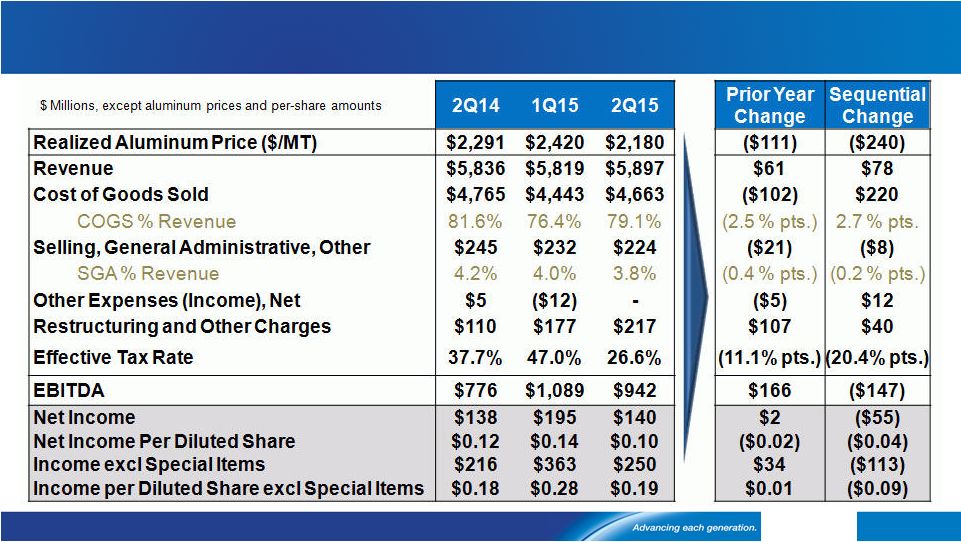 Income Statement Summary 7 See appendix for EBITDA and Adjusted Income reconciliations. [Alcoa logo] |
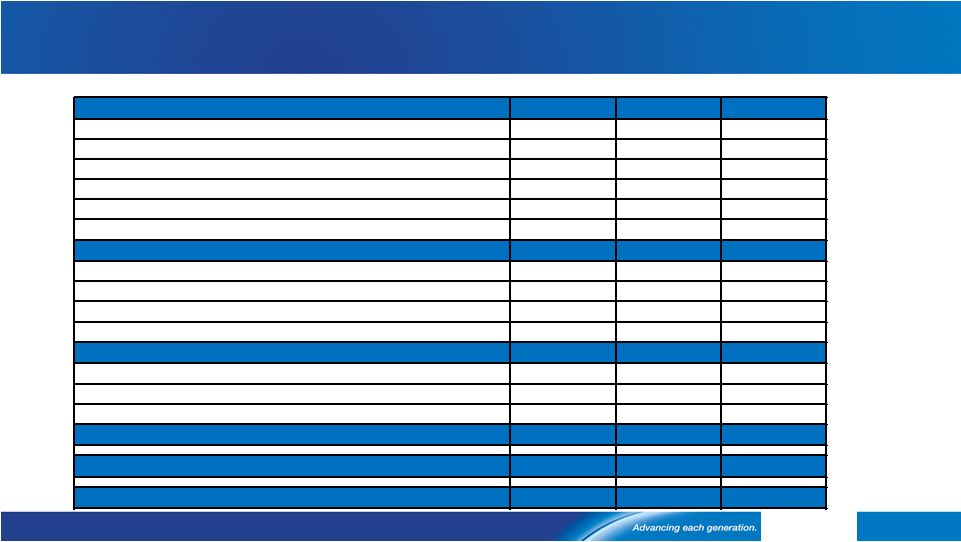
 Special Items GRP = Global Rolled Products. 1) Total restructuring-related charges in 2Q15 of $143 million (55 percent cash, 45 percent non-cash). See appendix for Adjusted Income reconciliation 8 [Alcoa logo] $ Millions, except per-share amounts 2Q14 1Q15 2Q15 Income Statement Classification Segment Net Income $138 $195 $140 Net Income Per Diluted Share $0.12 $0.14 $0.10 Restructuring - Related 1 ($54) ($158) ($143) Restructuring and Other Charges/COGS Corporate/ Primary Metals Tax Items ($2) ($4) $22 Income Taxes Corporate/GRP Gain on Land Sale - - $19 Other Income, Net Corporate Acquisition Costs ($11) ($7) ($5) SG&A Corporate Mark-to-Market Energy Contracts $6 $1 ($3) Other Expenses (Income), Net Corporate Master U.S. Labor Agreement ($11) - - COGS Corporate/All Saudi JV Potline Impact ($6) - - COGS / Other Expenses, Net Primary Metals Special Items ($78) ($168) ($110) Net Income excl Special Items $216 $363 $250 Net Income per Diluted Share excl Special Items $0.18 $0.28 $0.19 |
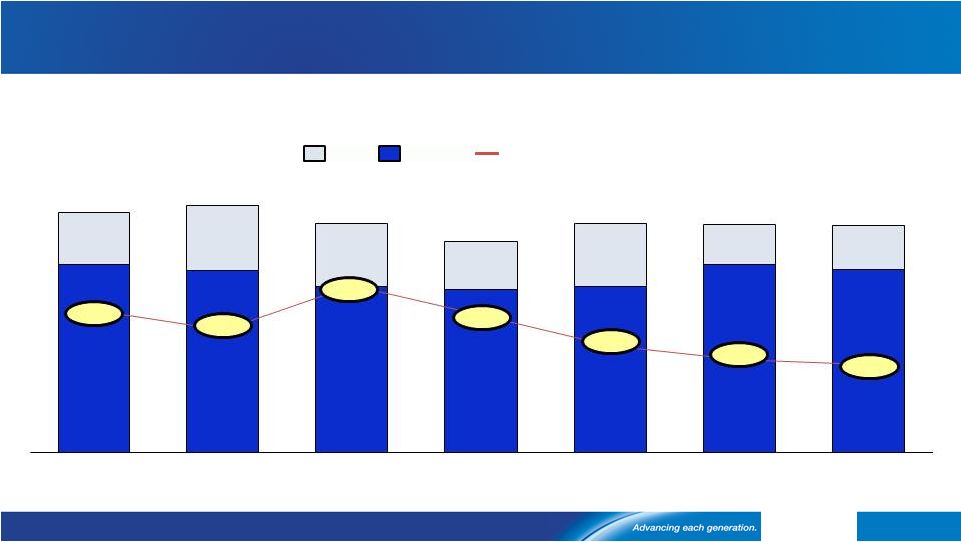
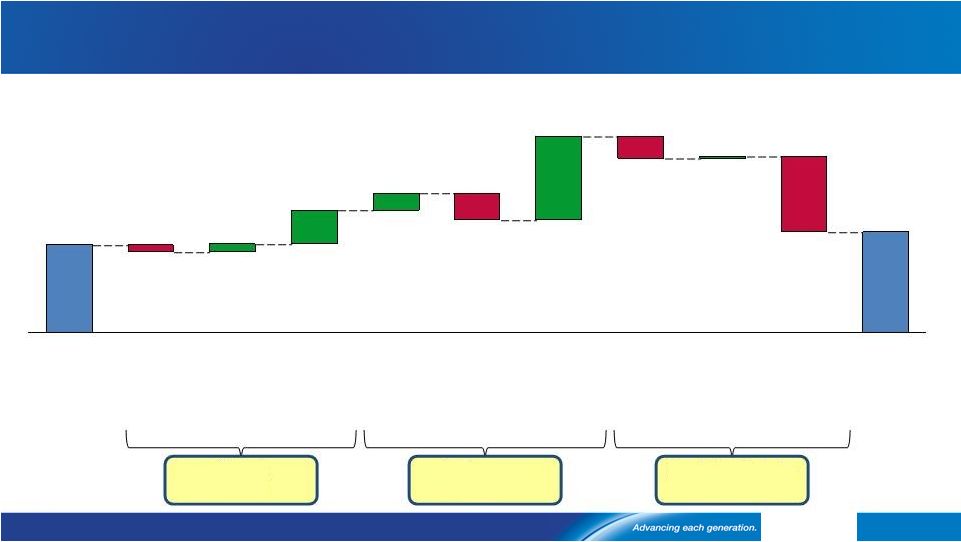 Adjusted Earnings Up nearly 16% on Performance and Market Factors See appendix for Adjusted Income reconciliation 9 [Alcoa logo] Net Income excluding Special Items ($ Millions) Market +$88 Performance +$184 Cost Headwinds -$238 $5 $209 $43 $85 $19 $250 $216 Raw Materials -$187 Cost Increases / Other 2Q 15 Volume Currency API LME -$16 2Q 14 Energy -$56 Productivity Price / Mix -$68 |
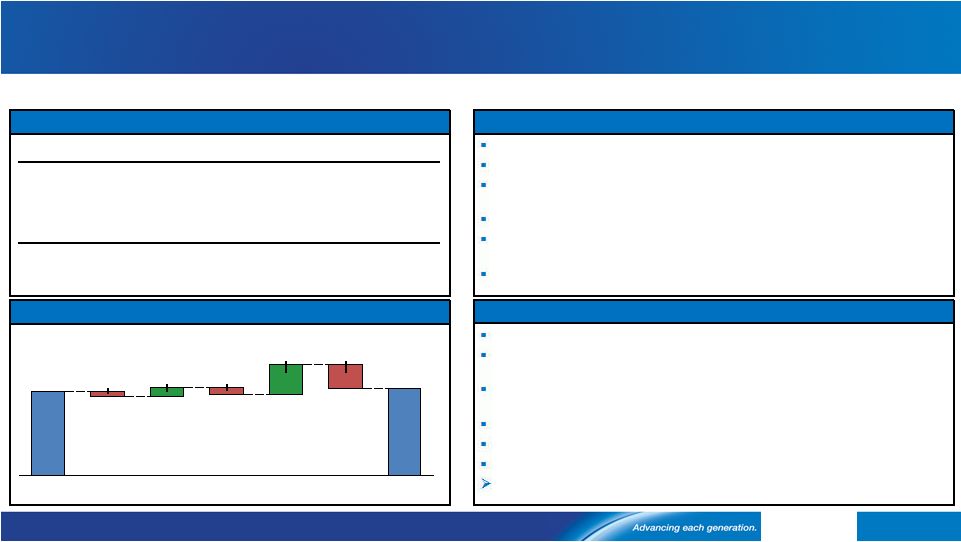 EPS: Record Second Quarter 10 1) Prior period amounts have been revised to remove impact of metal price lag. See appendix for additional information. See appendix for EBITDA reconciliation. [Alcoa logo] $ Millions 2Q 14 1Q 15* 2Q 15* 3 rd Party Revenue ($ Millions) 1,502 1,689 1,733 ATOI 1 ($ Millions) 202 194 210 EBITDA Margin 1 22.9% 20.4% 21.5% 3 rd Quarter Year-over-Year Outlook 2 nd Quarter ATOI Performance Bridge 2Q15 Actual and 3Q15 Outlook – Engineered Products and Solutions $71 $21 $210 $202 2Q 15 Cost Increase -$57 Productivity Price / Mix -$16 Volume Currency -$11 2Q 14 * Including Firth Rixson and TITAL. * EPS Base Business EBITDA Margin 1 : 21.8% for 1Q15, 22.6% for 2Q15 . Aerospace market remains strong Non-Residential Construction: Continued recovery in N.A., European weakness continues Continued strength in N.A. Heavy Duty Truck build rates; gradual recovery in Europe European summer slowdown across all sectors Firth Rixson Savannah press repair outage (33k ton) Share gains through innovation & productivity continue across all sectors ATOI is expected to increase 5%-10%, including unfavorable currency pressures of $9M Record second quarter ATOI, up 4% year-over-year Revenue up 15% year-over-year, EBITDA margin of 21.5% Revenue growth driven by acquisitions and share gains in aerospace, somewhat offset by currency Unfavorable currency ATOI impact of $11M, due to stronger U.S. dollar Firth Rixson Q2 EBITDA of $42M and EBITDA margin of 16.8% (2014A full year EBITDA margin of 15.7%) Year-over -year ATOI improvement driven by productivity, acquisitions, strong Aerospace and Commercial Transportation revenues 2 nd Quarter ATOI Results 2 nd Quarter Business Highlights |
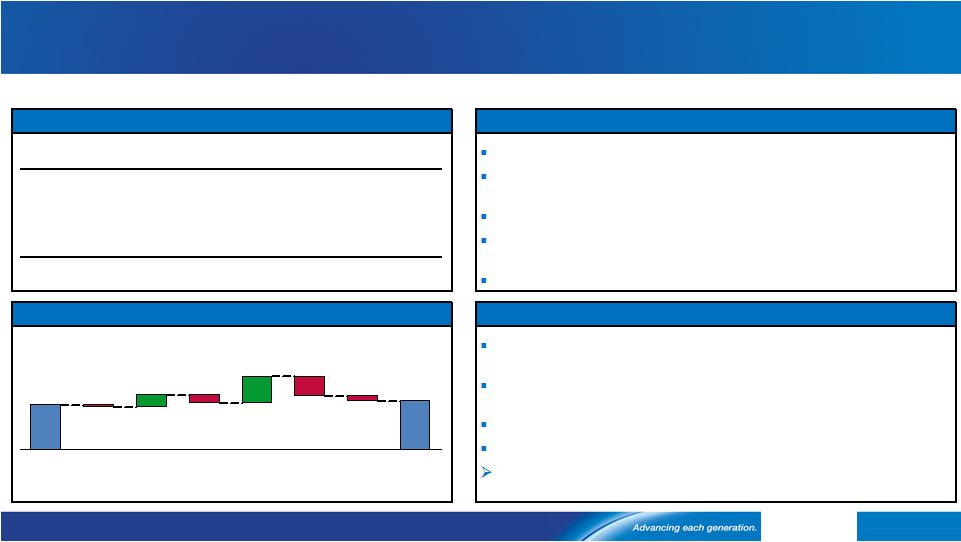 11 GRP: Stronger Results on Performance and Volume 1) Prior period amounts have been revised to remove impact of metal price lag. See appendix for additional information. See appendix for EBITDA reconciliation. [Alcoa logo] 2Q 14 1Q 15 2Q 15 3 rd Party Revenue ($ Millions) 1,860 1,621 1,668 ATOI ($ Millions) 70 54 76 EBITDA/MT 1 ($) 289 347 342 2Q15 Actual and 3Q15 Outlook – Global Rolled Products $ Millions 2Q15 $76 Portfolio Actions -$7 Cost Incr./ Other -$32 Prod - uctivity $42 Price / Mix -$12 Volume $19 Currency -$4 2Q14 $70 ATOI up 9% and EBITDA/MT up 18%, year-over-year Strong productivity and record Auto sheet revenue (up ~ 180% year- over-year) Unfavorable currency impacts of $4M Russia negatively impacted by metal premiums and continued pricing pressures in Packaging Increased investments in Micromill TM R&D and Saudi JV ramp-up Auto and Aero demand expected to remain strong, combined with seasonal volume increases in Packaging Metal premium negatively impacts Russia and Packaging price pressures expected to continue European summer slowdown in Commercial Transportation/Industrial Continued investments in the Micromill TM and Saudi JV ramp-up ATOI is expected to increase 5%-10%, assuming current currency rates 3 rd Quarter Year-over-Year Outlook 2 nd Quarter ATOI Performance Bridge 2 nd Quarter Business Highlights 2 nd Quarter ATOI Results 1 |
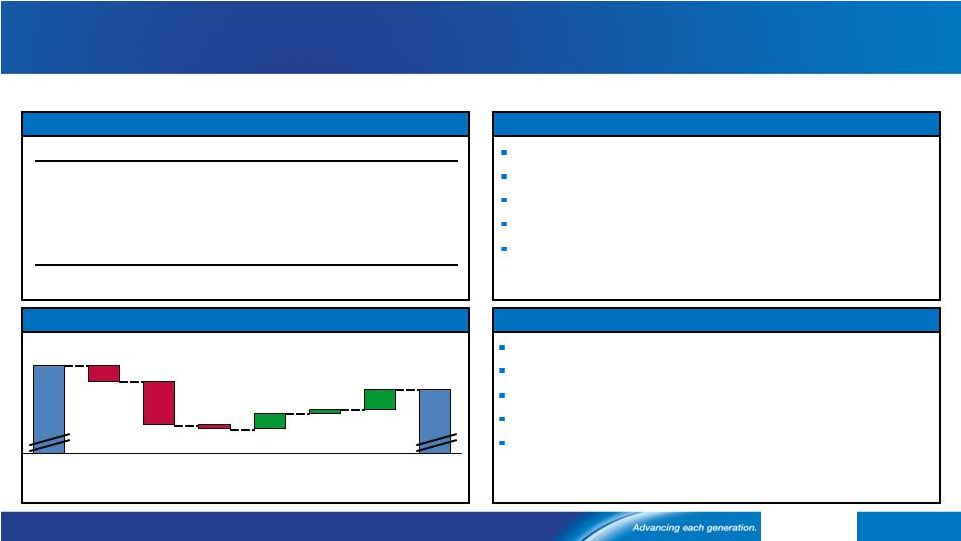 Alumina Delivers Best First Half ATOI since 2007 12 [Alcoa logo] $ Millions $5 $1 $4 -$1 API -$11 LME -$4 1Q15 $221 2Q15 $215 Prod- uctivity Price / Mix Volume Currency 2Q 14 1Q 15 2Q 15 Production (kmt) 4,077 3,933 3,977 3 rd Party Shipments (kmt) 2,361 2,538 2,706 3 rd Party Revenue ($ Millions) 761 887 924 3 rd Party Price ($/MT) 318 344 337 ATOI ($ Millions) 38 221 215 2 Quarter ATOI Results 2 nd Quarter Business Highlights 2 nd Quarter ATOI Performance Bridge 3 rd Quarter Sequential Outlook 2Q15 Actual and 3Q15 Outlook – Alumina ~75% Best first half ATOI since 2007 Third-party shipments up, primarily in Australia and Spain Unfavorable API, LME and currency movements Benefit from volme increases and productivity improvements Gross productivity up $46M year-over-year of 3 rd party shipments on API or spot pricing for 2015 API pricing follows 30 - day lag; LME pricing follows 60 - day lag Production up 40 kmt due to one additional day in the quarter Saudi Arabia refinery reaching stability, earnings up $5M Productivity and volume improvements more than offset energy and cost increases by $15M nd |
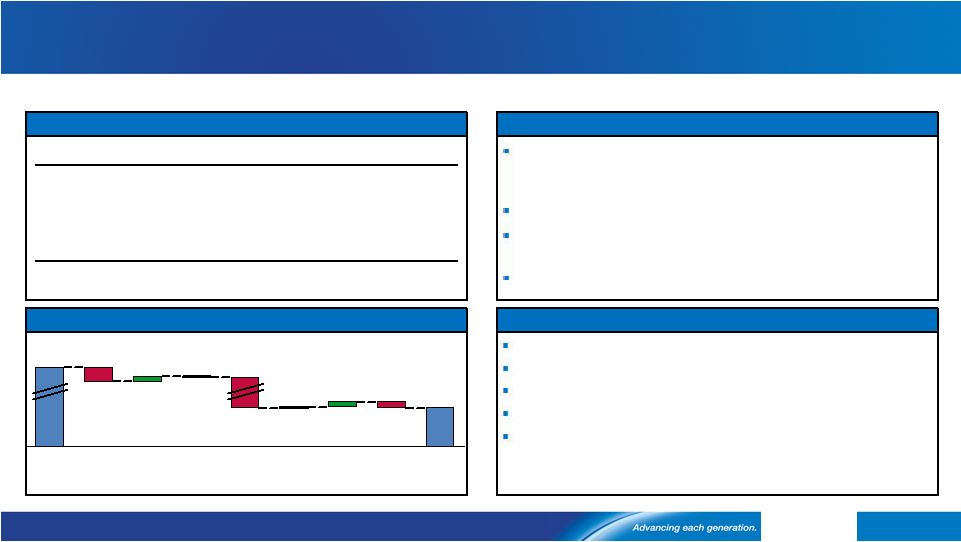 Primary Metals Resilient Despite Strong Headwinds 13 1) Based on published prices as of July 8, 2015 for premiums; Midwest = 8.5c/lb, Euro Duty Paid = $190/MT, CIF Japan = $100/MT. [Alcoa logo] $ Millions 2Q15 Actual and 3Q15 Outlook – Primary Metals $67 $10 $1 $8 LME -$24 1Q15 $187 2Q15 Cost Incr. / Other -$12 Energy Prod - uctivity Price / Mix -$102 Volume -$1 API Realized price declines ~10% sequentially, largely driven by lower regional premiums; ~22% drop in Midwest Transaction Price YTD Production down due to São Luís curtailment Favorable alumina and energy costs; cost increases primarily from closed/curtailed locations Gross productivity up $56M year-over-year 2Q 14 1Q 15 2Q 15 Production (kmt) 795 711 701 3 rd Party Shipments (kmt) 638 589 630 3 rd Party Revenue ($ Millions) 1,659 1,572 1,534 3 rd Party Price ($/MT) 2,291 2,420 2,180 ATOI ($ Millions) 97 187 67 2 nd Quarter ATOI Results 2 nd Quarter Business Highlights 2 nd Quarter ATOI Performance Bridge 3 rd Quarter Sequential Outlook Pricing follows a 15-day lag to LME Production up 10 kmt due to one additional day in the quarter Regional premium decline impact of $70M 1 Brazil energy sales improve by $10M Productivity and higher volume more than offset energy and cost increases by $8M |
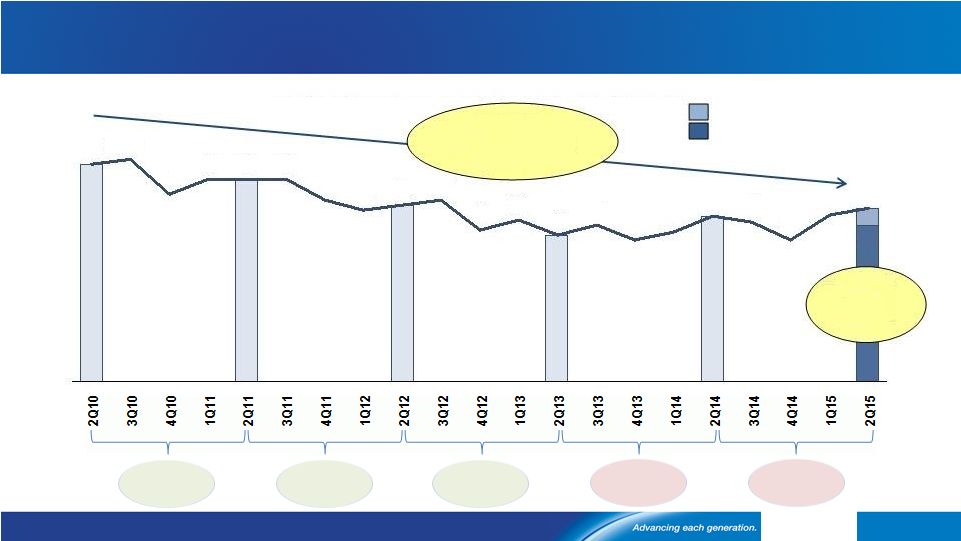 Base Business DWC Improved Year-over-Year, Acquisitions Add 3 days FCF: Free Cash Flow. See appendix for days working capital reconciliation 14 [Alcoa logo] 5 days lower Average Days Working Capital since Second Quarter 2010 3 days lower 34 33 28 32 33 30 28 31 29 32 30 36 35 34 36 40 40 40 37 44 43 6 days lower 1 day higher Acquisitions (3 days) Alcoa ex-Acquisitions (31 days) 12 days from base business >$700M FCF 2 days lower from base business 4 days higher 31 |
 2 nd Quarter 2015 Cash Flow Overview 15 See appendix for Free Cash Flow reconciliation [Alcoa logo] ($ Millions) 2Q14 1Q15 2Q15 Net Income before Noncontrolling Interests $129 $255 $207 DD&A $350 $321 $320 Change in Working Capital $31 ($595) $44 Pension Expense in Excess of Contributions ($82) $37 $37 Australian Gas Prepayment - - ($300) Other Adjustments $90 ($193) $164 Cash from Operations $518 ($175) $472 Dividends to Shareholders ($36) ($54) ($55) Change in Debt $296 $24 ($38) $4 ($29) ($42) Other Financing Activities $17 $33 $2 Cash from Financing Activities $281 ($26) ($133) Capital Expenditures ($258) ($247) ($267) Acquisitions/Divestitures/Asset Sales $1 ($212) $67 Other Investing Activities ($29) ($6) ($20) Cash from Investing Activities ($286) ($465) ($220) Free Cash Flow $260 ($422) $205 Cash on Hand $1,183 $1,191 $1,311 2Q14, 1Q15 and 2Q15 Cash Flow Net (Distributions)/Contributions from Noncontrolling Interests |
 16 LTM = last twelve months; See appendix for Net Debt and LTM EBITDA reconciliations. Maintained Strong Balance Sheet [Alcoa logo] 2Q15 8,789 7,478 1Q15 8,817 7,626 2014 8,852 6,975 2013 8,319 6,882 2012 8,829 6,968 2011 9,371 7,432 2010 9,165 7,622 ($Millions) Debt-to-LTM EBITDA Net Debt Cash 3.27 3.39 2.87 Debt, Net Debt, and Debt-to-LTM EBITDA 2.49 4.20 2.22 2.12 1,543 1,939 1,861 1,437 1,877 1,191 1,311 |
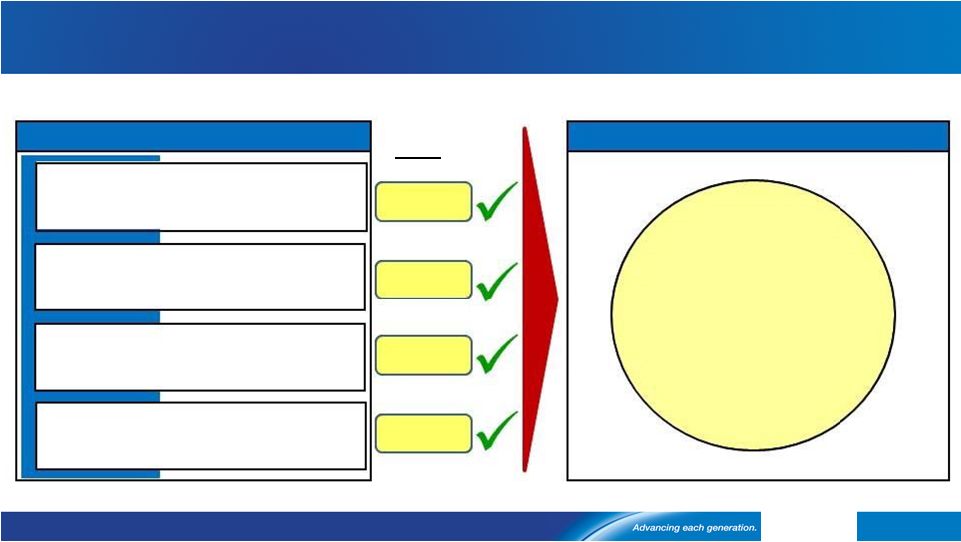 17 Maintaining Our 2015 Financial Targets [Alcoa logo] Attain 2.25 to 2.75 Debt-to-EBITDA Manage Return-Seeking Capital of $750M Drive Productivity Gains of $900M Overarching 2015 Financial Target Taking the Right Actions Control Sustaining Capital of $725M Generate $500M Free Cash Flow $562M YTD: $283M $240M 2.12 2015 Annual Financial Targets and Year-to-Date Results |
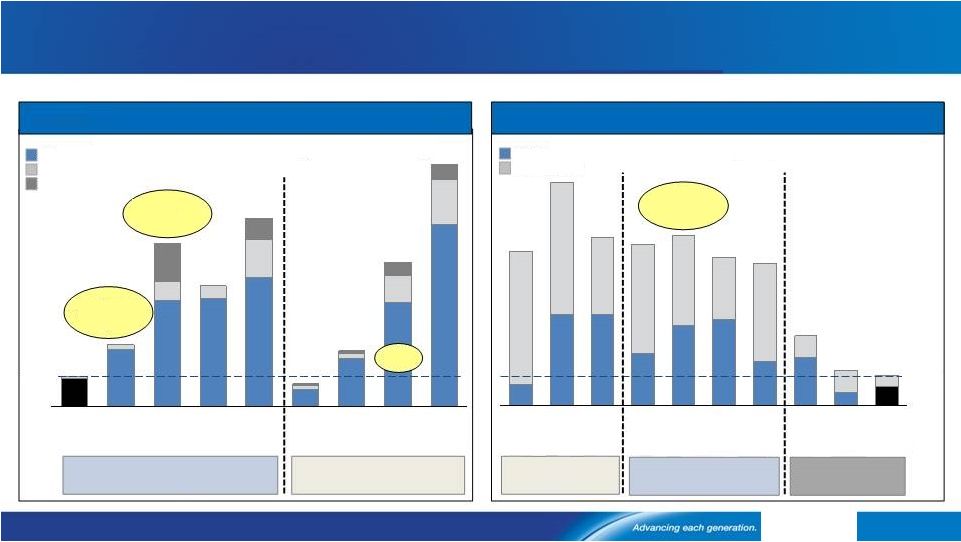
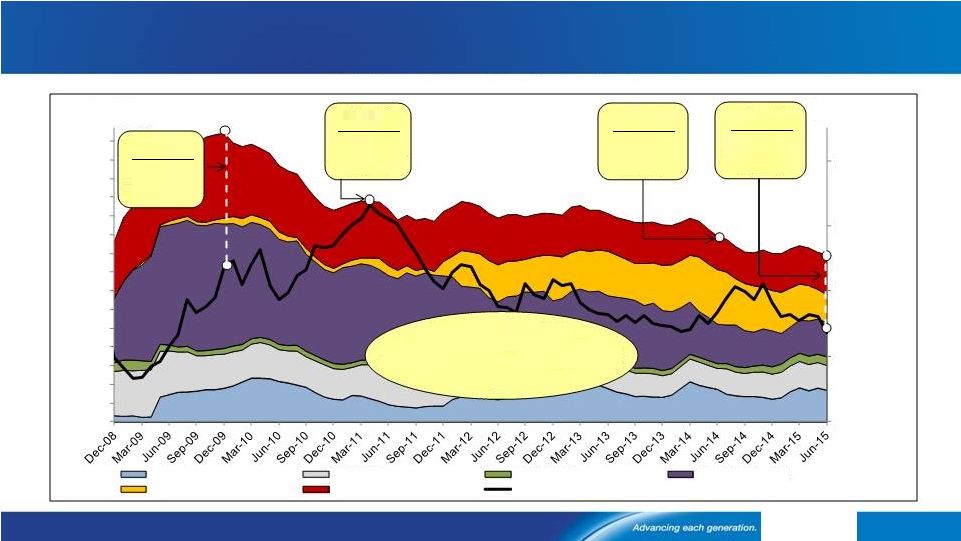
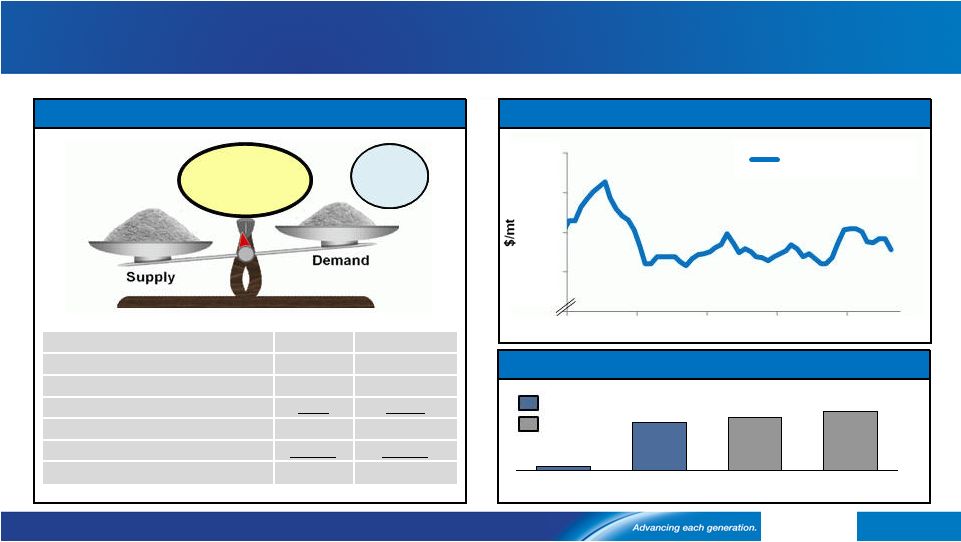 Alumina Surplus Tightens; Pricing Steady 18 Source: Alcoa analysis, Brook Hunt, CRU, CNIA, NBS, Chinese Customs 1) Smelter Grade Alumina % of 3 rd party shipments on API/Spot pricing. [Alcoa logo] $400 $450 Dec-10 Dec-11 Dec-12 Dec-13 Dec-14 Alumina Price Index 2015E Alumina Supply/Demand, Alumina Price Index (API) and % Third-Party Shipments Alumina Price Index 2016E 84% 2014 68% 2010 5% 2015E 75% API/Spot 1 as % of 3 rd Party Shipments Forecast Actual 2015E Alumina Supply/Demand Balance ’000 mt China Rest of World 2015 Production 51,567 54,921 2015 Production to be added 5,830 2,523 2015 Capacity curtailed or restarted 0 (350) Imports/(exports) 3,200 (3,200) Total supply 60,597 53,894 Demand (60,597) (51,466) Net Balance 0 2,428 1Q15 Surplus 2,699 Surplus 2,428 $300 $350 |
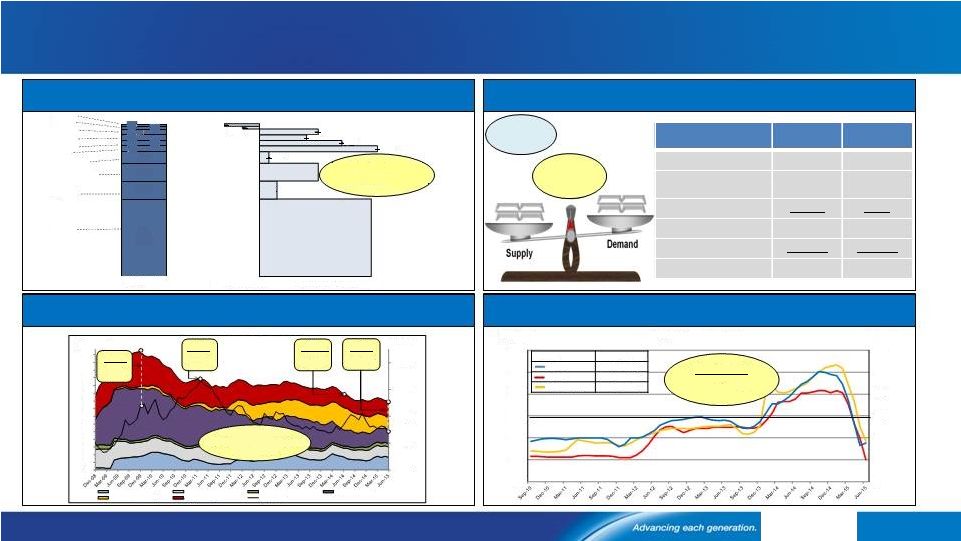 6.5% 2015E Demand Growth Aluminum Market Fundamentals are Mixed 2015E Aluminum Supply/Demand Balance Global Inventories Fall to 62 days; -8 days YoY Regional Premiums through 2Q 2015 See appendix for full scale charts 19 ’000 mt China Rest of World 2015 Production 29,579 26,280 2015 Production to be added 2,819 719 2015 Capacity curtailed (1,000) (155) Total Supply 31,398 26,844 Demand (29,171) (28,309) Net Balance 2,227 (1,465) 1Q15 Surplus 326 Surplus 762 [Alcoa logo] 29.2 6.7 6.7 4.3 2.3 2.1 2.1 1.0 0.9 4% 1.5% 5% 9.5% 5% 1% 10% 7% -1% -3% 57.5 mmt 1 Other includes Africa, E. Europe, Latin America ex Brazil, and Oceania 2015E Primary Aluminum Consumption (mmt), Annualized Growth (%) China Europe North America North Asia India SE Asia MENA Russia Brazil Other ¹ 2.1 2015 demand +6.5% World ex China +3.5% $1,000 $1,500 $2,000 $2,500 $3,000 0 7 14 21 28 35 42 49 56 63 70 77 84 91 98 105 China Incl SRB Producer Japan Port LME On Warrant Cancelled Warrants Off Exchange LME Cash Days of 108 days LME Cash Price $2,180/MT Days of Consumption 83 days LME Cash Price $2,663/MT Global Inventories -46 days from the ’09 peak; -8 days YoY Days of Consumption Days of 62 days LME Cash Price $1,683/MT $ per metric ton Global inventories vs. LME price over time $ Days of 70days LME Cash Price $1,834/MT $0 $100 $200 $300 $400 $500 $600 $0 $100 $200 $300 $400 $500 $600 Regional Premiums over time $ per metric ton $ per metric ton Region 2Q15Average Europe $203/MT Japan $184/MT Midwest USA $264/MT Average 2Q15 vs. 2Q14 Europe -48% Japan -50% Midwest USA -36% Consumption Consumption Consumption |
 Klaus Kleinfeld Chairman and Chief Executive Officer 20 July 8, 2015 [Alcoa logo] |
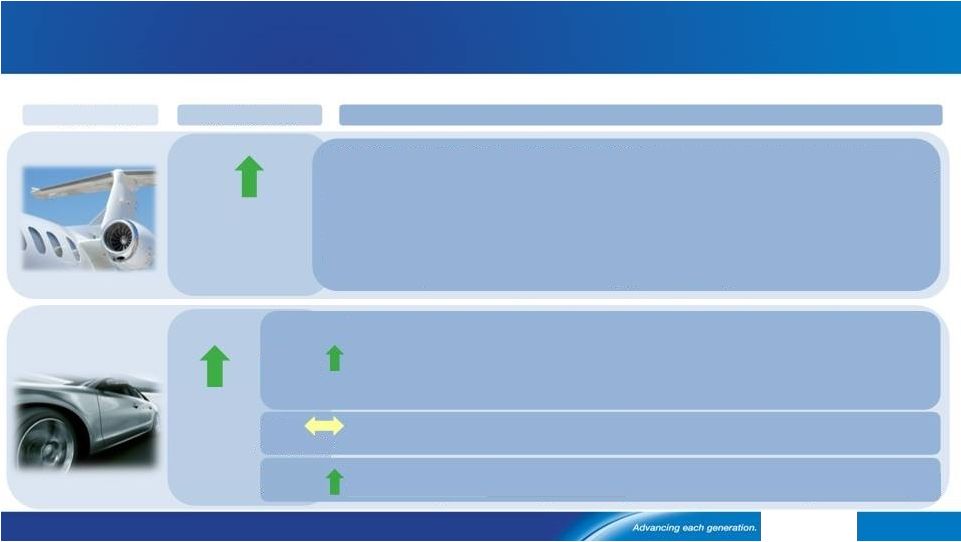 Aerospace Remains Strong; Steady Growth in Automotive Source: Alcoa analysis 1) International Air Transport Association 2015 Expectations N.A. Auto sales, inventory, incentives, avg. transaction price as of Jun. 2015; Production as of May 2015. Europe and China YTD data as of May 2015 21 [Alcoa logo] End Market 2015 Growth Global and Regional Commentary Aerospace 8% to 9% Global sales growth • Shift from 2015 to 2016 on slower new platform ramp-up (mainly A350 and CSeries); 2016/2017 growth rates nearly double prior fcst.(+8% 2016 vs. +4-5% prior; +13% 2017 vs. 6% prior) • Paris Air Show + Chinese Premier Li visit to France secured $125B orders/commitments for Airbus and Boeing (exceeding the $116B during Farnborough 2014) • Strong Commercial Jet Order Book: >9 Years of Production at 2014 delivery rates • Solid Airline Fundamentals 1 : +6.7% Passenger and +5.5% Cargo Demand, Dramatic Improvement in Airline Profitability ($29B in 2015E) Alcoa End Markets: Current Assessment of 2015 vs. 2014 Automotive 2% to 4% Global production growth NA 1% to 4% EU -1% to +3% China 5% to 8% • Strong Sales: U.S. sales +4.4% YTD (8.5M vehicles), led by Light Trucks • Production Up: +1.7% YTD • Inventory Flat: 60 days, +1 day YoY (industry target is 60-65 days) • Incentives Up: +4.7% YoY ($2,877/unit), driven by Passenger Cars +12.4% YoY • Avg. Transaction Price Up: +2.5% YoY at $33,340,driven by Light Trucks • Production Flat: +1.3% YTD; W. Eur improves, offsetting further decline in Russia • Registrations: +6.8% YTD ; Exports +1.6% vs. prior year (2015 forecast) • Production: +5.1% YTD (9.9M vehicles) ; Sales +4.0% YTD • Moderated growth driven by increasing middle class, affordability, and Clean Air Act |
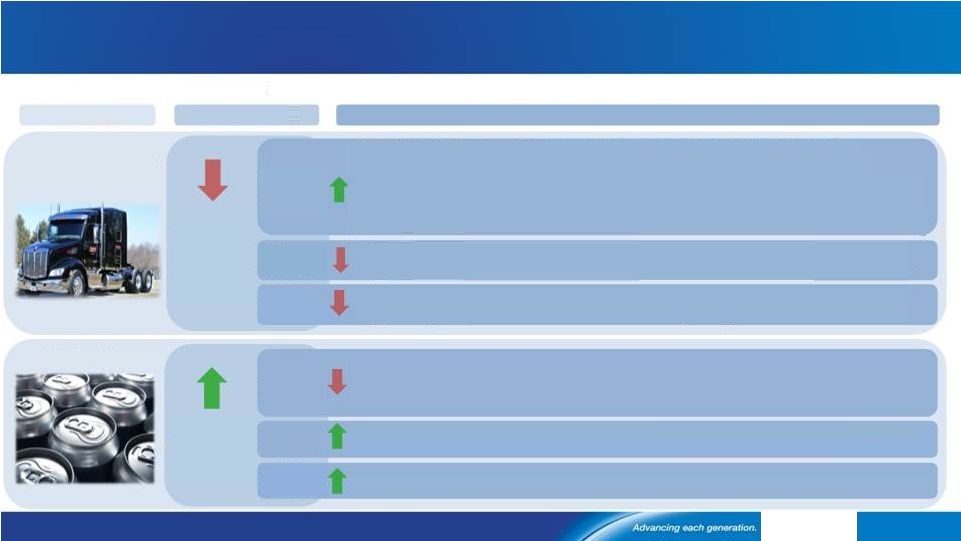 Heavy Duty Truck – Strong U.S., Weak China; Packaging Stable 22 Source: Alcoa analysis. Heavy Duty Truck: YTD and YoY data for production, order book, freight miles, and EU registrations as of May 2015; YTD orders data as of June 2015. Packaging: YTD figures as of May 2015. [Alcoa logo] End Market 2015 Growth Global and Regional Commentary Packaging 2% to 3% Global sales growth NA -1% to -2% EU 1% to 2% China 8% to 12% • Demand decline: Weakness (-2.5% YTD) in Carbonated Soft Drinks (CSD) • Moderate growth in Beer Segment (+0.5% YTD) to partially offset CSD • Growth led by Steel to Aluminum conversion in Western Europe, partially offset by declines in Eastern Europe • Growth driven by continued penetration of Aluminum in Beer segment Alcoa End Markets: Current Assessment of 2015 vs. 2014 Heavy Duty Truck and Trailer NA 9% to 11% EU -2% to 0% China -14% to -16% • OEM supply chain supporting higher than expected build rates in 2Q15 • Peaking Production: +18.7% YTD at 137k trucks • Large Order Book: +42% YoY at 169k trucks; Remains above 10 year avg of 101k • Decreasing Orders: -8.6% YTD, after record 4Q14 orders • Solid Fundamentals: +2.3% Freight ton miles (YTD); +54% Fleet profitability (1Q15 YoY) -4% to -6% Global production decline • Increasing Production: W.Eur +5.2% YTD • Improving conditions in W.Eur: Orders +12.2% YTD, Registrations +17.8% YTD • Production Down: -34.1% YTD; Strong pull-ahead demand in 2014 due to stage IV regulations; 2H15 forecasted to normalize from regulatory conditions |
 Solid Commercial B&C Growth; Global Airfoil Market Improves Source: Alcoa analysis B&C = Building and construction 23 [Alcoa logo] End Market 2015 Growth Global and Regional Commentary Industrial Gas Turbines Building and Construction 1% to 3% Global airfoil market growth NA 4% to 5% EU -2% to -3% China 6% to 8% 5% to 7% Global sales growth Alcoa End Markets: Current Assessment of 2015 vs. 2014 Positive Early Indicators: • Non-Residential Contracts Awarded: +13.6% in May (mean of 12-month rolling average) • Architectural Billing Index: Positive at 51.9 in May • Case-Shiller Home Price Index: +4.1% YoY Mar; Growth moderated since 1Q14 (10%+) • Decline as weakness continues, outlook varies across markets • Market drivers continue to be relatively stable • Slower industrial production growth at +6.1% YoY May • Market moving towards higher value product as customers develop new, high efficiency turbines with advanced technology • U.S. (60 Hz) gas-fired generation +19.5% YTD April driving strong demand for spares and component upgrades on existing turbines • Tempered by EU (50 Hz) demand which remains soft due to subsidized renewables |
 Transforming Alcoa – Creating Compelling Sustainable Value 24 [Alcoa logo] Building a Lightweight Multi-Material Innovation Powerhouse Creating a Globally Competitive Commodity Business Increasing share in exciting growth markets e.g., aerospace, automotive, heavy duty truck and trailer, building and construction Full pipeline of innovative products and solutions Using all growth levers e.g., Alcoa Advantage Shifting mix to higher value-add Expanding multi-material, technology and process expertise Increasing competitiveness, mitigating downside risk Optimizing the casthouse value-add portfolio Shifting pricing to reflect market fundamentals Continuing to drive productivity improvements |
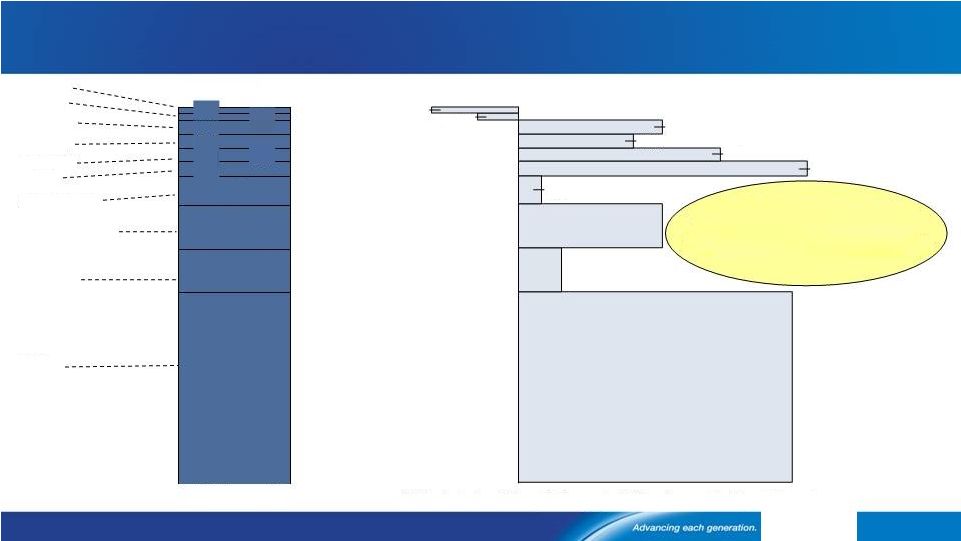
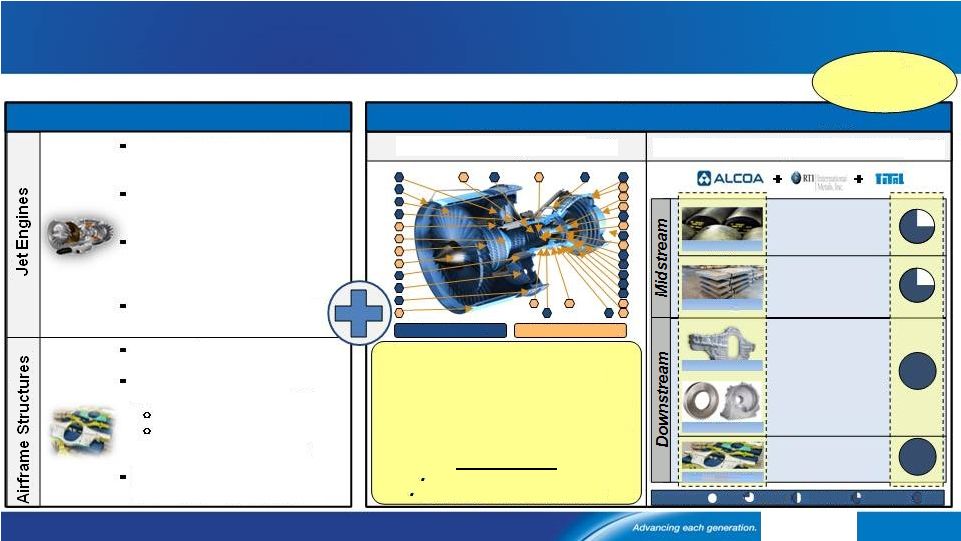 Investments Position Alcoa as a Premier Aerospace Solutions Provider FR = Firth Rixson. 1) Estimated completion for Hampton/LaPorte by 4Q 2015, Whitehall HIP in 2016 and Davenport in 2017. 2) Pro forma includes EPS, FR, Tital and RTI. 3) RTI close expected by end of July, subject to RTI shareholder approval. 4)Represents mid & downstream capabilities, not market position. 25 [Alcoa logo] Organic and Inorganic Aerospace Investments Increase Multi-Material, Multi-Platform Offerings Organic Growth Through Innovation Hampton 1 : Enhanced blade performance; cuts blade weight by 20%, improved aerodynamics LaPorte 1 : Expands Ni structural castings to large commercial jet engines Whitehall 1 : Advanced coatings, high-temperature protection; hot- isostatic press for Ti, Ni, and 3D- printed jet engine parts Lafayette: World’s first Al-Li fan blade Davenport 1 : World’s largest stretcher for monolithic ribs Lafayette: World’s largest Al-Li casthouse (20 kmt) Grows Al-Li capabilities Largest Al-Li ingot; slabs ~50% larger than nearest competitor Carson: Flite-tite ® fasteners, lightning-strike management Melting (Ingot, Cast Slab) Billetizing, Rolling (Mill Products) Conversion (Closed-Die Forging, Extruding, Investment Casting) Machining, Subassembly INGOT PLATE FORGING MACHINING CASTINGS FR Doubles Engine Content Alcoa Products Firth Rixson Products RTI 3 +TITAL Complement Value Chain 4 None Limited Moderate Significant Full Capabilities: Inorganic Investments in Robust Aerospace Market 2014 Pro forma 2 Aerospace Revenue ~$5.6B Can Produce >90% of Structural and Rotating Components (e.g., turbine blades and vanes, structural castings, rings, discs, shafts, fasteners and front fan blades) Multi-Material Ni and Ti-Al in hot section Ti, Al and Steel in cold section |
 Positioned on Every Large Commercial Aircraft, Regardless of Material 26 CFRP = Carbon Fiber Reinforced Polymer. 1) A320NEO and 737MAX aircrafts as well as GE Leap-X engine not included as contract negotiations ongoing. 2) Estimated RTI content; RTI close expected by end of July, subject to RTI shareholder approval. [Alcoa logo] Boeing Airbus B787 A380 B747-8 A350 A320 B737 B767 A330 B777 Indexed Revenue by Aircraft Type and Key Engine Type 1 Strong Revenue Generator on All Platforms Pro forma Revenue / Aircraft (Indexed to B737) 100% CFRP Intensive PW 1100G (A320N) GE90 (B777) V2500 (A320C) GEnx 1B (B787) GEnx 2B (B747) Trent 900 (A380) Trent XWB (A350) Trent 1000 (B787) GP7200 (A380) CFM56 (B737) (A320C) Airbus Twin Aisle Better Coverage of Key Engine Platforms Pro forma Revenue / Engine (Indexed to CFM56) 100% Boeing Twin Aisle Single Aisle Alcoa Firth Rixson B787 (CFRP): ~$6.4M Rev content / shipset B767(metallic): ~$2.4M Rev content / shipset ~$660k Rev content / engine on 787 GEnx 1B Alcoa Firth Rixson RTI 2 |
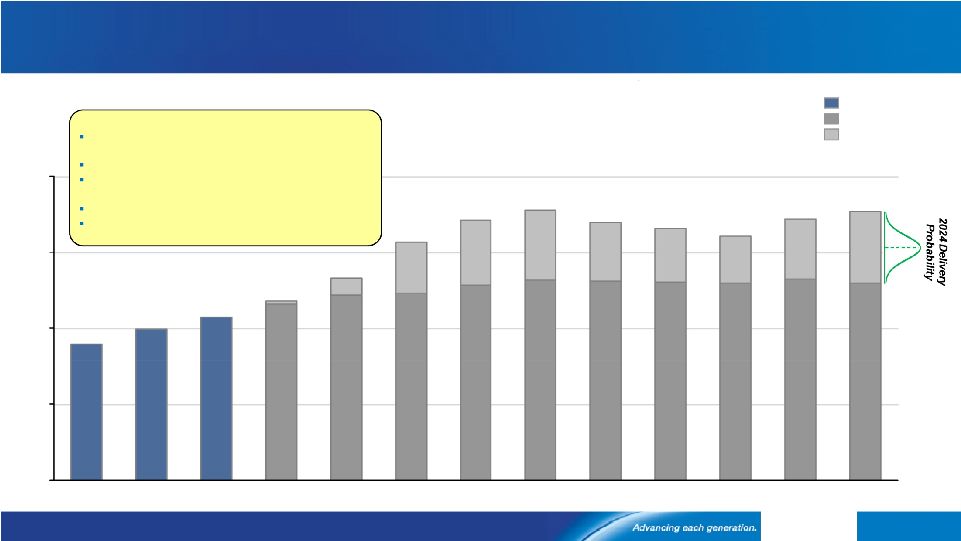 Robust Aerospace Fundamentals 27 Source: The Airline Monitor June 2015, Teal Group April 2015, and Forecast International April 2015. Forecasted values are in 2015 constant dollars. 1) Boeing Current Market Outlook 2015. 2) The Airline Monitor June 2015. [Alcoa logo] $150 $200 $100 $0 $50 2013 2014 2015 2012 2017 2016 2021 2022 2020 2023 2024 2018 2019 ($B) Actual Min. forecast Max. forecast Strong Aerospace Fundamentals “Emerging Asia” adds 100M new passengers each year and drives 5% CAGR in travel demand (2014-2034) Lower operating costs of Next Gen Aircrafts (e.g., +20% fuel efficiency, -30% maintenance costs) More diversified aircraft customer base (Past: primarily U.S. and European carriers) Aircraft Retirements ~600 aircrafts p.a. from 2015-2024 >9 year production order book at 2014 delivery rates 1 2 Commercial Jet Deliveries of 2012-2014 Actual and 2015-2024 3 Party Forecasts ($B) rd |
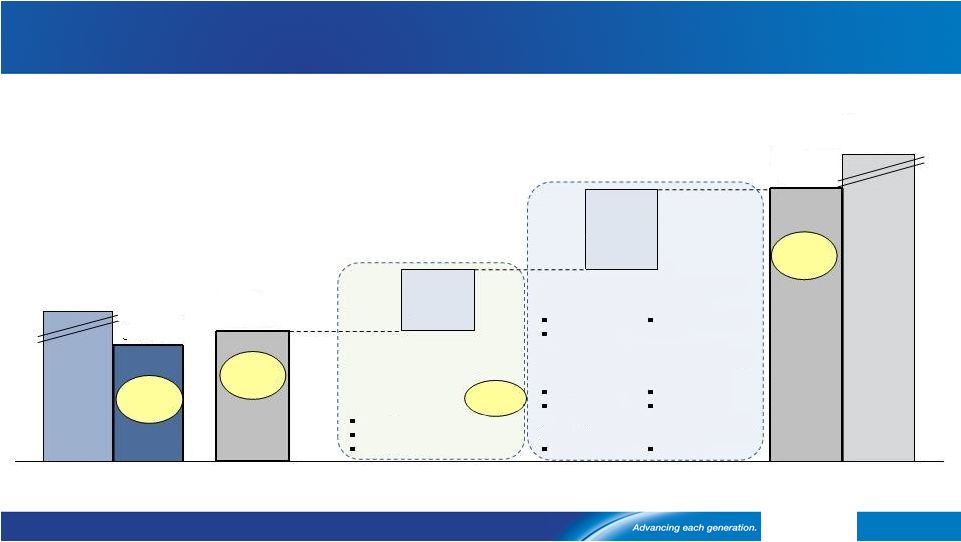 Firth Rixson Integration – On Track to Achieve 2016 Targets 28 1) Firth Rixson unaudited financials. 2) 2Q 2015 Actual. 3) Deployed versus 2016 target, gross synergies of $44M offset by $4M integration costs. [Alcoa logo] Market & Share Gains EBITDA $100-110M Productivity & Synergies EBITDA $70-80M 2Q 2015 Annualized Run Rate EBITDA $168M 2014 Actual and 2016 Target Revenue and EBITDA and 2Q 2015 EBITDA Annualized Run Rate to 2016 EBITDA Target Acceleration of demand for Next Gen Engine Components in 2016 Targeted Rings, Forgings, and Metals growth opportunities across Slower than expected recovery in 2016 Stand alone Incremental Productivity Accelerated capture of Synergies Operational productivity Overhead cost reductions Procurement savings GE Leap-X P&W GTF RR Trent XWB Oil & Gas Mining Airframe Jet engine Mining Oil & Gas 2014A EBITDA $152M 1 Revenue $1.0B 2016 Target Revenue $1.6B EBITDA $350M 15.7% EBITDA margin 16.8% EBITDA margin 2 ~190% deployed 3 21.9% EBITDA margin |
 RTI Acquisition On Track for End of July Close 1) Fixed exchange ratio based on market close price as of March 6, 2015; Enterprise value as of March 6, 2015. 2) As a result of the acquisition, Alcoa assumes $114.4M convertible senior notes due 2015 of which holders have the right to elect to convert to common stock within 35 trading days post-close. 3) As of July 8, based on current market conditions and phased-in synergies . 4) Figure reflects net synergies after $9M integration costs. 29 [Alcoa logo] Net Synergies $100M 4 30% in year 2 100% in year 4 Enhances Offerings: Expands Ti, Value-Add Solutions Identified 2019 RTI Gross Synergies Strategic Merits Transaction Overview Targeting End of July Close Highlights of RTI Acquisition, Closing Progress and Synergy Preparation 2019 Target: $1.2B revenue 25% EBITDA margin Builds value - add portfolio; Expands further into high-performance metals Expands range of midstream and downstream titanium supply chain capabilities Captures growth from long-term agreements and Advanced Technologies Fixed Exchange Ratio: 2.8315 AA shares per RTI share Enterprise Value : $1.5B reflecting: o ~ $1.3B equity issuance [~89M shares] o $517M convertible senior notes (2015 2 & 2019) o $330M of RTI cash on hand Accretion: 1 full year in 2017 3 Returns: In excess of Cost of Capital U.S. RTI Shareholder Vote (July 21, 2015) Europe Approvals on track: Overhead Cost Reductions $20M Procurement Savings $20M Growth $25M Operational Productivity $44M Expand selection of machined parts (e.g., plate, forgings, extrusions) Migrate from Ti ingot directed buy programs Offer Ti-Al for high-growth engine components Integrate Shared Services Center of Excellence Leverage Alcoa’s $18B global spend ( e.g., commodities, production, maintenance supplies) Standardize payment terms Maximize internal metal supply Decrease outsourced machining Increase utilization of capacity (e.g., melting, billetizing, rolling, machining) Optimize revert metal loop Finance Credit Information Technology Human Resources 1 1 st |
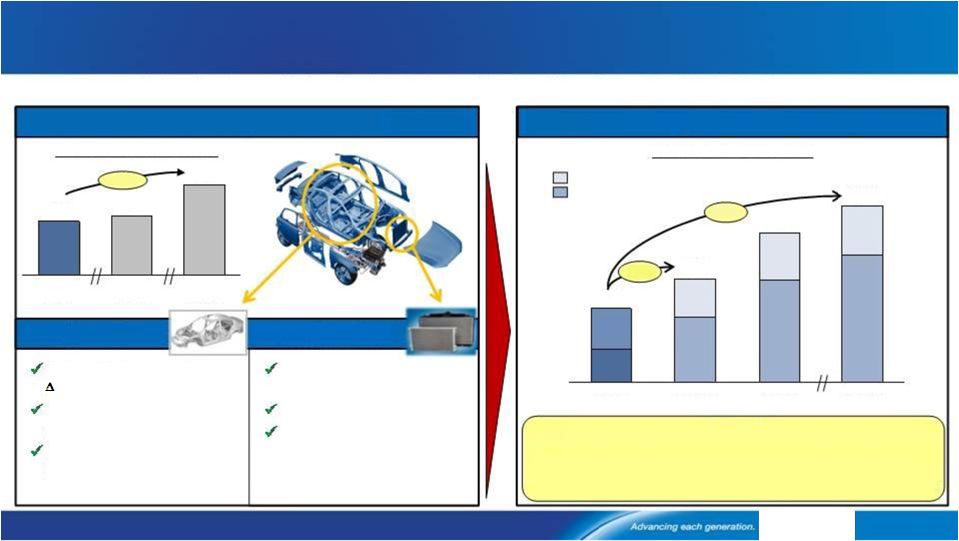 GRP: Lightweighting Trend Drives Substantial Automotive Growth 30 GRP = Global Rolled Products. CAFE=Corporate Average Fuel Economy. 1) Annual Savings = ((15,000 Hwy Miles/Yr ÷ 17 Hwy MPG) – (15,000 Hwy Miles/Yr ÷ 26 Hwy MPG)) x $3/gal. 2) Alcoa Analysis and Environmental Protection Agency, October 2014. [Alcoa logo] Automotive Demand Drivers for Auto & Brazing Sheet and Alcoa Automotive 2014-2018 Revenue Reduced heat exchanger size and weight up to 25% ~3% new auto sales growth Higher content growth per vehicle from adoption of turbo charged engines: 80% by 2025 from 17% in 2013 2 Automotive Revenue ($M) 2018E 1,800 2016E 1,530 2015E 1,060 2014A 750 Reduced fuel consumption: 9 MPG $916/yr savings 1 Additional payload / towing capacity (e.g., 700 lbs on F-150) Faster acceleration; Improved braking distance Auto & Brazing Sheet: Profitable Growth U.S. CAFE Regulations (MPG) 54.5 35.5 32.2 2025E 2016E 2014 Result: •Auto Sheet Shipments: ~65% CAGR (2013-2016E) •Automotive Revenue: 10% of GRP in 2014A to 20% in 2016E •Brazing Sheet Revenue Doubled and Profits Tripled (2011-2014) +69% Auto Sheet Brazing Sheet Auto Sheet Brazing Sheet 1.4x 2.4x OEMs Need Fuel Economy and Consumer Benefits |
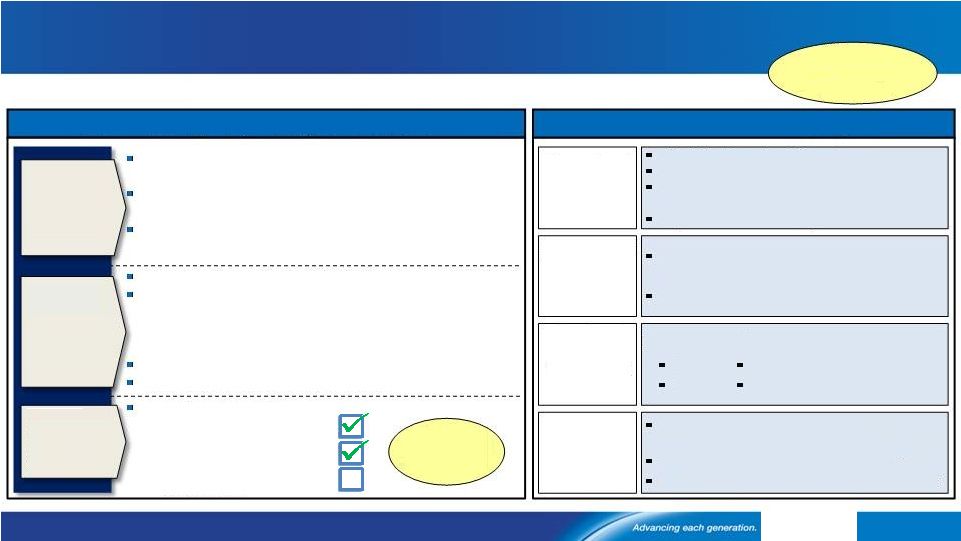
 GPP: New Global Business Structure Maximizing Profits 31 GPP=Global Primary Products. BPA = Bonneville Power Administration. Cost Curve targets represent percentile. Source: CRU and Alcoa analysis. 1) Announced March 6, 2015. 2) Relative to market cash cost curve from 2010-2014. 3) Reflects Alcoa’s change in production cash cost; 3Q08-2Q15: $435/mt lower cash cost vs. $362/mt lower cash cost from 3Q08-3Q14. [Alcoa logo] 2010 and 2014 Actual and 2016 Target Cost Curve Positions and Global Business Unit 2Q15 Updates MINING REFINING CASTING SMELTING ENERGY Innovative new foundry alloys for automotive launched in April 2015 Upgrading Baie- Comeau casthouse to meet automotive demand Curtailed Suralco Completed 12-year Western Australia Gas Supply Contract 1.1 MMT Saudi JV 2015 production on track $15/mt lower on cost curve 2 Revised Intalco BPA power contract Announced permanent closure of Anglesea power station & coal mine (by 8/31/2015) Curtailed São Luís Announced permanent closure of Poços 740 kmt Saudi JV 2015 production on track $50/mt lower on cost curve 2 $435/mt reduced cost 3 Saudi JV mine 99% complete Shipped Western Australian bauxite samples to 6 customers for testing 12-month Capacity Review 1 2.8 MMT Refining and 500 Kmt Smelting Explore opportunities in external markets Leverage assets; Secure long-term solutions Improve competitiveness; Transform pricing Lower cost; Enhance operational excellence Grow value-add product mix Alumina Primary Metals 2010 30 th 2014 25 th 2016 21 st 2010 2014 2016 Target -9% points cost position Target -13% points cost position 43 rd 38 th 51 st |
 Capture Value Add Market Share from Our Investments Drive Continued Upstream Competitiveness Continue to Deliver Improved Operational Results 32 Creating Sustainable Value for Shareholders [Alcoa logo] |
 Nahla Azmy Vice President, Investor Relations Alcoa 390 Park Avenue New York, NY 10022-4608 Telephone: (212) 836-2674 Email: nahla.azmy@alcoa.com www.alcoa.com Additional Information 33 [Alcoa logo] |
 Annual Sensitivity Summary Currency Annual Net Income Sensitivity +/- $100/MT = +/- $190 million LME Aluminum Annual Net Income Sensitivity Australian $ +/- $11 million per 0.01 change in USD / AUD Brazilian $ +/- $ 1 million per 0.01 change in BRL / USD Euro € +/- $ 2 million per 0.01 change in USD / EUR Canadian $ +/- $ 4 million per 0.01 change in CAD / USD Norwegian Kroner +/- $ 4 million per 0.10 change in NOK / USD 34 +/- $10/MT = +/- $20 million API/Spot Alumina Annual Net Income Sensitivity [Alcoa logo] |
 Composition of Regional Premium Pricing Convention 2015E Shipments Regional Premiums Estimated Pricing Convention 50% Midwest – Platts 15-day lag 35% Rotterdam DDP – Metal Bulletin 45-day lag 10% CIF Japan – Platts Month prior to Quarter start 5% Negotiated Annual 35 [Alcoa logo] |
 36 Second Quarter 2015 Supplemental Segment Bridges EPS = Engineered Products and Solutions GRP = Global Rolled Products [Alcoa logo] $ Millions $ Millions $ Millions $ Millions EPS Sequential Quarter Bridge GRP Sequential Quarter Bridge Energy $10 Prod- uctivity $46 Price / Mix $3 Volume $1 Currency $95 2Q15 $215 Cost Increases / Other -$32 API $50 LME $4 2Q14 $38 2Q15 $67 Cost Increases / Other -$10 Energy -$62 Prod- uctivity $56 Price / Mix -$42 Volume $2 FX $52 API -$11 LME -$15 2Q14 $97 2Q15 $210 Cost Increases/ Other -$6 Productivity $18 Price / Mix -$6 Volume $11 Currency -$1 1Q15 $194 Alumina Year-over-Year Bridge Primary Metals Year-over-Year Bridge $76 2Q15 -$5 Cost Increases / Other Productivity Energy $1 $1 Price / Mix $12 $6 Volume Currency $4 LME $3 1Q15 $54 |
 Revenue Change by Market - 2Q 2015 37 [Alcoa logo] 1% 9% 7% 3% (0%) 15% (1%) (17%) 4% (2%) 24% 54% (20%) 5% (32%) (9%) (18%) 209% 21% (8%) 22% 5% 5% 7% 5% 2% 11% 1% 16% 26% Aerospace Automotive B&C Comm. Transport Industrial Products IGT Packaging Distribution/Other Alumina Primary Metals 2Q15 Third-Party Revenue Sequential Change Year-Over-Year Change |
 Revenue Change by Market – YTD 2015 38 [Alcoa logo] Year-Over-Year Change 22% 5% 5% 7% 5% 1% 11% 1% 16% 27% Aerospace Automotive B&C Comm. Transport Industrial Products IGT Packaging Distribution/Other Alumina Primary Metals 2Q YTD Third-Party Revenue 24% 50% (19%) 9% (30%) (7%) (12%) 195% 13% 1% |
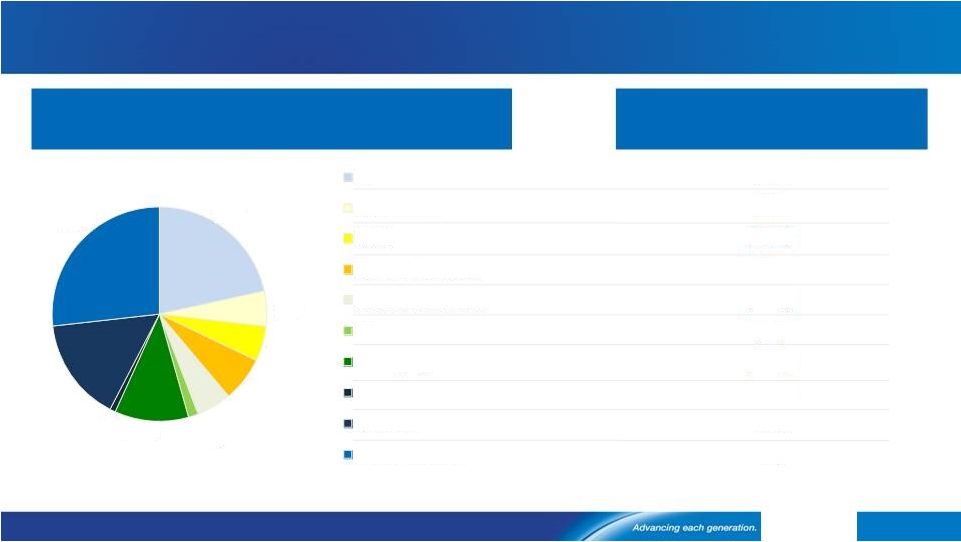
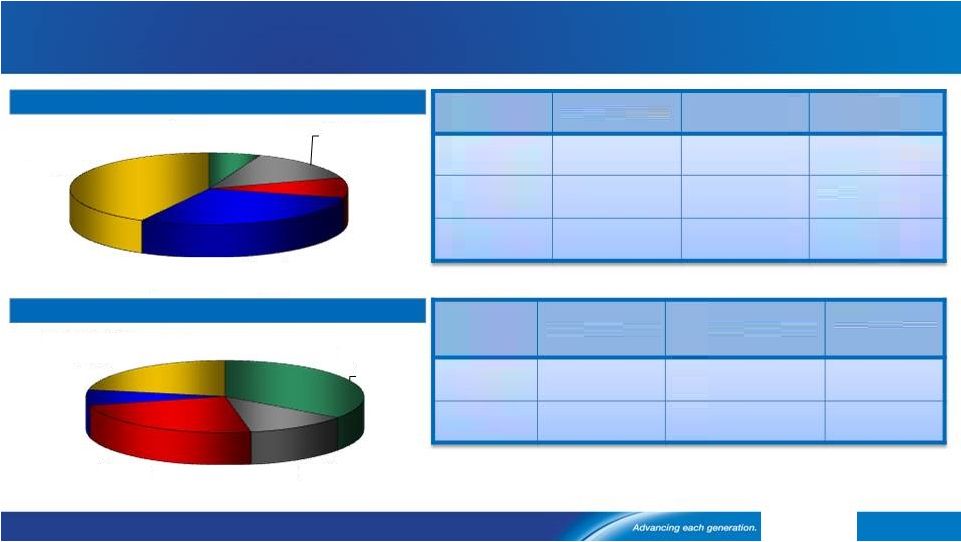 Composition of Upstream Production Costs 39 [Alcoa logo] Fuel Oil 6% Natural gas 14% Caustic 9% Bauxite 29% Conversion 42% Input Cost Inventory flow Pricing convention Annual ATOI Sensitivity Fuel oil 1 – 2 months Prior month $2m per $1/bbl Natural gas N/A Spot 1 $13m per $1/GJ 1 Caustic soda 3 - 6 months Spot & semi- annual $8m per $10/DMT Refining Cost Structure Alumina 35% Carbon 12% Power 24% Materials 7% Conversion 22% Smelting Cost Structure Input Cost Inventory flow Pricing convention Annual ATOI Sensitivity Coke Spot, quarterly & semi-annual $7m per $10/MT Pitch Spot, quarterly & semi-annual $2m per $10/MT Natural gas information corresponds to Point Comfort, as Australia is priced on a rolling 16 quarter average 1 - 2 months 1 - 2 months 1 |
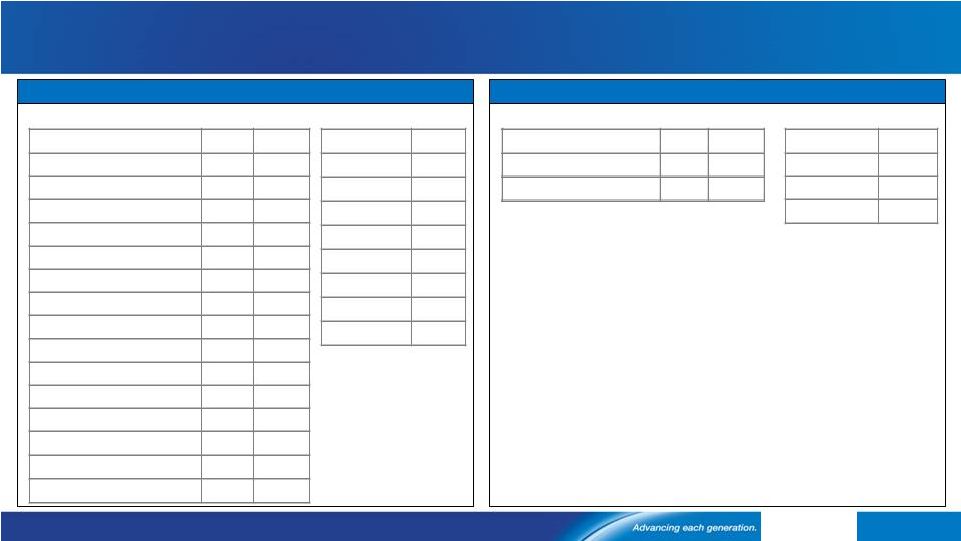 Alcoa Upstream capacity closed, sold and idled 40 Facility Year kmt Baie Comeau 2008 53 Eastalco 2010 195 Badin 2010 60 Warrick 2010 40 Tennessee 2011 215 Rockdale 2011 76 Baie Comeau 2013 105 Fusina 2013 44 Massena East 2013 41 Massena East 2014 84 Point Henry 2014 190 Portovesme 2014 150 Mt. Holly (sale of 50.33% interest) 2014 115 Pocos 2015 96 Total 1,464 Closed/sold since December 2007 Facility kmt Rockdale 191 Sao Luis 268 Intalco 49 Wenatchee 41 Aviles 32 Portland 30 La Coruna 24 Total 635 Smelting Capacity Idled Refining Capacity Facility Year kmt Jamalco (sale of 55% interest) 2014 779 Total 779 Closed/sold since December 2007 Facility kmt 1,324 Point Comfort 295 Total 1,619 Idled 1) Does not include a potential sale transaction with the Government of Suriname. [Alcoa logo] Suriname 1 |
 Source: Alcoa estimates, CRU, Harbor, Wood Mackenzie 6.5% 2015E Demand Growth 41 [Alcoa logo] 29.2 6.7 6.7 4.3 2.3 2.1 2.1 1.0 0.9 4% 1.5% 5% 9.5% 5% 1% 10% 7% -1% -3% 57.5 mmt 1 Other includes Africa, E. Europe, Latin America ex Brazil, and Oceania 2015E Primary Aluminum Consumption (mmt), Annualized Growth (%) China Europe North America North Asia India SE Asia MENA Russia Brazil Other ¹ 2.1 2015 demand +6.5% World ex China +3.5% |
 Source: Alcoa estimates, IAI, LME, Marubeni, Shanghai Metal Exchange Global Inventories Fall to 62 days; Down 8 days YoY 42 [Alcoa logo] $1,000 $1,500 $2,000 $2,500 $3,000 0 7 14 21 28 35 42 49 56 63 70 77 84 91 98 105 China Incl SRB Producer Japan Port LME On Warrant Cancelled Warrants Off Exchange LME Cash Days of Consumption 108 days LME Cash Price $2,180/MT Days of Consumption 83 days LME Cash Price $2,663/MT Global Inventories -46 days from the ’09 peak; -8 days YoY Days of Consumption Days of Consumption 62 days LME Cash Price $1,683/MT $ per metric ton Global inventories vs. LME price over time $ Days of Consumption 70 days LME Cash Price $1,834/MT |
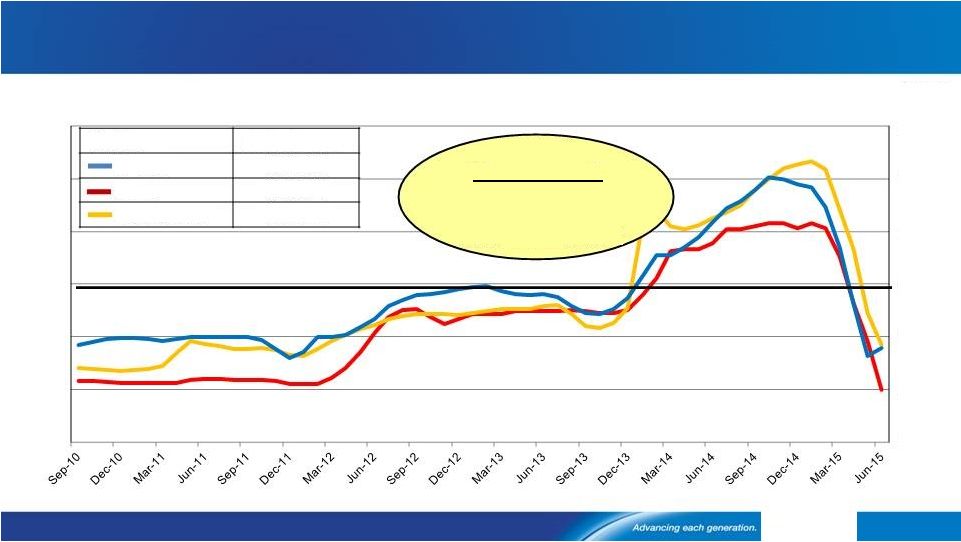 Premiums Down from Record Highs, Break Below 2014 Levels 43 Source: Graph shows monthly average of daily prices - Platts Metals Week 2Q15 and 2Q14 bubble/table data shows quarterly average of daily prices [Alcoa logo] $0 $100 $200 $300 $400 $600 $0 $100 $200 $300 $400 $500 $600 Regional Premiums over time $ per metric ton $ per metric ton Region 2Q15 Average Europe $203/MT Japan $184/MT Midwest USA $264/MT Average 2Q15 vs. 2Q14 Europe -48% Japan -50% Midwest USA -36% $500 |
 Special Items NCI: Non-controlling interest. 1) Total restructuring-related charges in 2Q15 of $143 million (55 percent cash, 45 percent non-cash). 44 [Alcoa logo] Pre-tax, Before NCI After-tax, After NCI $ Millions, except per-share amounts 1Q15 2Q15 1Q15 2Q15 Income Statement Classification Segment Net Income $481 $282 $195 $140 Net Income Per Diluted Share - - $0.14 $0.10 Restructuring-Related 1 ($177) ($221) ($158) ($143) Restructuring and Other Charges/COGS Corporate/ Primary metals Tax Items - - ($4) $22 Income Taxes Corporate/GRP Gain on Land Sale - $28 - $19 Other Income, Net Corporate Acquisition Costs ($9) ($6) ($7) ($5) SG&A Corporate Mark -to-Market Energy Contracts $2 ($4) $1 ($3) Other Expenses (Income), Net Corporate Special Items ($184) ($203) ($168) ($110) Net Income excl Special Items $665 $485 $363 $250 Net Income per Diluted Share excl Special Items - - $0.28 $0.19 |
 Reconciliation of ATOI to Consolidated Net (Loss) Income Attributable to Alcoa 45 (in millions) 1Q14 2Q14 3Q14 4Q14 2014 1Q15 2Q15 Total segment ATOI* $318 $407 $581 $659 $1,965 $656 $568 Unallocated amounts (net of tax): Impact of LIFO (7) (8) (18) (21) (54) 7 36 Metal price lag* 7 11 38 22 78 (23) (39) Interest expense (78) (69) (81) (80) (308) (80) (80) Noncontrolling interests 19 9 18 45 91 (60) (67) Corporate expense (67) (70) (74) (83) (294) (64) (66) Restructuring and other charges (321) (77) (189) (307) (894) (161) (159) Other (49) (65) (126) (76) (316) (80) (53) Consolidated net (loss) income attributable to Alcoa $(178) $138 $149 $159 $268 $195 $140 [Alcoa logo] * Effective in the second quarter of 2015, management removed the impact of metal price lag from the results of the Engineered Products and Solutions and Global Rolled Products segments in order to enhance the visibility of the underlying operating performance of these businesses. Metal price lag describes the timing difference created when the average price of metal sold differs from the average cost of the metal when purchased by the respective segment. The impact of metal price lag is now reported as a separate line item in Alcoa’s reconciliation of total segment ATOI to consolidated net income (loss) attributable to Alcoa. As a result, this revision does not impact the consolidated results of Alcoa. Segment information for all prior periods presented was revised to reflect this change. |
 Reconciliation of Adjusted Income 46 [Alcoa logo] (in millions, except per-share amounts) Income Diluted EPS (3) Quarter ended Quarter ended June 30, March 31, June 30, June 30, March 31, June 30, 2014 2015 2015 2014 2015 2015 Net income attributable to Alcoa $138 $195 $140 $0.12 $0.14 $0.10 Restructuring and other charges 54 158 141 Discrete tax items (1) (2) (5) Other special items (2) 26 10 (26) Net income attributable to Alcoa – as adjusted $216 $363 $250 0.18 0.28 0.19 Net income attributable to Alcoa – as adjusted is a non-GAAP financial measure. Management believes that this measure is meaningful to investors because management reviews the operating results of Alcoa excluding the impacts of restructuring and other charges, discrete tax items, and other special items (collectively, “special items”). There can be no assurances that additional special items will not occur in future periods. To compensate for this limitation, management believes that it is appropriate to consider both Net income attributable to Alcoa determined under GAAP as well as Net income attributable to Alcoa – as adjusted. Discrete tax items include the following: • for the quarter ended June 30, 2015, a net benefit for a number of small items; and • for the quarter ended June 30, 2014, a net benefit for a number of small items. Other special items include the following: • for the quarter ended June 30, 2015, a favorable tax impact related to the interim period treatment of operational losses in certain foreign jurisdictions for which no tax benefit was recognized ($21), a gain on the sale of land ($19), costs associated with a future acquisition of an aerospace business ($5), an unfavorable tax impact resulting from the difference between Alcoa’s consolidated estimated annual effective tax rate and the statutory rates applicable to special items ($4), a net unfavorable change in certain mark-to-market energy derivative contracts ($3), and a write-down of inventory related to the permanent closure of a smelter in Brazil and a power station in Australia ($2); • for the quarter ended March 31, 2015, an unfavorable tax impact related to the interim period treatment of operational losses in certain foreign jurisdictions for which no tax benefit was recognized ($35), a favorable tax impact resulting from the difference between Alcoa’s consolidated estimated annual effective tax rate and the statutory rates applicable to special items ($31), costs associated with current and future acquisitions of aerospace businesses ($7), and a net favorable change in certain mark-to-market energy derivative contracts ($1); and • for the quarter ended June 30, 2014, a favorable tax impact related to the interim period treatment of operational losses in certain foreign jurisdictions for which no tax benefit was recognized ($20), an unfavorable tax impact resulting from the difference between Alcoa’s consolidated estimated annual effective tax rate and the statutory rates applicable to special items ($24), costs associated with (i) a then-planned acquisition of an aerospace business ($11) and (ii) preparation for and ratification of a new labor agreement with the United Steelworkers ($11), a net favorable change in certain mark-to-market energy derivative contracts ($6), and an unfavorable impact related to the restart of one potline at the joint venture in Saudi Arabia that was previously shut down due to a period of pot instability ($6). The average number of shares applicable to diluted EPS for Net income attributable to Alcoa excludes certain share equivalents as their effect was anti-dilutive (see footnote 3 to the Statement of Consolidated Operations). However, certain of these share equivalents may become dilutive in the EPS calculation applicable to Net income attributable to Alcoa – as adjusted due to a larger, positive numerator. Specifically, these share equivalents were associated with mandatory convertible preferred stock for the quarter ended March 31, 2015. As a result, the average number of shares applicable to diluted EPS for Net income attributable to Alcoa – as adjusted was 1,315,558,890 for the quarter ended March 31, 2015. Additionally, the subtraction of preferred stock dividends declared from the numerator (see footnote 1 to the Statement of Consolidated Operations) needs to be reversed for the quarter ended March 31, 2015 since the related mandatory convertible preferred stock was dilutive in the EPS calculation for Net income attributable to Alcoa – as adjusted. (1) (2) (3) - |
 Reconciliation of Alcoa Adjusted EBITDA 47 ($ in millions) 2004 2005 2006 2007 2008 2009 2010 2011 2012 2013 2014 2Q14 1Q15 2Q15 Net income (loss) attributable to Alcoa $1,310 $1,233 $2,248 $2,564 $(74) $(1,151) $254 $611 $191 $(2,285) $268 $138 $195 $140 Add: Net income (loss) attributable to noncontrolling interests 233 259 436 365 221 61 138 194 (29) 41 (91) (9) 60 67 Cumulative effect of accounting changes – 2 – – – – – – – – – – – – Loss (income) from discontinued operations 27 50 (22) 250 303 166 8 3 – – – – – – Provision (benefit) for income taxes 546 464 853 1,623 342 (574) 148 255 162 428 320 78 226 75 Other (income) expenses, net (266) (478) (236) (1,920) (59) (161) 5 (87) (341) (25) 47 5 (12) – Interest expense 271 339 384 401 407 470 494 524 490 453 473 105 122 124 Restructuring and other charges (29) 266 507 268 939 237 207 281 172 782 1,168 110 177 217 Impairment of goodwill – – – – – – – – – 1,731 – – – – Provision for depreciation, depletion, and amortization 1,142 1,227 1,252 1,244 1,234 1,311 1,450 1,479 1,460 1,421 1,371 349 321 319 Adjusted EBITDA $3,234 $3,362 $5,422 $4,795 $3,313 $359 $2,704 $3,260 $2,105 $2,546 $3,556 $776 $1,089 $942 Sales $21,370 $24,149 $28,950 $29,280 $26,901 $18,439 $21,013 $24,951 $23,700 $23,032 $23,906 $5,836 $5,819 $5,897 Adjusted EBITDA Margin 15.1% 13.9% 18.7% 16.4% 12.3% 1.9% 12.9% 13.1% 8.9% 11.1% 14.9% 13.3% 18.7% 16.0% [Alcoa logo] Alcoa’s definition of Adjusted EBITDA (Earnings before interest, taxes, depreciation, and amortization) is net margin plus an add-back for depreciation, depletion, and amortization. Net margin is equivalent to Sales minus the following items: Cost of goods sold; Selling, general administrative, and other expenses; Research and development expenses; and Provision for depreciation, depletion, and amortization. Adjusted EBITDA is a non-GAAP financial measure. Management believes that this measure is meaningful to investors because Adjusted EBITDA provides additional information with respect to Alcoa’s operating performance and the Company’s ability to meet its financial obligations. The Adjusted EBITDA presented may not be comparable to similarly titled measures of other companies. |
 Reconciliation of Alumina Adjusted EBITDA 48 ($ in millions, except per metric ton amounts) 2004 2005 2006 2007 2008 2009 2010 2011 2012 2013 2014 2Q14 1Q15 2Q15 After-tax operating income (ATOI) $632 $682 $1,050 $956 $727 $112 $301 $607 $90 $259 $370 $38 $221 $215 Add: Depreciation, depletion, and amortization 153 172 192 267 268 292 406 444 455 426 387 100 80 77 Equity (income) loss (1) – 2 (1) (7) (8) (10) (25) (5) 4 29 7 7 11 Income taxes 240 246 428 340 277 (22) 60 179 (27) 66 153 12 92 87 Other (46) (8) (6) 2 (26) (92) (5) (44) (8) (6) (28) – – – Adjusted EBITDA $978 $1,092 $1,666 $1,564 $1,239 $282 $752 $1,161 $505 $749 $911 $157 $400 $390 Production (thousand metric tons) (kmt) 14,343 14,598 15,128 15,084 15,256 14,265 15,922 16,486 16,342 16,618 16,606 4,077 3,933 3,977 Adjusted EBITDA / Production ($ per metric ton) $68 $75 $110 $104 $81 $20 $47 $70 $31 $45 $55 $39 $102 $98 [Alcoa logo] Alcoa’s definition of Adjusted EBITDA (Earnings before interest, taxes, depreciation, and amortization) is net margin plus an add-back for depreciation, depletion, and amortization. Net margin is equivalent to Sales minus the following items: Cost of goods sold; Selling, general administrative, and other expenses; Research and development expenses; and Provision for depreciation, depletion, and amortization. The Other line in the table above includes gains/losses on asset sales and other non-operating items. Adjusted EBITDA is a non-GAAP financial measure. Management believes that this measure is meaningful to investors because Adjusted EBITDA provides additional information with respect to Alcoa’s operating performance and the Company’s ability to meet its financial obligations. The Adjusted EBITDA presented may not be comparable to similarly titled measures of other companies. |
 Reconciliation of Primary Metals Adjusted EBITDA 49 ($ in millions, except per metric ton amounts) 2004 2005 2006 2007 2008 2009 2010 2011 2012 2013 2014 2Q14 1Q15 2Q15 After-tax operating income (ATOI) $808 $822 $1,760 $1,445 $931 $(612) $488 $481 $309 $(20) $594 $97 $187 $67 Add: Depreciation, depletion, and amortization 326 368 395 410 503 560 571 556 532 526 494 129 109 109 Equity (income) loss (58) 12 (82) (57) (2) 26 (1) 7 27 51 34 17 3 5 Income taxes 314 307 726 542 172 (365) 96 92 106 (74) 203 30 57 6 Other 20 (96) (13) (27) (32) (176) (7) 2 (422) (8) (6) (5) (1) – Adjusted EBITDA $1,410 $1,413 $2,786 $2,313 $1,572 $(567) $1,147 $1,138 $552 $475 $1,319 $268 $355 $187 Production (thousand metric tons) (kmt) 3,376 3,554 3,552 3,693 4,007 3,564 3,586 3,775 3,742 3,550 3,125 795 711 701 Adjusted EBITDA / Production ($ per metric ton) $418 $398 $784 $626 $392 $(159) $320 $301 $148 $134 $422 $337 $499 $267 [Alcoa logo] Alcoa’s definition of Adjusted EBITDA (Earnings before interest, taxes, depreciation, and amortization) is net margin plus an add-back for depreciation, depletion, and amortization. Net margin is equivalent to Sales minus the following items: Cost of goods sold; Selling, general administrative, and other expenses; Research and development expenses; and Provision for depreciation, depletion, and amortization. The Other line in the table above includes gains/losses on asset sales and other non-operating items. Adjusted EBITDA is a non-GAAP financial measure. Management believes that this measure is meaningful to investors because Adjusted EBITDA provides additional information with respect to Alcoa’s operating performance and the Company’s ability to meet its financial obligations. The Adjusted EBITDA presented may not be comparable to similarly titled measures of other companies. |
 Reconciliation of Global Rolled Products Adjusted EBITDA (1) 50 [Alcoa logo] ($ in millions, except per metric ton amounts) 2004 2005 2006 2007 2008 2009 2012 (2) 2013 2014 2Q14 1Q15 2Q15 After-tax operating income (ATOI) $290 $300 $317 $151 $(41) $(106) $241 $260 $346 $252 $245 $70 $54 $76 Add: Depreciation, depletion, and amortization 200 220 223 227 216 227 238 237 229 226 235 58 56 56 Equity loss 1 – 2 – – – – 3 6 13 27 6 9 7 Income taxes 97 135 113 77 14 12 103 98 159 108 89 18 36 25 Other 1 1 20 1 6 (2) 1 1 (2) – (1) 2 – – Adjusted EBITDA $589 $656 $675 $456 $195 $131 $583 $599 $738 $599 $595 $154 $155 $164 Total shipments (thousand metric tons) (kmt) 2,136 2,250 2,376 2,482 2,361 1,888 1,755 1,866 1,943 1,989 2,056 533 447 479 Adjusted EBITDA / Total shipments ($ per metric ton ) $276 $292 $284 $184 $83 $69 $332 $321 $380 $301 $289 $289 $347 $342 Effective in the second quarter of 2015, management removed the impact of metal price lag from the results of the Global Rolled Products segment in order to enhance the visibility of the underlying operating performance of this business. Metal price lag describes the timing difference created when the average price of metal sold differs from the average cost of the metal when purchased by this segment. This revision does not impact the consolidated results of Alcoa. Segment information for all prior 2014 and 2015 periods presented was revised to reflect this change. The average Adjusted EBITDA per metric ton of these three years equals $344 and represents the average historical high for the Global Rolled Products segment. Alcoa has a 2016 target to meet or exceed this average historical high. (1) (2) 2011 (2) 2010 (2) Alcoa’s definition of Adjusted EBITDA (Earnings before interest, taxes, depreciation, and amortization) is net margin plus an add-back for depreciation, depletion, and amortization. Net margin is equivalent to Sales minus the following items: Cost of goods sold; Selling, general administrative, and other expenses; Research and development expenses; and Provision for depreciation, depletion, and amortization. The Other line in the table above includes gains/losses on asset sales and other non-operating items. Adjusted EBITDA is a non-GAAP financial measure. Management believes that this measure is meaningful to investors because Adjusted EBITDA provides additional information with respect to Alcoa’s operating performance and the Company’s ability to meet its financial obligations. The Adjusted EBITDA presented may not be comparable to similarly titled measures of other companies. |
 Reconciliation of Engineered Products and Solutions Adjusted EBITDA (1) 51 [Alcoa logo] ($ in millions) 2004 2005 2006 2007 2008 2009 2010 2011 2012 2013 (2) 2014 (3) 2Q14 1Q15 (4) 2Q15 (4) After-tax operating income (ATOI) $161 $276 $382 $423 $522 $311 $419 $537 $612 $726 $756 $202 $194 $210 Add: 168 160 152 163 165 177 154 158 158 159 173 41 60 64 Equity loss (income) – – 6 – – (2) (2) (1) – – – – – – Income taxes 70 120 164 184 215 138 198 258 297 348 368 101 90 99 Other 106 (11) (2) (7) 2 1 – (1) (9) (2) – – 1 (1) Adjusted EBITDA $505 $545 $702 $763 $904 $625 $769 $951 $1,058 $1,231 $1,297 $344 $345 $372 Third-party sales $4,283 $4,773 $5,428 $5,834 $6,199 $4,689 $4,584 $5,345 $5,525 $5,733 $6,006 $1,502 $1,689 $1,733 Adjusted EBITDA Margin 11.8% 11.4% 12.9% 13.1% 14.6% 13.3% 16.8% 17.8% 19.1% 21.5% 21.6% 22.9% 20.4% 21.5% Depreciation, depletion, and amortization (1) (2) (3) (4) Effective in the second quarter of 2015, management removed the impact of metal price lag from the results of the Engineered Products and Solutions segment in order to enhance the visibility of the underlying operating performance of this business. Metal price lag describes the timing difference created when the average price of metal sold differs from the average cost of the metal when purchased by this segment. This revision does not impact the consolidated results of Alcoa. Segment information for all prior 2014 and 2015 periods presented was revised to reflect this change. The Adjusted EBITDA Margin for the year ended December 31, 2013 represents the historical high for the Engineered Products and Solutions segment. Alcoa has a 2016 target to exceed this historical high. In the year ended December 31, 2014, the Third-party sales and Adjusted EBITDA of Engineered Products and Solutions includes $81 and $(10), respectively, related to the acquisition of an aerospace business, Firth Rixson. Excluding these amounts, Adjusted EBITDA Margin was 22.1% for the year ended December 31, 2014. In the quarters ended March 31, 2015 and June 30, 2015, the Third-party sales and Adjusted EBITDA of Engineered Products and Solutions includes $233 and $27, respectively, and $268 and $42, respectively, related to the acquisition of two aerospace businesses, Firth Rixson and TITAL. Excluding these amounts, Adjusted EBITDA Margin was 21.8% and 22.6% for the quarters ended March 31, 2015 and June 30, 2015, respectively. Alcoa’s definition of Adjusted EBITDA (Earnings before interest, taxes, depreciation, and amortization) is net margin plus an add-back for depreciation, depletion, and amortization. Net margin is equivalent to Sales minus the following items: Cost of goods sold; Selling, general administrative, and other expenses; Research and development expenses; and Provision for depreciation, depletion, and amortization. The Other line in the table above includes gains/losses on asset sales and other non-operating items. Adjusted EBITDA is a non-GAAP financial measure. Management believes that this measure is meaningful to investors because Adjusted EBITDA provides additional information with respect to Alcoa’s operating performance and the Company’s ability to meet its financial obligations. The Adjusted EBITDA presented may not be comparable to similarly titled measures of other companies. |
 Reconciliation of Firth Rixson Adjusted EBITDA ($ in millions) 1/1/14 – 11/18/14 (1) 11/19/14 – 12/31/14 2014 (2) 2Q15 2Q15 Annualized After-tax operating income (ATOI) $77 $(12) $65 $15 $60 Add: Depreciation, depletion, and amortization 47 9 56 20 80 Equity loss (income) – – – – – Income taxes 28 (6) 22 7 28 Other (3) (1) (4) – – Adjusted EBITDA $149 $(10) $139 $42 $168 Third-party sales $889 $81 $970 $247 Adjusted EBITDA Margin 16.8% (12.3)% 14.3% 16.8% 52 On November 19, 2014, Alcoa completed the acquisition of Firth Rixson, an aerospace jet engine components company, from Oak Hill Capital Partners. Firth Rixson was integrated into Alcoa’s Engineered Products and Solutions segment. Alcoa’s primary measure of performance for its reportable segments is after-tax operating income (ATOI). As such, Alcoa estimated the ATOI, and therefore the Adjusted EBITDA, of Firth Rixson for the January 1, 2014 through November 18, 2014 timeframe using unaudited internal management financial statements of Firth Rixson. The ATOI estimate and calculation of Adjusted EBITDA for Firth Rixson does not purport to be the manner in which Firth Rixson’s prior management would have calculated Firth Rixson’s ATOI and Adjusted EBITDA. Additionally, this calculation of ATOI and Adjusted EBITDA is not intended to suggest that Firth Rixson’s prior management used ATOI or Adjusted EBITDA as a measure of Firth Rixson’s profitability. In 2014, the Adjusted EBITDA of Firth Rixson includes a negative impact of $13 due to the integration of Firth Rixson, primarily driven by the remeasurement of inventory to fair value, in accordance with purchase accounting requirements. Excluding this amount, Firth Rixson’s Adjusted EBITDA and Adjusted EBITDA Margin was $152 and 15.7%, respectively, for 2014. (1) (2) Alcoa’s definition of Adjusted EBITDA (Earnings before interest, taxes, depreciation, and amortization) is net margin plus an add-back for depreciation, depletion, and amortization. Net margin is equivalent to Sales minus the following items: Cost of goods sold; Selling, general administrative, and other expenses; Research and development expenses; and Provision for depreciation, depletion, and amortization. The Other line in the table above includes gains/losses on asset sales and other non-operating items. Adjusted EBITDA is a non-GAAP financial measure. Management believes that this measure is meaningful to investors because Adjusted EBITDA provides additional information with respect to Alcoa’s operating performance and the Company’s ability to meet its financial obligations. The Adjusted EBITDA presented may not be comparable to similarly titled measures of other companies. |
 Reconciliation of Free Cash Flow 53 (in millions) Year ended Quarter ended December 31, 2010 December 31, 2011 December 31, 2012 December 31, 2013 December 31, 2014 June 30, 2014 March 31, 2015 June 30, 2015 Cash from operations $2,261 $2,193 $1,497 $1,578 $1,674 $518 $(175) $472 Capital expenditures (1,015) (1,287) (1,261) (1,193) (1,219) (258) (247) (267) Free cash flow $1,246 $906 $236 $385 $455 $260 $(422) $205 [Alcoa logo] Free Cash Flow is a non-GAAP financial measure. Management believes that this measure is meaningful to investors because management reviews cash flows generated from operations after taking into consideration capital expenditures due to the fact that these expenditures are considered necessary to maintain and expand Alcoa’s asset base and are expected to generate future cash flows from operations. It is important to note that Free Cash Flow does not represent the residual cash flow available for discretionary expenditures since other non-discretionary expenditures, such as mandatory debt service requirements, are not deducted from the measure. |
 Days Working Capital 54 [Alcoa logo] (1) (2) (3) ($ in millions) Quarter ended 31-Mar-12 30-Jun-12 30-Sep-12 31-Dec-12 31-Mar-13 30-Jun-13 30-Sep-13 31-Dec-13 31-Mar-14 30-Jun-14 30-Sep-14 31-Dec-14 31-Mar-15 (3) 30-Jun-15 (3) Receivables from customers, less allowances $1,709 $1,650 $1,600 $1,573 $1,704 $1,483 $1,427 $1,383 $1,391 $1,401 $1,526 $1,513 $1,487 $1,548 Add: Deferred purchase price receivable (1) 85 144 104 53 50 223 347 339 238 371 438 395 389 421 Receivables from customers, less allowances, as adjusted 1,794 1,794 1,704 1,626 1,754 1,706 1,774 1,722 1,629 1,772 1,964 1,908 1,876 1,969 Add: Inventories 3,079 3,097 3,051 2,894 2,961 2,949 2,932 2,783 2,974 3,201 3,194 3,064 3,189 3,230 Less: Accounts payable, trade 2,660 2,594 2,496 2,587 2,656 2,820 2,746 2,816 2,813 2,880 3,016 3,021 2,936 2,978 Working Capital (2) $2,213 $2,297 $2,259 $1,933 $2,059 $1,835 $1,960 $1,689 $1,790 $2,093 $2,142 $1,951 $2,129 $2,221 Sales $6,006 $5,963 $5,833 $5,898 $5,833 $5,849 $5,765 $5,585 $5,454 $5,836 $6,239 $6,377 $5,819 $5,897 Days Working Capital 34 35 36 30 32 29 31 28 30 33 32 28 33 34 Days Working Capital = Working Capital divided by (Sales/number of days in the quarter). The deferred purchase price receivable relates to an arrangement to sell certain customer receivables to several financial institutions on a recurring basis. Alcoa is adding back this receivable for the purposes of the Days Working Capital calculation. The Working Capital for each period presented represents an average quarter Working Capital, which reflects the capital tied up during a given quarter. As such, the components of Working Capital for each period presented represent the average of the ending balances in each of the three months during the respective quarter. In the quarters ended March 31, 2015 and June 30, 2015, Working Capital and Sales include $279 and $233, respectively, and $315 and 268 respectively, related to the acquisition of two aerospace businesses, Firth Rixson and TITAL. Excluding these amounts, Days Working Capital was 30 and 31 for the quarters ended March 31, 2015 and June 30, 2015, respectively. |
 Reconciliation of Net Debt 55 [Alcoa logo] (in millions) December 31, March 31, June 30, 2010 2011 2012 2013 2014 2015 2015 Short-term borrowings $92 $62 $53 $57 $54 $80 $50 Commercial paper – 224 – – – – – Long-term debt due within one year 231 445 465 655 29 26 26 Long-term debt, less amount due within one year 8,842 8,640 8,311 7,607 8,769 8,711 8,713 Total debt 9,165 9,371 8,829 8,319 8,852 8,817 8,789 Less: Cash and cash equivalents 1,543 1,939 1,861 1,437 1,877 1,191 1,311 Net debt $7,622 $7,432 $6,968 $6,882 $6,975 $7,626 $7,478 Net debt is a non-GAAP financial measure. Management believes that this measure is meaningful to investors because management assesses Alcoa’s leverage position after factoring in available cash that could be used to repay outstanding debt. |
 Reconciliation of Debt-to-Adjusted EBITDA Ratio 56 [Alcoa logo] ($ in millions) 2010 2011 2012 2013 2014 1Q15* 2Q15* Net income (loss) attributable to Alcoa $254 $611 $191 $(2,285) $268 $641 $643 Add: Net income (loss) attributable to noncontrolling interests 138 194 (29) 41 (91) (12) 64 Loss from discontinued operations 8 3 – – – – – Provision for income taxes 148 255 162 428 320 623 620 Other expenses (income), net 5 (87) (341) (25) 47 10 5 Interest expense 494 524 490 453 473 475 494 Restructuring and other charges 207 281 172 782 1,168 884 991 Impairment of goodwill – – – 1,731 – – – Provision for depreciation, depletion, and amortization 1,450 1,479 1,460 1,421 1,371 1,352 1,322 Adjusted EBITDA $2,704 $3,260 $2,105 $2,546 $3,556 $3,973 $4,139 Total Debt $9,165 $9,371 $8,829 $8,319 $8,852 $8,817 $8,789 Debt-to-Adjusted EBITDA Ratio 3.39 2.87 4.20 3.27 2.49 2.22 2.12 * The calculation of Adjusted EBITDA for the quarters ended March 31, 2015 and June 30, 2015 is based on the respective trailing twelve months. Alcoa’s definition of Adjusted EBITDA (Earnings before interest, taxes, depreciation, and amortization) is net margin plus an add-back for depreciation, depletion, and amortization. Net margin is equivalent to Sales minus the following items: Cost of goods sold; Selling, general administrative, and other expenses; Research and development expenses; and Provision for depreciation, depletion, and amortization. Adjusted EBITDA is a non-GAAP financial measure. Management believes that this measure is meaningful to investors because Adjusted EBITDA provides additional information with respect to Alcoa’s operating performance and the Company’s ability to meet its financial obligations. The Adjusted EBITDA presented may not be comparable to similarly titled measures of other companies. |
 [Alcoa logo] |