EXHIBIT (a) (14)
| second Quarter 2007 Results July 31,2007 |
| Statements made in the course of this presentation which describe the Company’s or management’s objectives, projections, estimates, expectations or predictions may be "forward-looking statements” within the meaning of securities laws. All statements that address the Company’s expectations or projections about the future including statements about the Company’s growth, cost reduction goals, operations, reorganization plans, expenditures and financial results are forward-looking statements. The Company cautions that, by their nature, forward-looking statements involve risk and uncertainty and actual actions or results could differ materially. Reference should be made to the most recent Form 10-Q for a list of factors that could cause such difference s. In addition, certain non-GAAP measures are used which are reconciled to the comparable GAAP measures herein or on the Company’s website at www.alcan.com in the "Investors” section.© 2007 A L C A N I N C. |
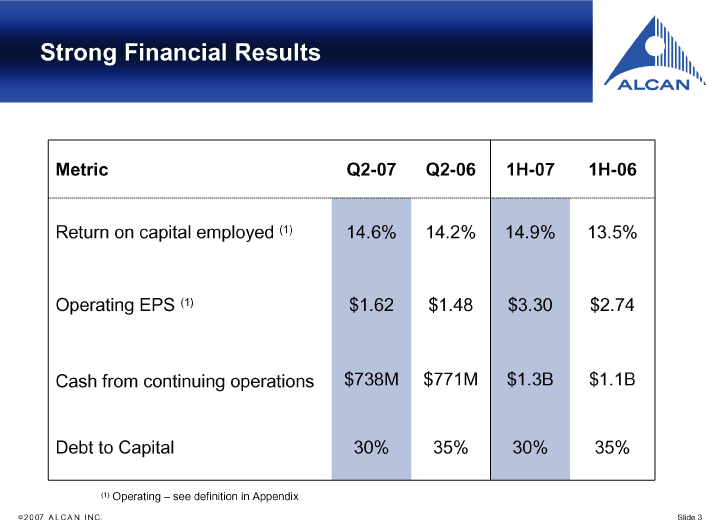
| Metric Q2-07 Q2-06 1H-07 1H-06 Return on capital employed(1) 14.6% 14.2% 14.9% 13.5% Operating EPS(1) $1.62 $1.48 $3.30 $2.74 Cash from continuing operations $738M $771M $1.3B $1.1B Debt to Capital 30% 35% 30% 35%(1)Operating — see definition in Appendix |
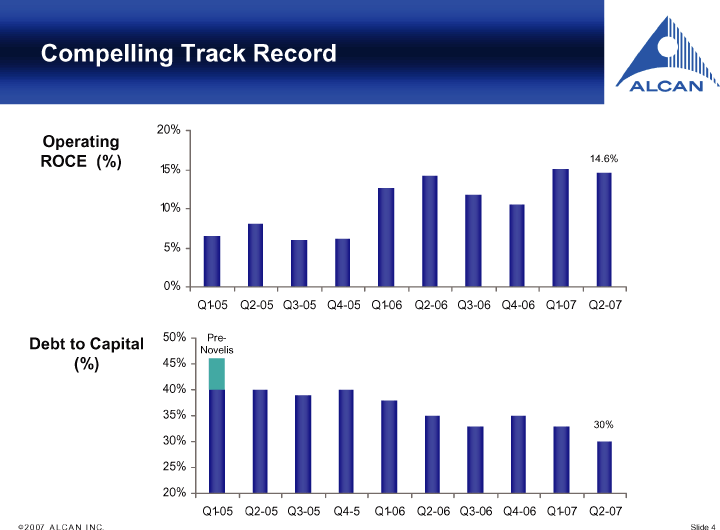
| 20%Operating ROCE (%)14.6% 15% 10% 5% 0% Q1-05 Q2-05 Q3-05 Q4-05 Q1-06 Q2-06 Q3-06 Q4-06 Q1-07 Q2-07 50% Pre-Debt to Capital Novelis(%)45% 40% 35% 30% 30% 25% 20% Q1-05 Q2-05 Q3-05 Q4-5 Q1-06 Q2-06 Q3-06 Q4-06 Q1-07 Q2-07© 2 0 07 A L C A N I N C. Slide 4 |
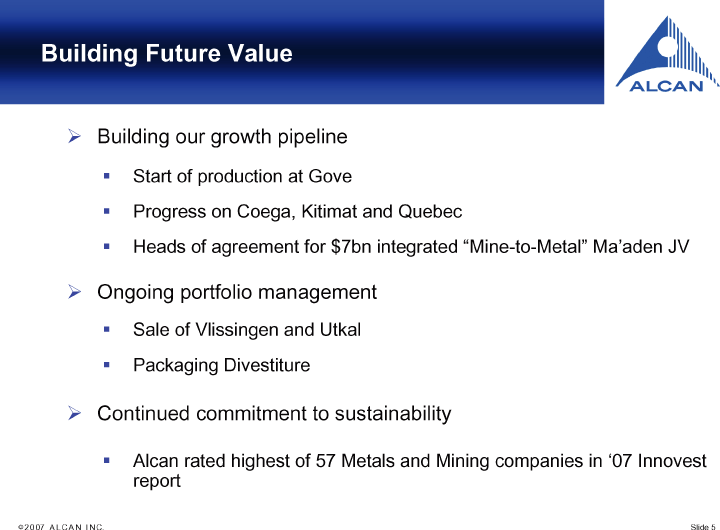
| 3Building our growth pipeline3Start of production at Gove3Progress on Coega, Kitimat and Quebec3Heads of agreement for $7bn integrated "Mine-to-Metal” Ma’aden JV3Ongoing portfolio management3Sale of Vlissingen and Utkal3Packaging Divestiture3Continued commitment to sustainability3Alcan rated highest of 57 Metals and Mining companies in ‘07 Innovest report |
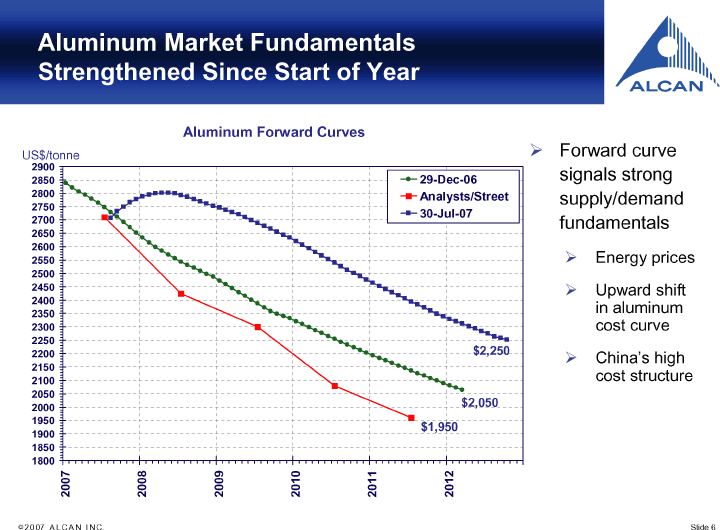
| Aluminum Forward Curves US$/tonne3Forward curve2900 2850 29-Dec-06signals strong2800 Analysts/Streetsupply/demand2750 30-Jul-07 2700fundamentals 2650 2600 2550 3Energy prices2500 2450 3Upward shift2400 in aluminum2350 2300cost curve2250 2200 $2,250 3C hina’s high2150 2100cost structure2050 $2,050 2000 1950 $1,950 1900 1850 1800 2007 2008 2009 2010 2011 2012 |
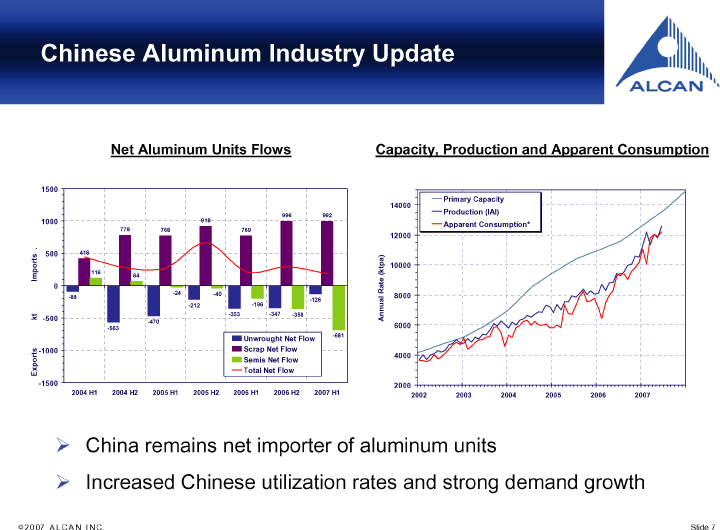
| Net Aluminum Units Flows Capacity, Production and Apparent Consumption 1500 Primary Capacity 14000 Production (IAI) 996 992 1000 918 Apparent Consumption* 778 768 769 12000 .. 500 418 Imports (ktpa) 10000 116 64 0 Rate - -24 -40 8000 - -88 Annual - -126 -212 -196 kt -353 -347 -358 - -500 - -470 - -563 6000 -681 Unwrought Net Flow Exports -1000 Scrap Net Flow 4000 Semis Net Flow Total Net Flow - -1500 2000 2004 H1 2004 H2 2005 H1 2005 H2 2006 H1 2006 H2 2007 H1 2002 2003 2004 2005 2006 2007 3China remains net importer of aluminum units3Increased Chinese utilization rates and strong demand growth |
| 3Recommended offer is result of rigorous and thorough process3Provides compelling value to shareholders and stakeholders3Rio Tinto Alcan will be a new global leader in aluminium industry3Large scale, long life, low cost assets worldwide3Significant bauxite reserves and competitive alumina refining3Low cost hydro power and leading smelter technology3Deep and diverse talent pool |
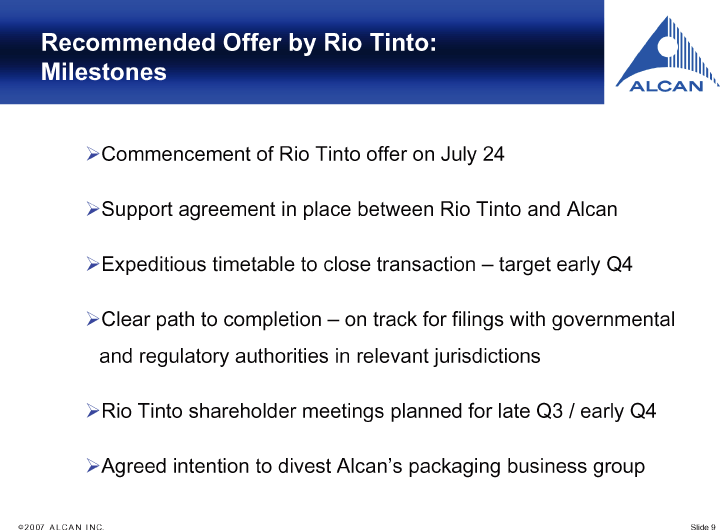
| 3Commencement of Rio Tinto offer on July 243Support agreement in place between Rio Tinto and Alcan3Expeditious timetable to close transaction — target early Q43Clear path to completion — on track for filings with governmental and regulatory authorities in relevant jurisdictions3Rio Tinto shareholder meetings planned for late Q3 / early Q43Agreed intention to divest Alcan’s packaging business group |

| FINANCIAL REVIEW |
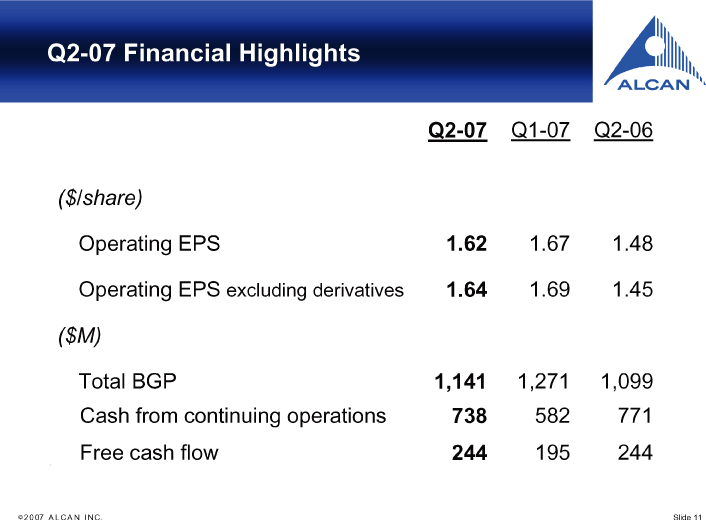
| Q2-07 Financial Highlights Q2-07Q1-07 Q2-06($/share) Operating EPS1.621.67 1.48 Operating EPS excluding derivatives1.641.69 1.45($M) Total BGP1,1411,271 1,099 Cash from continuing operations738582 771 Free cash flow244195 244 771 |
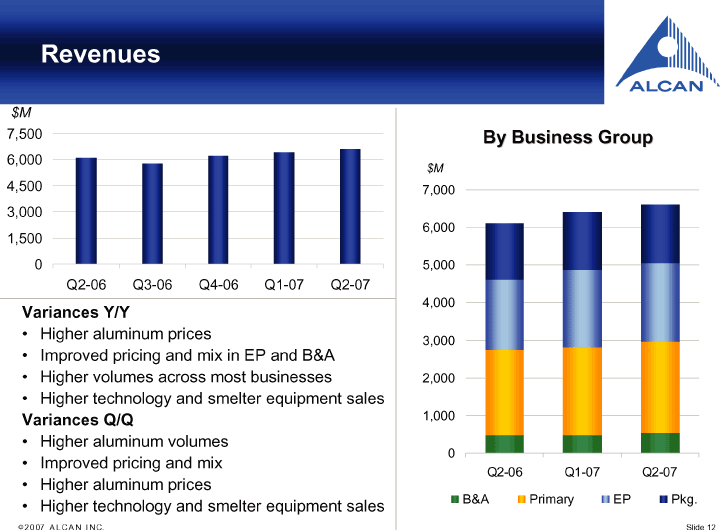
| $M 7,500By Business Group 6,000$M 4,500 7,000 3,000 6,000 1,500 5,000 Q2-06 Q3-06 Q4-06 Q1-07 Q2-07 4,000Variances Y/Y · Higher aluminum prices 3,000• Improved pricing and mix in EP and B&A · Higher volumes across most businesses 2,000• Higher technology and smelter equipment salesVariances Q/Q1,000• Higher aluminum volumes•Improved pricing and mix Q2-06 Q 1-07 Q2-07•Higher aluminum prices B&A Primary EP Pkg.•Higher technology and smelter equipment sales 2 0 07 A L C A N I N C. Slide 12 |
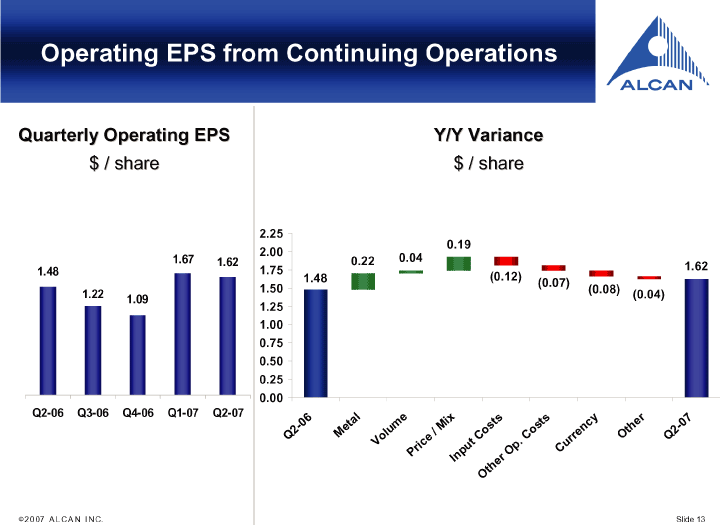
| Operating EPS from Continuing Operations Quarterly Operating EPS Y/Y Variance $ / share $ / share ..2 5 2.25 ..0 0 0.19 2.00 1.67 0.22 0.04 1.62 1.7 5 1.75 1.62 1.48 1.48 (0.12) 1.5 0 (0.07) 1.50 (0.08) 1.22 (0.04) 1.09 1.2 5 1.25 1.0 0 1.00 .7 5 0.75 ..5 0 0.50 .2 5 0.25 .0 0 0.00 Q2-06 Q3-06 Q4-06 Q1-07 Q2-07l 6 e x s s y r 70t aittce0 -emMssnh-2l u/oot2Mr eO QoeCCrQVct.u r iup pOCPnIr e t h |
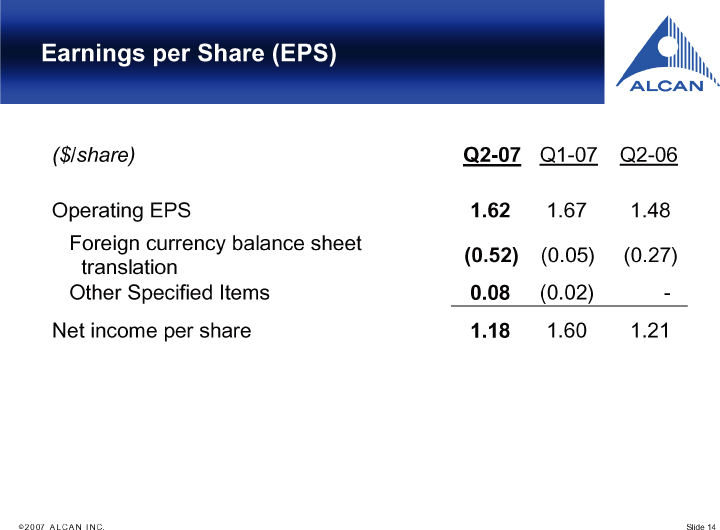
| Earnings per Share (EPS)($/share)Q2-07Q1-07 Q2-06 Operating EPS1.621.67 1.48 Foreign currency balance sheet(0.52)(0.05) (0.27) translation Other Specified Items0.08(0.02) - Net income per share1.181.60 1.21 |
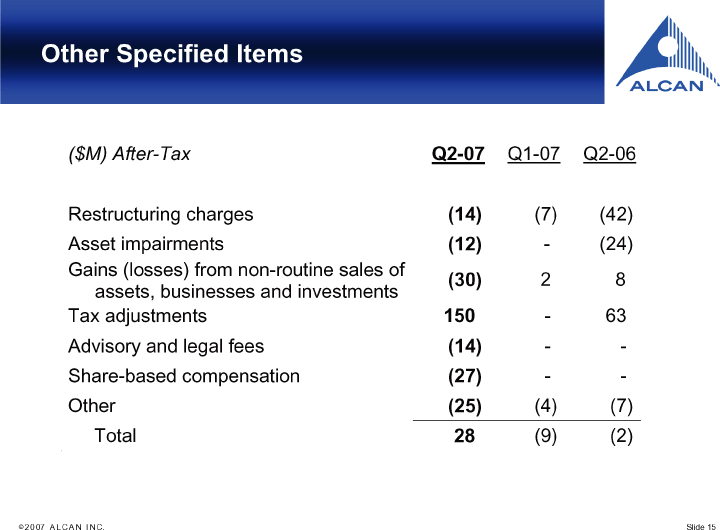
| Other Specified Items($M) After-TaxQ2-07Q1-07 Q2-06 Restructuring charges(14)(7) (42) Asset impairments(12)- (24) Gains (losses) from non-routine sales of(30)2 8 assets, businesses and investments Tax adjustments150- 63 Advisory and legal fees(14)- - Share-based compensation(27)- - Other(25)(4) (7) Total28(9) (2) |
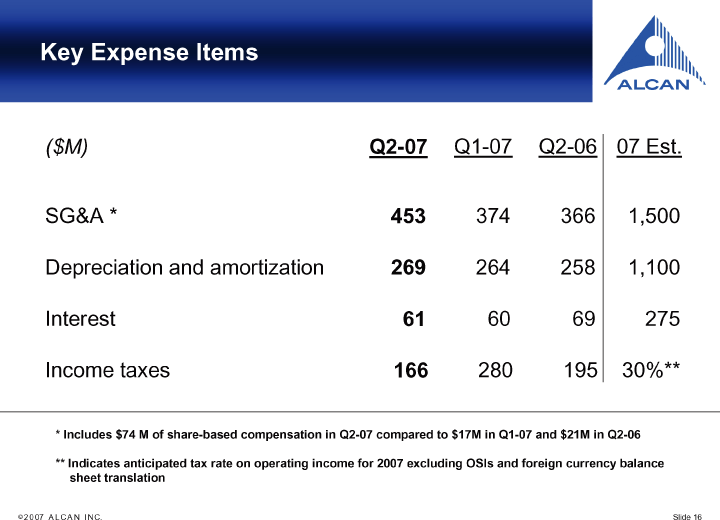
| Key Expense Items($M)Q2-07Q1-07 Q2-06 07 Est. SG&A *453374 366 1,500 Depreciation and amortization269264 258 1,100 Interest6160 69 275 Income taxes166280 195 30%** 771* Includes $74 M of share-based compensation in Q2-07 compared to $17M in Q1-07 and $21M in Q2-06 ** Indicates anticipated tax rate on operating income for 2007 excluding OSIs and foreign currency balance sheet translation |
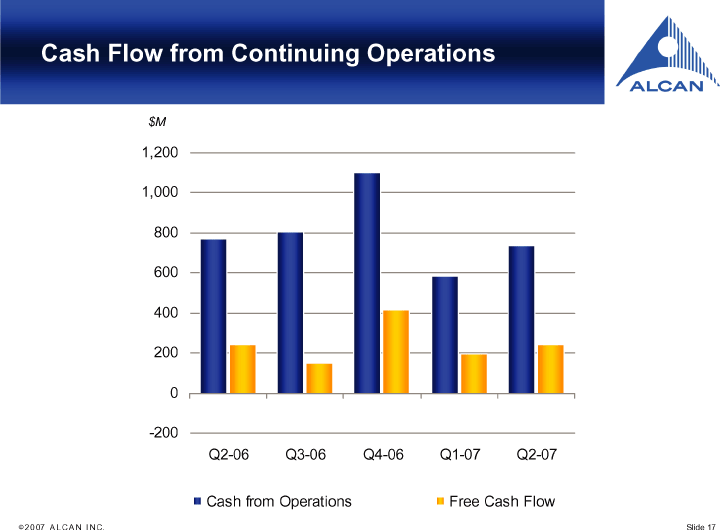
| Cash Flow from Continuing Operations$M 1,200 1,000 800 600 400 200 0 - -200 Q2-06 Q3-06 Q4-06 Q1-07 Q2-07 Cash from Operations Free Cash Flow Slide 17 |
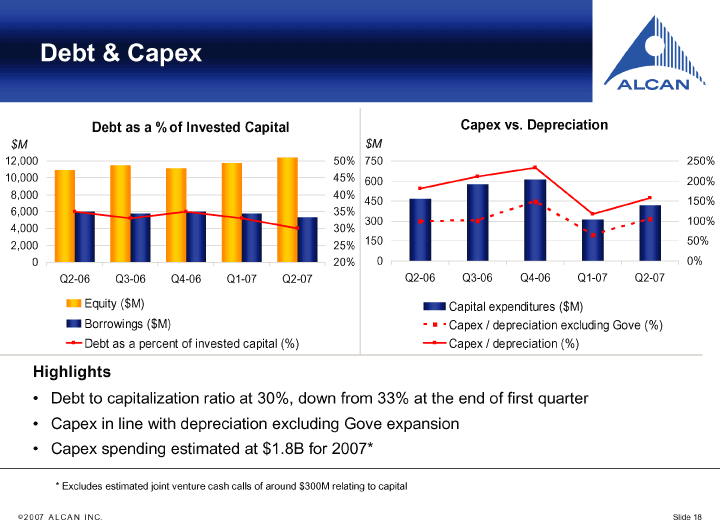
| Debt & Capex Debt as a % of Invested Capital Capex vs. Depreciation$M $M 12,000 50% 750 250% 10,00045% 600200% 8,000 40% 450150% 6,000 35% 300 100% 4,000 30% 150 50% 2,000 25% 0 20% 00% Q2-06 Q3-06 Q4-06 Q1-07 Q2-07 Q2-06 Q3-06 Q4-06 Q1-07 Q2-07 Equity ($M) Capital expenditures ($M) Borrowings ($M) Capex / depreciation excluding Gove (%) Debt as a percent of invested capital (%) Capex / depreciation (%)Highlights · Debt to capitalization ratio at 30%, down from 33% at the end of first quarter · Capex in line with depreciation excluding Gove expansion · Capex spending estimated at $1.8B for 2007* * Excludes estimated joint venture cash calls of around $300M relating to capital© 2 0 07 A L C A N I N C. Slide 18 |
| BUSINESS PERFORMANCE AND OUTLOOK |
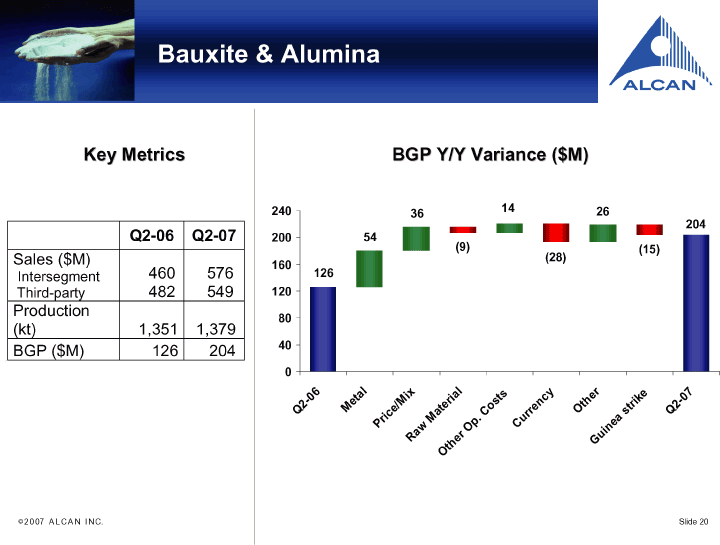
| Bauxite & Alumina Key Metrics Q2-06 Q2-07 Sales ($M) Intersegment 460 576 Third-party 482 549 Production (kt) 1,351 1,379 BGP ($M) 126 204 |
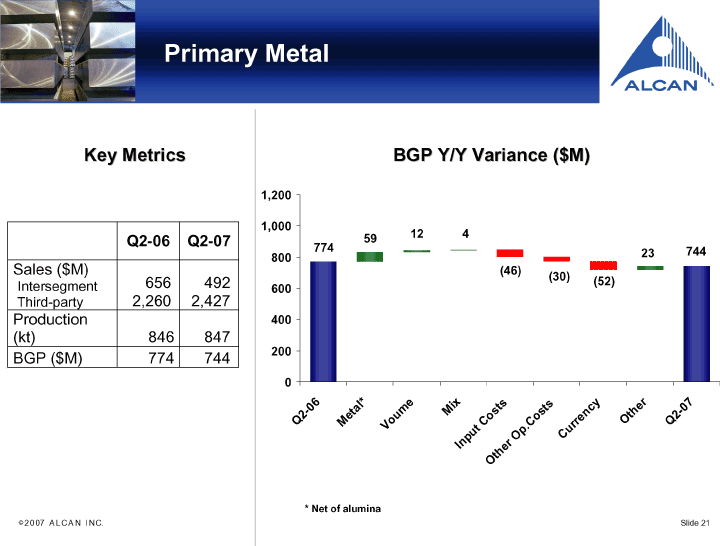
| Primary Metal Key Metrics Q2-06 Q2-07 Sales ($M) Intersegment 656 492 Third-party 2,260 2,427 Production (kt) 846 847 BGP ($M) 774 744 |
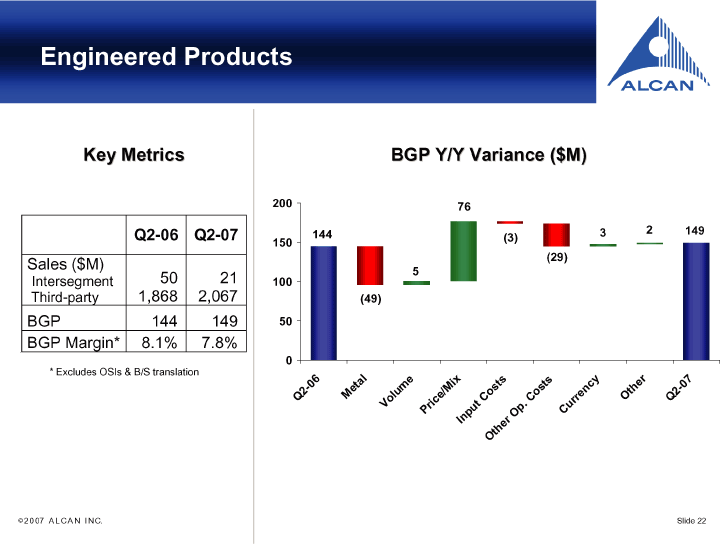
| Engineered Products Key Metrics Q2-06 Q2-07 Sales ($M) Intersegment 50 21 Third-party 1,868 2,067 BGP 144 149 BGP Margin* 8.1% 7.8% * Excludes OSIs & B/S translation |
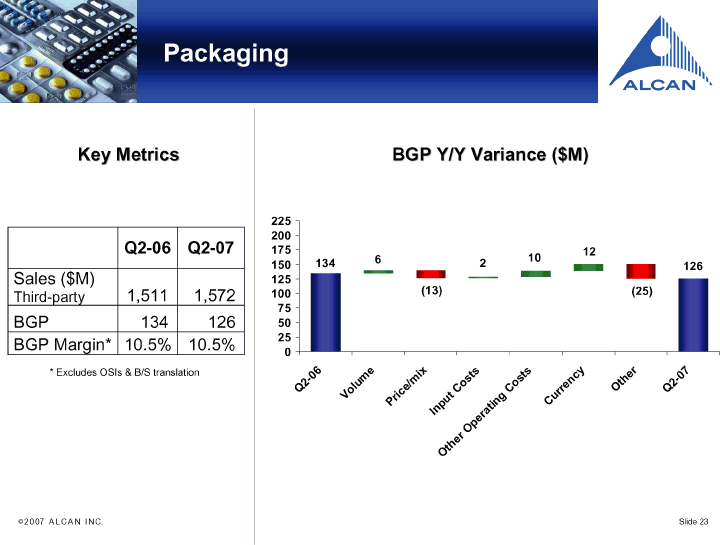
| Packaging Key Metrics Q2-06 Q2-07 Sales ($M) Third-party 1,511 1,572 BGP 134 126 BGP Margin* 10.5% 10.5% 7 * Excludes OSIs & B/S translation |
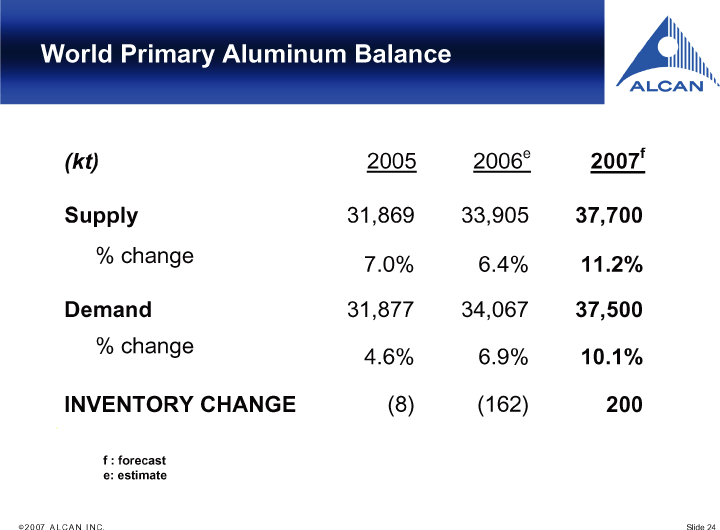
| World Primary Aluminum Balance (kt) 2005 2006 e 2007 f Supply 31,869 33,905 37,700 % change 7.0% 6.4% 11.2% Demand 31,877 34,067 37,500 % change 4.6% 6.9% 10.1% INVENTORY CHANGE (8) (162) 200 771 f : forecast e: estimate |
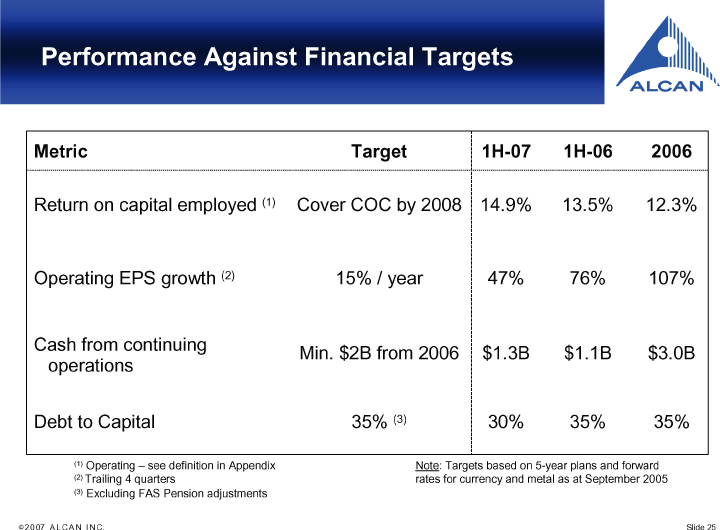
| Performance Against Financial Targets Metric Target 1H-07 1H-06 2006 Return on capital employed(1) Cover COC by 2008 14.9% 13.5% 12.3% Operating EPS growth(2) 15% / year 47% 76% 107% Cash from continuing Min. $2B from 2006 $1.3B $1.1B $3.0B operations Debt to Capital 35%(3) 30% 35% 35%(1)Operating — see definition in Appendix Note : Targets based on 5-year plans and forward(2)Trailing 4 quarters rates for currency and metal as at September 2005(3)Excluding FAS Pension adjustments |
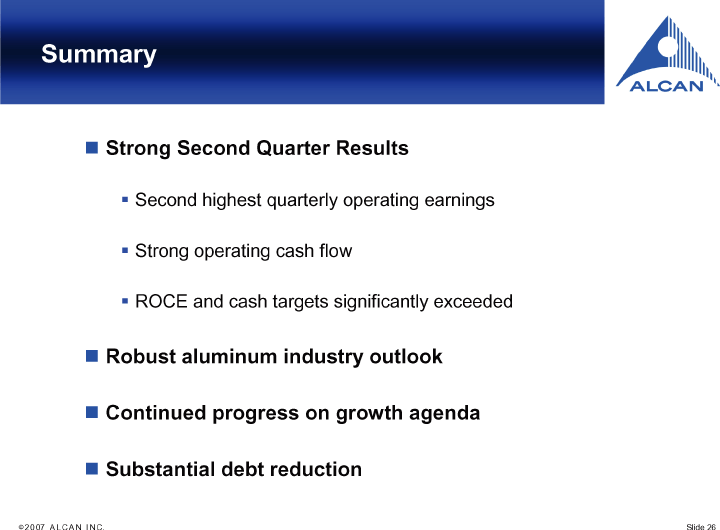
| Summary 3 Strong Second Quarter Results 3Second highest quarterly operating earnings3Strong operating cash flow3ROCE and cash targets significantly exceeded3 Robust aluminum industry outlook 3 Continued progress on growth agenda 3 Substantial debt reduction |
| APPENDIX |
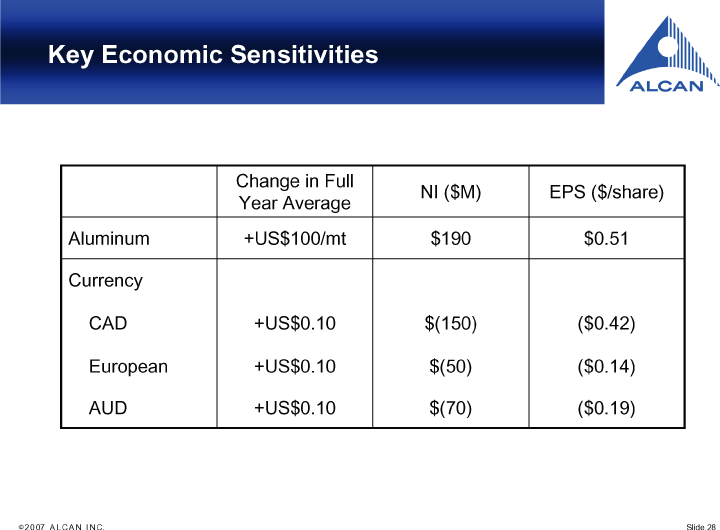
| Key Economic Sensitivities Change in Full NI ($M) EPS ($/share) Year Average Aluminum +US$100/mt $190 $0.51 Currency CAD +US $0.10 $(150) ($0.42) European +US $0.10 $(50) ($0.14) AUD +US $0.10 $(70) ($0.19) |
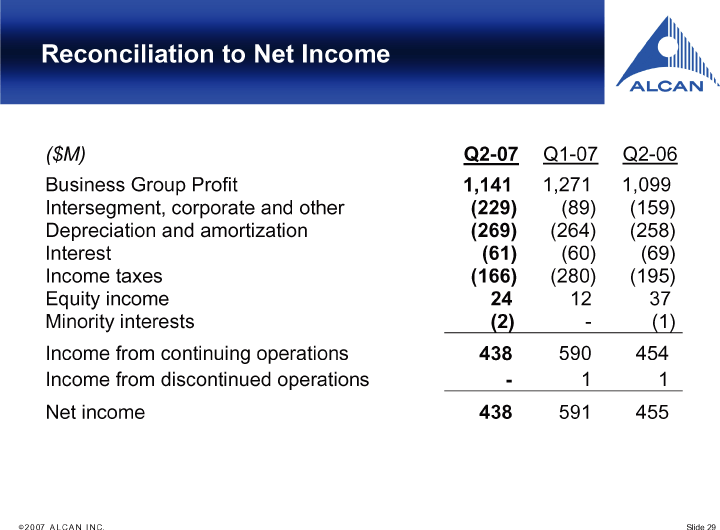
| Reconciliation to Net Income($M)Q2-07Q1-07 Q2-06 Business Group Profit1,1411,271 1,099 Intersegment, corporate and other(229)(89) (159) Depreciation and amortization(269)(264) (258) Interest(61)(60) (69) Income taxes(166)(280) (195) Equity income2412 37 Minority interests(2)- (1) Income from continuing operations438590 454 Income from discontinued operations-1 1 Net income438591 455 |
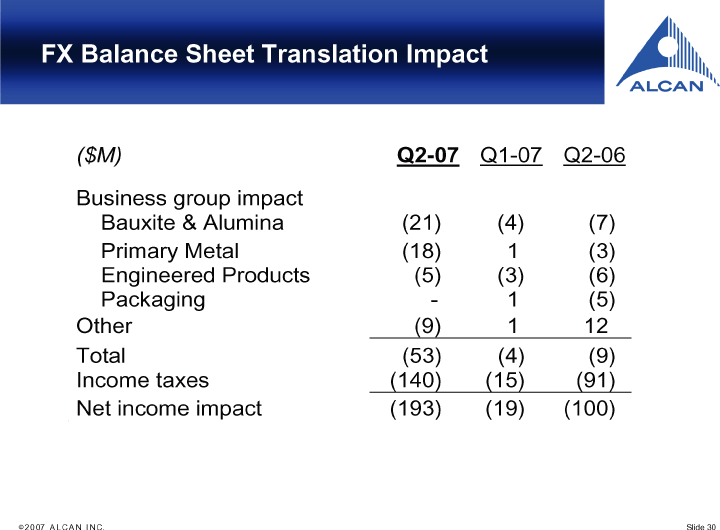
| FX Balance Sheet Translation Impact($M)Q2-07Q1-07 Q2-06 Business group impact Bauxite & Alumina (21) (4) (7) Primary Metal (18) 1 (3) Engineered Products (5) (3) (6) Packaging — 1 (5) Other (9) 1 12 Total (53) (4) (9) Income taxes (140) (15) (91) Net income impact (193) (19) (100) 7 |
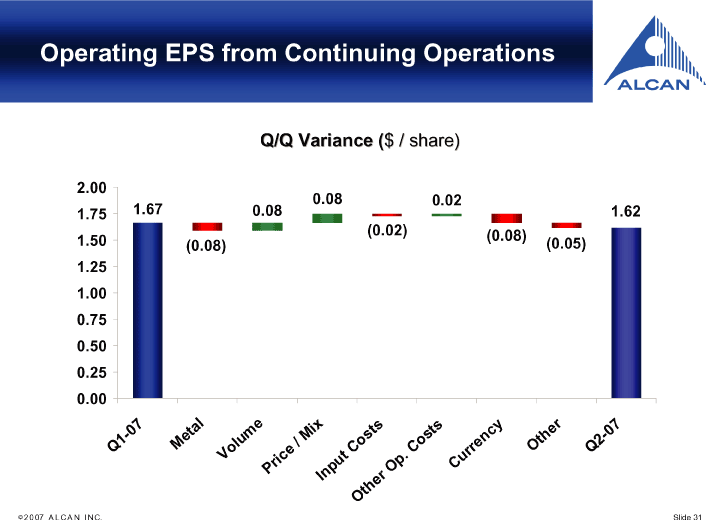
| Operating EPS from Continuing Operations |
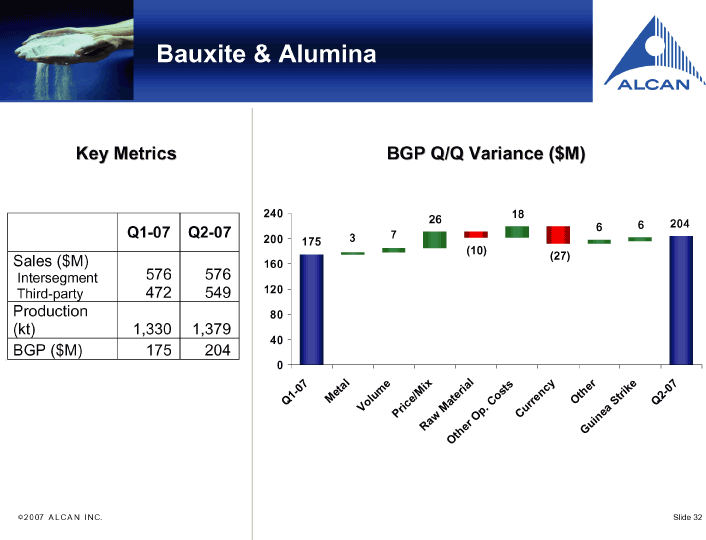
| Bauxite & Alumina Key Metrics Q1-07 Q2-07 Sales ($M) Intersegment 576 576 Third-party 472 549 Production (kt) 1,330 1,379 BGP ($M) 175 204 |
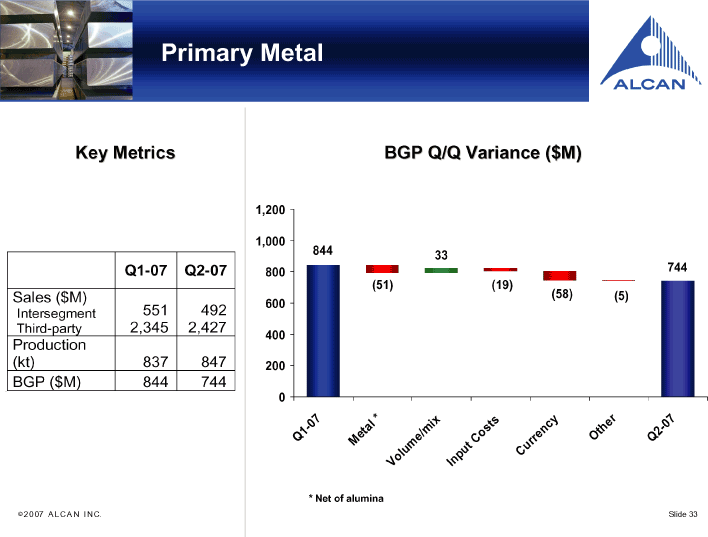
| Primary Metal Key Metrics Q1-07 Q2-07 Sales ($M) Intersegment 551 492 Third-party 2,345 2,427 Production (kt) 837 847 BGP ($M) 844 744 |
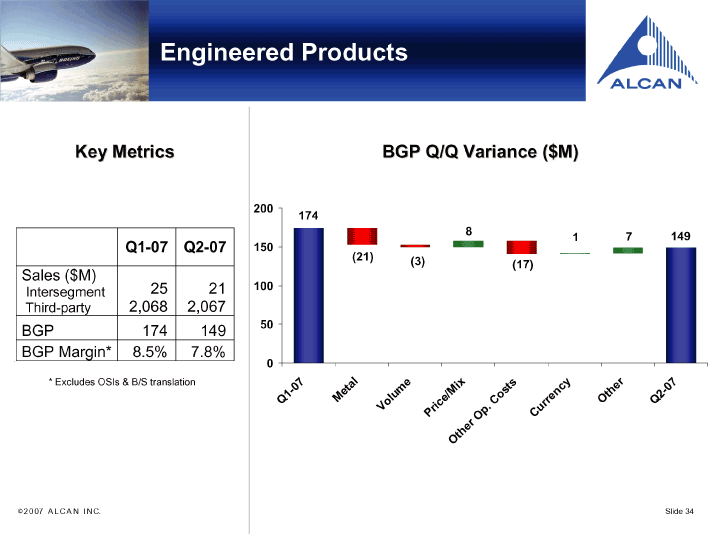
| Engineered Products Key Metrics Q1-07 Q2-07 Sales ($M) Intersegment 25 21 Third-party 2,068 2,067 BGP 174 149 BGP Margin* 8.5% 7.8% * Excludes OSIs & B/S translation |
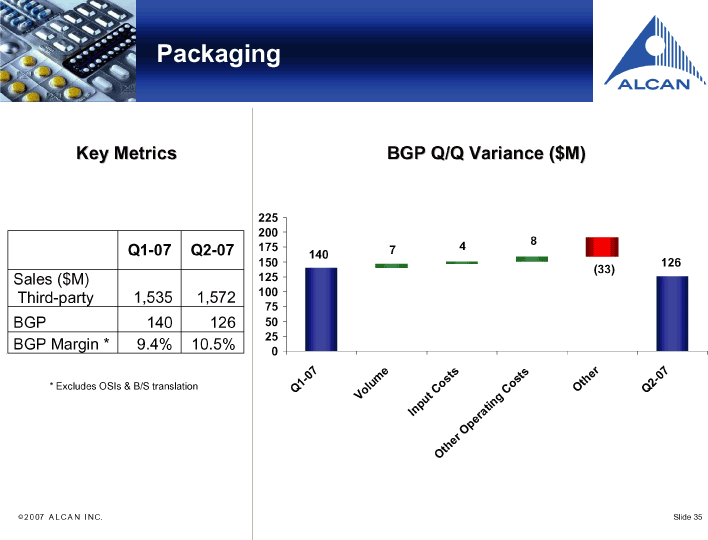
| Packaging Key Metrics Q1-07 Q2-07 Sales ($M) Third-party 1,535 1,572 BGP 140 126 BGP Margin * 9.4% 10.5% * Excludes OSIs & B/S translation |
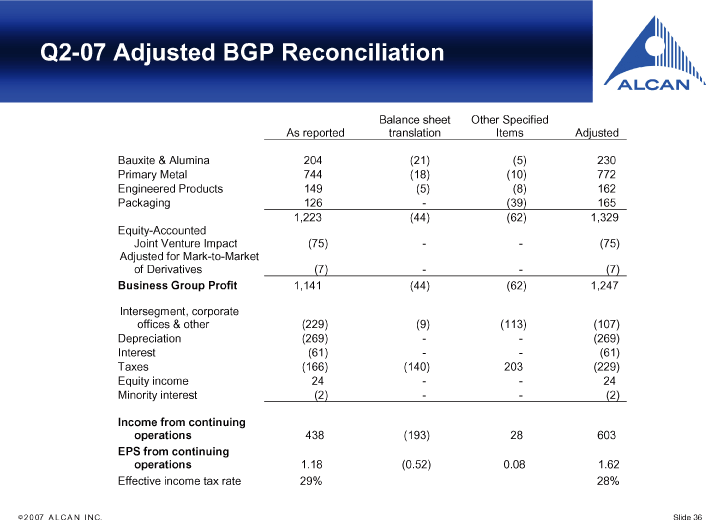
| Q2-07 Adjusted BGP Reconciliation Balance sheet Other Specified As reported translation Items Adjusted Bauxite & Alumina 204 (21) (5) 230 Primary Metal 744 (18) (10) 772 Engineered Products 149 (5) (8) 162 Packaging 126 — (39) 165 1,223 (44) (62) 1,329 Equity-Accounted Joint Venture Impact (75) — - (75) Adjusted for Mark-to-Market of Derivatives (7) — - (7)Business Group Profit1,141 (44) (62) 1,247 Intersegment, corporate offices & other (229) (9) (113) (107) Depreciation (269) — - (269) Interest (61) — - (61) Taxes (166) (140) 203 (229) Equity income 24 — - 24 Minority interest (2) — - (2)Income from continuing operations438 (193) 28 603EPS from continuing operations1.18 (0.52) 0.08 1.62 Effective income tax rate 29% 28% |
| Operating EPS Definition Operating earnings per share from continuing operations "Operating EPS” is presented in addition to income from continuing operations and net income. Operating EPS is not calculated in accordance with U.S. GAAP and there is no standard definition of this term. Accordingly, it is unlikely that comparisons can be made among different companies that make operating earnings information available. The Company believes that operating EPS from continuing operations is a useful measure because it excludes items that are not typical of ongoing operating activities, such as Other Specified Items, as well as items that are outside management’s control, such as the impact of foreign currency balance sheet translation. The determination of whether an item is treated as an Other Specified Item involves the exercise of judgement by Alcan management. Management has concluded that operating earnings is a relevant measure for shareholders and other investors as it removes the inherent volatility of such items, whether favourable or unfavourable, and provides a clearer picture of underlying business performance. Moreover, the measure is in line with the Company’s internal performance measurement and management systems. Operating earnings information has historically been presented in response to requests from investors and financial analysts, who have indicated that they find the information highly relevant and essential to their understanding of the Company. |
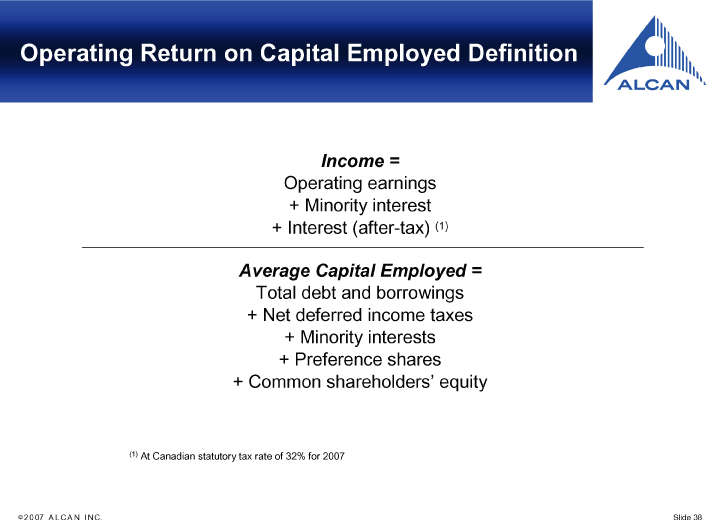
| Operating Return on Capital Employed DefinitionIncome = Operating earnings + Minority interest + Interest (after-tax)(1)Average Capital Employed = Total debt and borrowings + Net deferred income taxes + Minority interests + Preference shares + Common shareholders’ equity(1)At Canadian statutory tax rate of 32% for 2007 |
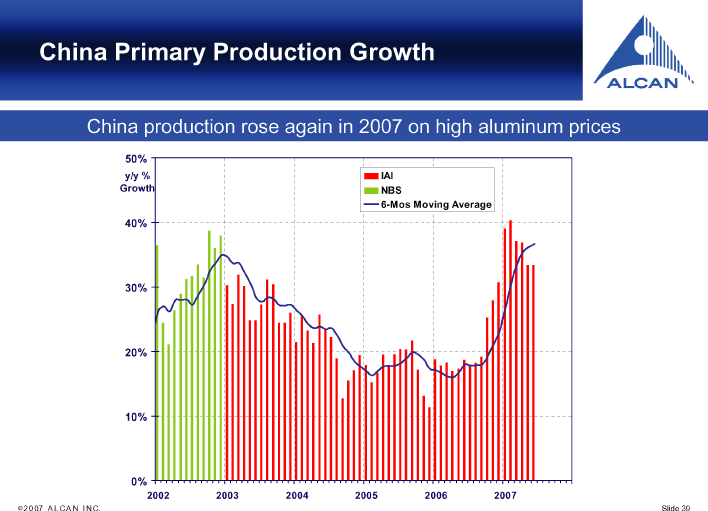
| China Primary Production Growth China production rose again in 2007 on high aluminum prices |
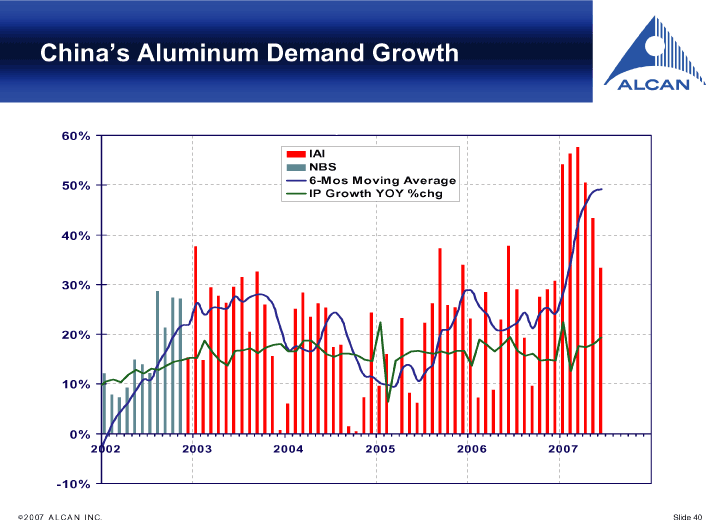
| China’s Aluminum Demand Growth |
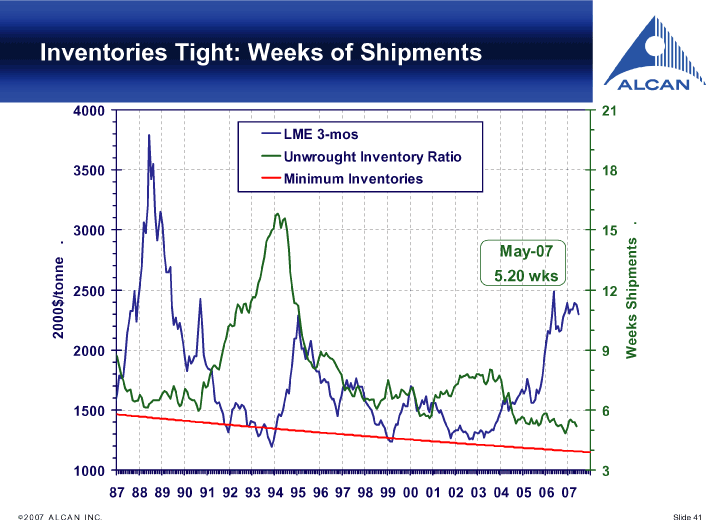
| Inventories Tight: Weeks of Shipments |
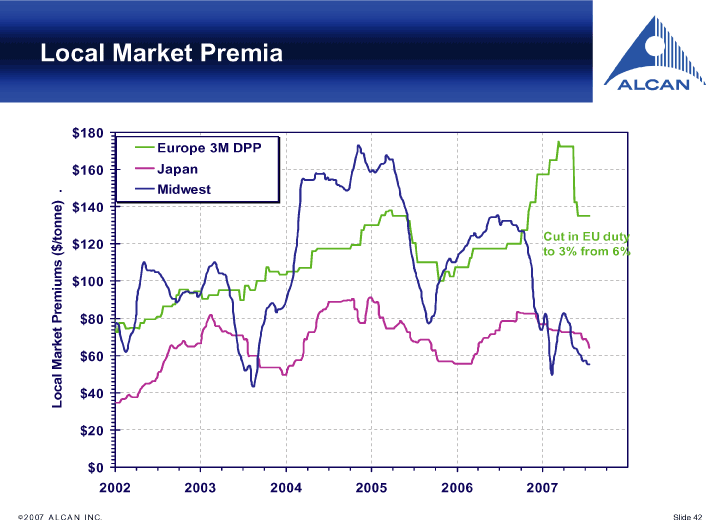
| Local Market Premia |
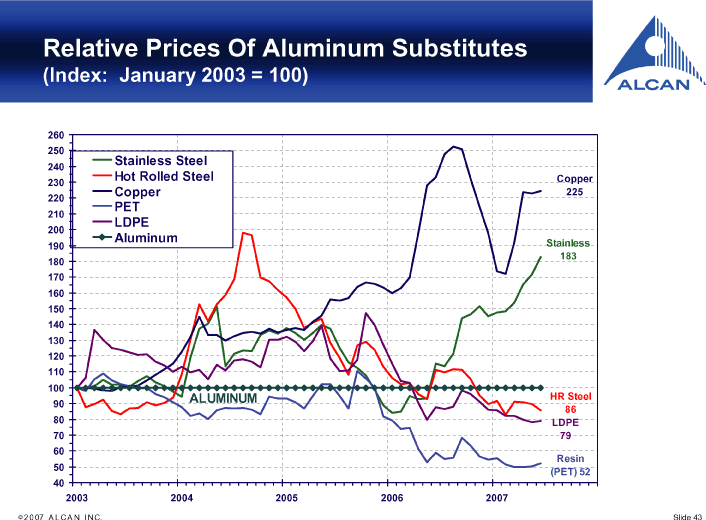
| Relative Prices Of Aluminum Substitutes (Index: January 2003 = 100) |
| alcan |