Exhibit 99.1
Gray
Television Digital Mobile
Gray Television, Inc. Investor Presentation
NYSE:GTN
April 2015
Disclaimer
Gray
Television Digital Mobile
Certain statements in this presentation constitute “forward-looking statements” within the meaning of and subject to the protections of the Private Securities Litigation Reform Act of 1995 and other federal and state securities laws. Such forward-looking statements involve known and unknown risks, uncertainties and other factors which may cause the actual results, performance or achievements of the Company to be materially different from any future results, performance or achievements expressed or implied by such “forward-looking statements.” Factors that could cause our actual results to differ materially from those expressed or implied by any forward-looking statements are described under the heading “Risk Factors” in our Annual Report on Form 10-K for the year ended December 31, 2014 and may be contained in our other reports subsequently filed with the SEC.
See the appendix to this presentation for the definition of certain capitalized terms used herein. Reconciliations of the Company’s non-GAAP measures of broadcast cash flow, broadcast cash flow less cash corporate expenses, operating cash flow as defined in the credit agreement, and free cash flow are contained in the appendix
Gray Television, Inc.
2
Gray
Television Digital Mobile
Overview
An Industry Leading Power
Gray
Television Digital Mobile
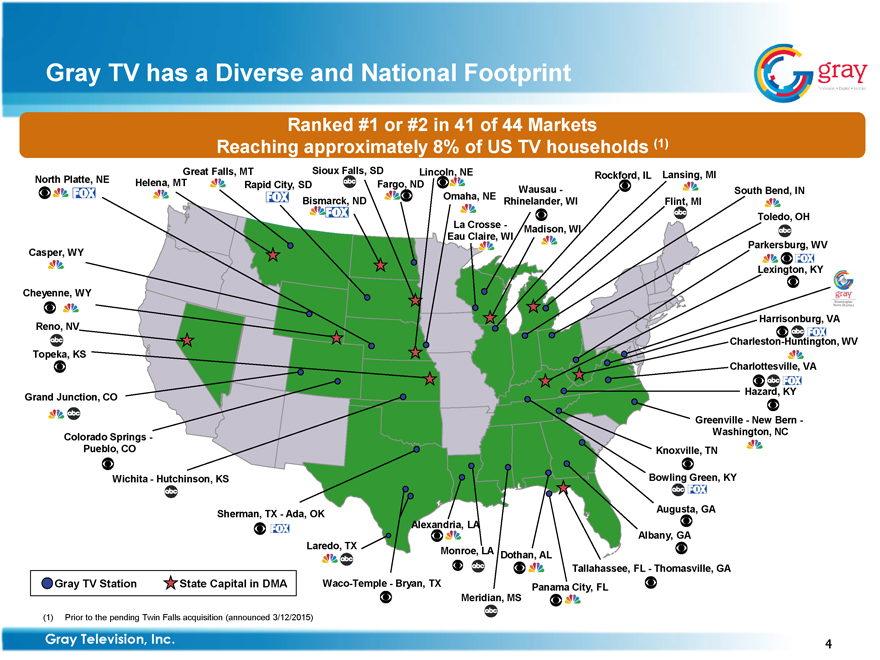
Gray TV has a Diverse and National Footprint
Ranked #1 or #2 in 41 of 44 Markets
Reaching approximately 8% of US TV households (1)
Reno, NV
Lincoln, NE
La Crosse - Eau Claire, WI
Madison, WI
Rockford, IL
Parkersburg, WV
Harrisonburg, VA
Lexington, KY
Bowling Green, KY
Knoxville, TN
Dothan, AL
Waco-Temple - Bryan, TX
Colorado Springs - Pueblo, CO
Charlottesville, VA
Grand Junction, CO
Wausau -
Rhinelander, WI
Charleston-Huntington, WV
South Bend, IN
Albany, GA
Laredo, TX
Cheyenne, WY
Casper, WY
Bismarck, ND
Sioux Falls, SD
North Platte, NE
Rapid City, SD
Great Falls, MT
Flint, MI
Topeka, KS
Omaha, NE
Lansing, MI
Hazard, KY
Greenville - New Bern - Washington, NC
Augusta, GA
Tallahassee, FL - Thomasville, GA
Panama City, FL
Meridian, MS
Sherman, TX - Ada, OK
Wichita - Hutchinson, KS
Fargo, ND
Alexandria, LA
Monroe, LA
Helena, MT
Toledo, OH
Gray TV Station State Capital in DMA
(1) Prior to the pending Twin Falls acquisition (announced 3/12/2015)
Gray Television, Inc.
4
Gray
Television Digital Mobile
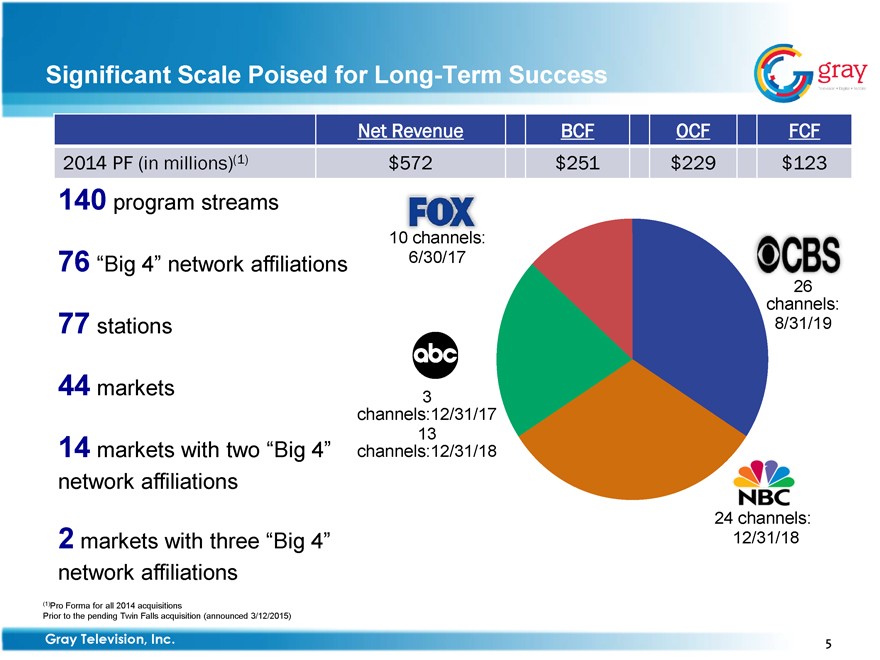
Significant Scale Poised for Long-Term Success
Net Revenue BCF OCF FCF
2014 PF (in millions)(1) $572 $251 $229 $123
140 program streams
FOX
10 channels:
76 “Big 4” network affiliations 6/30/17
CBS
26
channels:
77 stations 8/31/19
44 markets
abc
3
channels:12/31/17
13
14 markets with two “Big 4” channels:12/31/18
network affiliations
NBC
24 channels:
2 markets with three “Big 4” 12/31/18
network affiliations
(1)Pro Forma for all 2014 acquisitions
Prior to the pending Twin Falls acquisition (announced 3/12/2015)
Gray Television, Inc.
5
Gray
Television Digital Mobile
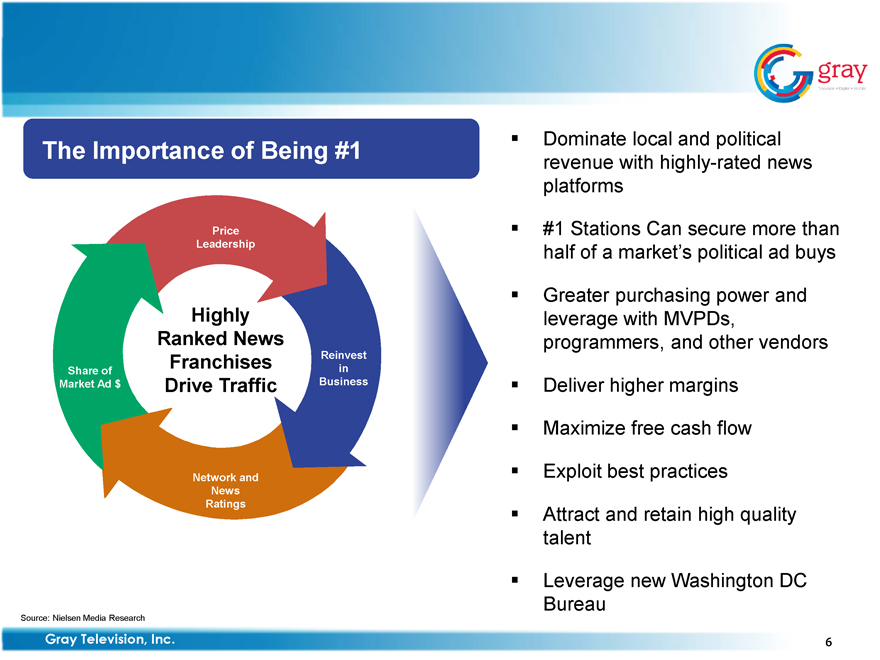
The Importance of Being #1
Price Leadership
Network and News Ratings
Share of Market Ad $ Highly Ranked News Franchises Drive Traffic Reinvest in Business
Dominate local and political revenue with highly-rated news platforms
#1 Stations Can secure more than half of a market’s political ad buys
Greater purchasing power and leverage with MVPDs, programmers, and other vendors
Deliver higher margins
Maximize free cash flow
Exploit best practices
Attract and retain high quality talent
Leverage new Washington DC Bureau
Source: Nielsen Media Research
Gray Television, Inc. 6
Gray
Television Digital Mobile
Gray Dominates the Industry with the Highest Quality Portfolio of Local Television Stations
41 of 44 markets with stations ranked #1 or #2
28 of 44 markets with #1 news ranking
Only pure-play TV broadcaster with a full-time Washington DC Bureau
Gray
Washington
News Bureau
Prior to the pending Twin Falls acquisition (announced 3/12/2015)
Gray Television, Inc. 7
Gray
Television Digital Mobile
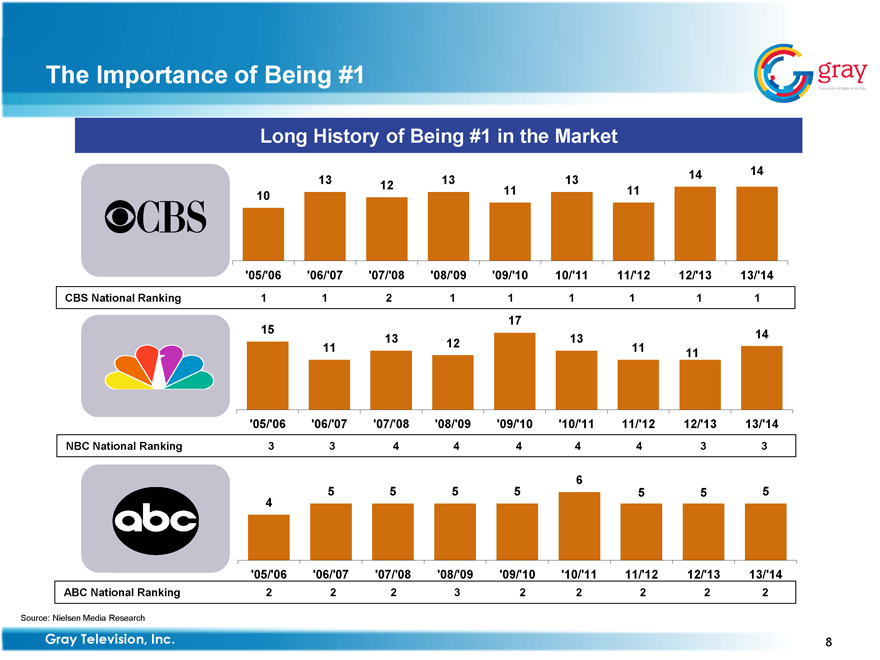
The Importance of Being #1
Long History of Being #1 in the Market
13 13 13 14 14
12 11 11
10
‘05/‘06 ‘06/‘07 ‘07/‘08 ‘08/‘09 ‘09/‘10 10/‘11 11/‘12 12/‘13 13/‘14
CBS National Ranking 1 1 2 1 1 1 1 1 1
17
15 13 13 14
11 12 11
11
‘05/‘06 ‘06/‘07 ‘07/‘08 ‘08/‘09 ‘09/‘10 ‘10/‘11 11/‘12 12/‘13 13/‘14
NBC National Ranking 3 3 4 4 4 4 4 3 3
6
5 5 5 5 5 5 5
4
‘05/‘06 ‘06/‘07 ‘07/‘08 ‘08/‘09 ‘09/‘10 ‘10/‘11 11/‘12 12/‘13 13/‘14
ABC National Ranking 2 2 2 3 2 2 2 2 2
Source: Nielsen Media Research
Gray Television, Inc. 8
Gray
Television Digital Mobile
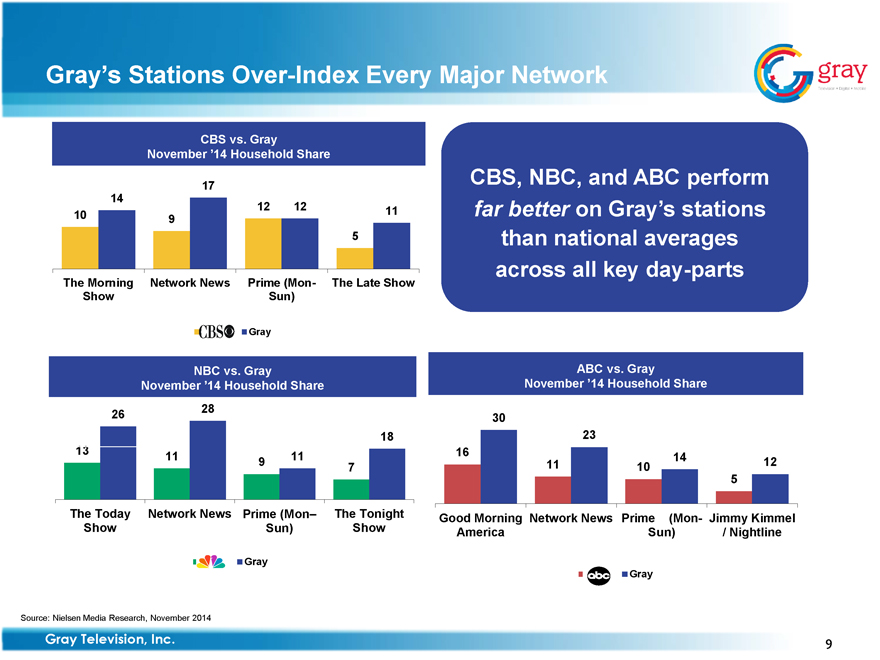
Gray’s Stations Over-Index Every Major Network Gray
CBS vs. Gray November ‘14 Household Share
10 14 9 17 12 12 5 11
The Morning Show Network News Prime (Mon-Sun) The Late Show
CBS, NBC, and ABC perform far better on Gray’s stations than national averages across all key day-parts
CBS Gray
NBC vs. Gray November ‘14 Household Share ABC vs. Gray November ‘14 Household Share
13 26 11 28 9 11 9 7 18 16 30 11 23 10 14 5 12
The Today Show Network News Prime (Mon-Sun) The Tonight Show Good Morning America Network News Prime (Mon-Sun) Jimmy Kimmel / Nightline
Gray abc Gray
Source: Nielsen Media Research, November 2014
Gray Television, Inc. 9
Gray
Television Digital Mobile
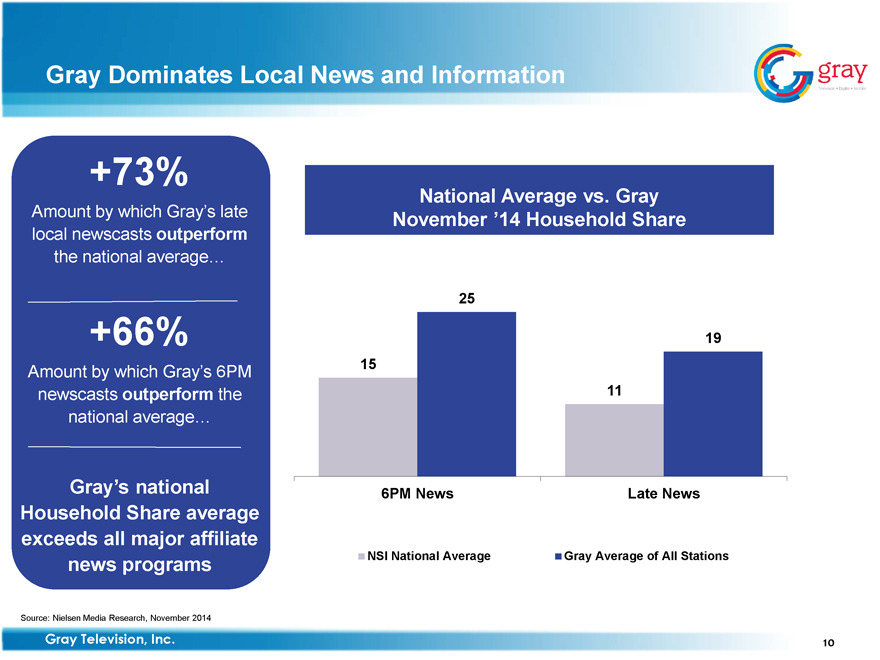
Gray Dominates Local News and Information
+73%
Amount by which Gray’s late local newscasts outperform the national average…
+66%
Amount by which Gray’s 6PM newscasts outperform the national average…
Gray’s national Household Share average exceeds all major affiliate news programs
National Average vs. Gray November ’14 Household Share
| | |
25 | | |
| | | 19 |
15 | | |
| | | 11 |
6PM News | | Late News |
NSI National Average | | Gray Average of All Stations |
Source: Nielsen Media Research, November 2014
Gray Television, Inc. 10
Gray
Television Digital Mobile
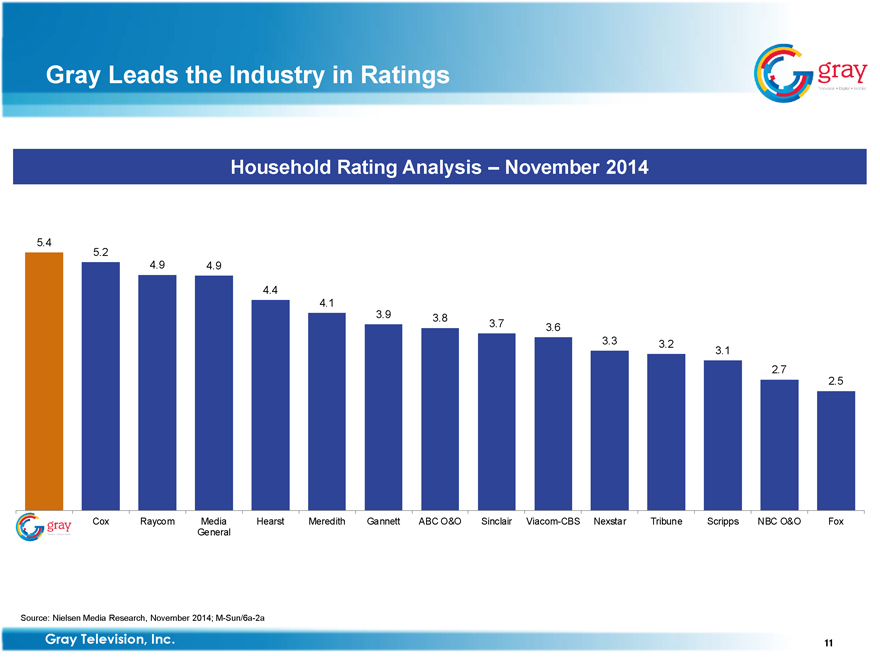
Gray Leads the Industry in Ratings
Household Rating Analysis – November 2014
|
5.4 |
5.2 |
4.9 4.9 |
4.4 |
4.1 |
3.9 3.8 3.7 3.6 |
3.3 3.2 3.1 |
2.7 |
2.5 |
gray Cox Raycom Media General Hearst Meredith Gannett ABC O&O Sinclair Viacom-CBS Nexstar Tribune Scripps NBC O&O Fox |
| |
Source: Nielsen Media Research, November 2014; M-Sun/6a-2a
Gray Television, Inc. 11
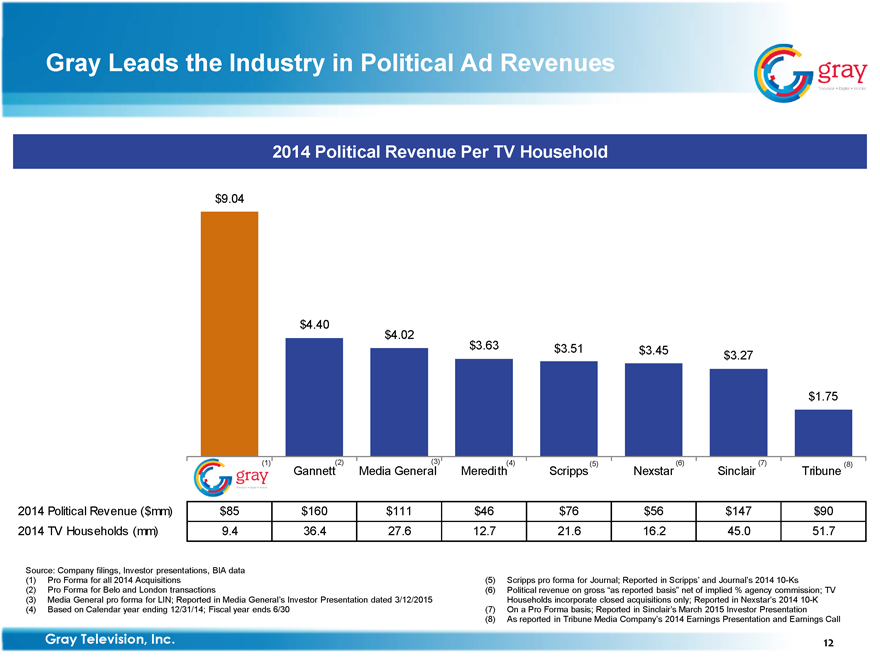
Gray Television Digital Mobile Gray Leads the Industry in Political Ad Revenues 2014 Political Revenue Per TV Household
| | | | | | | | | | | | | | | | |
| | | $9.04 | | | | | | | | | | | | | | |
| | | | | $4.40 | | | | | | | | | | | | |
| | | | | | | $4.02 | | | | | | | | | | |
| | | | | | | | | $3.63 | | $3.51 | | $3.45 | | $3.27 | | |
| | | | | | | | | | | | | | | | | $1.75 |
| | | | | (1)(2) | | (3) | | (4) | | (5) | | (6) | | (7) | | (8) |
| | | gray | | Gannett | | Media General | | Meredith | | Scripps | | Nexstar | | Sinclair | | Tribune |
2014 Political Revenue ($mm) | | $85 | | $160 | | $111 | | $46 | | $76 | | $56 | | $147 | | $90 |
2014 TV Households (mm) | | 9.4 | | 36.4 | | 27.6 | | 12.7 | | 21.6 | | 16.2 | | 45.0 | | 51.7 |
Source: Company filings, Investor presentations, BIA data (1) Pro Forma for all 2014 Acquisitions (2) Pro Forma for Belo and London transactions (3) Media General pro forma for LIN; Reported in Media General’s Investor Presentation dated 3/12/2015 (4) Based on Calendar year ending 12/31/14; Fiscal year ends 6/30 (5) Scripps pro forma for Journal; Reported in Scripps’ and Journal’s 2014 10-Ks
(6) Political revenue on gross “as reported basis” net of implied % agency commission; TV Households incorporate closed acquisitions only; Reported in Nexstar’s 2014 10-K (7) On a Pro Forma basis; Reported in Sinclair’s March 2015 Investor Presentation (8) As reported in Tribune Media Company’s 2014 Earnings Presentation and Earnings Call Gray Television, Inc. 12
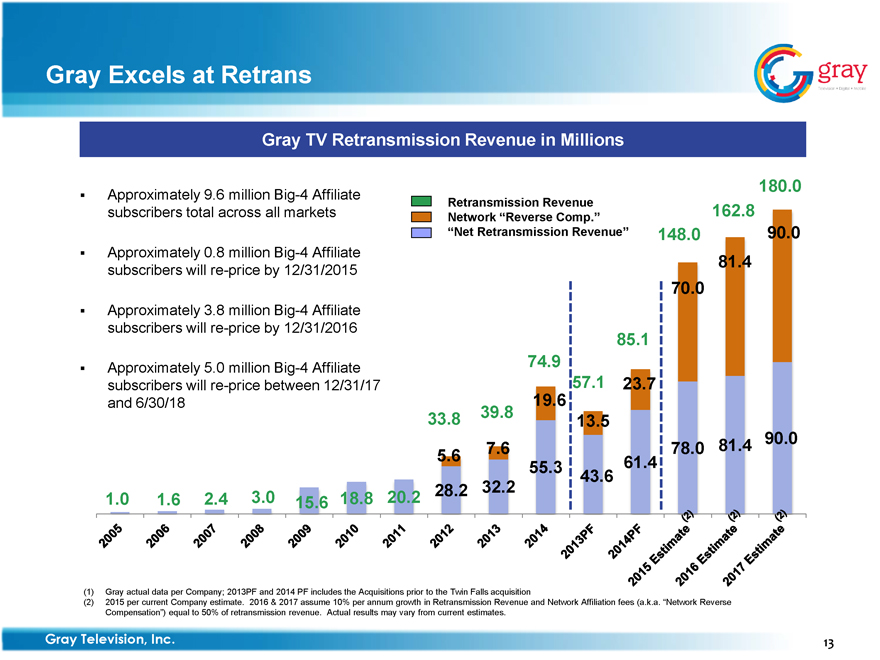
Gray Television Digital Mobile Gray Excels at Retrans Gray TV Retransmission Revenue in Millions
Approximately 9.6 million Big-4 Affiliate subscribers total across all markets Approximately 0.8 million Big-4 Affiliate subscribers will re-price by 12/31/2015 Approximately 3.8 million Big-4 Affiliate subscribers will re-price by 12/31/2016
Approximately 5.0 million Big-4 Affiliate subscribers will re-price between 12/31/17 and 6/30/18 Retransmission Revenue
Network “Reverse Comp.” “Net Retransmission Revenue”
180.0 162.8 148.0 90.0 81.4 70.0 85.1 74.9 57.1 23.7 19.6 33.8 39.8 13.5 7.6 78.0 81.4 90.0 5.6 55.3 61.4 43.6 1.0 1.6 2.4 3.0 15.6 18.8 20.2 28.2 32.2
(1) Gray actual data per Company; 2013PF and 2014 PF includes the Acquisitions prior to the Twin Falls acquisition
(2) 2015 per current Company estimate. 2016 & 2017 assume 10% per annum growth in Retransmission Revenue and Network Affiliation fees (a.k.a. “Network Reverse Compensation”) equal to 50% of retransmission revenue. Actual results may vary from current estimates. Gray Television, Inc. 13 2005 2006 2007 2008 2009 2010 2011 2012 2013 2014 2013PF 2014PF 2015 Estimate (2) 2016 Estimate (2) 2017 Estimate (2)
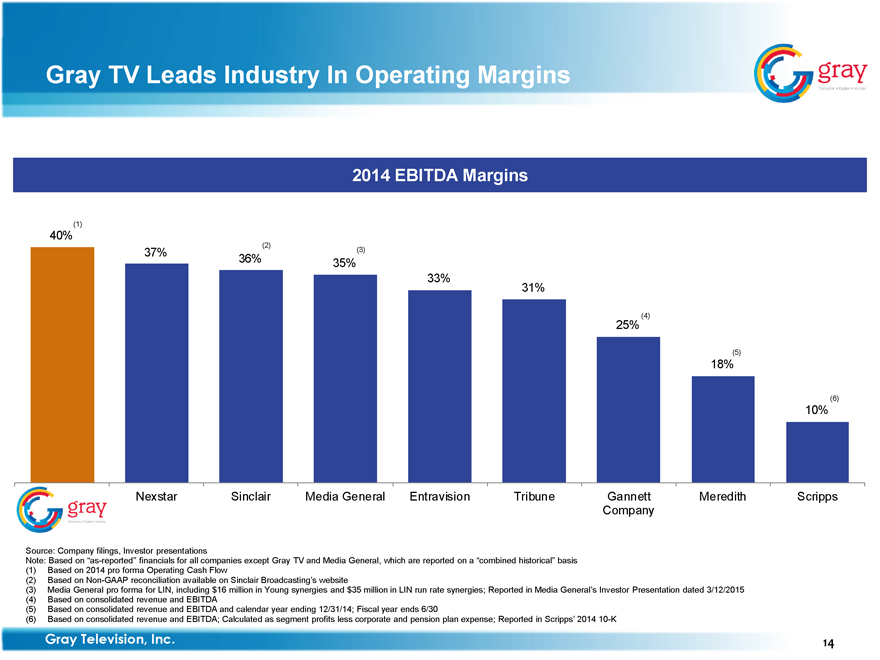
Gray Television Digital Mobile Gray TV Leads Industry In Operating Margins
2014 EBITDA Margins
(1) 40% (2) 37% (3) 36% 35% 33% 31% 25%(4) (5) 18% (6) 10% gray Nexstar Sinclair Media General Entravision Tribune Gannett Meredith Scripps Company
Source: Company filings, Investor presentations
Note: Based on “as-reported” financials for all companies except Gray TV and Media General, which are reported on a “combined historical” basis (1) Based on 2014 pro forma Operating Cash Flow (2) Based on Non-GAAP reconciliation available on Sinclair Broadcasting’s website (3) Media General pro forma for LIN, including $16 million in Young synergies and $35 million in LIN run rate synergies; Reported in Media General’s Investor Presentation dated 3/12/2015
(4) Based on consolidated revenue and EBITDA (5) Based on consolidated revenue and EBITDA and calendar year ending 12/31/14; Fiscal year ends 6/30 (6) Based on consolidated revenue and EBITDA; Calculated as segment profits less corporate and pension plan expense; Reported in Scripps’ 2014 10-K Gray Television, Inc. 14
Gray
Television Digital Mobile
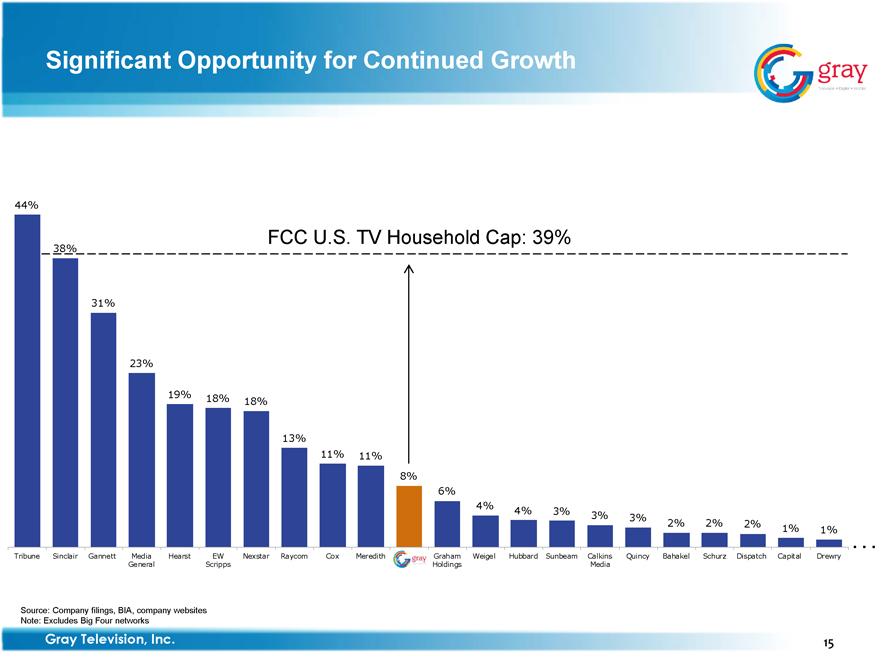
44% FCC U.S. TV Household Cap: 39% 38% 31% 23% 19% 18% 18% 13% 11% 11% 8% 6% 4% 4% 3% 3% 3% 2% 2% 2% 1% 1% Tribune Sinclair Gannett Media Hearst EW Nexstar Raycom Cox Meredith Graham Weigel Hubbard Sunbeam Calkins Quincy Bahakel Schurz Dispatch Capital Drewry General Scripps Holdings Media
Source: Company filings, BIA, company websites Note: Excludes Big Four networks
Gray Television, Inc. 15
Gray
Television Digital Mobile
Investment Highlights
Gray
Television Digital Mobile
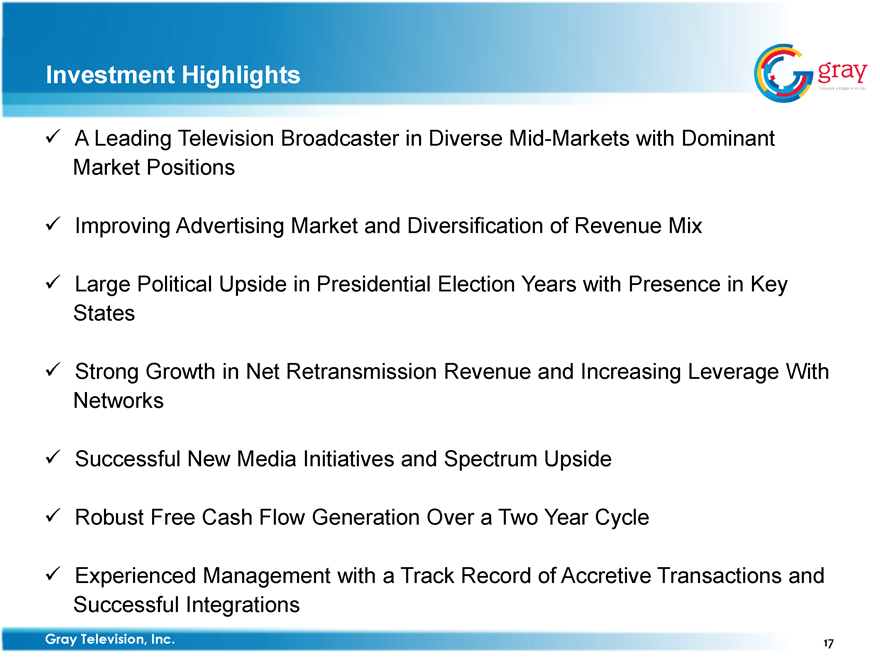
Investment Highlights
A Leading Television Broadcaster in Diverse Mid-Markets with Dominant Market Positions
Improving Advertising Market and Diversification of Revenue Mix
Large Political Upside in Presidential Election Years with Presence in Key States
Strong Growth in Net Retransmission Revenue and Increasing Leverage With Networks
Successful New Media Initiatives and Spectrum Upside
Robust Free Cash Flow Generation Over a Two Year Cycle
Experienced Management with a Track Record of Accretive Transactions and Successful Integrations
Gray Television, Inc. 17
Gray
Television Digital Mobile
Highly Experienced Senior Management
|
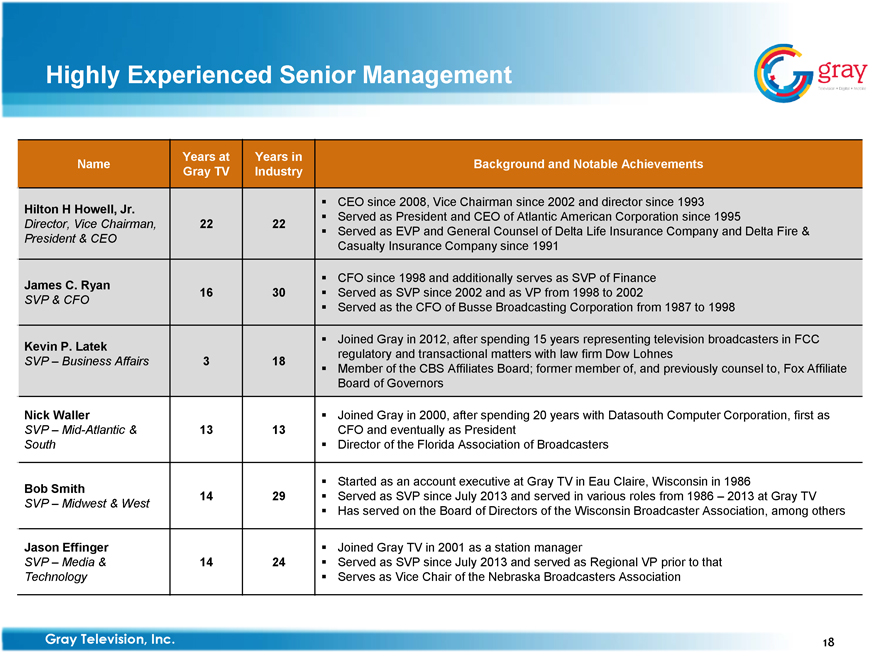
Years at Years in Name Background and Notable Achievements Gray TV Industry Hilton H Howell, Jr. CEO since 2008, Vice Chairman since 2002 and director since 1993 Director, Vice Chairman, 22 22 Served as President and CEO of Atlantic American Corporation since 1995 Served as EVP and General Counsel of Delta Life Insurance Company and Delta Fire & President & CEO Casualty Insurance Company since 1991 James C. Ryan CFO since 1998 and additionally serves as SVP of Finance 16 30 Served as SVP since 2002 and as VP from 1998 to 2002 SVP & CFO Served as the CFO of Busse Broadcasting Corporation from 1987 to 1998 Kevin P. Latek Joined Gray in 2012, after spending 15 years representing television broadcasters in FCC SVP – Business Affairs 3 18 regulatory and transactional matters with law firm Dow Lohnes Member of the CBS Affiliates Board; former member of, and previously counsel to, Fox Affiliate Board of Governors Nick Waller Joined Gray in 2000, after spending 20 years with Datasouth Computer Corporation, first as SVP – Mid-Atlantic & 13 13 CFO and eventually as President South Director of the Florida Association of Broadcasters Bob Smith Started as an account executive at Gray TV in Eau Claire, Wisconsin in 1986 14 29 Served as SVP since July 2013 and served in various roles from 1986 – 2013 at Gray TV SVP – Midwest & West Has served on the Board of Directors of the Wisconsin Broadcaster Association, among others Jason Effinger Joined Gray TV in 2001 as a station manager SVP – Media & 14 24 Served as SVP since July 2013 and served as Regional VP prior to that Technology Serves as Vice Chair of the Nebraska Broadcasters Association |
Gray Television, Inc. 18
Gray
Television Digital Mobile
Acquisitions Announced and Closed in 2014
Significantly Increased Scale and Margins
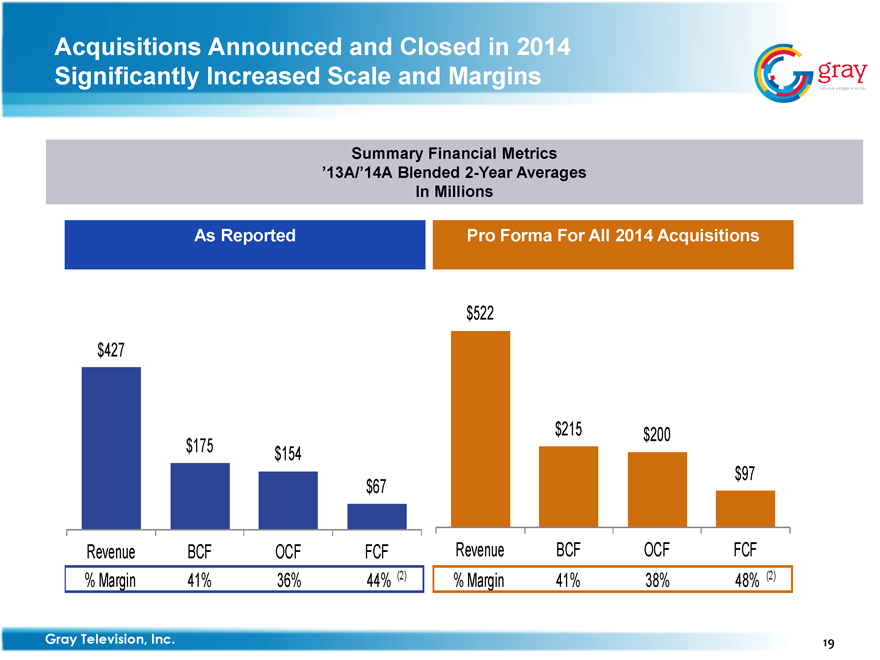
Summary Financial Metrics
’13A/’14A Blended 2-Year Averages
In Millions
| | | | | | | | | | | | | | |
| | | As Reported | | | | Pro Forma For All 2014 Acquisitions | | | | | | | | |
| | | | | | | | | $522 | | | | | | |
$427 | | | | | | | | | | | | | | |
| | | | | | | | | | | $215 | | $200 | | |
| | | $175 | | $154 | | | | | | | | | | |
| | | | | | | $67 | | | | | | | | $97 |
Revenue | | BCF | | OCF | | FCF | | Revenue | | BCF | | OCF | | FCF |
% Margin | | 41% | | 36% | | 44%(2) | | % Margin | | 41% | | 38% | | 48%(2) |
Gray Television, Inc. 19
gray
Television Digital Mobile
How Does Gray Grow…
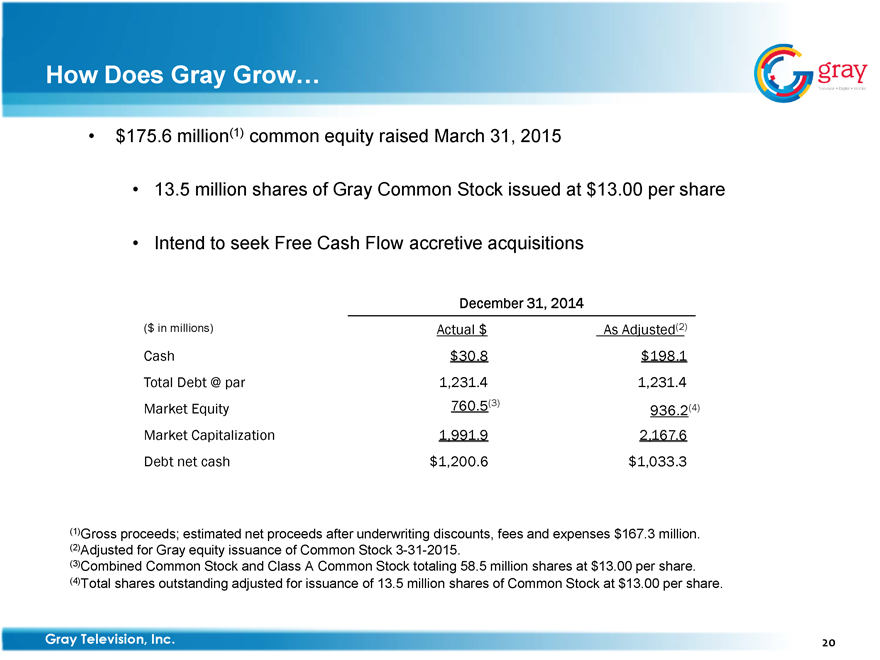
$175.6 million(1) common equity raised March 31, 2015
13.5 million shares of Gray Common Stock issued at $13.00 per share
Intend to seek Free Cash Flow accretive acquisitions
December 31, 2014
($ in millions)
Actual $
As Adjusted(2)
Cash
$30.8
$198.1
Total Debt @ par
1,231.4
1,231.4
Market Equity
760.5(3)
936.2(4)
Market Capitalization
1,991.9
2,167.6
Debt net cash
$1,200.6
$1,033.3
(1) Gross proceeds; estimated net proceeds after underwriting discounts, fees and expenses $167.3 million.
(2) Adjusted for Gray equity issuance of Common Stock 3-31-2015.
(3) Combined Common Stock and Class A Common Stock totaling 58.5 million shares at $13.00 per share.
(4) Total shares outstanding adjusted for issuance of 13.5 million shares of Common Stock at $13.00 per share.
Gray Television, Inc. 20
gray
Television Digital Mobile
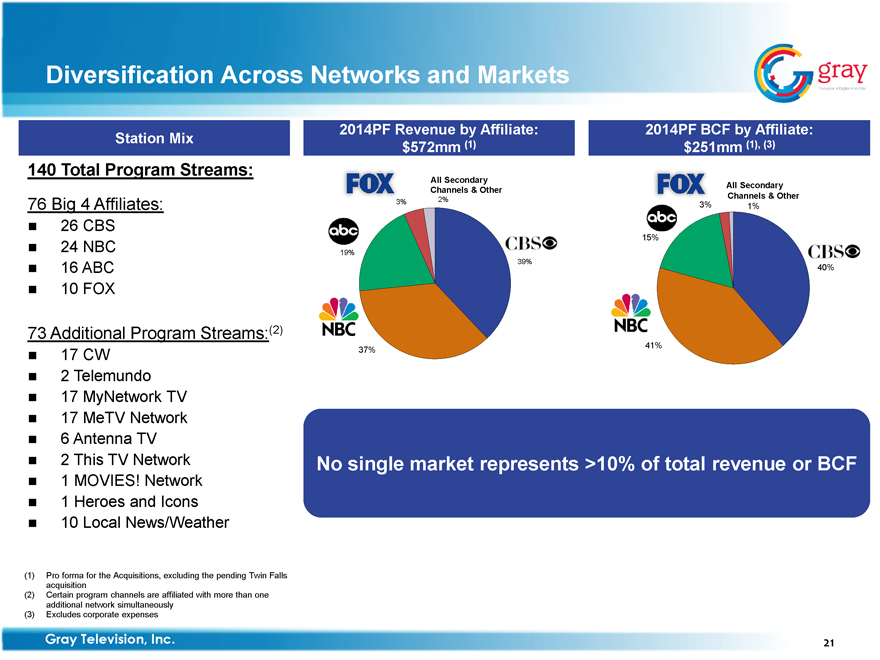
Station Mix
140 Total Program Streams:
76 Big 4 Affiliates:
26 CBS
24 NBC
16 ABC
10 FOX
73 Additional Program Streams:(2)
17 CW
2 Telemundo
17 MyNetwork TV
17 MeTV Network
6 Antenna TV
2 This TV Network
1 MOVIES! Network
1 Heroes and Icons
10 Local News/Weather
2014PF Revenue by Affiliate:
2014PF BCF by Affiliate:
$572mm (1)
$251mm (1), (3)
All Secondary
Channels & Other
All Secondary
FOX 3%
2%
Channels & Other
FOX 3%
1%
abc
abc
15%
19%
CBS
CBS
NBC
39%
NBC
40%
37%
41%
No single market represents >10% of total revenue or BCF
(1) Pro forma for the Acquisitions, excluding the pending Twin Falls acquisition
(2) Certain program channels are affiliated with more than one additional network simultaneously
(3) Excludes corporate expenses
Gray Television, Inc. 21
gray
Television Digital Mobile
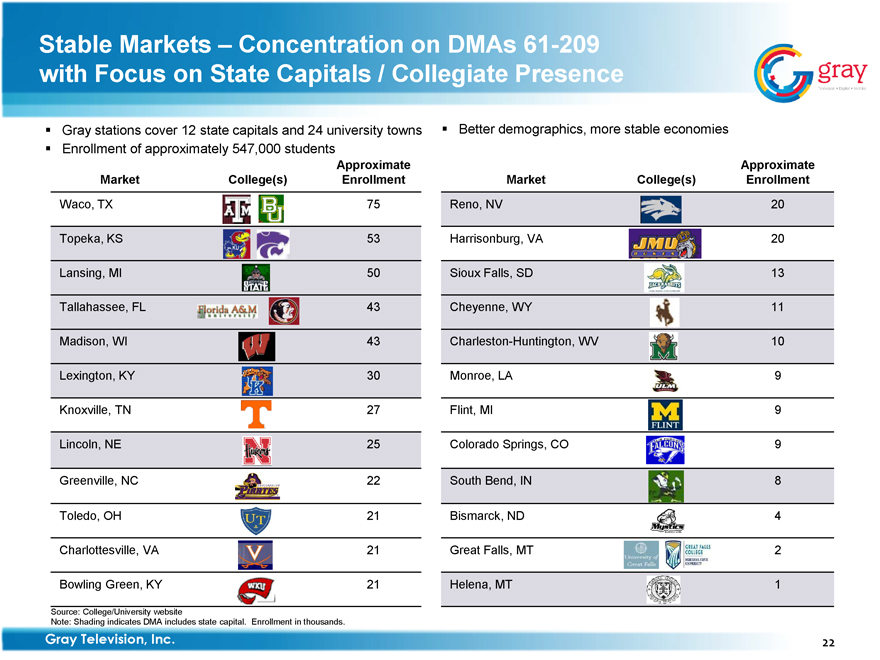
Stable Markets – Concentration on DMAs 61-209 with Focus on State Capitals / Collegiate Presence
Gray stations cover 12 state capitals and 24 university towns Better demographics, more stable economies Enrollment of approximately 547,000 students
Approximate Approximate
Market College(s) Enrollment Market College(s) Enrollment
Waco, TX 75 Reno, NV 20
Topeka, KS 53 Harrisonburg, VA 20
Lansing, MI 50 Sioux Falls, SD 13
Tallahassee, FL 43 Cheyenne, WY 11
Madison, WI 43 Charleston-Huntington, WV 10
Lexington, KY 30 Monroe, LA 9
Knoxville, TN 27 Flint, MI 9
Lincoln, NE 25 Colorado Springs, CO 9
Greenville, NC 22 South Bend, IN 8
Toledo, OH 21 Bismarck, ND 4
Charlottesville, VA 21 Great Falls, MT 2
Bowling Green, KY 21 Helena, MT 1
Source: College/University website
Note: Shading indicates DMA includes state capital. Enrollment in thousands.
Gray Television, Inc. 22
gray
Television Digital Mobile
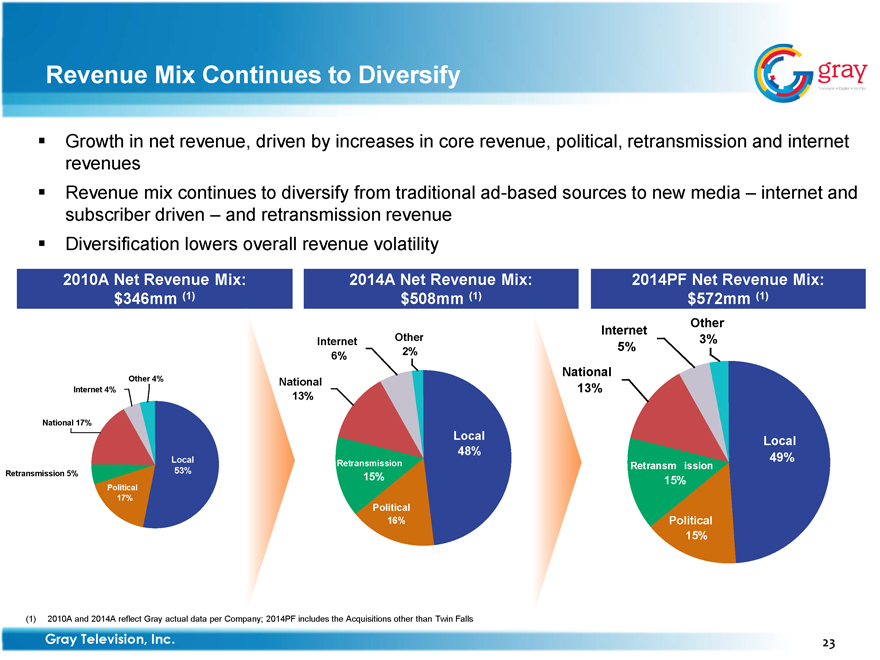
Revenue Mix Continues to Diversify
Growth in net revenue, driven by increases in core revenue, political, retransmission and internet revenues
Revenue mix continues to diversify from traditional ad-based sources to new media – internet and subscriber driven – and retransmission revenue
Diversification lowers overall revenue volatility
|
2010A Net Revenue Mix: 2014A Net Revenue Mix: 2014PF Net Revenue Mix: $346mm (1) $508mm (1) $572mm (1) Internet Other Internet Other 3% 2% 5% 6% National Other 4% National Internet 4% 13% 13% National 17% Local Local 48% Local Retransmission Retransm ission 49% Retransmission 5% 53% 15% 15% Political 17% Political 16% Political 15% |
(1) 2010A and 2014A reflect Gray actual data per Company; 2014PF includes the Acquisitions other than Twin Falls
Gray Television, Inc. 23
gray
Television Digital Mobile
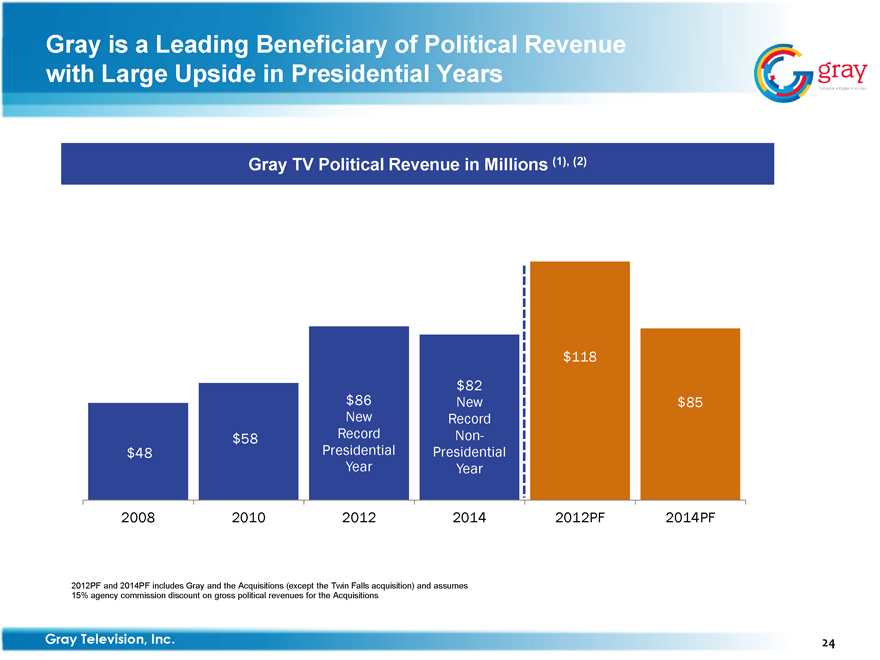
Gray is a Leading Beneficiary of Political Revenue with Large Upside in Presidential Years
Gray TV Political Revenue in Millions (1), (2)
| | | | | | | | | | |
| | | | | | | | | $118 | | |
| | | | | | | $82 | | | | |
| | | | | $86 | | New | | | | $85 |
| | | | | New | | Record | | | | |
| | | $58 | | Record | | Non- | | | | |
$48 | | | | Presidential | | Presidential | | | | |
| | | | | Year | | Year | | | | |
2008 | | 2010 | | 2012 | | 2014 | | 2012PF | | 2014PF |
2012PF and 2014PF includes Gray and the Acquisitions (except the Twin Falls acquisition) and assumes 15% agency commission discount on gross political revenues for the Acquisitions
Gray Television, Inc. 24
gray
Television Digital Mobile
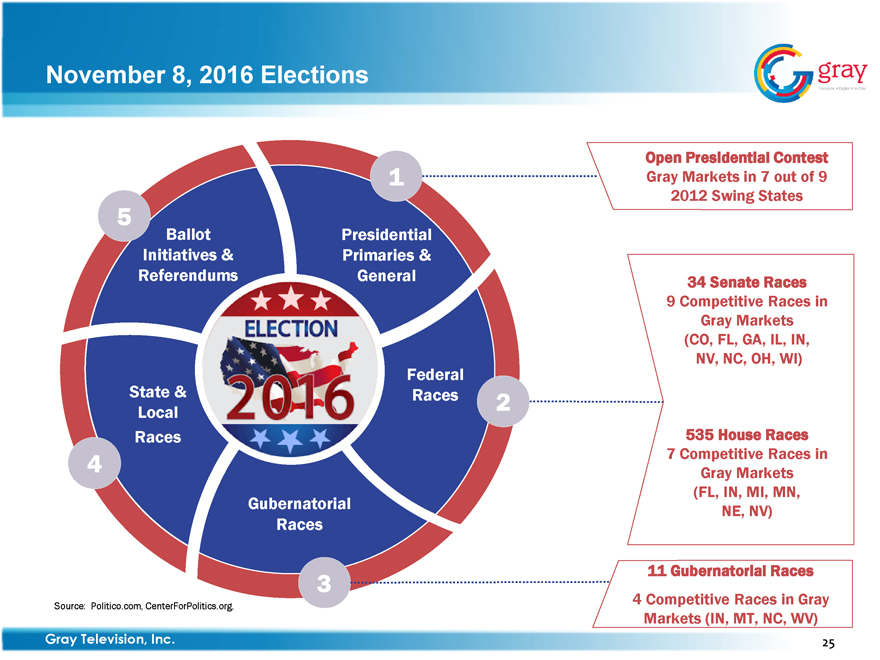
November 8, 2016 Elections
|
Open Presidential Contest 1 Gray Markets in 7 out of 9 2012 Swing States 5 Ballot Presidential Initiatives & Primaries & Referendums General 34 Senate Races 9 Competitive Races in Gray Markets (CO, FL, GA, IL, IN, NV, NC, OH, WI) Federal State & Races 2 Local Races ELECTION 535 House Races 4 2016 7 Competitive Gray Markets Races in (FL, IN, MI, MN, Gubernatorial NE, NV) Races 3 11 Gubernatorial Races Source: Politico.com, CenterForPolitics.org. 4 Competitive Races in Gray Markets (IN, MT, NC, WV) |
Gray Television, Inc. 25
gray
Television Digital Mobile
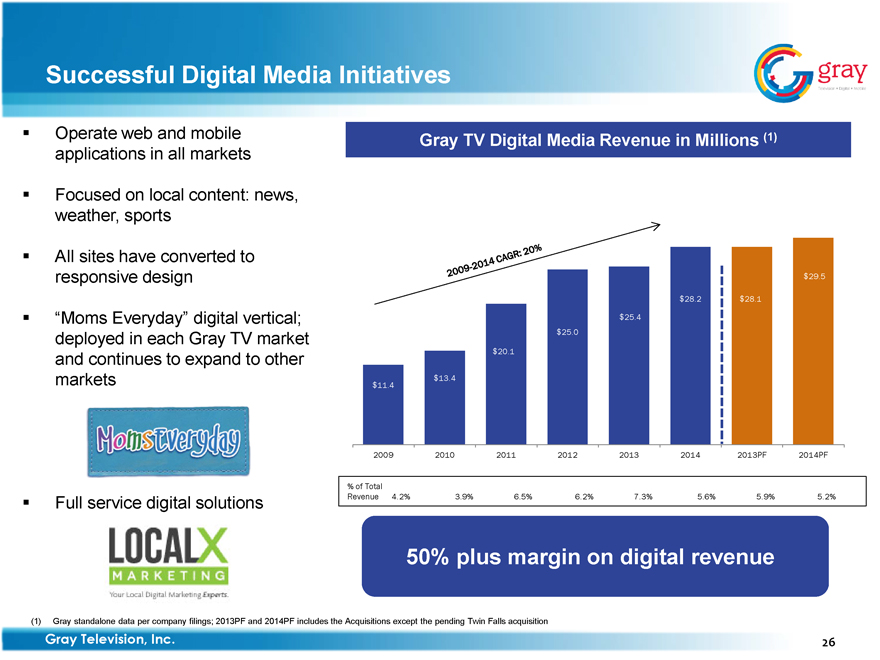
Successful Digital Media Initiatives
Operate web and mobile applications in all markets
Focused on local content: news, weather, sports
All sites have converted to responsive design
“Moms Everyday” digital vertical; deployed in each Gray TV market and continues to expand to other markets
MomsEveryday
Full service digital solutions
LOCALX
MARKETING
Your Digital Marketing Experts
Gray TV Digital Media Revenue in Millions (1)
2009-2014 CAGR: 20%
$29.5
$28.2
$28.1
$25.4
$25.0
$20.1
$13.4
$11.4
2009
2010
2011
2012
2013
2014
2013PF
2014PF
% of Total
Revenue 4.2%
3.9%
6.5%
6.2%
7.3%
5.6%
5.9%
5.2%
50% plus margin on digital revenue
(1) Gray standalone data per company filings; 2013PF and 2014PF includes the Acquisitions except the pending Twin Falls acquisition
Gray Television, Inc. 26
gray
Television Digital Mobile
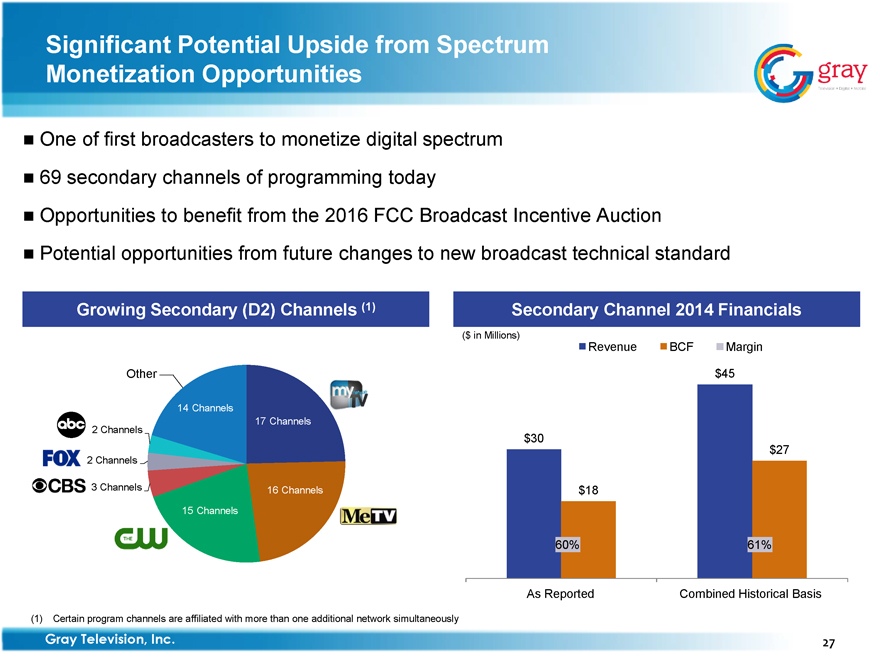
Significant Potential Upside from Spectrum Monetization Opportunities
One of first broadcasters to monetize digital spectrum
69 secondary channels of programming today
Opportunities to benefit from the 2016 FCC Broadcast Incentive Auction
Potential opportunities from future changes to new broadcast technical standard
Growing Secondary (D2) Channels (1)
Other
14 Channels
17 Channels mynetwork TV
Abc 2 Channels
FOX 2 Channels
CBS 3 Channels 16 Channels MeTV
THE CW 15 Channels
Secondary Channel 2014 Financials
($ in Millions)
Revenue BCF Margin
$45
$30
$27
$18
60% 61%
As Reported Combined Historical Basis
(1) Certain program channels are affiliated with more than one additional network simultaneously
Gray Television, Inc. 27
gray
Television Digital Mobile
Financial Overview
gray
Television Digital Mobile
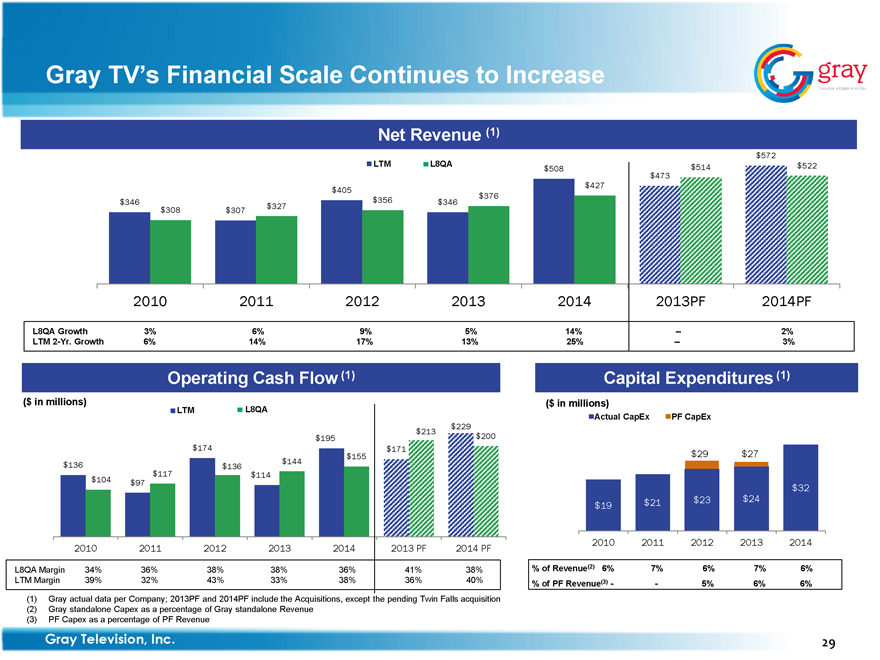
Gray TV’s Financial Scale Continues to Increase
Net Revenue (1)
$572
LTM
L8QA
$508
$514
$522
$473
$405
$427
$346
$356
$346
$376
$308
$307
$327
2010
2011
2012
2013
2014
2013PF
2014PF
L8QA Growth
3%
6%
9%
5%
14%
--
2%
LTM 2-Yr. Growth
6%
14%
17%
13%
25%
--
—
3%
Operating Cash Flow (1)
($ in millions)
LTM
L8QA
$213
$229
$195
$200
$174
$171
$155
$136
$136
$144
$117
$114
$104
$97
2010
2011
2012
2013
2014
2013 PF
2014 PF
L8QA Margin
34%
36%
38%
38%
36%
41%
38%
LTM Margin
39%
32%
43%
33%
38%
36%
40%
Capital Expenditures (1)
($ in millions)
Actual CapEx
PF CapEx
$29
$27
$32
$19
$21
$23
$24
2010
2011
2012
2013
2014
% of Revenue(2) 6%
7%
6%
7%
6%
% of PF Revenue(3) -
-
5%
6%
6%
(1) Gray actual data per Company; 2013PF and 2014PF include the Acquisitions, except the pending Twin Falls acquisition
(2) Gray standalone Capex as a percentage of Gray standalone Revenue
(3) PF Capex as a percentage of PF Revenue
Gray Television, Inc. 29
gray
Television Digital Mobile
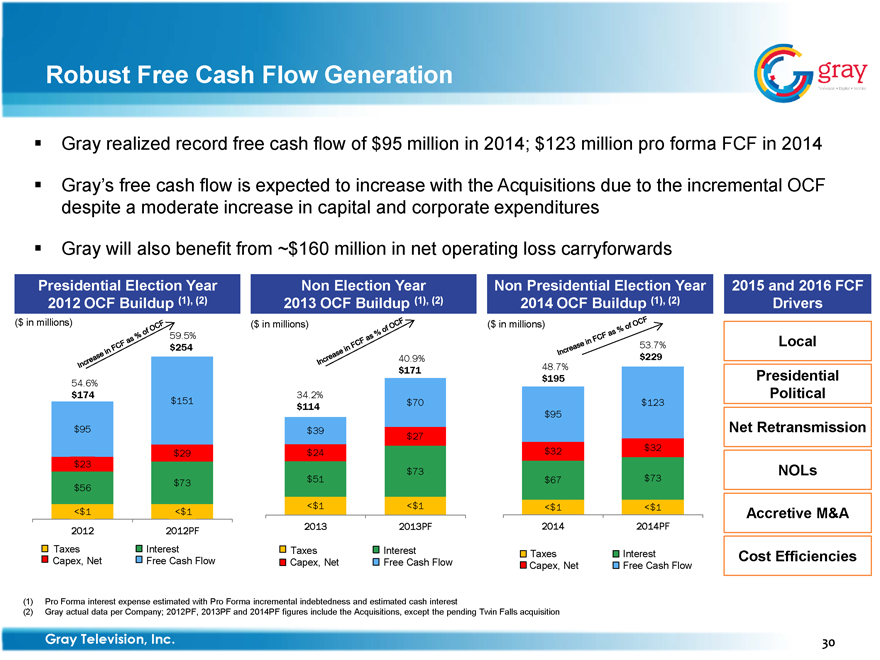
Robust Free Cash Flow Generation
Gray realized record free cash flow of $95 million in 2014; $123 million pro forma FCF in 2014
Gray’s free cash flow is expected to increase with the Acquisitions due to the incremental OCF despite a moderate increase in capital and corporate expenditures
Gray will also benefit from ~$160 million in net operating loss carryforwards
Increase in FCF as % of OCF
Increase in FCF as % of OCF
Increase in FCF as % of OCF
Presidential Election Year Non Election Year Non Presidential Election Year 2015 and 2016 FCF 2012 OCF Buildup (1), (2) 2013 OCF Buildup (1), (2) 2014 OCF Buildup (1), (2) Drivers ($ in millions) ($ in millions) ($ in millions) 59.5% $254 53.7% Local 40.9% $229 48.7% 54.6% $171 $195 Presidential $174 34.2% Political $151 $114 $70 $123 $95 $95 $39 Net Retransmission $27 $29 $24 $32 $32 $23 $73 NOLs $56 $73 $51 $67 $73 <$1 <$1 <$1 <$1 <$1 <$1 Accretive M&A 2012 2012PF 2013 2013PF 2014 2014PF Taxes Interest Taxes Interest Taxes Interest Cost Efficiencies Capex, Net Free Cash Flow Capex, Net Free Cash Flow Capex, Net Free Cash Flow
(1) Pro Forma interest expense estimated with Pro Forma incremental indebtedness and estimated cash interest
(2) Gray actual data per Company; 2012PF, 2013PF and 2014PF figures include the Acquisitions, except the pending Twin Falls acquisition
Gray Television, Inc. 30
gray
Television Digital Mobile
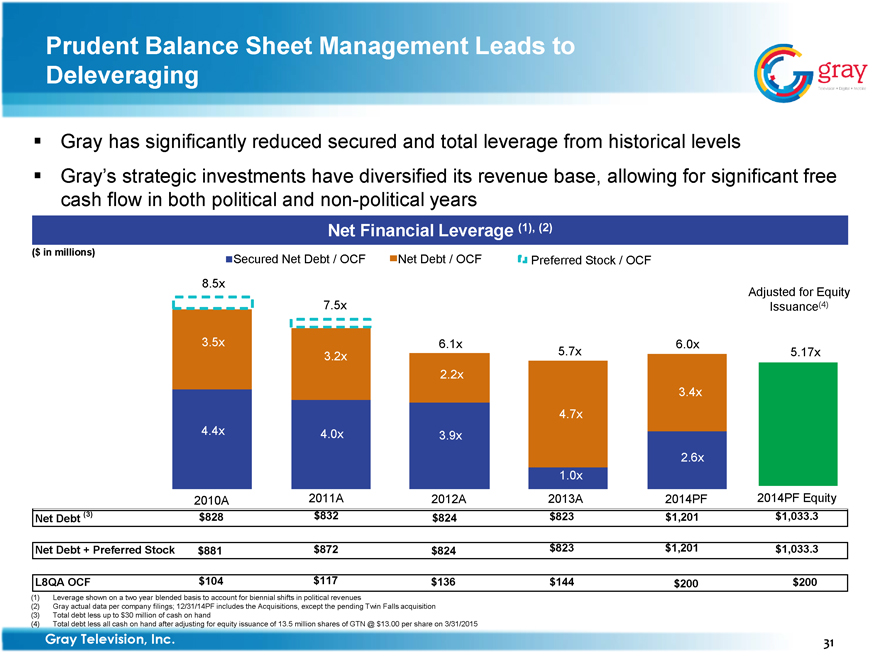
Prudent Balance Sheet Management Leads to Deleveraging
Gray has significantly reduced secured and total leverage from historical levels
Gray’s strategic investments have diversified its revenue base, allowing for significant free cash flow in both political and non-political years
Net Financial Leverage (1), (2)
($ in millions) Secured Net Debt / OCF Net Debt / OCF Preferred Stock / OCF
8.5x 3.5x 4.4x 7.5x 3.2x 4.0x 6.1x 2.2x 3.9x 5.7x 4.7x 1.0x 6.0x 3.4x 2.6x Adjusted for Equity Issuance(4) 5.17x
2010A 2011A 2012A 2013A 2014PF 2014PF Equity
Net Debt (3) $828 $832 $824 $823 $1,201 $1,033.3
Net Debt + Preferred Stock $881 $872 $824 $823 $1,201 $1,033.3
L8QA OCF $104 $117 $136 $144 $200 $200
(1) Leverage shown on a two year blended basis to account for biennial shifts in political revenues
(2) Gray actual data per company filings; 12/31/14PF includes the Acquisitions, except the pending Twin Falls acquisition
(3) Total debt less up to $30 million of cash on hand
(4) Total debt less all cash on hand after adjusting for equity issuance of 13.5 million shares of GTN @ $13.00 per share on 3/31/2015
Gray Television, Inc. 31
gray
Television Digital Mobile
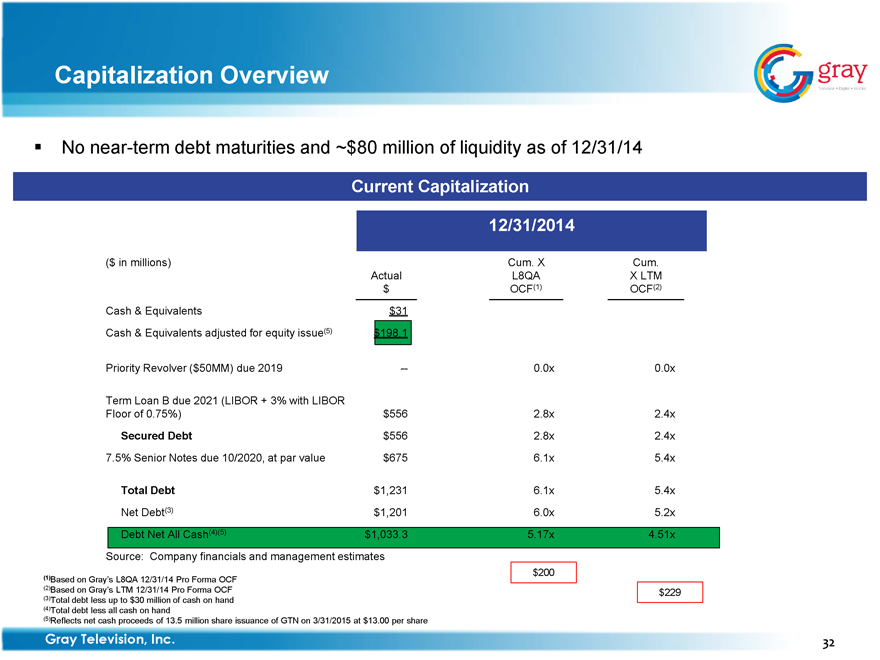
Capitalization Overview
No near-term debt maturities and ~$80 million of liquidity as of 12/31/14
Current Capitalization
12/31/2014
($ in millions) Cum. X Cum.
Actual L8QA X LTM
$ OCF(1) OCF(2)
Cash & Equivalents $31
Cash & Equivalents adjusted for equity issue(5) $198.1
Priority Revolver ($50MM) due 2019 — 0.0x 0.0x
Term Loan B due 2021 (LIBOR + 3% with LIBOR
Floor of 0.75%) $556 2.8x 2.4x
Secured Debt $556 2.8x 2.4x
7.5% Senior Notes due 10/2020, at par value $675 6.1x 5.4x
Total Debt $1,231 6.1x 5.4x
Net Debt(3) $1,201 6.0x 5.2x
Debt Net All Cash(4)(5) $1,033.3 5.17x 4.51x
Source: Company financials and management estimates
$200
(1) Based on Gray’s L8QA 12/31/14 Pro Forma OCF
(2) Based on Gray’s LTM 12/31/14 Pro Forma OCF $229
(3) Total debt less up to $30 million of cash on hand
(4) Total debt less all cash on hand
(5) Reflects net cash proceeds of 13.5 million share issuance of GTN on 3/31/2015 at $13.00 per share
Gray Television, Inc. 32
gray
Television Digital Mobile
Questions & Answers
gray
Television Digital Mobile
Appendix
gray
Television Digital Mobile
Glossary
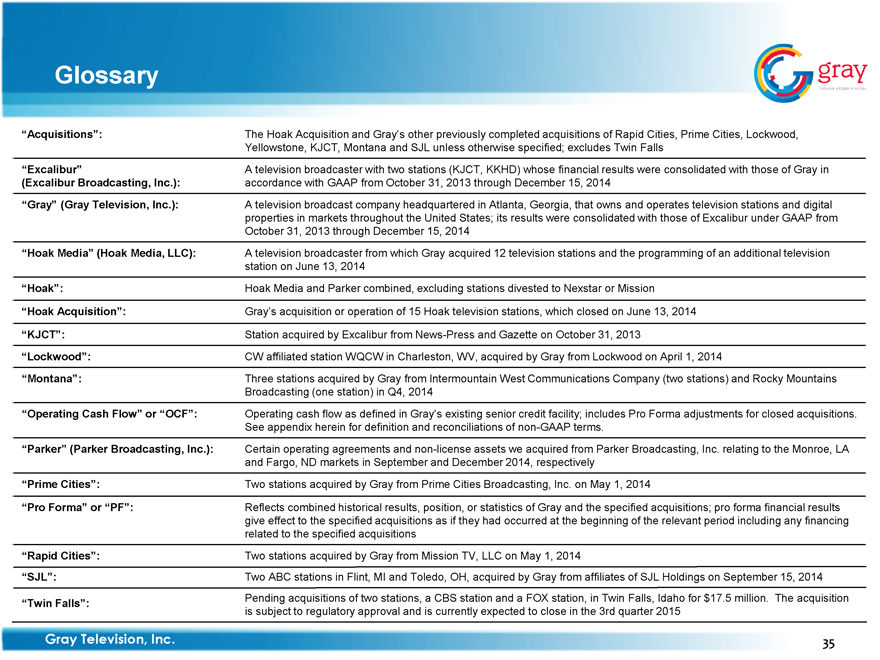
“Acquisitions”: The Hoak Acquisition and Gray’s other previously completed acquisitions of Rapid Cities, Prime Cities, Lockwood, Yellowstone, KJCT, Montana and SJL unless otherwise specified; excludes Twin Falls
“Excalibur” (Excalibur Broadcasting, Inc.): A television broadcaster with two stations (KJCT, KKHD) whose financial results were consolidated with those of Gray in accordance with GAAP from October 31, 2013 through December 15, 2014
“Gray” (Gray Television, Inc.): A television broadcast company headquartered in Atlanta, Georgia, that owns and operates television stations and digital properties in markets throughout the United States; its results were consolidated with those of Excalibur under GAAP from October 31, 2013 through December 15, 2014
“Hoak Media” (Hoak Media, LLC): A television broadcaster from which Gray acquired 12 television stations and the programming of an additional television station on June 13, 2014
“Hoak”: Hoak Media and Parker combined, excluding stations divested to Nexstar or Mission
“Hoak Acquisition”: Gray’s acquisition or operation of 15 Hoak television stations, which closed on June 13, 2014
“KJCT”: Station acquired by Excalibur from News-Press and Gazette on October 31, 2013
“Lockwood”: CW affiliated station WQCW in Charleston, WV, acquired by Gray from Lockwood on April 1, 2014
“Montana”: Three stations acquired by Gray from Intermountain West Communications Company (two stations) and Rocky Mountains Broadcasting (one station) in Q4, 2014
“Operating Cash Flow” or “OCF”: Operating cash flow as defined in Gray’s existing senior credit facility; includes Pro Forma adjustments for closed acquisitions. See appendix herein for definition and reconciliations of non-GAAP terms.
“Parker” (Parker Broadcasting, Inc.): Certain operating agreements and non-license assets we acquired from Parker Broadcasting, Inc. relating to the Monroe, LA and Fargo, ND markets in September and December 2014, respectively
“Prime Cities”: Two stations acquired by Gray from Prime Cities Broadcasting, Inc. on May 1, 2014
“Pro Forma” or “PF”: Reflects combined historical results, position, or statistics of Gray and the specified acquisitions; pro forma financial results give effect to the specified acquisitions as if they had occurred at the beginning of the relevant period including any financing related to the specified acquisitions
“Rapid Cities”: Two stations acquired by Gray from Mission TV, LLC on May 1, 2014
“SJL”: Two ABC stations in Flint, MI and Toledo, OH, acquired by Gray from affiliates of SJL Holdings on September 15, 2014
“Twin Falls”: Pending acquisitions of two stations, a CBS station and a FOX station, in Twin Falls, Idaho for $17.5 million. The acquisition is subject to regulatory approval and is currently expected to close in the 3rd quarter 2015
Gray Television, Inc. 35
gray
Television Digital Mobile
Pro Forma Non-GAAP Reconciliation
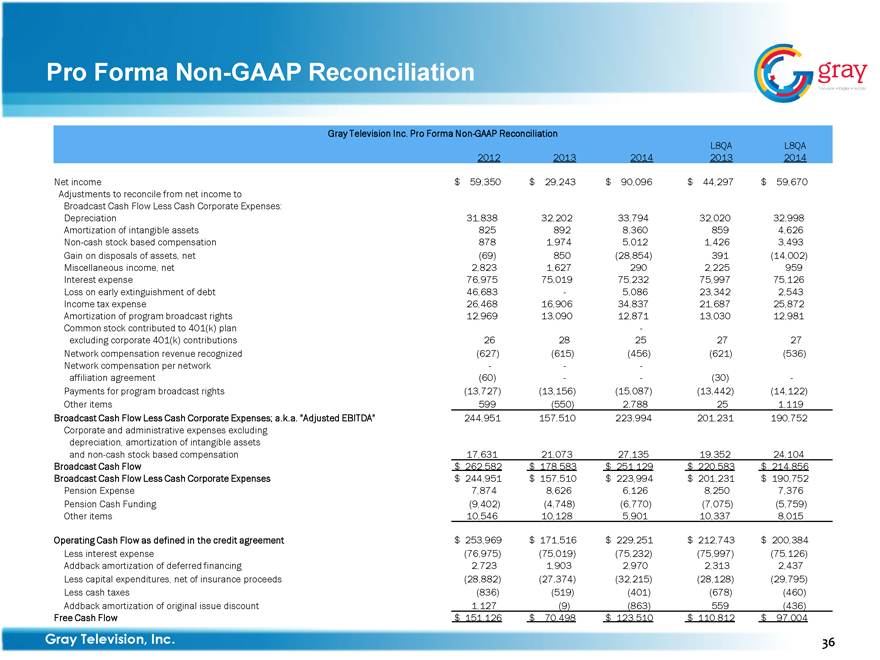
Gray Television Inc. Pro Forma Non-GAAP Reconciliation
L8QA L8QA
2012 2013 2014 2013 2014
Net income $59,350 $29,243 $90,096 $44,297 $59,670
Adjustments to reconcile from net income to
Broadcast Cash Flow Less Cash Corporate Expenses:
Depreciation 31,838 32,202 33,794 32,020 32,998
Amortization of intangible assets 825 892 8,360 859 4,626
Non-cash stock based compensation 878 1,974 5,012 1,426 3,493
Gain on disposals of assets, net (69) 850 (28,854) 391 (14,002)
Miscellaneous income, net 2,823 1,627 290 2,225 959
Interest expense 76,975 75,019 75,232 75,997 75,126
Loss on early extinguishment of debt 46,683 — 5,086 23,342 2,543
Income tax expense 26,468 16,906 34,837 21,687 25,872
Amortization of program broadcast rights 12,969 13,090 12,871 13,030 12,981
Common stock contributed to 401(k) plan —
excluding corporate 401(k) contributions 26 28 25 27 27
Network compensation revenue recognized (627) (615) (456) (621) (536)
Network compensation per network — — —
affiliation agreement (60) — — (30) —
Payments for program broadcast rights (13,727) (13,156) (15,087) (13,442) (14,122)
Other items 599 (550) 2,788 25 1,119
Broadcast Cash Flow Less Cash Corporate Expenses; a.k.a. “Adjusted EBITDA” 244,951 157,510 223,994 201,231 190,752
Corporate and administrative expenses excluding depreciation, amortization of intangible assets and non-cash stock based compensation 17,631 21,073 27,135 19,352 24,104
Broadcast Cash Flow $262,582 $178,583 $251,129 $220,583 $214,856
Broadcast Cash Flow Less Cash Corporate Expenses $244,951 $157,510 $223,994 $201,231 $190,752
Pension Expense 7,874 8,626 6,126 8,250 7,376
Pension Cash Funding (9,402) (4,748) (6,770) (7,075) (5,759)
Other items 10,546 10,128 5,901 10,337 8,015
Operating Cash Flow as defined in the credit agreement $253,969 $171,516 $229,251 $212,743 $200,384
Less interest expense (76,975) (75,019) (75,232) (75,997) (75,126)
Addback amortization of deferred financing 2,723 1,903 2,970 2,313 2,437
Less capital expenditures, net of insurance proceeds (28,882) (27,374) (32,215) (28,128) (29,795)
Less cash taxes (836) (519) (401) (678) (460)
Addback amortization of original issue discount 1,127 (9) (863) 559 (436)
Free Cash Flow $151,126 $70,498 $123,510 $110,812 $97,004
Gray Television, Inc. 36
gray
Television Digital Mobile
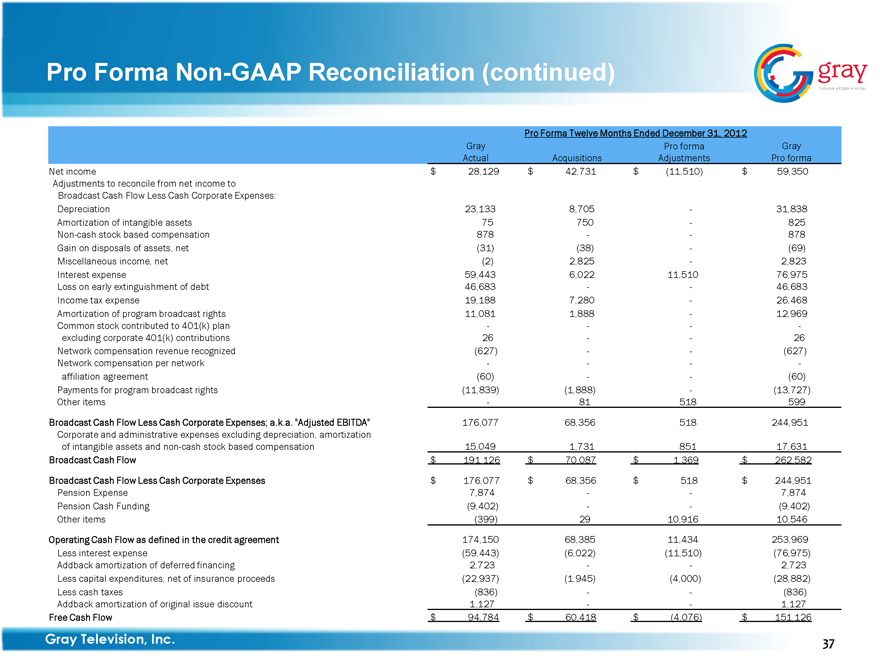
Pro Forma Non-GAAP Reconciliation (continued)
Pro Forma Twelve Months Ended December 31, 2012
Gray Actual Acquisitions Pro forma Adjustments Gray Pro forma
Net income $28,129 $42,731 $(11,510) $59,350
Adjustments to reconcile from net income to
Broadcast Cash Flow Less Cash Corporate Expenses:
Depreciation 23,133 8,705 — 31,838
Amortization of intangible assets 75 750 — 825
Non-cash stock based compensation 878 — — 878
Gain on disposals of assets, net (31) (38) — (69)
Miscellaneous income, net (2) 2,825 — 2,823
Interest expense 59,443 6,022 11,510 76,975
Loss on early extinguishment of debt 46,683 — — 46,683
Income tax expense 19,188 7,280 — 26,468
Amortization of program broadcast rights 11,081 1,888 — 12,969
Common stock contributed to 401(k) plan — — — —
excluding corporate 401(k) contributions 26 — — 26
Network compensation revenue recognized (627) — — (627)
Network compensation per network — — — —
affiliation agreement (60) — — (60)
Payments for program broadcast rights (11,839) (1,888) — (13,727)
Other items — 81 518 599
Broadcast Cash Flow Less Cash Corporate Expenses; a.k.a. “Adjusted EBITDA” 176,077 68,356 518 244,951
Corporate and administrative expenses excluding depreciation, amortization of intangible assets and non-cash stock based compensation 15,049 1,731 851 17,631
Broadcast Cash Flow $191,126 $70,087 $1,369 $262,582
Broadcast Cash Flow Less Cash Corporate Expenses $176,077 $68,356 $518 $244,951
Pension Expense 7,874 — — 7,874
Pension Cash Funding (9,402) — — (9,402)
Other items (399) 29 10,916 10,546
Operating Cash Flow as defined in the credit agreement 174,150 68,385 11,434 253,969
Less interest expense (59,443) (6,022) (11,510) (76,975)
Addback amortization of deferred financing 2,723 — — 2,723
Less capital expenditures, net of insurance proceeds (22,937) (1,945) (4,000) (28,882)
Less cash taxes (836) — — (836)
Addback amortization of original issue discount 1,127 — — 1,127
Free Cash Flow $94,784 $60,418 $(4,076) $151,126
Gray Television, Inc. 37
gray
Television Digital Mobile
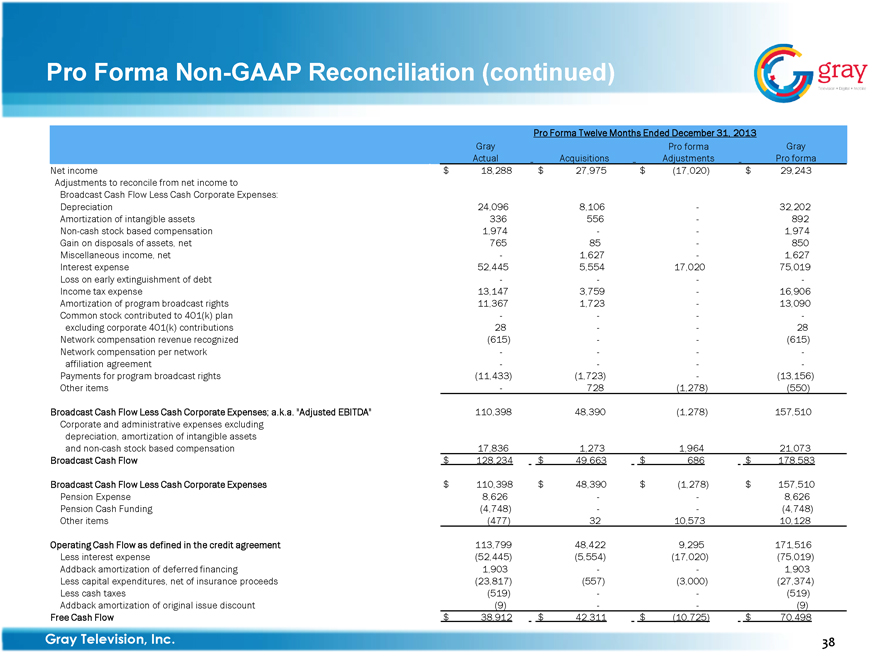
Pro Forma Non-GAAP Reconciliation (continued)
Pro Forma Twelve Months Ended December 31, 2013
Gray Actual Acquisitions Pro forma Adjustments Gray Pro forma
Net income $18,288 $27,975 $(17,020) $29,243
Adjustments to reconcile from net income to
Broadcast Cash Flow Less Cash Corporate Expenses:
Depreciation 24,096 8,106 — 32,202
Amortization of intangible assets 336 556 — 892
Non-cash stock based compensation 1,974 — — 1,974
Gain on disposals of assets, net 765 85 — 850
Miscellaneous income, net — 1,627 — 1,627
Interest expense 52,445 5,554 17,020 75,019
Loss on early extinguishment of debt — — — —
Income tax expense 13,147 3,759 — 16,906
Amortization of program broadcast rights 11,367 1,723 — 13,090
Common stock contributed to 401(k) plan — — — —
excluding corporate 401(k) contributions 28 — — 28
Network compensation revenue recognized (615) — — (615)
Network compensation per network — — — —
affiliation agreement — — — —
Payments for program broadcast rights (11,433) (1,723) — (13,156)
Other items — 728 (1,278) (550)
Broadcast Cash Flow Less Cash Corporate Expenses; a.k.a. “Adjusted EBITDA” 110,398 48,390 (1,278) 157,510
Corporate and administrative expenses excluding depreciation, amortization of intangible assets and non-cash stock based compensation 17,836 1,273 1,964 21,073
Broadcast Cash Flow $128,234 $49,663 $686 $178,583
Broadcast Cash Flow Less Cash Corporate Expenses $110,398 $48,390 $(1,278) $157,510
Pension Expense 8,626 — — 8,626
Pension Cash Funding (4,748) — — (4,748)
Other items (477) 32 10,573 10,128
Operating Cash Flow as defined in the credit agreement 113,799 48,422 9,295 171,516
Less interest expense (52,445) (5,554) (17,020) (75,019)
Addback amortization of deferred financing 1,903 — — 1,903
Less capital expenditures, net of insurance proceeds (23,817) (557) (3,000) (27,374)
Less cash taxes (519) — — (519)
Addback amortization of original issue discount (9) — — (9)
Free Cash Flow $38,912 $42,311 $(10,725) $70,498
Gray Television, Inc. 38
gray
Television Digital Mobile
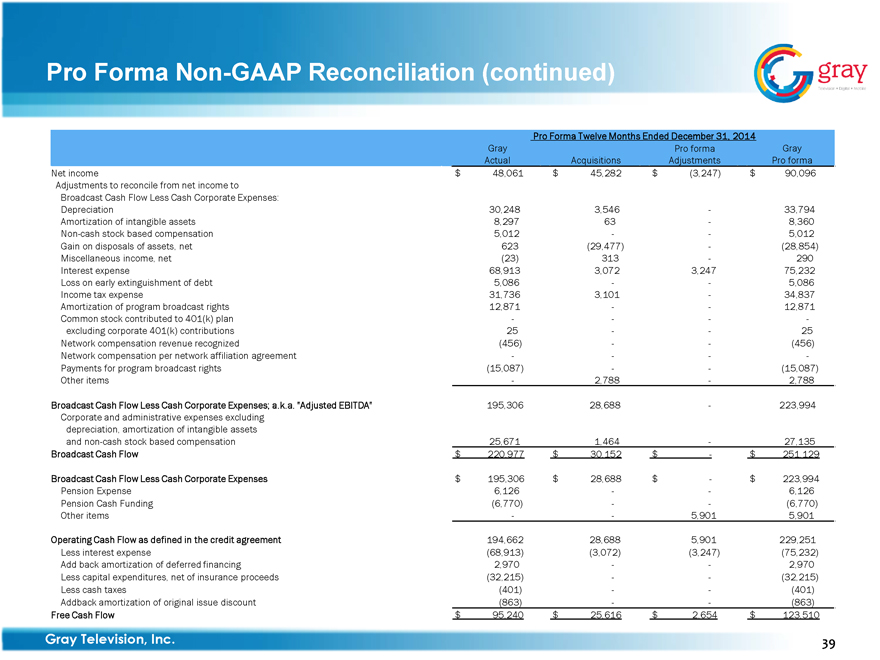
Pro Forma Non-GAAP Reconciliation (continued)
Pro Forma Twelve Months Ended December 31, 2014
Gray Actual Acquisitions Pro forma Adjustments Gray Pro forma
Net income $48,061 $45,282 $(3,247) $90,096
Adjustments to reconcile from net income to
Broadcast Cash Flow Less Cash Corporate Expenses:
Depreciation 30,248 3,546 — 33,794
Amortization of intangible assets 8,297 63 — 8,360
Non-cash stock based compensation 5,012 — — 5,012
Gain on disposals of assets, net 623 (29,477) — (28,854)
Miscellaneous income, net (23) 313 — 290
Interest expense 68,913 3,072 3,247 75,232
Loss on early extinguishment of debt 5,086 — — 5,086
Income tax expense 31,736 3,101 — 34,837
Amortization of program broadcast rights 12,871 — — 12,871
Common stock contributed to 401(k) plan — — — —
excluding corporate 401(k) contributions 25 — — 25
Network compensation revenue recognized (456) — — (456)
Network compensation per network affiliation agreement — — — —
Payments for program broadcast rights (15,087) — — (15,087)
Other items — 2,788 — 2,788
Broadcast Cash Flow Less Cash Corporate Expenses; a.k.a. “Adjusted EBITDA” 195,306 28,688 — 223,994
Corporate and administrative expenses excluding depreciation, amortization of intangible assets and non-cash stock based compensation 25,671 1,464 — 27,135
Broadcast Cash Flow $220,977 $30,152 $— $251,129
Broadcast Cash Flow Less Cash Corporate Expenses $195,306 $28,688 $— $223,994
Pension Expense 6,126 — — 6,126
Pension Cash Funding (6,770) — — (6,770)
Other items — — 5,901 5,901
Operating Cash Flow as defined in the credit agreement 194,662 28,688 5,901 229,251
Less interest expense (68,913) (3,072) (3,247) (75,232)
Add back amortization of deferred financing 2,970 — — 2,970
Less capital expenditures, net of insurance proceeds (32,215) — — (32,215)
Less cash taxes (401) — — (401)
Addback amortization of original issue discount (863) — — (863)
Free Cash Flow $95,240 $25,616 $2,654 $123,510
Gray Television, Inc. 39
gray
Television Digital Mobile
Investor Presentation