UNITED STATES
SECURITIES AND EXCHANGE COMMISSION
Washington, D.C. 20549
FORM 10-K
☒ | Annual report pursuant to Section 13 or 15(d) of the Securities Exchange Act of 1934 for the fiscal year ended December 31, 2024 |
☐ | Transition report pursuant to Section 13 or 15(d) of the Securities Exchange Act of 1934 for the transition period from __________ to __________. |
Commission File Number 1-13796
GRAY MEDIA, INC.
(Exact name of Registrant as specified in its charter)
Georgia (State or other jurisdiction of incorporation) | 58-0285030 (I.R.S. Employer Identification No.) |
4370 Peachtree Road, NE Atlanta, GA (Address of principal executive offices) | 30319 (Zip Code) |
Registrant’s telephone number, including area code: (404) 504-9828
Securities registered pursuant to Section 12(b) of the Act:
| Title of each Class | Trading Symbol(s) | Name of each exchange on which registered |
Class A common stock (no par value) | GTN.A | New York Stock Exchange |
| common stock (no par value) | GTN | New York Stock Exchange |
Securities registered pursuant to Section 12(g) of the Act: NONE
Indicate by check mark if the registrant is a well-known seasoned issuer, as defined in Rule 405 of the Securities Act. Yes ☒ No ☐
Indicate by check mark if the registrant is not required to file reports pursuant to Section 13 or Section 15(d) of the Act. Yes ☐ No ☒
Indicate by check mark whether the registrant (1) has filed all reports required to be filed by Section 13 or 15(d) of the Securities Exchange Act of 1934 during the preceding 12 months (or for such shorter period that the registrant was required to file such reports), and (2) has been subject to such filing requirements for the past 90 days. Yes ☒ No ☐
Indicate by check mark whether the registrant has submitted electronically every Interactive Data File required to be submitted pursuant to Rule 405 of Regulation S-T (§ 232.405 of this chapter) during the preceding 12 months (or for such shorter period that the registrant was required to submit such files). Yes ☒ No ☐
Indicate by check mark whether the registrant is a large accelerated filer, an accelerated filer, a non-accelerated filer, a smaller reporting company, or an emerging growth company. See definition of “large accelerated filer,” “accelerated filer”, “smaller reporting company”, and “emerging growth company” in Rule 12b-2 of the Exchange Act. (Check one).
Large accelerated filer ☐ Accelerated filer ☒ Non-accelerated filer ☐ Smaller reporting company ☐ Emerging growth company ☐
If an emerging growth company, indicate by check mark if the registrant has elected not to use the extended transition period for complying with any new or revised financial accounting standards provided pursuant to Section 13(a) of the Exchange Act. ☐
Indicate by check mark whether the registrant has filed a report on and attestation to its management’s assessment of the effectiveness of its internal control over financial reporting under Section 404(b) of the Sarbanes-Oxley Act (15 U.S.C. 7262(b)) by the registered public accounting firm that prepared or issued its audit report. ☒
If securities are registered pursuant to Section 12(b) of the Act, indicate by check mark whether the financial statements of the registrant included in the filing reflect the correction of an error to previously issued financial statements. ☐
Indicate by check mark whether any error corrections and restatements require a recovery analysis of incentive-based compensation received by any of the registrant’s executive officers during the relevant recovery period pursuant to §240.10D-1(b). ☐
Indicate by check mark whether the registrant is a shell company (as defined in Rule 12b-2 of the Act). Yes ☐ No ☒
The aggregate market value of the voting stock (based upon the closing sales prices quoted on the New York Stock Exchange) held by non-affiliates of the registrant (solely for purposes of this calculation, all directors, executive officers and 10% or greater stockholders of the registrant are considered to be “affiliates”) as of June 30, 2024: Class A common stock and common stock; no par value – $445,969,521.
Indicate the number of shares outstanding of each of the issuer's classes of common stock, as of the latest practicable date.
Common Stock (No Par Value) | | Class A Common Stock (No Par Value) |
91,812,952 shares outstanding as of February 21, 2025 | | 9,730,058 shares outstanding as of February 21, 2025 |
DOCUMENTS INCORPORATED BY REFERENCE
Portions of the registrant’s proxy statement for the 2025 annual meeting of stockholders, are incorporated by reference into Part III of this Annual Report to the extent stated herein. Such proxy statement will be filed with the Securities and Exchange Commission within 120 days of the registrant’s fiscal year ended December 31, 2024.
GRAY MEDIA, INC.
Table of Contents
| | | PAGE |
| | Forward-Looking Statements | 3 |
PART I | | |
Item 1. | Business | 3 |
Item 1A. | Risk Factors | 14 |
Item 1B. | Unresolved Staff Comments | 28 |
Item 1C. | Cybersecurity | 28 |
Item 2. | Properties | 29 |
Item 3. | Legal Proceedings | 30 |
Item 4. | Mine Safety Disclosures | 30 |
| | Information About our Executive Officers | 30 |
| | | |
PART II | | |
Item 5. | Market for Registrant’s Common Equity, Related Stockholder Matters and Issuer Purchases of Equity Securities | 31 |
Item 7. | Management’s Discussion and Analysis of Financial Condition and Results of Operations | 34 |
Item 7A. | Quantitative and Qualitative Disclosures About Market Risk | 47 |
Item 8. | Financial Statements and Supplementary Data | 49 |
Item 9. | Changes in and Disagreements with Accountants on Accounting and Financial Disclosure | 97 |
Item 9A. | Controls and Procedures | 97 |
Item 9B. | Other Information | 98 |
Item 9C. | Disclosure Regarding Foreign Jurisdiction that Prevent Inspection | 98 |
| | | |
PART III | | |
Item 10. | Directors, Executive Officers and Corporate Governance | 98 |
Item 11. | Executive Compensation | 98 |
Item 12. | Security Ownership of Certain Beneficial Owners and Management and Related Stockholder Matters | 99 |
Item 13. | Certain Relationships and Related Transactions, and Director Independence | 100 |
Item 14. | Principal Accountant Fees and Services | 100 |
| | | |
PART IV | | |
Item 15. | Exhibits and Financial Statement Schedules | 100 |
Item 16. | Form 10-K Summary | 105 |
| | Signatures | 106 |
FORWARD-LOOKING STATEMENTS
This annual report on Form 10-K (“Annual Report”) contains and incorporates by reference “forward-looking statements” within the meaning of the Private Securities Litigation Reform Act of 1995, Section 27A of the Securities Act of 1933 and Section 21E of the Exchange Act. Forward-looking statements are all statements other than those of historical fact. When used in this annual report, the words “believes,” “expects,” “anticipates,” “estimates,” “will,” “may,” “should” and similar words and expressions are generally intended to identify forward-looking statements. These forward-looking statements reflect our then-current expectations and are based upon data available to us at the time the statements are made. Forward-looking statements may relate to, among other things, our strategies, expected results of operations, general and industry-specific economic conditions, future pension plan contributions, future capital expenditures, future income tax payments, future payments of interest and principal on our long-term debt, assumptions underlying various estimates and estimates of future obligations and commitments, and should be considered in context with the various other disclosures made by us about our business. Readers are cautioned that any forward-looking statements, including those regarding the intent, belief or current expectations of our management, are not guarantees of future performance, results or events and involve significant risks and uncertainties, and that actual results and events may differ materially from those contained in the forward-looking statements as a result of various factors including, but not limited to, those listed in Item 1A. of this Annual Report and the other factors described from time to time in our SEC filings. The forward-looking statements included in this Annual Report are made only as of the date hereof. We undertake no obligation to update such forward-looking statements to reflect subsequent events or circumstances.
PART I
Item 1. BUSINESS
On January 1, 2025, we changed our corporate name from Gray Television, Inc. to Gray Media, Inc. We will not distinguish between our prior and current corporate name and will refer to our current corporate name throughout this Annual Report. As such, in this Annual Report, unless otherwise indicated or the context otherwise requires, the words “Gray,” “Gray Media,” “the Company,” “we,” “us,” and “our” refer to Gray Media, Inc. and its consolidated subsidiaries.
Unless otherwise indicated, all station rank, in-market share and television household data herein are derived from reports prepared by The Nielsen Company US, LLC (“Nielsen”) and/or Comscore, Inc. (“Comscore”). While we believe this data to be accurate and reliable, we have not independently verified such data, nor have we ascertained the underlying assumptions relied upon therein and cannot guarantee the accuracy or completeness of such data.
General
We are a multimedia company headquartered in Atlanta, Georgia. We are the nation’s largest owner of top-rated local television stations and digital assets in the United States. Our television stations serve 113 television markets that collectively reach approximately 37% of US television households. This portfolio includes 78 markets with the top-rated television station and 99 markets with the first and/or second highest rated television station, as well as the largest Telemundo Affiliate group with 44 markets totaling over 1.5 million Hispanic TV Households. We also own Gray Digital Media, a full-service digital agency offering national and local clients digital marketing strategies with the most advanced digital products and services. Our additional media properties include video production companies Raycom Sports, Tupelo Media Group, and PowerNation Studios, and studio production facilities Assembly Atlanta and Third Rail Studios.
Our operating revenues are derived primarily from broadcast and digital advertising and from retransmission consent fees. For the years ended December 31, 2024, 2023 and 2022 our total revenue was $3.6 billion, $3.3 billion and $3.7 billion, respectively.
Markets and Stations
We believe a key driver for our strong market position is our focus on strong local news and information programming. We believe that our market position and our strong local teams have enabled us to maintain more stable revenues compared to many of our peers.
We are diversified across our markets and network affiliations. In 2024 and 2023, our largest market, by revenue, was Phoenix, Arizona, which contributed 5% and 4% of our total revenue, respectively. Our top 10 markets by revenue contributed approximately 26% and 25% of our total revenue in the years ended December 31, 2024 and 2023, respectively. For the year ended December 31, 2024, our CBS-affiliated channels accounted for approximately 38% of total revenue; our NBC-affiliated channels accounted for approximately 27% of total revenue; our FOX-affiliated channels accounted for approximately 14% of total revenue; and our ABC-affiliated channels accounted for approximately 11% of total revenue. We refer to CBS, NBC, ABC and FOX as the “Big Four” networks.
In each of our markets, we own and operate at least one television station broadcasting a primary channel affiliated with one of the Big Four networks. We also own additional stations in some markets, some of which also broadcast primary channels affiliated with one of the Big Four networks. Nearly all of our stations broadcast secondary digital channels that are affiliated with various networks or are independent of any network. The terms of our affiliations with broadcast networks are governed by network affiliation agreements. Each network affiliation agreement provides the affiliated station with the right to broadcast all programs transmitted by the affiliated network. Our network affiliation agreements with the Big Four broadcast networks currently expire at various dates through December 31, 2028.
Television Industry Background
The Federal Communications Commission (“FCC”) grants broadcast licenses to television stations. There are only a limited number of broadcast licenses available in any one geographic area. Each commercial television station in the US is assigned to one of 210 designated market areas (“DMAs”). These markets are ranked in size according to their number of television households, with the market having the largest number of television households ranked number one (New York City). Each DMA is an exclusive geographic area consisting of all counties (and in some cases, portions of counties) in which the home-market commercial television stations receive the greatest percentage of total viewing hours.
Television station revenue is derived primarily from local, regional and national advertising revenue, including digital advertising revenue, (together, but excluding political advertising revenue, “Core”) and retransmission consent fees. Television station revenue is also derived to a much lesser extent from studio and tower space rental fees and production activities. “Advertising” primarily refers to advertisements broadcast by television stations, but it also includes advertisements placed on a television station’s website and sponsorships of television programming and off-line content such as email messages, mobile applications, and other electronic content distributed by stations. Advertising rates are typically driven by: (i) the size of a station’s market; (ii) a station’s overall ratings; (iii) a program’s popularity among targeted viewers; (iv) the number of advertisers competing for available time; (v) the demographic makeup of the station’s market; (vi) the availability of alternative advertising media in the market; (vii) the presence of effective sales forces; and (viii) the development of projects, features and programs that tie advertiser messages to programming and/or digital content on a station’s website or mobile applications.
Because broadcast stations rely on advertising revenues, they are sensitive to cyclical changes in the economy. The sizes of advertisers’ budgets, which can be affected by broad economic trends, can affect the broadcast industry in general and the revenues of individual broadcast television stations.
Strategy
Our success is based on the following strategies:
Grow by Leveraging our Diverse National Footprint. We serve a diverse and national footprint of television stations. We currently operate in DMAs ranked between 7 and 209. We operate in many markets that we believe have the potential for significant political advertising revenue in periods leading up to elections. We are also diversified across our broadcast programming.
Maintain and Grow our Market Leadership Position. According to Nielsen, during 2024, our owned and operated television stations achieved the #1 ranking in overall audience in 78 of our 113 markets. In addition, our stations achieved the #1 and/or #2 ranking in overall audience in 99 of our 113 markets.
We believe there are significant advantages in operating the #1 or #2 television broadcasting stations in a local market. Strong audience and market share allow us to enhance our advertising revenue through price discipline and leadership. We believe a top-rated local news platform is critical to capturing incremental sponsorship and political advertising revenue. Our high-quality station group allows us to generate higher operating margins, which allows us additional opportunities to reinvest in our business to further strengthen our network and local news ratings. Furthermore, we believe operating the top ranked stations in our various markets allows us to attract and retain top talent.
We also believe that our local market leadership positions help us in negotiating more beneficial terms in our major network affiliation agreements which currently expire at various dates through December 31, 2028, as well as our syndicated programming and local sports programming agreements. These leadership positions also give us additional leverage to negotiate retransmission contracts with cable system operators, telephone video distributors, direct broadcast satellite (“DBS”) operators and other multichannel video programming distributors (“MVPDs”).
We intend to maintain our market leadership position through continued prudent investment in our local news and syndicated programs, as well as continued technological advances and workflow improvements. We expect to continue to invest in technological upgrades in the future. We believe the foregoing will help us maintain and grow our market leadership, thereby enhancing our ability to grow and further diversify our revenues and cash flows.
Continue to Pursue Strategic Growth and Accretive Acquisition Opportunities. Over the last several years, the television broadcasting industry has been characterized by a high level of acquisition activity. We believe that there are a number of television stations, and a few station groups, that have attractive operating profiles and characteristics, and that share our commitment to local news coverage in the communities in which they operate and to creating high-quality and locally driven content. On a highly selective basis, we may pursue opportunities for the acquisition of additional television stations or station groups that fit our strategic and operational objectives, and where we believe that we can improve revenue, efficiencies and cash flow through active management and cost controls. As we consider potential acquisitions, we primarily evaluate potential station audience and revenue shares and the extent to which the acquisition target would positively impact our existing station operations. We also consider the amount of leverage that an acquisition would entail and our ability to carry such additional leverage at and after the time of acquisition. Consistent with this strategy, we have completed several acquisition and divestiture transactions, including some that had a material impact on our results of operations, between late 2013 and mid 2024. For more information on these transactions, see Note 3 “Acquisitions and Divestitures” of our audited consolidated financial statements included elsewhere herein. This note also describes the stations we acquired in each of 2024, 2023 and 2022, which we may also refer to collectively as our “acquisitions,” our “recent acquisitions” or “the acquisitions.”
Continue to Monetize Digital Spectrum. In addition to each station’s primary channel, we also broadcast a number of secondary channels. Certain secondary channels are simultaneously affiliated with more than one network. Our strategy includes expanding upon our digital offerings and sales. We continuously evaluate opportunities to use spectrum for future delivery of data to mobile devices using a new transmission standard called NextGen TV.
Continue to Maintain Prudent Cost Management. Historically, we have closely managed costs to maintain and improve our margins. We believe that our market leadership position provides additional negotiating leverage that enables us to lower, on a relative basis, our programming costs. We are pursuing opportunities to use spectrum more efficiently for content and sales by transitioning our stations to NextGen TV.
Further Strengthen our Balance Sheet. During the last several years, we have leveraged our strong cash flow and efficient operating model to grow our diverse national footprint. In 2024 and 2023, we made net principal payments totaling $520 million and $310 million reducing the balance outstanding under our Senior Credit Agreement and Senior Notes (in each case as defined below), including both voluntary and required payments, strategic refinancing activities as well as open-market purchases of portions of our debt at prices below the face value of the instruments purchased. For more information regarding our payment, refinancing and debt purchase activities, see Note 4 “Long-term Debt” of our audited consolidated financial statements included herein.
Stations
Our television stations serve local communities across the country. From our largest market in Atlanta, Georgia (DMA 7) to our smallest in North Platte, Nebraska (DMA 209), as tabulated by Nielsen, we inform, educate, entertain and connect each of these communities to their state, the nation and the whole world. Nearly all markets have a local studio, tower, sales, technical and administrative personnel dedicated to their community. Our network affiliations include the Big Four networks and many more smaller networks. Nearly all stations also provide content through digital platforms including a local station website and one or more digital apps and/or Free Ad-Supported Television (“FAST”) channels. For more information about our stations please visit our corporate website at www.graymedia.com.
Cyclicality, Seasonality and Revenue Concentrations
Broadcast stations like ours rely on advertising revenue and are therefore sensitive to cyclical changes in the economy. Our political advertising revenue is generally not as significantly affected by economic slowdowns or recessions as non-political advertising revenue.
Broadcast advertising revenue is generally highest in the second and fourth quarters. This seasonality results partly from increases in consumer advertising in the spring and retail advertising in the period leading up to, and including, the holiday season. Broadcast advertising revenue is also typically higher in even-numbered years due to spending by political candidates, political parties and special interest groups during the “on year” of the two-year election cycle. Political advertising spending is typically heaviest during the fourth quarter. In addition, the broadcast of the Olympic Games by our NBC-affiliated stations generally leads to increased viewership and revenue during those years for our NBC-affiliated stations.
Our broadcast advertising revenue is earned from the sale of advertisements broadcast by our stations. Although no single customer represented more than 5% of our broadcast advertising revenue for the years ended December 31, 2024, 2023 or 2022, we derived a material portion of our non-political broadcast advertising revenue from advertisers in a limited number of industries, particularly the services sector, comprising financial, legal and medical advertisers, and the automotive industry. The services sector has become an increasingly important source of advertising revenue over the past few years. During the years ended December 31, 2024, 2023 and 2022 approximately 23%, 27% and 28%, respectively, of our broadcast advertising revenue (excluding political advertising revenue) was obtained from advertising sales to the services sector. During the years ended December 31, 2024, 2023 and 2022 approximately 20%, 20% and 17%, respectively, of our broadcast advertising revenue (excluding political advertising revenue) was obtained from advertising sales to automotive customers. Revenue from these industries may represent a higher percentage of total revenue in odd-numbered years due to, among other things, the increased availability of advertising time, as a result of such years being the “off year” of the two-year election cycle.
Station Network Affiliations. In addition to affiliations with ABC, CBS, NBC and FOX, our secondary channels are affiliated with numerous smaller networks and program services including, among others, the CW Network or the CW Plus Network (collectively, “CW”), MY Network, the MeTV Network, Telemundo, THE365, Outlaw, and others. Certain of our secondary digital channels are affiliated with more than one network simultaneously. We also broadcast independent and local news/weather channels in some markets on both primary and secondary channels.
The Big Four networks dominate broadcast television in terms of the amount of viewership that their original programming attracts. The “Big Three” major broadcast networks of CBS, NBC and ABC provide their respective network affiliates with a majority of the programming broadcast each day. FOX and CW provide their affiliates with a smaller portion of each day’s programming compared to the Big Three networks. The CW Plus Network generally provides programming for the entire broadcast day for CW affiliates in markets smaller than the top 100 DMAs.
We believe most successful commercial television stations obtain their brand identity from locally produced news programs; however, the affiliation of a station’s channels with one of the Big Four major networks can have a significant impact on the station’s programming, revenues, expenses and operations. A typical network provides an affiliate with network programming in exchange for a substantial majority of the advertising time available for sale during the airing of the network programs. The network then sells this advertising time and retains the revenue. The affiliate sells the remaining advertising time available within the network programming and non-network programming, and the affiliate retains most or all of these revenues. In seeking to acquire programming to supplement network-supplied programming, which we believe is critical to maximizing affiliate revenue, affiliates compete primarily with other affiliates and independent stations in their markets and, in certain cases, various national non-broadcast networks (“cable networks”) and various video streaming services that present competitive programming. The Big Four networks and CW charge fees to their affiliates for receiving network programming.
A television station may also acquire programming through barter arrangements. Under a programming barter arrangement, a national program distributor retains a fixed amount of advertising time within the program in exchange for the programming it supplies. The television station may pay a fixed fee for such programming.
We record revenue and expense for trade transactions involving the exchange of tangible goods or services with our customers. The revenue is recorded at the time the advertisement is broadcast and the expense is recorded at the time the goods or services are used. The revenue and expense associated with these transactions are based on the fair value of the assets or services received.
Affiliates of FOX and CW must purchase or produce a greater amount of programming for their non-network time periods, generally resulting in higher programming costs. On the other hand, affiliates of FOX and CW retain a larger portion of their advertising time inventory and the related revenues compared to Big Three affiliates.
Competition
Television stations compete for audiences, certain programming (including news) and advertisers. Cable network programming is a significant competitor of broadcast television programming. No single cable network regularly attains audience levels comparable to any major broadcast network. Despite increasing competition from cable channels, streaming services, digital platforms, social media, and internet-delivered video channels, television broadcasting remains the dominant distribution system for mass-market television advertising. In addition, signal coverage and carriage on MVPD systems materially affect a television station’s competitive position.
Audience. Stations compete for audience based on broadcast program popularity, which has a direct effect on advertising rates. Networks supply a substantial portion of our affiliated stations’ daily programming. Affiliated stations depend on the performance of the network programs to attract viewers. There can be no assurance that any such current or future programming created by our affiliated networks will achieve or maintain satisfactory viewership levels. Stations program non-network time periods with a combination of locally produced news, public affairs and entertainment programming, including national news or syndicated programs purchased for cash, cash and barter or barter only.
MVPD systems have significantly altered the competitive landscape for audience in the television industry. Specifically, MVPD systems can increase a broadcasting station’s competition for viewers in a market by providing both cable networks and distant television station signals not otherwise available to the station’s audience.
Other sources of competition for audiences, programming and advertisers include streaming services, connected televisions, internet websites, mobile applications and wireless carriers, direct-to-consumer video distribution systems and home entertainment systems.
Recent developments by many companies, including digital streaming service providers and internet website operators, have expanded, and are continuing to expand, the variety and quality of broadcast and non-broadcast video programming available to consumers via the internet. Internet companies have developed business relationships with companies that have traditionally provided syndicated programming, network television and other content. As a result, additional programming has, and is expected to further become, available through non-traditional methods, which can directly impact the number of TV viewers, and thus indirectly impact station rankings, popularity and revenue possibilities of our stations.
Programming. Competition for non-network programming involves negotiating with national program distributors, or syndicators, that sell “first run” and “off network” or rerun programming packages. Each station competes against the other broadcast stations in its market for exclusive access to first run programming (such as Wheel of Fortune) and off-network reruns (such as The Big Bang Theory). Broadcast stations also compete for exclusive news stories and features. Cable networks, streaming services and internet service providers compete with local stations for programming.
Advertising. Advertising revenues comprise the primary source of revenues for our stations. Our stations compete for advertising revenues in their respective markets with other television stations, digital platforms including Google and YouTube, Facebook and Instagram, local cable and other MVPD systems, as well as local newspapers, radio stations, magazines, outdoor advertising, transit advertising, yellow page directories and direct mail.
Federal Regulation of the Television Broadcast Industry
General. Under the Communications Act of 1934, as amended (“Communications Act”), television broadcast operations such as ours are subject to the jurisdiction of the FCC. Among other things, the Communications Act empowers the FCC to: (i) issue, revoke and modify broadcasting licenses; (ii) regulate stations’ operations and equipment; and (iii) impose penalties for violations of the Communications Act or FCC regulations. The Communications Act prohibits the assignment of a license or the transfer of control of a licensee without prior FCC approval.
License Grant and Renewal. The FCC grants broadcast licenses to television stations for terms of up to eight years. Broadcast licenses are of paramount importance to the operations of television stations. The Communications Act requires the FCC to renew a licensee’s broadcast license if the FCC finds that: (i) the station has served the public interest, convenience and necessity; (ii) there have been no serious violations of either the Communications Act or the FCC’s rules and regulations; and (iii) there have been no other violations which, taken together, would constitute a pattern of abuse. Historically the FCC has renewed broadcast licenses in substantially all cases. While we are not currently aware of any facts or circumstances that might prevent the renewal of our stations’ licenses at the end of their respective license terms, we cannot provide any assurances that any license will be renewed. Failure to renew any licenses upon the expiration of any license term could have a material adverse effect on our business. Under the Communications Act, the term of a broadcast license is automatically extended pending the FCC’s processing of a timely filed renewal application. For further information regarding the expiration dates of our stations’ current licenses and renewal application status, see the table under the heading “Stations”.
Media Ownership Restrictions and FCC Proceedings. The FCC’s broadcast ownership rules affect the number, type and location of broadcast properties that we may hold or acquire. Those rules generally prohibit an entity from acquiring “attributable” interests in two television stations in the same market if both are ranked among the top-four stations in the market (the “top-four” prohibition). The rules continue to limit the aggregate national audience reach of television stations that may be under common ownership, operation and control, or in which a single person or entity may hold an official position or have more than a specified interest or percentage of voting power. The FCC’s rules also define the types of positions and interests that are considered attributable for purposes of the ownership limits, and thus also apply to our principals and certain investors.
The FCC is required by statute to review all of its broadcast ownership rules every four years to determine if such rules remain necessary in the public interest. The FCC took until December 2023 to adopt final rules as a result of its 2018 review, at which time it increased restrictions on local television ownership (discussed in more detail below). Prior to doing so, in December 2022, the FCC began a new quadrennial review of its ownership rules with the issuance of a Public Notice seeking comments on competition in the local television marketplace, including, among other things: (i) ongoing trends or developments in the media marketplace; (ii) impact of the ownership rules on the American public as consumers of media, including whether adjustments should be made to the rules to account for changes in consumer behavior like the use of streaming services; (iii) the barriers to minority and female ownership of broadcast stations; and (iv) any additional legal or economic factors the FCC should consider beyond its traditional public policy goals of competition, localism, and diversity. The 2022 review remains pending.
Local TV Ownership Rules. The FCC’s current television ownership rules allow one entity to acquire two commercial television stations in a DMA as long as no more than one station is ranked among the top-four stations in the market (as noted above, the “top-four” prohibition). An entity may retain ownership of the second station if it obtains top-four status after it is acquired. The FCC will consider waivers of the top-four prohibition on a case-by-case basis.
When it resolved the 2018 quadrennial review in December 2023, the FCC adopted two modifications to the top-four prohibition that make it more restrictive. These rule changes took effect in March 2024. First, the FCC extended the top-four prohibition to low power television (“LPTV”) stations and multicast streams. As a result of this change, a licensee will be prohibited from acquiring network-affiliated programming of another top-four station in a DMA and then placing that programming on either the multicast stream of a full-power station or a LPTV station in a DMA in which it already owns another top-four rated station. These additional restrictions apply to transactions entered into after December 26, 2023. Existing combinations will be grandfathered, but may not be transferred or assigned except in compliance with the new rule. Second, the FCC modified its methodology for determining a station’s audience share for purposes of the top-four prohibition (and failing station waiver requests) to (i) consider audience share data over a 12-month period immediately preceding the date the application is filed, (ii) expand the relevant daypart for audience share data significantly, and (iii) require the inclusion of audience share data for all free-to-consumer, non-simulcast multicast streams.
National Television Station Ownership Rule. The maximum percentage of US households that a single owner can reach through commonly owned television stations is 39 percent. This limit was specified by Congress in 2004. The FCC applies a 50 percent “discount” for ultra-high frequency (“UHF”) stations. In December 2017, the FCC issued an NPRM seeking comment on whether it should modify or eliminate the national cap, including the UHF discount. Comments and reply comments were filed in 2018, and the proceeding remains open.
Conclusion. The FCC’s media ownership proceedings are on-going and, in many cases, are or will be subject to further judicial and potentially Congressional review. We cannot predict the outcome of any of these current or potential proceedings.
Attribution Rules. Under the FCC’s ownership rules, a direct or indirect purchaser of certain types of our securities could violate FCC regulations if that purchaser owned or acquired an “attributable” interest in another television broadcast station in the same area as one or more of our stations. Pursuant to FCC rules, the following relationships and interests are generally considered attributable for purposes of media ownership restrictions: (i) all officers and directors of a corporate licensee and its direct or indirect parent(s); (ii) voting stock interests of at least five percent; (iii) voting stock interests of at least 20 percent, if the holder is a passive institutional investor (such as an investment company, as defined in 15 U.S.C. §80a-3, a bank holding stock through its trust department, or an insurance company); (iv) any limited partnership interest or interest in a limited liability company, unless properly “insulated” from management activities; (v) equity and/or debt interests that in the aggregate exceed 33 percent of a licensee’s total assets, if the interest holder supplies more than 15 percent of the station’s total weekly programming or is a same-market television broadcast company; and (vi) time brokerage of a television broadcast station by a same-market television broadcast company providing more than 15 percent of the station’s weekly programming.
Management services agreements and other types of shared services arrangements between same-market stations that do not include attributable time brokerage components generally are not deemed attributable under the FCC’s current rules and policies. However, the FCC previously requested comment on whether local news service agreements and/or shared services agreements should be considered attributable for purposes of applying the media ownership rules, and the FCC has recently provided additional scrutiny to such arrangements. The DOJ has also taken steps under the antitrust laws to block certain transactions involving joint sales or other services agreements.
To our knowledge, no officer, director or five percent or greater shareholder currently holds an attributable interest in another television station that is inconsistent with the FCC’s ownership rules and policies or with our ownership of our stations.
Alien Ownership Restrictions. The Communications Act restricts the ability of foreign entities or individuals to own or hold interests in broadcast licenses. The Communications Act bars the following from holding broadcast licenses: foreign governments, representatives of foreign governments, non-citizens, representatives of non-citizens, and corporations or partnerships organized under the laws of a foreign nation. Foreign individuals or entities, collectively, may directly or indirectly own or vote no more than 20 percent of the capital stock of a licensee or 25 percent of the capital stock of a corporation that directly or indirectly controls a licensee. The 20 percent limit on foreign ownership of a licensee may not be waived. In September 2016, the Commission adopted an Order that allows broadcast licensees to file a petition for declaratory ruling seeking FCC approval to exceed the 25 percent foreign ownership benchmark for a parent company. The Commission also clarified the methodology for publicly traded broadcasters to assess compliance with the foreign ownership limits.
We serve as a holding company for our subsidiaries, including subsidiaries that hold station licenses. Therefore, absent a grant of a declaratory ruling, we are restricted from having more than one-fourth of our stock owned or voted directly or indirectly by non-citizens, foreign governments, representatives of non-citizens or foreign governments, or foreign corporations.
Programming and Operations. Rules and policies of the FCC and other federal agencies regulate certain programming practices and other areas affecting the business or operations of broadcast stations.
The Children’s Television Act of 1990 limits commercial matter in children’s television programs and requires stations to present educational and informational children’s programming. Broadcasters are effectively required through license renewal processing guidelines to provide a certain amount of children’s educational programming per week on their primary channels. In July 2019, the FCC issued an Order that adopted sweeping changes to the current children’s programming rules giving broadcasters increased flexibility in how they choose to serve the educational and informational needs of children.
The FCC also regulates broadcast indecency and profanity and the statutory maximum fine for broadcasting indecent material is approximately $0.5 million per incident. The FCC has sought comment on whether it should modify its indecency policies but has not yet issued a decision in this proceeding. The outcome of this proceeding could affect future FCC policies in this area, which could have a material adverse effect on our business.
EEO Rules. The FCC’s Equal Employment Opportunity (“EEO”) rules impose job information dissemination, recruitment, documentation and reporting requirements on broadcast station licensees. Broadcasters are subject to random audits to ensure compliance with EEO rules and may be sanctioned for noncompliance.
MVPD Retransmission of Local Television Signals. Under the Communications Act and FCC regulations, each television station generally has a so-called “must-carry” right to carriage of its primary channels on all cable systems and direct broadcast satellite systems serving its market. Each commercial television station may elect between invoking its “must carry” right or invoking a right to prevent an MVPD system from retransmitting the station’s signal without its consent (“retransmission consent”). Stations must make this election by October 1 every three years. Such elections are binding throughout the three-year cycle that commences on the subsequent January 1. The current election cycle commenced on January 1, 2024, and ends on December 31, 2026. During this period, our stations elected retransmission consent and have entered into retransmission consent contracts with virtually all MVPD systems serving their markets. Under the Communications Act and FCC regulations, broadcasters and MVPDs are required to negotiate retransmission consent agreements in good faith. Among other things, MVPDs may designate a buying group to negotiate retransmission consent agreements on their behalf and large stations groups, such as us, are required to negotiate for retransmission consent in good faith with a qualified MVPD buying group.
The FCC also has promulgated rules that: (i) grant DBS providers the right to seek market modifications based on factors similar to those used in the cable industry; (ii) broaden the FCC’s prohibition against joint retransmission negotiations by prohibiting joint retransmission negotiations by any stations in the same DMA not under common control; (iii) prohibit a television station from limiting the ability of an MVPD to carry into its local market television signals that are deemed significantly viewed; and (iv) eliminate the “sweeps prohibition,” which precluded cable operators from deleting or repositioning local commercial television stations during “sweeps” ratings periods. A proposal adopted in January 2025 will require MVPDs to report to the FCC any service disruptions resulting from failed retransmission consent negotiations that last longer than 24 hours.
We currently are not a party to any agreements that delegate our authority to negotiate retransmission consent for any of our television stations or that grant us authority to negotiate retransmission consent for any other television station. Nevertheless, we cannot predict how the FCC’s restriction on joint negotiation might impact future opportunities.
The FCC has sought comment on whether it should modify or eliminate the network non-duplication and syndicated exclusivity rules. In March 2020, the FCC sought comment on whether it should modernize its methodology for determining whether a television station is significantly viewed in a community outside of its local television market. Under exceptions to the network non-duplication and syndicated exclusivity rules, cable operators and satellite carriers are not required to delete the duplicating network or syndicated programming where the signal of the otherwise distant station is determined to be significantly viewed in the relevant community. We cannot predict the outcome of these proceedings. If, however, the FCC eliminates or relaxes its rules enforcing our program exclusivity rights, it could affect our ability to negotiate future retransmission consent agreements, and it could harm our ratings and advertising revenue if cable and satellite operators import duplicative programming.
Certain online video distributors (“OVDs”) have explored streaming broadcast programming over the internet without the consent of the copyright owner of the programming. The majority of federal courts have sided with broadcasters and enjoined OVDs from streaming broadcast programming without obtaining such copyright clearance.
On December 19, 2014, the FCC issued an NPRM seeking comment on its proposal to modernize the term “MVPD” to be technology neutral. If the NPRM proposal is adopted, an entity that uses the internet to distribute multiple streams of linear programming would be considered an MVPD and would have the same retransmission consent rights and obligations as other MVPDs, including the right to negotiate with television stations to carry their broadcast signals. The FCC also asked about the possible copyright implications of this proposal. We cannot predict the outcome of the FCC’s interpretive proceedings. Currently, a number of OVDs have obtained appropriate copyright authority and are retransmitting broadcast programming over the internet, but have not been required to obtain separate retransmission consent from the broadcast stations being retransmitted.
The foregoing does not purport to be a complete summary of the Communications Act, other applicable statutes, or the FCC’s rules, regulations or policies. Proposals for additional or revised regulations and requirements are pending before, are being considered by, and may in the future be considered by, Congress and federal regulatory agencies from time to time. We cannot predict the effect of any existing or proposed federal legislation, regulations or policies on our business. Also, several of the foregoing matters are now, or may become, the subject of litigation, and we cannot predict the outcome of any such litigation or the effect on our business.
Human Capital
Successful execution of our strategy is dependent on attracting, developing and retaining key employees and members of our management team. We believe the substantial skills, experience and industry knowledge of our employees and our training of our customer-facing employees benefit our operations and performance. There are several ways in which we attract, develop, and retain highly qualified talent, including:
● | Training and investing in our employees. With competitive wages, healthcare benefits, a defined contribution retirement program and opportunities for job training and advancement, our employees develop skills and expertise necessary to build careers. |
● | Driving a diverse and inclusive culture. We are committed to a welcoming and inclusive environment in every aspect of our business. As we strive to deliver high-quality products and services that exceed expectations, we embrace the unique perspectives and experiences of our employees and partners and the communities we serve. |
● | Focusing on a safe and healthy workplace. We value our employees and are committed to providing a safe and healthy workplace. All employees are required to comply with Company safety rules and expectations and are expected to actively contribute to making our Company a safer place to work. |
Employees
As of February 21, 2025, we had 9,118 full-time employees and 384 part-time employees, of which, 510 full-time and 23 part-time employees at 17 stations were represented by various unions. We consider our relations with our employees to be good.
Corporate Information
Gray Media, Inc. is a Georgia corporation, incorporated in 1897 initially to publish the Albany Herald in Albany, Georgia. We entered the broadcast industry in 1953. Our executive offices are located at 4370 Peachtree Road, NE, Atlanta, Georgia 30319, and our telephone number at that location is (404) 504-9828. Our website address is http://www.graymedia.com. The information on our website is not incorporated by reference or part of this or any other report we file with or furnish to the Securities and Exchange Commission (“SEC”). We make the following reports filed or furnished, as applicable, with the SEC available, free of charge, on our website under the heading “SEC Filings” as soon as practicable after they are filed with, or furnished to, the SEC: our annual reports on Form 10-K, our quarterly reports on Form 10-Q, our current reports on Form 8-K, and amendments to any of the foregoing.
A Code of Ethics (“Code”) applies to all of our directors, executive officers and employees. The Code is available on our website in the Investor Relations section under the subheading Governance Documents. If any waivers of the Code are granted to an executive officer or director, the waivers will be disclosed in an SEC filing on Form 8-K.
Item 1A. RISK FACTORS
In addition to the other information contained in, incorporated by reference into or otherwise referred to in this Annual Report, you should consider carefully the following factors when evaluating our business. Any of these risks, or the occurrence of any of the events described in these risk factors, could materially adversely affect our business, financial condition and the results of operations. In addition, other risks or uncertainties not presently known to us or that we currently do not deem material could arise, any of which could also materially adversely affect us. This Annual Report also contains and incorporates, by reference, forward-looking statements that involve risks and uncertainties. Our actual results could differ materially from those anticipated in forward-looking statements as a result of certain factors, including the occurrence of one or more of the following risk factors.
Risks Related to Our Business
Operating Risks
The success of our business is dependent upon advertising revenues, which are seasonal and cyclical, and also fluctuate as a result of a number of factors, some of which are beyond our control.
Our main source of revenue is the sale of advertising time and space. Our ability to sell advertising time and space depends on, among other things:
| | ● | economic conditions in the areas where our stations are located and in the nation as a whole; |
| | ● | the popularity of the programming offered by our television stations; |
| | ● | changes in the population demographics in the areas where our stations are located; |
| | ● | local and national advertising price fluctuations, which can be affected by the availability of programming, the popularity of programming, and the relative supply of and demand for commercial advertising; |
| | ● | our competitors’ activities, including increased competition from other advertising-based mediums, particularly digital platforms, cable networks, MVPDs and other internet companies; |
| | ● | the duration and extent of any network preemption of regularly scheduled programming for any reason; |
| | ● | decisions by advertisers to withdraw or delay planned advertising expenditures for any reason; |
| | ● | the competitiveness of local, regional, and federal elections and ballot initiatives; |
| | ● | labor disputes or other disruptions at major national advertisers, programming providers or networks; and |
| | ● | other factors beyond our control. |
Our results are also subject to seasonal and cyclical fluctuations. Seasonal fluctuations typically result in higher revenue and broadcast operating income in the second and fourth quarters rather than in the first and third quarters of each year. This seasonality is primarily attributable to advertisers’ increased expenditures in the spring and in anticipation of holiday season spending in the fourth quarter and an increase in television viewership during these periods. In addition, we typically experience fluctuations in our revenue and broadcast operating income between even-numbered and odd-numbered years. In years in which there are impending elections for various state and national offices, which primarily occur in even-numbered years, political advertising revenue tends to increase, often significantly, and particularly during presidential election years. We consider political broadcast advertising revenue to be revenue earned from the sale of advertising to political candidates, political parties and special interest groups of advertisements broadcast by our stations that contain messages primarily focused on elections and/or public policy issues. In even-numbered years, we typically derive a material portion of our broadcast advertising revenue from political broadcast advertisers. For the years ended December 31, 2024 and 2023, we derived approximately 14% and 2%, respectively, of our total revenue from political broadcast advertisers. If political broadcast advertising revenues declined, especially in an even-numbered year, our results of operations and financial condition could also be materially adversely affected. Also, our stations affiliated with the NBC Network broadcast Olympic Games and typically experience increased viewership and revenue during those broadcasts. As a result of the seasonality and cyclicality of our revenue and broadcast operating income, and the historically significant increase in our revenue and broadcast operating income during even-numbered years, it has been, and is expected to remain, difficult to engage in period-over-period comparisons of our revenue and results of operations.
Uncertain financial and economic conditions may have an adverse impact on our business, results of operations or financial condition.
Uncertainty of financial and economic conditions over the longer term and the continuation or worsening of such conditions could reduce consumer confidence and have an adverse effect on our business, results of operations and/or financial condition. If consumer confidence were to decline, this decline could negatively affect our advertising customers’ businesses and their advertising budgets. In addition, volatile economic conditions could have a negative impact on our industry or the industries of our customers who advertise on our stations, resulting in reduced advertising sales. Furthermore, it may be possible that actions taken by any governmental or regulatory body for the purpose of stabilizing the economy or financial markets will not achieve their intended effect. In addition to any negative direct consequences to our business or results of operations arising from these financial and economic developments, some of these actions may adversely affect financial institutions, capital providers, advertisers or other consumers on whom we rely, including for access to future capital or financing arrangements necessary to support our business. Our inability to obtain financing in amounts and at times necessary could make it more difficult or impossible to meet our obligations or otherwise take actions in our best interests.
Our dependence upon a limited number of advertising categories could adversely affect our business.
We consider broadcast advertising revenue to be revenue earned primarily from the sale of advertisements broadcast by our stations. Although no single customer represented more than 5% of our broadcast advertising revenue for the years ended December 31, 2024 and 2023, we derived a material portion of non-political broadcast advertising revenue from advertisers in a limited number of industries, particularly the services sector, comprising financial, legal and medical advertisers, and the automotive industry. The services sector has become an increasingly important source of advertising revenue over the past few years. During the years ended December 31, 2024, 2023 and 2022 approximately 23%, 27% and 28%, respectively, of our broadcast advertising revenue (excluding political advertising revenue) was obtained from advertising sales to the services sector. During the years ended December 31, 2024, 2023 and 2022 approximately 20%, 20% and 17%, respectively, of our broadcast advertising revenue (excluding political advertising revenue) was obtained from advertising sales to automotive customers. Our results of operations and financial condition could be materially adversely affected if broadcast advertising revenue from the services sector, automotive or certain other industries, such as the medical, restaurant, communications, or furniture and appliances industries, declined.
We intend to continue to evaluate growth opportunities through strategic acquisitions, and there are significant risks associated with an acquisition strategy.
We intend to continue to evaluate opportunities for growth through selective acquisitions of television stations or station groups, subject to our commitment to reducing our leverage ratio over time. There can be no assurances that we will be able to identify any suitable acquisition candidates, and we cannot predict whether we will be successful in pursuing or completing any acquisitions, or what the consequences of not completing any acquisitions would be. Consummation of any proposed acquisition at any time may also be subject to various conditions such as compliance with FCC rules and policies. Consummation of acquisitions may also be subject to antitrust or other regulatory requirements. In addition, as we operate in a highly regulated industry, we could be subject to litigation, government investigations and enforcement actions on a variety of matters, the result of which could limit our acquisition strategy.
An acquisition strategy involves numerous other risks, including risks associated with:
| | ● | identifying suitable acquisition candidates and negotiating definitive purchase agreements on satisfactory terms; |
| | ● | integrating operations and systems and managing a large and geographically diverse group of stations; |
| | ● | obtaining financing to complete acquisitions, which financing may not be available to us at times, in amounts, or at rates acceptable to us, if at all, and potentially the related risks associated with increased debt; |
| | ● | diverting our management’s attention from other business concerns; |
| | ● | potentially losing key employees; and |
| | ● | potential changes in the regulatory approval process that may make it materially more expensive, or materially delay our ability, to consummate any proposed acquisitions. |
Our failure to identify suitable acquisition candidates, or to complete any acquisitions and integrate any acquired business, or to obtain the expected benefits therefrom, could materially adversely affect our business, financial condition and results of operations.
We may fail to realize any benefits and incur unanticipated losses related to any acquisition.
The success of any strategic acquisition depends, in part, on our ability to successfully combine the acquired business and assets with our business and our ability to successfully manage the assets so acquired. It is possible that the integration process could result in the loss of key employees, the disruption of ongoing business or inconsistencies in standards, controls, procedures and policies that adversely affect our ability to maintain relationships with clients, customers and employees or to achieve the anticipated benefits of an acquisition. Successful integration may also be hampered by any differences between the operations and corporate culture of the two organizations. Additionally, general market and economic conditions may inhibit our successful integration of any business. If we experience difficulties with the integration process, the anticipated benefits of an acquisition may not be realized fully, or at all, or may take longer to realize than expected. Finally, any cost savings that are realized may be offset by losses in revenues from the acquired business, any assets or operations disposed of in connection therewith or otherwise, or charges to earnings in connection with such acquisitions.
We must purchase television programming in advance of knowing whether a particular show will be popular enough for us to recoup our costs.
One of our most significant costs is for the purchase of television programming. If a particular program is not sufficiently popular among audiences in relation to the cost we pay for such program, we may not be able to sell enough related advertising time for us to recover the costs we pay to broadcast the program. We also must usually purchase programming several years in advance, and we may have to commit to purchase more than one year’s worth of programming, resulting in the incurrence of significant costs in advance of our receipt of any related revenue. We may also replace programs that are performing poorly before we have recaptured any significant portion of the costs we incurred in obtaining such programming or fully expensed the costs for financial reporting purposes. Any of these factors could reduce our revenues, result in the incurrence of impairment charges, or otherwise cause our costs to escalate relative to revenues.
We are highly dependent upon our network affiliations, and our business and results of operations may be materially affected if a network: (i) terminates its affiliation with us; (ii) significantly changes the economic terms and conditions of any future affiliation agreements with us; or (iii) significantly changes the type, quality or quantity of programming provided to us under an affiliation agreement.
Our business depends in large part on the success of our network affiliations. One or more stations in each of our operating markets are affiliated with at least one of the four major broadcast networks pursuant to individual affiliation agreements. Each affiliation agreement provides the affiliated station with the right to broadcast all programs transmitted by the affiliated network during the term of the related agreement. Our affiliation agreements generally expire at various dates through December 31, 2028 (with respect to Big Four networks).
If we cannot enter into affiliation agreements to replace any agreements in advance of their expiration, we would no longer be able to carry the affiliated network’s programming. This loss of programming would require us to create and/or obtain replacement programming. Such replacement programming may involve higher costs and may not be as attractive to our target audiences, thereby reducing our ability to generate advertising revenue, which could have a material adverse effect on our results of operations. On the other hand, replacement programming may provide additional advertising inventory than that provided to affiliated stations by their networks. Our concentration of CBS and/or NBC affiliates makes us particularly sensitive to adverse changes in our business relationship with, and the general success of, CBS and/or NBC.
If we are able to renew or replace existing affiliation agreements, we can give no assurance that any future affiliation agreements will have economic terms or conditions equivalent to or more advantageous to us than our current agreements. If in the future a network or networks impose more adverse economic terms upon us, such event or events could have a material adverse effect on our business and results of operations.
In addition, if we are unable to renew or replace any existing affiliation agreements, we may be unable to satisfy certain obligations under our existing or any future retransmission consent agreements with MVPDs and/or secure payment of retransmission consent fees under such agreements. Furthermore, if in the future a network limited or removed our ability to retransmit network programming to MVPDs, we may be unable to satisfy certain obligations or criteria for fees under any existing or any future retransmission consent agreements. In either case, such an event could have a material adverse effect on our business and results of operations.
We are also dependent upon our retransmission consent agreements with MVPDs, and we cannot predict the outcome of potential regulatory changes to the retransmission consent regime.
We are also dependent, in significant part, on our retransmission consent agreements. Our current retransmission consent agreements expire at various times over the next several years. No assurances can be provided that we will be able to renegotiate all of such agreements on favorable terms, on a timely basis, or at all. The failure to renegotiate such agreements could have a material adverse effect on our business and results of operations.
Our ability to successfully negotiate future retransmission consent agreements may be hindered by potential legislative or regulatory changes to the framework under which these agreements are negotiated.
The FCC has taken actions to implement various provisions of the STELAR Reauthorization Act of 2014 affecting the carriage of television stations, including (i) adopting rules that allow for the modification of satellite television markets in order to ensure that satellite operators carry the broadcast stations of most interest to their communities; (ii) tightening its rules on joint retransmission consent negotiations to prohibit joint negotiations by stations in the same market unless those stations are commonly controlled; (iii) prohibiting a television station from limiting the ability of an MVPD to carry into its local market television signals that are deemed significantly viewed; and (iv) eliminating the “sweeps prohibition,” which had precluded cable operators from deleting or repositioning local commercial television stations during “sweeps” ratings periods.
We currently are not a party to any agreements that delegate our authority to negotiate retransmission consent for any of our television stations or grant us authority to negotiate retransmission consent for any other television station. Nevertheless, we cannot predict how the FCC’s restrictions on joint negotiations might impact future opportunities.
The FCC also has sought comment on whether it should modify or eliminate the network non-duplication and syndicated exclusivity rules. We cannot predict the outcome of this proceeding. If, however, the FCC eliminates or relaxes its rules enforcing our program exclusivity rights, it could affect our ability to negotiate future retransmission consent agreements, and it could harm our ratings and advertising revenue if cable and satellite operators import duplicative programming.
In addition, certain OVDs have explored streaming broadcast programming over the internet without approval from or payments to the broadcaster. The majority of federal courts have issued preliminary injunctions enjoining these OVDs from streaming broadcast programming. Separately, on December 19, 2014, the FCC issued an NPRM proposing to classify certain OVDs as MVPDs for purposes of certain FCC carriage rules. If the FCC adopts its proposal, OVDs would need to negotiate for consent from broadcasters before they retransmit broadcast signals. We cannot predict whether the FCC will adopt its proposal or other modified rules that might weaken our rights to negotiate with OVDs.
In December 2019, Congress adopted the Satellite Television Community Protection and Promotion Act of 2019 and the Television Viewer Protection Act of 2019 (the “TVPA of 2019”). Among other things, these acts (i) made permanent the copyright license set out in Section 119 of the Copyright Act; (ii) limited eligibility for use of the Section 119 license to retransmit the signals of network television broadcast stations to unserved households to those satellite operators who provide local-into-local service to all DMAs; and (iii) modified the definition of unserved households to those households located in a “short market” (which, in turn, was defined as a local market in which programming of one or more of the top four networks is not offered on either the primary or multicast stream by any network station in that market). The TVPA of 2019 also made permanent the requirement that broadcasters and MVPDs negotiate in good faith and adds a provision that will (i) allow MVPDs to designate a buying group to negotiate retransmission consent agreements on their behalf and (ii) require large stations groups, including ours, to negotiate in good faith with a qualified MVPD buying group.
Congress continues to consider various changes to the statutory scheme governing retransmission of broadcast programming. Some of the proposed bills would make it more difficult to negotiate retransmission consent agreements with large MVPDs and would weaken our leverage to seek market-based compensation for our programming. We cannot predict whether any of these proposals will become law, and, if any do, we cannot determine the effect that any statutory changes would have on our business.
We may be unable to maintain or increase our digital advertising revenue, which could have a material adverse effect on our business and operating results.
We generate a meaningful portion of our advertising revenue from the sale of advertisements on our digital platforms and through the sale of inventory on digital platforms owned by third parties. Our ability to maintain and increase this advertising revenue is largely dependent upon the number of users actively visiting the digital sites, digital apps, and platforms and our arrangements that allow us to sell and service such inventory. Because digital advertising techniques are evolving, if our content, technology and/or advertisement-serving techniques do not evolve to meet the changing needs of advertisers, our advertising revenue could decline. Changes in our business model, advertising inventory or initiatives could also cause a decrease in our digital advertising revenue.
We do not have long-term agreements with most of our digital advertisers. Any termination, change or decrease in our relationships with our largest digital advertising clients could have a material adverse effect on our revenue and profitability. If we do not maintain or increase our digital advertising revenue, our business, results of operations and financial condition could be materially adversely affected.
Increased cybersecurity threats, attacks, and cybersecurity incidents impacting our information technology infrastructure or those of our third-party service providers could interfere with our operations, compromise client information and expose us to liability, possibly causing our business and reputation to suffer.
We rely on technology and data owned or controlled by us or our third-party service providers in substantially all aspects of our business operations. Our revenues are increasingly dependent on digital products and access to systems and data. Such use exposes us to cybersecurity threats arising from a variety of causes and forms, including from deliberate attacks or unintentional events. These cybersecurity incidents and similar attacks could include, but are not limited to, the deployment of harmful malware or ransomware, denial-of-services attacks, and other attacks, which may affect business continuity and threaten the availability, confidentiality and integrity of our systems and information. These attacks and incidents can also include employee or personnel failures, fraud, phishing or other social engineering attempts or other methods to cause confidential information, payments, account access or access credentials, or other data to be transmitted to an unintended recipient, and attempts to gain unauthorized access to digital systems for purposes of misappropriating assets or sensitive information, data corruption or operational disruption. Cybersecurity threat actors also may attempt to exploit vulnerabilities through software including that is software commonly used by companies in cloud-based services and bundled software. If we are subject to a cybersecurity incident or a similar attack, it could result in business interruption, disclosure of nonpublic information, alteration or corruption of data or systems, decreased advertising revenues, misstated financial data, liability for stolen assets or information, increased cybersecurity protection costs, litigation or investigations, including individual claims or consumer class actions, commercial litigation, administrative, and civil or criminal investigations or actions, regulatory intervention and sanctions or fines, investigation and remediation costs, financial consequences and reputational damage adversely affecting customer or investor confidence, among other things, any or all of which could materially adversely affect our business. While we have experienced cybersecurity incidents in the past, and may experience additional cybersecurity incidents in the future, we are not aware of any cybersecurity incident having a material adverse effect on our business, results of operations or financial condition to date. However, there can be no assurance that we will not experience future cybersecurity incidents that may be material. Although we have systems and processes in place to try to protect against risks associated with cybersecurity incidents in the future, depending on the nature of an cybersecurity incident, these protections may not be fully sufficient. In addition, because techniques used in cybersecurity threats change frequently and may not be recognized until launched against a target, we may be unable to anticipate these techniques or to implement adequate preventative measures. A cybersecurity incident may not be detected until well after it occurs and the severity and potential impact may not be fully known for a substantial period of time after it has been discovered. Although we maintain a cyber insurance policy, there is no guarantee that such coverage will be sufficient to address costs, liabilities and damages we may incur in connection with a cybersecurity incident or that such coverage will continue to be available on commercially reasonable terms or at all.
Industry Risks
We operate in a highly competitive environment. Competition occurs on multiple levels (for audiences, programming and advertisers) and is based on a variety of factors. If we are not able to successfully compete in all relevant aspects, our revenues will be materially adversely affected.
Television stations compete for audiences, certain programming (including news) and advertisers. Signal coverage and carriage on MVPD systems also materially affect a television station’s competitive position. With respect to audiences, stations compete primarily based on broadcast program popularity. We cannot provide any assurances as to the acceptability by audiences of any of the programs we broadcast. Further, because we compete with other broadcast stations for certain programming, we cannot provide any assurances that we will be able to obtain any desired programming at costs that we believe are reasonable. Cable-network programming, combined with increased access to cable, satellite TV, internet-delivered multichannel video programming distributors (“vMVPDs”), as well as internet video services (such as YouTube) and internet streaming channels and services including subscription video on demand (“SVOD”) and advertising video on demand (“AVOD”) have become significant competitors for television programming viewers. Cable networks’ viewership and advertising share have been declining in recent years, while streaming viewership has accelerated and recently surpassed the combined viewership of broadcast and cable-network programming combined. Further increases in the advertising share of cable networks, internet video services, and internet streaming channels and services could materially adversely affect the advertising revenue of our television stations.
In addition, new technologies and methods of buying advertising present an additional competitive challenge, as competitors may offer products and services such as the ability to purchase advertising programmatically or bundled offline and online advertising, aimed at more efficiently capturing advertising spend. The number of viewers and ratings of our television stations and advertising revenues in general may be impacted by viewers moving to these programming alternatives and alternate media content providers, and by eliminating or reducing subscriptions to traditional MVPD services (“cord cutting” and “cord shaving,” respectively). As these programming alternatives continue to drive changes in consumer behavior and other consumption strategies, our business and results of operations may be materially affected.
Our inability or failure to broadcast popular programs, or otherwise maintain viewership for any reason, including as a result of increases in programming alternatives, or our loss of advertising due to technological changes, could result in a lessening of advertisers, or a reduction in the amount advertisers are willing to pay us to advertise, which could have a material adverse effect on our business, financial condition and results of operations.
Risks Related to Our Indebtedness
We have substantial debt and have the ability to incur significant additional debt. The principal and interest payment obligations on such debt may restrict our future operations and impair our ability to meet our long-term obligations.
Currently, we have a $5.7 billion in aggregate principal amount of outstanding indebtedness, excluding intercompany debt and deferred financing costs. Subject to our ability to meet certain borrowing conditions under our Fifth Amended and Restated Credit Agreement (the “Senior Credit Agreement”), we have the ability to incur significant additional debt, including secured debt under our $680 million revolving credit facility. The terms of the indenture (the “2031 Notes Indenture”) governing our outstanding 5.375% senior notes due 2031 (the “2031 Notes”), the indenture (the “2030 Notes Indenture”) governing our outstanding 4.750% senior notes due 2030 (the “2030 Notes”), the indenture (the “2029 Notes Indenture”) governing our outstanding 10.5% senior secured first lien notes due 2029 (the “2029 Notes”), the indenture (the “2027 Notes Indenture”) governing our outstanding 7.0% senior notes due 2027 (the “2027 Notes”) and the indenture (the “2026 Notes Indenture”) governing our outstanding 5.875% senior notes due 2026 (the “2026 Notes” and, together with the 2031 Notes Indenture, the 2030 Notes Indenture, the 2029 Notes Indenture, the 2027 Notes Indenture and the 2026 Notes Indenture, the “Existing Indentures” or the “Indentures”) also permit us to incur additional indebtedness, subject to our ability to meet certain borrowing conditions.
Our substantial debt may have important consequences. For instance, it could:
| | ● | require us to dedicate a substantial portion of any cash flow from operations to the payment of interest and principal due under our debt, which would reduce funds available for other business purposes, including capital expenditures, acquisitions and investments; |
| | ● | place us at a competitive disadvantage compared to some of our competitors that may have less debt and better access to capital resources; |
| | ● | limit our ability to obtain additional financing to fund acquisitions, working capital and capital expenditures and for other general corporate purposes; and |
| | ● | make it more difficult for us to satisfy our financial obligations. |
Our ability to service our significant financial obligations depends on our ability to generate significant cash flow. This is partially subject to general economic, financial, competitive, legislative, regulatory, and other factors that are beyond our control. We cannot assure you that our business will generate cash flow from operations, that future borrowings will be available to us under our Senior Credit Agreement or any other credit facilities, or that we will be able to complete any necessary financings, in amounts sufficient to enable us to fund our operations or pay our debts and other obligations, or to fund other liquidity needs. If we are not able to generate sufficient cash flow to service our obligations, we may need to refinance or restructure our debt, sell assets, reduce or delay capital investments, or seek to raise additional capital. Additional debt or equity financing may not be available in sufficient amounts, at times or on terms acceptable to us, or at all. Specifically, volatility in the capital markets may also impact our ability to obtain additional financing, or to refinance our existing debt, on terms or at times favorable to us. If we are unable to implement one or more of these alternatives, we may not be able to service our debt or other obligations, which could result in us being in default thereon, in which circumstances our lenders could cease making loans to us, and lenders or other holders of our debt could accelerate and declare due all outstanding obligations due under the respective agreements, which could have a material adverse effect on us.
The agreements governing our various debt obligations impose restrictions on our operations and limit our ability to undertake certain corporate actions.
The agreements governing our various debt obligations, including our Senior Credit Agreement and the Existing Indentures, include covenants imposing significant restrictions on our operations. These restrictions may affect our ability to operate our business and may limit our ability to take advantage of potential business opportunities as they arise. These covenants place, or will place, restrictions on our ability to, among other things:
| | ● | incur additional debt, subject to certain limitations; |
| | ● | declare or pay dividends, redeem stock or make other distributions to stockholders; |
| | ● | make investments or acquisitions; |
| | ● | create liens or use assets as security in other transactions; |
| | ● | merge or consolidate, or sell, transfer, lease or dispose of substantially all of our assets; |
| | ● | amend our articles of incorporation or bylaws; |
| | ● | engage in transactions with affiliates; and |
| | ● | purchase, sell or transfer certain assets. |
Any of these restrictions and limitations could make it more difficult for us to execute our business strategy.
The Existing Indentures and our Senior Credit Agreement require us to comply with certain financial ratios or other covenants; our failure to do so would result in a default thereunder, which would have a material adverse effect on us.
We are required to comply with certain financial or other covenants under the Existing Indentures and our Senior Credit Agreement. Our ability to comply with these requirements may be affected by events affecting our business, but beyond our control, including prevailing general economic, financial and industry conditions. These covenants could have an adverse effect on us by limiting our ability to take advantage of financing, investment, acquisition or other corporate opportunities. The breach of any of these covenants or restrictions could result in a default under the Existing Indentures or our Senior Credit Agreement.
Upon a default under any of our debt agreements, the lenders or debtholders thereunder could have the right to declare all amounts outstanding, together with accrued and unpaid interest, to be immediately due and payable, which could, in turn, trigger defaults under other debt obligations and could result in the termination of commitments of the lenders to make further extensions of credit under our Senior Credit Agreement. If we were unable to repay our secured debt to our lenders, or were otherwise in default under any provision governing our outstanding secured debt obligations, our secured lenders could proceed against us and our subsidiary guarantors and against the collateral securing that debt. Any default resulting in an acceleration of outstanding indebtedness, a termination of commitments under our financing arrangements or lenders proceeding against the collateral securing such indebtedness would likely result in a material adverse effect on our business, financial condition and results of operations.
Our variable rate indebtedness subjects us to interest rate risk, which could cause our annual debt service obligations to increase significantly.
Borrowings under our Senior Credit Agreement are at variable rates of interest and expose us to interest rate risk. If the rates on which our borrowings are based were to increase from current levels, our debt service obligations on our variable rate indebtedness would increase even though the amount borrowed remained the same, and our net income and cash available to service our other obligations would decrease.
To partially mitigate this risk, we have entered into interest rate caps pursuant to an International Swaps and Derivatives Association ("ISDA") Master Agreement with two counterparties in an aggregate notional amount of $1.9 billion. The interest rate caps protect us against adverse fluctuations in interest rates by reducing our exposure to variability in cash flows on a portion of our variable-rate debt. The interest rate caps effectively limit the annual interest charged on our Senior Credit Agreement’s current term loans to a maximum of 1-month Term SOFR of 4.96% and 5.047%. We are required to pay aggregate fees in connection with the interest rate caps of approximately $34 million that is due and payable at maturity on December 31, 2025. We received $6 million and $4 million of cash payments from the counterparties 2024 and 2023, respectively, that we reclassify to reduce interest expense in our consolidated statement of operations.
Other Financial Risks
We recently have incurred impairment charges on our goodwill, other intangible assets and investments. In prior periods we have incurred impairment charges on our broadcast licenses. Any such future charges may have a material effect on the value of our total assets.
As of December 31, 2024, the book value of our broadcast licenses was $5.3 billion and the book value of our goodwill was $2.6 billion, in comparison to total assets of $10.5 billion.
During 2023, as a result of the bankruptcy of Diamond Sports Group, LLC (“Diamond”), our production companies segment recorded a non-cash charge of $43 million, for impairment of goodwill and other intangible assets. In January 2025, we received a cash payment of $4 million in settlement of our claim in the Diamond plan of reorganization that was confirmed on November 14, 2024.
Also, during the years ended December 31, 2024 and 2023, we have recognized impairment charges of $25 million and $29 million, respectively, related to investments. These impairment charges were recorded upon our determination that the fair value of the investments had declined on an other-than-temporary basis or that the recorded value was not recoverable.
Not less than annually, and more frequently if necessary, we are required to evaluate our goodwill and broadcast licenses to determine if the estimated fair value of these intangible assets is less than book value. If the estimated fair value of these intangible assets is less than book value, we will be required to record a non-cash expense to write down the book value of the intangible asset to the estimated fair value. We cannot make any assurances that any required impairment charges will not have a material adverse effect on our total assets.
We are a holding company with no material independent assets or operations and we depend on our subsidiaries for cash.
We are a holding company with no material independent assets or operations, other than our investments in our subsidiaries. Because we are a holding company, we are dependent upon the payment of dividends, distributions, loans or advances to us by our subsidiaries to fund our obligations. These payments could be or become subject to dividend or other restrictions under applicable laws in the jurisdictions in which our subsidiaries operate. Payments by our subsidiaries are also contingent upon the subsidiaries’ earnings. If we are unable to obtain sufficient funds from our subsidiaries to fund our obligations, our financial condition and ability to meet our obligations may be materially adversely affected.
Our defined benefit pension plan obligations are currently funded, however, if certain factors worsen, we may have to make significant cash payments, which could reduce the cash available for our business.
We have funded obligations under our defined benefit pension plans. Notwithstanding that the Gray Pension Plan is frozen with regard to any future benefit accruals, the funded status of our pension plans is dependent upon many factors, including returns on invested assets, the level of certain market interest rates and the discount rate used to determine pension obligations. Unfavorable returns on the plan’s assets or unfavorable changes in applicable laws or regulations may materially change the timing and amount of required plan funding, which could reduce the cash available for our business. In addition, any future decreases in the discount rate used to determine pension obligations could result in an increase in the valuation of pension obligations, which could affect the reported funding status of our pension plans and future contributions.
Risks Related to the Ownership of Our Equity Securities
The price and trading volume of our equity securities may be volatile.
The price and trading volume of our equity securities may be volatile and subject to fluctuations. Some of the factors that could cause fluctuation in the stock price or trading volume of our equity securities include:
| | ● | general market and economic conditions and market trends, including in the television broadcast industry and the financial markets generally, including levels of key interest rates; |
| | ● | the political, economic and social situation in the United States; |
| | ● | actual or anticipated variations in operating results, including audience share ratings and financial results; |
| | ● | inability to meet projections in revenue; |
| | ● | announcements by us or our competitors of significant acquisitions, strategic partnerships, joint ventures, capital commitments or other business developments; |
| | ● | technological innovations in the television broadcast industry; |
| | ● | adoption of new accounting standards affecting our industry; |
| | ● | operations of competitors and the performance of competitors’ common stock; |
| | ● | litigation or governmental action involving or affecting us or our subsidiaries; |
| | ● | changes in financial estimates and recommendations by securities analysts; |
| | ● | recruitment or departure of key personnel; |
| | ● | purchases or sales of blocks of our common stock; and |
| | ● | operating and stock performance of the companies that investors may consider to be comparable. |
There can be no assurance that the price of our equity securities will not fluctuate or decline significantly. The stock market in recent years has experienced considerable price and volume fluctuations that have often been unrelated or disproportionate to the operating performance of individual companies and that could adversely affect the price of our equity securities, regardless of our operating performance. Stock price volatility might be worse if the trading volume of shares of our equity securities is low. Furthermore, stockholders may initiate securities class action lawsuits if the market price of our equity securities were to decline significantly, which may cause us to incur substantial costs and could divert the time and attention of our management.
We currently pay cash dividends on our common stock and Class A common stock but this is subject to approval by our Board each quarter. To the extent a potential investor ascribes value to a dividend paying stock, the value of our stock may be correspondingly affected.
Our Board of Directors reinstated a cash or stock dividend on both classes of our common stock beginning in the first quarter of 2021. The timing and amount of any future dividend is at the discretion of our Board of Directors, and they may be subject to limitations or restrictions in our Senior Credit Agreement and other financing agreements, including our Series A Perpetual Preferred Stock, we may be, or become, party to. We can provide no assurance when or if any future dividends will be declared on our common stock or Class A common stock. As a result, if and to the extent an investor ascribes value to a dividend paying stock, the value of our common stock or Class A common stock may be correspondingly affected.
Anti-takeover provisions contained in our Restated Articles of Incorporation (“Articles”) and our Bylaws, as amended (“Bylaws”), as well as provisions of Georgia law, could impair a takeover attempt.
Our Articles and Bylaws may have the effect of delaying, deferring or discouraging a prospective acquirer from making a tender offer for our shares of common stock or otherwise attempting to obtain control of us. To the extent that these provisions discourage takeover attempts, they could deprive stockholders of opportunities to realize takeover premiums for their shares. Moreover, these provisions could discourage accumulations of large blocks of common stock, thus depriving stockholders of any advantages which large accumulations of stock might provide.
As a Georgia corporation, we are also subject to provisions of Georgia law, including Section 14-2-1132 of the Georgia Business Corporation Code. Section 14-2-1132 prevents some stockholders holding more than 10% of our outstanding common stock from engaging in certain business combinations unless the business combination was approved in advance by our Board of Directors or results in the stockholder holding more than 90% of our outstanding common stock.
Any provision of our Articles, our Bylaws or Georgia law that has the effect of delaying or deterring a change in control could limit the opportunity for our stockholders to receive a premium for their shares of our common stock and could also affect the price that some investors are willing to pay for our common stock.
We have the ability to issue additional preferred stock, which could affect the rights of holders of our common stock and Class A common stock.
Including the shares of preferred stock issued in the acquisition of Raycom Media, Inc. (the “Raycom Merger”), our Articles allow our Board of Directors to issue up to 20 million shares of preferred stock and set forth the terms of such preferred stock. The terms of any such preferred stock, if issued, may materially adversely affect the dividend and liquidation rights of holders of our common stock.
Holders of our Class A common stock have the right to 10 votes per share on all matters to be voted on by our stockholders and, consequently, the ability to exert significant influence over us.
As a result of the 10 to 1 voting rights of holders of our Class A common stock, these stockholders are expected to be able to exert significant influence over all matters requiring stockholder approval, including mergers and other material transactions, and may be able to cause or prevent a change in the composition of our Board of Directors or a change in control of our Company that could deprive our stockholders of an opportunity to receive a premium for their common stock as part of a sale of the Company and might ultimately affect the market price of our common stock.
Certain stockholders or groups of stockholders have the ability to exert significant influence over us.
Hilton H. Howell, Jr., our Executive Chairman and Chief Executive Officer, is the husband of Robin R. Howell, a member of our Board of Directors (collectively with other members of their family, the “Howell-Robinson Family”). As a result of their significant stockholdings and positions on the Board of Directors, the Howell-Robinson Family is able to exert significant influence over our policies and management, potentially in a manner which may not be consistent with the interests of our other stockholders.
Risks Related to Regulatory Matters
Federal broadcasting industry regulations limit our operating flexibility.
The FCC regulates all television broadcasters, including us. We must obtain FCC approval whenever we (i) apply for a new license; (ii) seek to renew, modify or assign a license; (iii) purchase a broadcast station; and/or (iv) transfer the control of one of our subsidiaries that holds a license. Our FCC licenses are critical to our operations, and we cannot operate without them. We cannot be certain that the FCC will renew these licenses in the future or approve new acquisitions, mergers, divestitures or other business activities. Our failure to renew any licenses upon the expiration of any license term could have a material adverse effect on our business.
Federal legislation and FCC rules have changed significantly in recent years and may continue to change. These changes may limit our ability to conduct our business in ways that we believe would be advantageous and may affect our operating results.
The FCC can sanction us for programming broadcast on our stations that it finds to be indecent.
The FCC has pursued several enforcement matters regarding broadcast indecency and profanity and the statutory maximum fine for broadcasting indecent material is approximately $0.5 million per incident, up to a maximum of approximately $4.7 million for a continuing violation. In June 2012, the Supreme Court decided a challenge to the FCC’s indecency enforcement policies without resolving the scope of the FCC’s ability to regulate broadcast content. In August 2013, the FCC issued a Public Notice seeking comment on whether it should modify its indecency policies. The FCC has not yet issued a decision in this proceeding and the courts remain free to review the FCC’s current policy or any modifications thereto. The outcomes of these proceedings could affect future FCC policies in this area, and we are unable to predict the outcome of any such judicial proceeding, which could have a material adverse effect on our business.
The FCC’s duopoly restrictions limit our ability to own and operate multiple television stations in the same market.
The FCC’s ownership rules generally prohibit us from acquiring an “attributable interest” in two television stations that are located in the same market unless at least one of the stations is not ranked among the top-four stations in the market (the “top-four” prohibition).
In December 2023, the FCC adopted two modifications to the top-four prohibition that make it more restrictive. These rule changes took effect in March 2024. First, the FCC extended the top-four prohibition to low power television (“LPTV”) stations and multicast streams. As a result of this change, a licensee will be prohibited from acquiring network-affiliated programming of another top-four station in a DMA and then placing that programming on either the multicast stream of a full-power station or a LPTV station in a DMA in which it already owns another top-four rated station. These additional restrictions will apply to transactions entered into after December 26, 2023. Existing combinations will be grandfathered, but may not be transferred or assigned except in compliance with the new rule, or a waiver of the new rule. Second, the FCC modified its methodology for determining a station’s audience share for purposes of the top-four prohibition (and failing station waiver requests) to (i) consider audience share data over a 12-month period immediately preceding the date the application is filed, (ii) expanding the relevant daypart for audience share data significantly, and (iii) requiring the inclusion of audience share data for all free-to-consumer, non-simulcast multicast streams.
In November 2022, the FCC issued a Forfeiture Order finding that Gray’s acquisition of CBS programming from another broadcaster in the Anchorage market for Gray’s station KYES-TV was inconsistent with the local television ownership rule’s “top-four” prohibition given Gray’s ownership of KTUU-TV in the same market (a top-four ranked station) and imposed a fine of $0.5 million. Gray has brought a judicial challenge to the FCC’s Order, which remains pending.
The FCC also considers television Local Marketing Agreements (“LMAs”) (which are agreements under which a television station sells or provides more than 15% of the programming on another same-market television station) as “attributable interests.” Pursuant to the FCC’s ownership rules currently in effect, our ability to expand in our present markets through additional station acquisitions or LMAs may be constrained.
The FCC’s National Television Station Ownership Rule limits the maximum number of households we can reach.
Under the FCC’s National Television Station Ownership Rule, a single television station owner may not reach more than 39% of United States households through commonly owned television stations, subject to a 50% discount of the number of television households attributable to UHF stations (the “UHF Discount”). In December 2017, the FCC issued an NPRM seeking comment on whether it should modify or eliminate the national cap, including the UHF Discount. This proceeding remains pending. This rule may constrain our ability to expand through additional station acquisitions. Currently our station portfolio reaches approximately 37% of total United States television households.
The Company is subject to governmental oversight regarding compliance with antitrust law as well as related civil litigation.
Various governmental agencies, including the DOJ, have authority to enforce the antitrust laws of the United States in the broadcast television industry. The DOJ has increased its enforcement activities within the industry. For example, in the fourth quarter of 2018, the DOJ filed a lawsuit in the United States District Court for the District of Columbia against six broadcasters, including Raycom and Meredith, alleging an agreement to exchange certain competitively sensitive information relating to advertising sales among certain stations in some local markets. The broadcasters and the DOJ entered into substantially identical consent decrees, which, among other things, prohibits the defendant broadcasters from exchanging competitively sensitive information and impose certain compliance requirements. No party to the settlement agreement, including Raycom and Meredith, admitted to any wrongdoing. In addition, following the public disclosure of the DOJ’s investigation and settlement, various putative class action lawsuits were filed against a number of owners of television stations. The cases have been consolidated in a single multidistrict litigation in the District Court for the Northern District of Illinois and the plaintiffs’ operative complaint alleges price fixing and unlawful information exchange among the defendants’ advertisement sales teams. We are unable to predict the outcome of these proceedings. For more information on these proceedings, see “Item 3. Legal Proceedings.”
Item 1B. UNRESOLVED STAFF COMMENTS
None.
Item 1C. CYBERSECURITY
Risk Management and Strategy
We strive to implement leading data protection standards to ensure a strong commitment to cybersecurity. Our Data Security Policy and Cybersecurity Incident Response Plan (“CIRP”), which is part of our enterprise wide risk management processes, guides our cybersecurity program. The CIRP, developed in consultation with an independent cybersecurity expert, includes processes for identifying, managing, and remediating cybersecurity incidents. We utilized the National Institute of Standards and Technology (“NIST”) and the Center for Internet Security (“CIS”) guidelines to develop and implement the CIRP, which is approved by our Chief Technology Officer (“CTO”). However, this should not be interpreted to mean that we meet any particular technical standards, specifications, or requirements, only that we used the NIST and CIS as a guide to help create develop and implement the CIRP. The CIRP is reviewed and updated annually. The Company’s cybersecurity risk management processes include ongoing monitoring and testing of its information systems and data to identify and respond to potential cybersecurity threats. Internally, the Company utilizes an enterprise Attack Surface Management tool to routinely scan for vulnerabilities to internal assets. Externally, we use third-party vendors to routinely conduct scans for vulnerabilities to external assets. In addition, our internal auditors along with management also conduct periodic monitoring of our internal controls over our data security and customer privacy systems and processes.
For many vendors for the Company, we request copies of standard security reports or assessments, such as System and Organization Controls (“SOC”) reports, to support our assessment of our vendors’ security practices. In collaboration with the National Association of Broadcasters, North American Broadcasters Association, and risk management vendors, we are also working to assemble broadcaster-specific guidelines for information technology vendor selection.
The Company provides security awareness training for all employees on a regular basis. The training is designed to educate and prepare employees to recognize unsafe practices and to properly respond to phishing attacks from email, social media, and other sources. Follow-up testing using simulated attack tools is used to validate the effectiveness of training and compliance.
Although we have systems and processes in place to protect against risks associated with cybersecurity incidents in the future, depending on the nature of an incident, these protections may not be fully sufficient. To date, no risks from cybersecurity threats, including as a result of any previous cybersecurity incidents, have materially affected or have been determined to be reasonably likely to materially affect the Company or our business strategy, results of operations, or financial condition. For additional information regarding the risks from cybersecurity threats and incidents we face, see the section captioned “Operating Risks – Disruptions or security breaches of our information technology infrastructure could interfere with our operations, compromise client information and expose us to liability, possibly causing our business and reputation to suffer” within Part I, Item 1A. “Risk Factors”.
Governance
Management is responsible for the Company’s day-to-day risk management and the Board serves in an oversight role. The Board has empowered the Audit Committee with formal oversight of enterprise risk matters, including with respect to cybersecurity. The Audit Committee and management periodically review the Company’s policies with respect to risk identification, assessment, and management, including cybersecurity risk exposures and the internal controls and procedures in place to manage such risks, as well as the steps that management takes to monitor and control such exposures. In addition, the Audit Committee and the Board consider risk-related matters on an ongoing basis in connection with deliberations regarding specific transactions and issues.
The Cybersecurity Incident Response Team (“CIRT”), which is led by the CTO, is responsible for the prevention, detection, mitigation, and remediation of cybersecurity incidents and conducts primary incident response efforts. Our CTO, who is responsible for assessing and managing the Company’s cybersecurity risks, has over 30 years of industry experience, including serving in similar roles leading and overseeing cybersecurity programs at Raycom Media prior to the Raycom Merger. Other team members of the CIRT also have relevant educational and industry experience, including holding similar positions at large companies. Incidents can be escalated up to our executive leadership team, depending on the severity of the incidents. Our President and/or CTO regularly report to our Board, and our CISO and General Counsel regularly report to our Audit Committee about our cybersecurity health and initiatives. In addition, the Board receives quarterly reports on risk management activities across Gray operations, including with respect to cybersecurity.
Item 2. PROPERTIES
We lease our principal executive offices in a building located at 4370 Peachtree Road, NE, Atlanta, Georgia, 30319. We also own or lease various other offices and technical facilities that support our operations. See “Stations”, in Item 1. Business. of this Form 10-K.
The types of properties required to support television stations include offices, studios, transmitter sites and antenna sites. A station’s studios are generally housed within its offices in each respective market. The transmitter sites and antenna sites are generally located in elevated areas to provide optimal signal strength and coverage. We own or lease land, offices, studios, transmitters and antennas in each of our markets necessary to support our operations in that market area. In some market areas, we also own or lease multiple properties, such as towers and/or signal repeaters (translators), to optimize our broadcast capabilities. To the extent that our properties are leased, and those leases contain expiration dates, we believe that those leases can be renewed, or that alternative facilities can be leased or acquired, on terms that are comparable, in all material respects, to our existing properties.
We also own Assembly Atlanta, which is a 135-acre real estate complex centered around the studio industry located in the City of Doraville, Georgia. The Assembly Atlanta development includes the 43-acre Assembly Studios complex. The studio operations are managed under an operating agreement with NBCUniversal Media, LLC (“NBCU”) through which NBCU will lease and operate the state-of-the-art studio facilities as well as manage our retained studio facilities at Assembly Studios and the adjacent Third Rail Studios.
We believe our owned and leased properties are in good condition and suitable for the conduct of our present business.
Item 3. LEGAL PROCEEDINGS
From time to time, we are subject to legal proceedings and claims in the ordinary course of business. We do not believe that any known legal proceedings or claims are likely to have a material adverse effect on our business, financial condition, results of operations or cash flows. See Note 12 “Commitments and Contingencies” of our audited consolidated financial statements included elsewhere herein for a further discussion of our legal proceedings and incorporated herein by reference.
Item 4. MINE SAFETY DISCLOSURES
Not applicable.
INFORMATION ABOUT OUR EXECUTIVE OFFICERS
Set forth below is certain information with respect to our executive officers as of February 21, 2025:
Hilton H. Howell, Jr., age 62, has served as our Executive Chairman and Chief Executive Officer since January 2, 2019. Prior to that, Mr. Howell served as our Chairman, Chief Executive Officer, and President from June 2013 to December 2018. Mr. Howell is a member of the Executive Committee of the Board, has been a Director since 1993, and served as the Vice Chairman of the Board from 2002 to April 2016 when he was appointed as Chairman. He served as our Executive Vice President from September 2002 to August 2008. In addition, he serves as President and Chief Executive Officer of Atlantic American Corporation, an insurance holding company, and as Chairman of that company since February 2009. He was Executive Vice President of Delta Life Insurance Company and Delta Fire & Casualty Insurance Company from 1991-2013 and has since served as Chief Executive Officer. Mr. Howell has served as General Counsel of Delta Life and Delta Fire since 1991. Mr. Howell also serves as a Director of Atlantic American Corporation and of each of its subsidiaries, American Southern Insurance Company, American Safety Insurance Company and Bankers Fidelity Life Insurance Company, as well as a Director of Delta Life Insurance Company and Delta Fire & Casualty Insurance Company. He is the husband of Mrs. Robin R. Howell, who is a member of our Board of Directors. Previously, Mr. Howell served as a board member of the National Association of Broadcasters and the NBC Affiliate Board.
Donald P. LaPlatney, age 65 has served as our President and Co-Chief Executive Officer since January 2, 2019. Prior to that, from July 2016 until the closing of the Raycom Merger, he served as Chief Executive Officer and President of Raycom Media, and served as member on their Board of Directors. Before that, he served as Chief Operating Officer of Raycom from April 2014 to July 2016, as Senior Vice President, Digital Media from April 2012 until April 2014, and as Vice President, Digital Media from August 2007 to April 2012. Prior to joining Raycom in 2007, Mr. LaPlatney held various executive positions at The Tube Media Corp., Westwood One, and Raycom Sports. In addition, Mr. LaPlatney serves as Chairman of the Television Board of the National Association of Broadcasters. Previously, Mr. LaPlatney served as Chairman of the NBC Affiliate Board.
Jeffrey R. Gignac, age 49, has served as our Executive Vice President since April 2024 and as our Chief Financial Officer since July 2024. Previously, he served as Managing Director and Head of Media & Telecom Investment Banking at Wells Fargo Securities. Prior to that he spent 18 years in leveraged finance, focused on the telecom, media and technology industries. Prior to Wells Fargo, Jeff worked at Ernst & Young and Arthur Andersen. He holds a BA in Accounting from Michigan State University and is a licensed CPA in the State of Georgia.
Kevin P. Latek, age 54, has served as our Executive Vice President and Chief Legal and Development Officer since February 2016. Prior to that, he served as our Senior Vice President, Business Affairs since July 2013 and as our Vice President for Law and Development from March 2012 to June 2013. Prior to joining Gray, Mr. Latek practiced law in Washington, DC representing television and radio broadcasters and financial institutions in FCC regulatory and transactional matters. He is a member and officer of the CBS Affiliate Board and a past member of the FOX Affiliate Board of Governors.
Sandra Breland, age 62, has served as our Chief Operating Officer since May 2023. In early 2019, Ms. Breland joined Gray as a Senior Vice President of Local Media upon Gray’s acquisition of Raycom Media, where she served as a Group Vice President. Ms. Breland has over 30 years of experience in local broadcasting. She serves on the Board of Directors for the Carole Kneeland Project. Ms. Breland is past president of the Fox Affiliate Board of Governors and past chairman for the Louisiana Association of Broadcasters.
PART II
Item 5. MARKET FOR REGISTRANT’S COMMON EQUITY, RELATED STOCKHOLDER MATTERS AND ISSUER PURCHASES OF EQUITY SECURITIES
Our common stock, no par value, and our Class A common stock, no par value, have been listed and traded on the NYSE since September 24, 1996 and June 30, 1995, respectively, under the symbols “GTN” and “GTN.A,” respectively.
As of February 21, 2025, we had 91,812,952 outstanding shares of common stock held by 16,451 stockholders and 9,730,058 outstanding shares of Class A common stock held by 665 stockholders. The number of stockholders consists of stockholders of record and individual participants in security position listings as furnished to us pursuant to Rule 17Ad-8 under the Securities Exchange Act of 1934 (the “Exchange Act”).
For matters submitted to a shareholder vote, our Articles provide that each share of common stock is entitled to one vote, and each share of Class A common stock is entitled to 10 votes. Our Articles require that our common stock and our Class A common stock receive dividends on a pari passu basis when declared.
During 2024, we have paid quarterly cash dividends totaling $0.32 per share on both classes of our common stock. While we have paid dividends to holders of our common stock on a quarterly basis since the beginning of 2021, any future payments of dividends will depend on our financial condition, results of operations, cash flows and such other factors as our Board of Directors deems relevant. In addition, the Senior Credit Agreement and our Indentures each contain covenants that could restrict our ability to pay cash dividends on our capital stock, which are currently applicable. See Note 4 “Long-term Debt” of our audited consolidated financial statements included elsewhere herein for a further discussion of restrictions on our ability to pay dividends.
During 2024, we paid quarterly cash dividends on our outstanding 650,000 shares of Series A Perpetual Preferred Stock (the “Preferred Stock”). Shares of the Preferred Stock accrue dividends on the face value of $650 million in (A) cash at a rate of 8% per annum or, (B) at the Company’s option, in-kind at a rate of 8.5% per annum, as declared by our Board of Directors.
Stock Performance Graph
The following graphs compare the cumulative total return of our common stock and Class A common stock from January 1, 2020 to December 31, 2024, as compared to the stock market total return indexes for (i) The New York Stock Exchange Composite Index (the “NYSE Composite Index”) and (ii) The New York Stock Exchange Television Broadcasting Stations Index (the “TV Broadcasting Stations Index”).
The graphs assume the investment of $100 in each of our common stock and the Class A common stock, respectively, the NYSE Composite Index and the TV Broadcasting Stations Index on January 1, 2020. Any dividends are assumed to have been reinvested as paid.
| | | As of | |
| | | 1/1/2020 | | | 12/31/2020 | | | 12/31/2021 | | | 12/31/2022 | | | 12/31/2023 | | | 12/31/2024 | |
Gray Media, Inc. common stock | | $ | 100 | | | $ | 83 | | | $ | 95 | | | $ | 54 | | | $ | 45 | | | $ | 17 | |
NYSE Composite Index | | $ | 100 | | | $ | 107 | | | $ | 129 | | | $ | 117 | | | $ | 133 | | | $ | 154 | |
TV Broadcasting Stations Index | | $ | 100 | | | $ | 90 | | | $ | 95 | | | $ | 74 | | | $ | 67 | | | $ | 74 | |
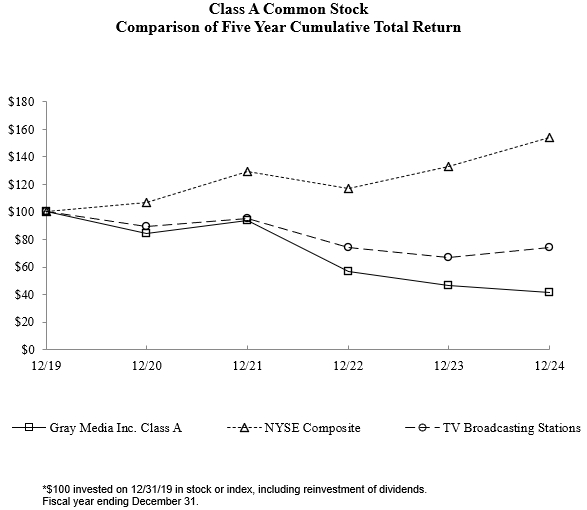
| | | As of | |
| | | 1/1/2020 | | | 12/31/2020 | | | 12/31/2021 | | | 12/31/2022 | | | 12/31/2023 | | | 12/31/2024 | |
Gray Media, Inc. Class A common stock | | $ | 100 | | | $ | 84 | | | $ | 94 | | | $ | 57 | | | $ | 46 | | | $ | 41 | |
NYSE Composite Index | | $ | 100 | | | $ | 107 | | | $ | 129 | | | $ | 117 | | | $ | 133 | | | $ | 154 | |
TV Broadcasting Stations Index | | $ | 100 | | | $ | 90 | | | $ | 95 | | | $ | 74 | | | $ | 67 | | | $ | 74 | |
Item 7. MANAGEMENT’S DISCUSSION AND ANALYSIS OF FINANCIAL CONDITION AND RESULTS OF OPERATIONS
Executive Overview
Introduction. The following discussion and analysis of the financial condition and results of operations of Gray Media, Inc. and its consolidated subsidiaries (except as the context otherwise provides, “Gray,” the “Company,” “we,” “us” or “our”) should be read in conjunction with our audited consolidated financial statements and notes thereto included elsewhere herein.
This section of our Annual Report discusses 2024 and 2023 items and year-over-year comparisons between 2024 and 2023. A detailed discussion of 2022 items and year-over-year comparisons between 2023 and 2022 that are not included in this Annual Report can be found in “Management’s Discussion and Analysis of Financial Condition and Results of Operations” in Part II, Item 7. of our Annual Report for the year ended December 31, 2023.
Business Overview. We are a multimedia company headquartered in Atlanta, Georgia. We are the nation’s largest owner of top-rated local television stations and digital assets serving 113 television markets that collectively reach approximately 37 percent of US television households. The portfolio includes 78 markets with the top-rated television station and 99 markets with the first and/or second highest rated television station, as well as the largest Telemundo Affiliate group with 44 markets totaling over 1.5 million Hispanic TV Households. We also own Gray Digital Media, a full-service digital agency offering national and local clients digital marketing strategies with the most advanced digital products and services. Our additional media properties include video production companies Raycom Sports, Tupelo Media Group, and PowerNation Studios, and studio production facilities Assembly Atlanta and Third Rail Studios.
Our operating revenues are derived primarily from broadcast and digital advertising, retransmission consent fees and, to a lesser extent, other sources such as production of television and event programming, television commercials, tower rentals and management fees. For the years ended December 31, 2024, 2023 and 2022, we generated revenue of $3.6 billion, $3.3 billion and $3.7 billion, respectively.
Revenues, Operations, Cyclicality and Seasonality. Broadcast advertising is sold for placement generally preceding or following a television station’s network programming and within local and syndicated programming. Broadcast advertising is sold in time increments and is priced primarily on the basis of a program’s popularity among the specific audience an advertiser desires to reach. In addition, broadcast advertising rates are affected by the number of advertisers competing for the available time, the size and demographic makeup of the market served by the station and the availability of alternative advertising media in the market area. Broadcast advertising rates are generally the highest during the most desirable viewing hours, with corresponding reductions during other hours. The ratings of a local station affiliated with a major network can be affected by ratings of network programming. Most advertising contracts are short-term, and generally run only for a few weeks.
We also sell digital advertising on our stations’ websites and mobile apps. These advertisements may be sold as banner advertisements, video advertisements and other types of advertisements or sponsorships.
Our broadcast and digital advertising revenues are affected by several factors that we consider to be seasonal in nature. These factors include:
● | Spending by political candidates, political parties and special interest groups increases during the even-numbered “on-year” of the two-year election cycle. This political spending typically is heaviest during the fourth quarter of such years; |
● | Broadcast advertising revenue is generally highest in the second and fourth quarters each year. This seasonality results partly from increases in advertising in the spring and in the period leading up to and including the holiday season; |
● | Core advertising revenue on our NBC-affiliated stations increases in certain years as a result of broadcasts of the Olympic Games; and |
● | Because our stations and markets are not evenly divided among the Big Four broadcast networks, our local and national advertising revenue can fluctuate between years related to which network broadcasts the Super Bowl. |
We derived a material portion of our non-political broadcast advertising revenue from advertisers in a limited number of industries, particularly the services sector, comprising financial, legal and medical advertisers, and the automotive industry. The services sector has become an increasingly important source of advertising revenue over the past few years. During the years ended December 31, 2024, 2023 and 2022 approximately 23%, 27% and 28%, respectively, of our broadcast advertising revenue (excluding political advertising revenue) was obtained from advertising sales to the services sector. During the years ended December 31, 2024, 2023 and 2022 approximately 20%, 20% and 17%, respectively, of our broadcast advertising revenue (excluding political advertising revenue) was obtained from advertising sales to automotive customers. Revenue from these industries may represent a lower percentage of total revenue in even-numbered years due to, among other things, the decreased availability of advertising time, as a result of such years being the “on-year” of the two-year election cycle.
Our primary broadcasting operating expenses are employee compensation, related benefits and programming costs. In addition, the broadcasting operations incur overhead expenses, such as maintenance, supplies, insurance, rent and utilities. A large portion of the operating expenses of our broadcasting operations is fixed. We continue to monitor our operating expenses and seek opportunities to reduce them where possible.
Please see our “Results of Operations” and “Liquidity and Capital Resources” sections below for further discussion of our operating results.
2024 Refinancing and Debt Reduction Activities. During 2024 we completed several steps to enhance our liquidity, to extend the maturity of portions of our debt obligations that were scheduled to mature in the near future and to reduce the principal amount of our debt outstanding. Please refer to Note 4. “Long-Term Debt” for further information. During 2024, we:
● | Increased lender commitments under our Revolving Credit Facility to $680 million and extended the maturity date of all commitments thereunder to December 31, 2027; |
● | Issued a $500 million 2024 Term Loan that will mature on June 4, 2029 ($498 million outstanding at December 31, 2024); |
● | Issued $1.25 billion of 2029 Notes, that are secured pari passu with our Senior Credit Agreement and that will mature on July 15, 2029; |
● | Fully repaid the $1.15 billion 2019 Term Loan that was scheduled to mature on January 2, 2026; and |
● | Pre-paid through a tender offer, $690 million of the $700 million in outstanding 2026 Notes that were scheduled to mature on July 15, 2026. |
In addition, in the year ended December 31, 2024 we used $327 million of cash to repurchase and retire an aggregate principal amount of $373 million of our outstanding 2019 Term Loan, 2027 Notes, 2030 Notes and 2031 Notes on the open market. Currently, our Board of Directors has authorized us to make additional open market repurchases of our indebtedness of $250 million.
Together with other payments at par, collectively, these actions resulted in a $520 million reduction in the principal amount of our outstanding indebtedness at December 31, 2024, as compared to December 31, 2023.
Risk Factors. The broadcast television industry relies primarily on advertising revenue and faces significant competition. For a discussion of certain other presently known, significant risk factors that may affect our business, see “Item 1A. Risk Factors” included elsewhere herein.
Revenue
Set forth below are the principal types of revenue, less agency commissions, and the percentage contribution of each to our total revenue (dollars in millions):
| | | Year Ended December 31, | |
| | | 2024 | | | 2023 | | | 2022 | |
| | | Amount | | | % | | | Amount | | | % | | | Amount | | | % | |
Revenue: | | | | | | | | | | | | | | | | | | | | | | | | |
Core advertising | | $ | 1,490 | | | | 41 | % | | $ | 1,514 | | | | 46 | % | | $ | 1,496 | | | | 41 | % |
Political | | | 497 | | | | 14 | % | | | 79 | | | | 2 | % | | | 515 | | | | 14 | % |
Retransmission consent | | | 1,482 | | | | 41 | % | | | 1,532 | | | | 47 | % | | | 1,496 | | | | 41 | % |
Production companies | | | 105 | | | | 3 | % | | | 86 | | | | 3 | % | | | 93 | | | | 3 | % |
Other | | | 70 | | | | 1 | % | | | 70 | | | | 2 | % | | | 76 | | | | 1 | % |
Total | | $ | 3,644 | | | | 100 | % | | $ | 3,281 | | | | 100 | % | | $ | 3,676 | | | | 100 | % |
Results of Operations
Year Ended December 31, 2024 (“2024”) Compared to Year Ended December 31, 2023 (“2023”)
Revenue. Total revenue increased $363 million, or 11%, to $3.6 billion for 2024 compared to 2023.
During 2024:
| | ● | Core advertising revenue decreased by $24 million, due primarily to displacement during the on-year of the two-year political advertising cycle, partially offset by advertising revenue of $18 million from the broadcast of the Super Bowl on our 54 CBS channels, compared to $6 million of revenue relating to the broadcast of the Super Bowl on our 27 FOX channels during 2023, and $20 million of advertising revenue on our 53 NBC channels from the broadcast of the 2024 Olympic Games; |
| | ● | Consistent with 2024 being the on-year of the two-year political advertising cycle, political advertising revenue increased by $418 million; |
| | ● | Retransmission consent revenue decreased by $50 million due to a decrease in subscribers, offset, in part, by an increase in rates; and |
| | ● | Production company revenue increased by $19 million in 2024 primarily due to the start-up of our operations at Assembly Atlanta. |
Broadcasting Expenses. Broadcasting expenses (before depreciation, amortization, impairment and gain on disposal of assets) increased $49 million, or 2%, to $2.3 billion for 2024, compared to 2023.
During 2024:
| | ● | Broadcasting payroll and employee benefit expenses increased by $27 million primarily as a result of routine increases in compensation of $32 million, increases of $2 million severance pay and offset in part by decreases of $8 million in contributions to our defined contribution retirement plan; |
| | ● | Broadcasting non-payroll expenses increased by $21 million primarily due to increases in sports programming costs; and |
| | ● | Broadcast non-cash stock-based compensation expense was $5 million in each of the 2024 and 2023 years. |
Production Company Expenses. Production company expenses (before depreciation, amortization, impairment and gain or loss on disposal of assets) decreased by approximately $32 million in 2024 to $83 million, compared to $115 million in 2023. Production company operating expenses decreased in 2024 primarily due to significant expenses incurred in 2023, which did not re-occur in 2024.
Corporate and administrative expenses. Corporate and administrative expenses (before depreciation, amortization, impairment and gain or loss on disposal of assets) decreased by $8 million, or 7%, to $104 million in 2024 compared to $112 million in 2023, primarily as a result of decreases in professional services costs. We recorded corporate non-cash stock-based compensation expense of $17 million and $15 million in 2024 and 2023, respectively.
Depreciation. Depreciation of property and equipment totaled $144 million and $145 million for 2024 and 2023, respectively.
Amortization of intangible assets. Amortization of intangible assets totaled $125 million and $194 million for 2024 and 2023, respectively. Amortization decreased primarily due to finite-lived intangible assets becoming fully amortized.
Impairment of goodwill and other intangible assets. In 2024 we did not incur impairment charges, compared to $43 million of impairment charges incurred in 2023.
Loss on Disposals of Assets, Net. We recognized a loss on disposal of assets of $20 million in 2024 compared to a loss on disposal of assets of $21 million in 2023. The loss in 2024 was primarily related to the acquisition of a construction permit to build television station KCBU in exchange for the divestiture of television stations KCWY and KGWN in which we recognized a loss of $14 million. The loss in 2023 was primarily related to the sale of television station KNIN, in which we recognized a loss of $14 million in 2023.
Miscellaneous Income, Net. Miscellaneous income, net totaled $117 million and $7 million in 2024 and 2023, respectively. Miscellaneous income, net in 2024 was due primarily to a gain of $110 million from the sale of our investment in BMI.
Impairment of Investments. During 2024 and 2023, we wrote down the value of certain investments to their estimated net realizable values. The total impairment charges were $25 million and $29 million in 2024 and 2023, respectively.
Interest Expense. Interest expense increased $45 million, or 10%, to $485 million for 2024 compared to 2023. This increase was primarily attributable to several factors including: increases in average interest rates on all of our debt to 7.2% in 2024 compared to 6.5% in 2023, partially offset by a decrease in the outstanding principal balances of our debt, for a net increase of $22 million; a reduction in the amount of capitalized construction period of interest which increased interest expense by $19 million; an increase in deferred financing cost amortization, consistent with our 2024 refinancing activities, which increased interest expense by $2 million; and an increase in the amortization of costs related to our interest rate caps which increased interest expense by $2 million.
Gain (Loss) on Early Extinguishment of Debt. We recorded a gain on the early extinguishment of debt of $34 million in 2024, primarily as a result of our open-market repurchases of debt, partially offset by the write-off of deferred financing costs related to the open-market repurchases and expenses incurred related to our refinancing activities. We recorded a loss on the early extinguishment of debt of $3 million in 2023 related the write-off of deferred financing costs related to the partial repayment of a portion of our 2017 Term Loan.
Income Tax Expense. Our effective income tax rate increased to a net provision of 24% for 2024 from 7% for 2023. Our effective income tax rates differed from the statutory rate due to the following items:
| | | Year Ended December 31, | |
| | | 2024 | | | 2023 | |
Statutory federal income tax rate | | | 21 | % | | | 21 | % |
Current year permanent items | | | 1 | % | | | (13 | )% |
State and local taxes, net of federal tax benefit | | | 4 | % | | | 6 | % |
| Reserve for uncertain tax positions | | | (3 | )% | | | (1 | )% |
Other items, net | | | 1 | % | | | (6 | )% |
Effective income tax expense rate | | | 24 | % | | | 7 | % |
We file a consolidated federal income tax return and such state or local tax returns as are required based on our current forecasts. We estimate that these income tax payments, before deducting refunds, will be within a range of $80 million to $100 million in 2025.
Liquidity and Capital Resources
General. Our primary sources of liquidity are cash on hand, cash flows from operations and borrowing capacity under our Revolving Credit Facility.
We are a party to many contractual obligations involving commitments to make payments to third parties. These obligations impact our short-term and long-term liquidity and capital resource needs. Certain contractual obligations are reflected on the Consolidated Balance Sheet as of December 31, 2024, while others are considered future commitments. Our contractual obligations primarily consist of amounts required to be paid for: the acquisition of television stations; the purchase of property and equipment; service and other agreements; commitments for various syndicated television programs; and commitments under affiliation agreements with networks. In addition to our contractual obligations, we expect that our primary anticipated uses of liquidity in 2025 will be to reduce our indebtedness, fund our working capital, make interest and tax payments, fund capital expenditures, pursue certain strategic opportunities and maintain operations. For a description of the Company’s various contractual and other commitments requiring future payments, see Note 12 “Commitments and Contingencies” of our audited consolidated financial statements included elsewhere herein. In addition, for a description of the Company's interest payments and future maturities of long-term debt, see Note 4 “Long-term Debt” of our audited consolidated financial statements included elsewhere herein.
The following tables present data that we believe is helpful in evaluating our liquidity and capital resources (dollars in millions):
| | | Year Ended December 31, | |
| | | 2024 | | | 2023 | | | 2022 | |
Net cash provided by operating activities | | $ | 751 | | | $ | 648 | | | $ | 829 | |
Net cash used in investing activities | | | (28 | ) | | | (291 | ) | | | (503 | ) |
Net cash used in financing activities | | | (609 | ) | | | (397 | ) | | | (454 | ) |
Net increase (decrease) in cash | | $ | 114 | | | $ | (40 | ) | | $ | (128 | ) |
| | | December 31, | |
| | | 2024 | | | 2023 | |
Cash | | $ | 135 | | | $ | 21 | |
Long-term debt, including current portion, less deferred financing costs | | $ | 5,621 | | | $ | 6,160 | |
Series A Perpetual Preferred Stock | | $ | 650 | | | $ | 650 | |
Borrowing availability under Senior Credit Agreement | | $ | 674 | | | $ | 494 | |
Net Cash Provided By (Used In) Operating, Investing and Financing Activities – 2024 Compared to 2023
Net cash provided by operating activities increased $103 million to $751 million in 2024 compared to net cash provided by operating activities of $648 million in 2023. The increase in cash provided by operating activities was primarily due to an increase in net income of $451 million; offset, in part, by a $144 million decrease in cash provided by changes in working capital; and a decrease in net non-cash charges of $204 million.
Net cash used in investing activities decreased $263 million to $28 million for 2024 compared to $291 million for 2023. The net decrease in the amount used was primarily due to a decrease in cash used for purchases of property and equipment and an increase in proceeds received from the sale of investments and other assets.
Net cash used in financing activities increased $212 million to $609 million in 2024 compared to net cash used in financing activities of $397 million in 2023. During 2024 and 2023, we used $52 million of cash to pay dividends to holders of our preferred stock and $32 million and $30 million, respectively, to pay dividends to holders of our common stock. During 2024 and 2023, we used a net amount of $474 million and $310 million, respectively, for principal payments net of borrowings on our long-term debt.
Liquidity. Based on our debt outstanding as of December 31, 2024, we estimate that we will make approximately $450 million in debt interest payments over the twelve months immediately following December 31, 2024. Although our cash flows from operations are subject to a number of risks and uncertainties, we anticipate that our cash on hand, future cash expected to be generated from operations, borrowings from time to time under the Senior Credit Agreement (or any such other credit facility as may be in place at the appropriate time) and, potentially, external equity or debt financing, will be sufficient to fund any debt service obligations, estimated capital expenditures and acquisition-related obligations for the next twelve months and the forseeable future. Any potential equity or debt financing would depend upon, among other things, the costs and availability of such financing at the appropriate time. We also believe that our future cash expected to be generated from operations and borrowing availability under the Senior Credit Agreement (or any such other credit facility) will be sufficient to fund our future capital expenditures and long-term debt service obligations for the next twelve months and the forseeable future.
Collateral, Covenants and Restrictions of our Credit Agreements. Our obligations under the Senior Credit Agreement and the 2029 Notes are secured by substantially all of our consolidated assets, excluding real estate. In addition, substantially all of our subsidiaries are joint and several guarantors of, and our ownership interests in those subsidiaries are pledged to collateralize, our obligations under the Senior Credit Agreement. Gray Media, Inc. is a holding company, and has no material independent assets or operations. For all applicable periods, the 2026 Notes, 2027 Notes, 2030 Notes and 2031 Notes have been fully and unconditionally guaranteed, on a joint and several, senior unsecured basis, by substantially all of Gray Media, Inc.’s subsidiaries. Any subsidiaries of Gray Media, Inc. that do not guarantee the 2026 Notes, 2027 Notes, 2030 Notes and 2031 Notes are not material or are designated as unrestricted under the Senior Credit Agreement. As of December 31, 2024, there were no significant restrictions on the ability of Gray Media, Inc.’s subsidiaries to distribute cash to Gray or to the guarantor subsidiaries.
The Senior Credit Agreement contains affirmative and restrictive covenants with which we must comply, including: (a) limitations on additional indebtedness, (b) limitations on liens, (c) limitations on the sale of assets, (d) limitations on guarantees, (e) limitations on investments and acquisitions, (f) limitations on the payment of dividends and share repurchases, (g) limitations on mergers and (h) maintenance of the First Lien Leverage Ratio while any amount is outstanding under the revolving credit facility, as well as other customary covenants for credit facilities of this type. The 2026 Notes, 2027 Notes, 2029 Notes, 2030 Notes and 2031 Notes include covenants with which we must comply which are typical for financing transactions of their nature. As of December 31, 2024, we were in compliance with all required covenants under all of our debt obligations.
In addition to results prepared in accordance with U.S. GAAP, “Leverage Ratio Denominator” is a metric that management uses to calculate our compliance with our financial covenants in our indebtedness agreements. This metric is calculated as specified in our Senior Credit Agreement and is a significant measure that represents the denominator of a formula used to calculate compliance with material financial covenants within the Senior Credit Agreement that govern our ability to incur indebtedness, incur liens, make investments and make restricted payments, among other limitations usual and customary for credit agreements of this type. Accordingly, management believes this metric is a very material metric to our debt and equity investors.
Leverage Ratio Denominator gives effect to the revenue and broadcast expenses of all completed acquisitions and divestitures as if they had been acquired or divested, respectively, on January 1, 2023. It also gives effect to certain operating synergies expected from the acquisitions and related financings, and adds back professional fees incurred in completing the acquisitions. Certain of the financial information related to the acquisitions, if applicable, has been derived from, and adjusted based on, unaudited, un-reviewed financial information prepared by other entities, which Gray cannot independently verify. We cannot assure you that such financial information would not be materially different if such information were audited or reviewed and no assurances can be provided as to the accuracy of such information, or that our actual results would not differ materially from this financial information if the acquisitions had been completed on the stated date. In addition, the presentation of Leverage Ratio Denominator as determined in the Senior Credit Agreement and the adjustments to such information, including expected synergies, if applicable, resulting from such transactions, may not comply with U.S. GAAP or the requirements for pro forma financial information under Regulation S-X under the Securities Act of 1933. Leverage Ratio Denominator, as determined in the Senior Credit Agreement, represents an average amount for the preceding eight quarters then ended.
Our “Adjusted Total Indebtedness”, “First Lien Adjusted Total Indebtedness” and “Secured Adjusted Total Indebtedness”, in each case “Net of All Cash”, represents the amount of outstanding principal of our long-term debt, plus certain other obligations as defined in our Senior Credit Agreement, less all cash (excluding restricted cash) for the applicable amount of indebtedness.
Below is a calculation of our “Leverage Ratio”, “First Lien Leverage Ratio” and “Secured Leverage Ratio” as defined in our Senior Credit Agreement as of December 31, 2024:
Calculation of Leverage Ratio, First Lien Leverage Ratio and Secured Leverage Ratio, as each is defined in our Senior Credit Agreement (Unaudited): |
| | | Eight Quarters Ended | |
| | | December 31, 2024 | |
| | | (in millions) | |
Net income | | $ | 299 | |
Adjustments to reconcile from net income to Leverage Ratio Denominator as defined in our Senior Credit Agreement: | | | | |
Depreciation | | | 289 | |
Amortization of intangible assets | | | 319 | |
Non-cash stock-based compensation | | | 42 | |
Common stock contributed to 401(k) plan | | | 10 | |
Loss on disposal of assets, net | | | 41 | |
Gain on disposal of investment, not in the ordinary course | | | (110 | ) |
Interest expense | | | 925 | |
Gain on early extinguishment of debt | | | (31 | ) |
Income tax expense | | | 111 | |
Impairment of investment | | | 97 | |
Amortization of program broadcast rights | | | 66 | |
Payments for program broadcast rights | | | (67 | ) |
Pension benefit | | | (5 | ) |
Contributions to pension plans | | | (4 | ) |
Adjustments for unrestricted subsidiaries | | | 45 | |
Adjustments for stations acquired or divested, financings and expected synergies during the eight quarter period | | | (1 | ) |
Other | | | 2 | |
Total eight quarters ended December 31, 2024 | | $ | 2,028 | |
Leverage Ratio Denominator (total eight quarters ended December 31, 2024, divided by 2) | | $ | 1,014 | |
| | | December 31, 2024 | |
| | | (dollars in millions) | |
| | | | | |
Total outstanding principal, including current portion | | $ | 5,690 | |
Letters of credit outstanding | | | 6 | |
Cash | | | (135 | ) |
Adjusted Total Indebtedness | | $ | 5,561 | |
Leverage Ratio (maximum permitted incurrence is 7.00 to 1.00) | | | 5.49 | |
| | | | | |
Total outstanding principal secured by a first lien | | $ | 3,143 | |
Cash | | | (135 | ) |
First Lien Adjusted Total Indebtedness | | $ | 3,008 | |
First Lien Leverage Ratio (maximum permitted incurrence is 3.5 to 1.00) (1) | | | 2.97 | |
| | | | | |
Total outstanding principal secured by a lien | | $ | 3,143 | |
Cash | | | (135 | ) |
Secured Adjusted Total Indebtedness | | $ | 3,008 | |
Secured Leverage Ratio (maximum permitted incurrence is 5.50 to 1.00) | | | 2.97 | |
(1) At any time any amounts are outstanding under our revolving credit facility, our maximum First Lien Leverage Ratio cannot exceed 4.25 to 1.00.
Retirement Plans
We sponsor and contribute to defined benefit and defined contribution retirement plans. Effective on January 1, 2025, these plans were:
| | ● | The Gray Media, Inc. Retirement Plan (the “Gray Pension Plan”) |
| | ● | The Gray Media 401(k) Savings Plan (the “Gray 401(k) Plan”) |
| | ● | Gray Media, Inc. Retirement Plan for Certain Bargaining Class Employees (the “Meredith Plan”) |
The Gray Pension Plan is a defined benefit pension plan covering certain of our legacy employees. Benefits under the Gray Pension Plan are frozen and can no longer increase, and no new participants can be added to the plan.
Our funding policy for the Gray Pension Plan is consistent with the funding requirements of existing federal laws and regulations under the Employee Retirement Income Security Act of 1974. A discount rate is selected annually to measure the present value of the benefit obligations. In determining the selection of a discount rate, we estimated the timing and amounts of expected future benefit payments and applied a yield curve developed to reflect yields available on high-quality bonds. The yield curve is based on an externally published index specifically designed to meet the criteria of United States Generally Accepted Accounting Principles (“U.S. GAAP”). The discount rate selected for determining benefit obligations as of December 31, 2024, was 5.48%, which reflects the results of this yield curve analysis. The discount rate used for determining benefit obligations as of December 31, 2023 was 4.79%. Our assumptions regarding expected return on plan assets reflects asset allocations, the investment strategy and the views of investment managers, as well as historical experience. In 2024, we used an assumed rate of return of 6.25% for our assets invested in the Gray Pension Plan. The estimated asset returns for this plan, calculated on a mean market value assuming mid-year contributions and benefit payments, were a gain of 0.7% for the year ended December 31, 2024, and a gain of 13.7% for the year ended December 31, 2023. Other significant assumptions relate to inflation, retirement and mortality rates. Our inflation assumption is based on an evaluation of external market indicators. Retirement rates are based on actual plan experience and mortality rates are based on the Pri-2012 total mortality table and the MP-2021 projection scale published by the Society of Actuaries.
During the year ended December 31, 2024, we determined that no contribution to the Gray Pension Plan was required. During the year ended December 31, 2023, we contributed $4 million to the Gray Pension Plan. Currently we do not expect that a contribution to the Gray Pension Plan will be needed in 2025. The use of significantly different assumptions, or if actual experienced results differ significantly from those assumed, could result in our funding obligations being materially different.
The Gray 401(k) Plan is a defined contribution plan intended to meet the requirements of section 401(k) of the Internal Revenue Code. During 2024 and 2023, employer contributions under the Gray 401(k) Plan include matching cash contributions at a rate of 100% of the first 1% of each employee’s salary deferral, and 50% of the next 5% of each employee’s salary deferral. In addition, the Company, at its discretion, may make an additional profit-sharing contribution, based on annual Company performance, to those employees who meet certain criteria. For the years ended December 31, 2024 and 2023, our matching contributions to our Capital Accumulation Plan were approximately $28 million and $26 million, respectively. An additional profit-sharing contribution was not approved for 2024. As of and for the year ended December 31, 2023, an additional profit-sharing contribution of $10 million was approved and accrued as a liability. This liability was settled in the first quarter of 2024 by the issuance of Gray common stock to the participants of the Gray 401(k) Plan.
In connection with the Meredith Transaction, in 2021, we assumed a defined benefit pension plan covering certain legacy Meredith bargaining class employees. As of December 31, 2024 and 2023, the Meredith Plan had combined plan assets of $22 million and $16 million, respectively, and combined projected benefit obligations of $18 million and $11 million, respectively. A net asset of $4 million and $5 million for this plan are recorded in our financial statements as of December 31, 2024 and 2023, respectively.
See Note 11 “Retirement Plans” of our audited consolidated financial statements included elsewhere herein for further information concerning these retirement plans.
Capital Expenditures
We currently expect that our capital expenditures will range between approximately $85 million to $90 million during 2025, which includes capital expenditures at our Assembly Atlanta project. We incurred costs to build public infrastructure within the Assembly Atlanta project. Pursuant to our Purchase and Sale Agreement with the Doraville Community Improvement District (the “CID”), we receive cash reimbursements for the transfer of specific infrastructure projects to the CID and for other construction costs previously incurred. Consistent with previous practice, we anticipate transferring certain public infrastructure at Assembly Atlanta to the CID for which we anticipate receiving proceeds during 2025. We expect reimbursements of approximately $25 million in 2025 for work completed to date, and that our capital expenditures in 2025 will be less than the reimbursements we expect to receive. We can give no assurances of the actual proceeds to be received in the future from the CID, nor the timing of any such proceeds.
Off-Balance Sheet Arrangements
Operating Commitments. We have various commitments for syndicated television programs. We have two types of syndicated television program contracts: first run programs and off network reruns. First run programs are programs such as Wheel of Fortune and off network reruns are programs such as The Big Bang Theory. First run programs have not been produced at the time the contract to air such programming is signed, and off network reruns have already been produced. For all syndicated television contracts, we record an asset and corresponding liability for payments to be made only for the current year of the first run programming and for the entire contract period for off-network programming. Only an estimate of the payments anticipated to be made in the year following the balance sheet date of the first run contracts are recorded on the current balance sheet, because the programs for the later years of the contract period have not been produced or delivered.
The total license fee payable under a program license agreement allowing us to broadcast programs is recorded at the beginning of the license period and is charged to operating expense over the period that the programs are broadcast. The portion of the unamortized balance expected to be charged to operating expense in the succeeding year is classified as a current asset, with the remainder classified as a non-current asset. The liability for license fees payable under program license agreements is classified as current or long-term, in accordance with the payment terms of the various license agreements.
The following are our material expected off balance sheet contractual obligations and commitments as of December 31, 2024:
● | Cash interest on long-term debt obligations, including interest expense on long-term debt and required future principal repayments under those obligations. |
● | Preferred Stock dividends. |
● | On February 23, 2023, we, certain of our subsidiaries and a wholly-owned special purpose subsidiary (the “SPV”), entered into a three-year $300 million revolving accounts receivable securitization facility (the “Securitization Facility”) with Wells Fargo Bank, N.A., as administrative agent, for the purpose of providing additional liquidity in order to repay indebtedness under the Senior Credit Agreement. The Securitization Facility permits the SPV to draw up to a total of $300 million, subject to the outstanding amount of the receivables pool and other factors. The Securitization Facility is subject to interest charges, at the one-month SOFR rate plus 100 basis points on the amount of the outstanding facility. The SPV is also required to pay an upfront fee and a commitment fee in connection with the Securitization Facility. |
● | Programming obligations not currently accrued that represent obligations for syndicated television programming whose license period has not yet begun, or the program is not yet available. |
● | Network affiliation agreements representing the fixed obligations under our current agreements with broadcast networks. Certain network affiliation agreements include variable fee components such as percentage of revenue or rate per subscriber. Our network affiliation agreements expire at various dates primarily through December 31, 2028. |
● | Service and other agreements for various non-cancelable contractual agreements for maintenance services and other professional services. |
● | Non-cancelable contractual obligations for various materials, services and construction costs related to development of our studio production facilities. |
For more information about these off-balance sheet contractual obligations and commitments please refer to Note 12 “Commitments and Contingencies” of our audited consolidated financial statements included elsewhere herein.
Subsequent Events
In December 2024, we entered into a series of agreements through which we anticipate receiving approximately $35 million in return for (a) all of Gray’s interests in certain third-party leases for space at Gray-owned tower sites, and (b) the exclusive right to market and lease space at those Gray-owned tower sites to third parties. We will retain ownership and control of each such tower site and will not incur any additional operating costs with respect to the subject tower sites. We anticipate closing the transactions at various times during 2025, with the majority of closings occurring in the first half of 2025.
Inflation
During 2024, we have experienced moderate inflation of our operating expenses and increases in interest rates on amounts outstanding under our Senior Credit Agreement. There can be no assurance that further increases in the rate of inflation or interest rates in the future would not have an adverse effect on operating results.
Critical Accounting Policies
The preparation of financial statements in conformity with U.S. GAAP requires us to make judgments and estimations that affect the amounts reported in the financial statements and accompanying notes. Actual results could differ materially from those reported amounts. We consider our accounting policies relating to intangible assets and income taxes to be critical policies that require significant judgments or estimations in their application where variances may result in significant differences to future reported results. Our policies concerning intangible assets and income taxes are disclosed below.
Variability of Critical Accounting Estimates. Our critical accounting estimates include estimates and assumptions that are material to our financial statements. These estimates and assumptions are used in:
● | our annual impairment testing of broadcast licenses and goodwill; |
● | our estimates of the fair value of assets acquired and liabilities assumed in businesses combinations; and |
Our estimates and assumptions have been materially accurate in the past and have not changed materially. We do not expect that these assumptions are likely to change materially in the future.
Annual Impairment Testing of Broadcast Licenses and Goodwill. We evaluate broadcast licenses and goodwill for impairment on an annual basis, or more often when certain triggering events occur. Goodwill is evaluated at the reporting unit level.
Our broadcasting operating segment is comprised of a single reporting unit. Each of the distinct businesses within our production companies operating segment represent a reporting unit. Therefore, as of December 31, 2024, we evaluated our goodwill for impairment for five reporting units. One reporting unit for all of our broadcast television operations and four for each of the distinct businesses within our production companies. The Company has considered the requirements as stipulated within ASC 350. Management has identified the applicable assets and liabilities for each of the reporting units in accordance with ASC 350.
In the performance of our annual broadcast license and reporting unit impairment assessments, we have the option of performing a qualitative assessment to determine if it is more likely than not that the respective asset has been impaired. In 2024, we performed a qualitative assessment for 56 of our broadcast licenses and three of our reporting units. In 2023, we performed a qualitative assessment for 59 of our broadcast licenses and one of our reporting units.
As part of this qualitative assessment, we evaluate the relative impact of factors that are specific to the reporting units as well as industry, regulatory and macroeconomic factors that could affect the significant inputs used to determine the fair value of the assets. We also consider the significance of the excess fair value over the carrying value reflected in prior quantitative assessments and the changes to the reporting units’ carrying value since the last impairment test.
If we conclude that it is more likely than not that a broadcast license or reporting unit is impaired, or if we elect not to perform the optional qualitative assessment, we perform the quantitative assessment which involves comparing the estimated fair value of the broadcast license or reporting unit to its respective carrying value.
For our annual broadcast licenses impairment test in 2024, we concluded that it was more likely than not that all of our broadcast licenses that were evaluated were not impaired based upon our qualitative assessments. We elected to perform a quantitative assessment for our remaining broadcast licenses and concluded that their fair values exceeded their carrying values. To estimate the fair value of our broadcast licenses, we considered assumptions related to historical market and station growth trends, third party market specific industry data, the anticipated performance of the stations and discount rates. Our valuation technique included theoretical assumptions of the costs that would be incurred to construct a station when the only owned asset is the broadcast license and theoretical assumptions for the associated revenues, operating margins and capital expenditures expected to be incurred in the start-up years. We also consider other relevant factors such as the technical qualities of the broadcast license and the number of competing broadcast licenses within that market.
For our annual goodwill impairment test in 2024, we concluded that it was more likely than not that goodwill was not impaired based upon our qualitative assessments for one of our reporting units. We elected to perform a quantitative assessment for the remainder of our reporting units and concluded that their fair values exceeded their carrying values. To estimate the fair value of our reporting units, we utilize a discounted cash flow model supported by a market multiple approach. We believe that a discounted cash flow analysis is the most appropriate methodology to test the recorded value of long-term assets with a demonstrated long-lived/enduring franchise value. We believe the results of the discounted cash flow and market multiple approaches provide reasonable estimates of the fair value of our reporting units because these approaches are based on our actual results and reasonable estimates of future performance, and also take into consideration a number of other factors deemed relevant by us including, but not limited to, expected future market revenue growth, market revenue shares and operating profit margins. We have historically used these approaches in determining the value of our reporting units. We also consider a market multiple approach to corroborate our discounted cash flow analysis. We believe that this methodology is consistent with the approach that a strategic market participant would utilize if they were to value our television stations.
We believe we have made reasonable estimates and utilized appropriate assumptions to evaluate whether the fair values of our broadcast licenses and reporting units were less than their carrying values. If future results are not consistent with our assumptions and estimates, including future events such as a deterioration of market conditions or significant increases in discount rates, we could be exposed to impairment charges in the future. Any resulting impairment loss could have a material adverse impact on our consolidated balance sheets, consolidated statements of operations and consolidated statements of cash flows.
At December 31, 2024 and 2023, the recorded value of our broadcast licenses was $5.3 billion and the recorded value of our goodwill was $2.6 billion, at each date. See Note 13 “Goodwill and Intangible Assets” of our audited consolidated financial statements included elsewhere herein, for the results of our annual impairment tests for the years ended December 31, 2024, 2023 and 2022.
During 2023, as a result of the bankruptcy of Diamond Sports Group, LLC (“Diamond”), our production companies segment recorded a non-cash charge of $43 million for impairment of goodwill and other intangible assets.
Valuation of Network Affiliation Agreements. We believe that the value of a television station is derived primarily from the attributes of its broadcast license rather than its network affiliation agreement. These attributes have a significant impact on the audience for network programming in a local television market compared to the national viewing patterns of the same network programming.
Certain other broadcasting companies have valued their stations on the basis that it is the network affiliation and not the other attributes of the station, including its broadcast license, which contributes to the operational performance of that station. As a result, we believe that these broadcasting companies allocate a significant portion of the purchase price for any station that they may acquire to the network affiliation relationship, and include in their network affiliation valuation amounts related to attributes which we believe are more appropriately reflected in the value of the broadcast license or reporting units.
The methodology we used to value our stations was based on our evaluation of the broadcast licenses acquired and the characteristics of the markets in which they operated. Given our assumptions and the specific attributes of the stations we acquired from 2002 through December 31, 2024, we generally ascribe no incremental value to the incumbent network affiliation relationship in each market beyond the cost of negotiating a new agreement with another network and the value of any terms of the affiliation agreement that were more favorable or unfavorable than those generally prevailing in the market. Due to certain characteristics of a small number of the stations acquired in 2023, we ascribed approximately $14 million of the value of those transactions to network affiliations.
Some broadcast companies may use methods to value acquired network affiliations different than those that we use. These different methods may result in significant variances in the amount of purchase price allocated to these assets among broadcast companies.
If we were to assign higher values to all of our network affiliations and less value to our broadcast licenses or goodwill and if it is further assumed that such higher values of the network affiliations are finite-lived intangible assets, this reallocation of value might have a significant impact on our operating results. There is diversity of practice within the industry, and some broadcast companies have considered such network affiliation intangible assets to have a life ranging from 15 to 40 years depending on the specific assumptions utilized by those broadcast companies.
The following table reflects the hypothetical impact of the reassignment of value from broadcast licenses to network affiliations for our historical acquisitions (the first acquisition being in 1994) and the resulting increase in amortization expense assuming a hypothetical 15-year amortization period as of our most recent impairment testing date of December 31, 2024 (in millions, except per share data):
| | | | | | | Percentage of Total | |
| | | | | | | Value Reassigned to | |
| | | | | | | Network | |
| | | As | | | Affiliation Agreements | |
| | | Reported | | | 50% | | | 25% | |
Balance Sheet (As of December 31, 2024): | | | | | | | | | | | | |
Broadcast licenses | | $ | 5,311 | | | $ | 2,656 | | | $ | 3,983 | |
Other intangible assets, net (including network affiliation agreements) | | | 290 | | | | 1,741 | | | | 1,016 | |
| | | | | | | | | | | | | |
Statement of Operations (For the year ended December 31, 2024): | | | | | | | | | | | | |
Amortization of intangible assets | | | 125 | | | | 275 | | | | 200 | |
Operating income | | | 851 | | | | 701 | | | | 776 | |
Net income attributable to common stockholders | | | 323 | | | | 211 | | | | 267 | |
Per share - basic | | $ | 3.40 | | | $ | 2.22 | | | $ | 2.81 | |
Per share - diluted | | $ | 3.36 | | | $ | 2.20 | | | $ | 2.78 | |
For future acquisitions, if any, the valuation of the network affiliations may differ from the values of previous acquisitions due to the different characteristics of each station and the market in which it operates.
Recent Accounting Pronouncements. See Note 1 “Description of Business and Summary of Significant Accounting Policies” of our audited consolidated financial statements included elsewhere herein for more information.
Item 7A. QUANTITATIVE AND QUALITATIVE DISCLOSURES ABOUT MARKET RISK
We are exposed to certain risks arising from business operations and economic conditions. We attempt to manage our exposure to a wide variety of business and operational risks principally through the management of our core business activities. We attempt to manage economic risk, including interest rate, liquidity and credit risk, primarily by managing the amount, sources and duration of our debt funding and, at times, the use of interest rate swap agreements. From time to time, we may enter into interest rate swap agreements or interest rate cap agreements to manage interest rate exposure with the following objectives:
| | ● | managing current and forecasted interest rate risk while maintaining financial flexibility and solvency; |
| | ● | proactively managing our cost of capital to ensure that we can effectively manage operations and execute our business strategy, thereby maintaining a competitive advantage and enhancing shareholder value; and |
| | ● | complying with covenant requirements in our financing agreements. |
Under the Senior Credit Agreement, we pay interest based on a floating interest rate on balances outstanding. On February 23, 2023, we entered into interest rate caps pursuant to an International Swaps and Derivatives Association ("ISDA") Master Agreement with Wells Fargo Bank, NA and Truist Bank, respectively. On June 25, 2024, we amended the notional amount of the interest rate caps in order to align the rate caps with the outstanding amounts of the related indebtedness. As of December 31, 2024, the caps have a combined fixed notional value of approximately $1.9 billion through maturity on December 31, 2025. The agreement effectively limits the annual interest charged on all of our variable rate debt to a maximum one-month SOFR rate of 5 percent, plus the Applicable Margin, as specified in our Senior Credit Agreement. The Company is also required to pay aggregate fees in connection with the agreement of approximately $34 million that is due and payable on December 31, 2025. The ISDA Master Agreement, together with its related schedules, contain customary representations, warranties and covenants. This hedging agreement was entered into to mitigate the interest rate risk inherent in our variable rate debt and is not for speculative trading purposes. Because of these interest rate caps, at December 31, 2024, a 100-point basis increase in market interest rates would have increased our interest expense and decreased our income before income taxes by $6 million for the year ended December 31, 2024. A 100 basis point decrease in market interest rates would have decreased our interest expense and increased our income before income taxes by $6 million for the year ended December 31, 2024.
We pay a fixed rate of interest on the 2031 Notes, 2030 Notes, 2029 Notes, 2027 Notes and 2026 Notes. As of December 31, 2024, the majority of our outstanding debt bore interest at a fixed interest rate, which reduces our risk of potential increases in interest rates, but would not allow us to benefit from any reduction in market interest rates such as SOFR or the prime rate. See Note 4 “Long-term Debt” of our audited consolidated financial statements included elsewhere herein for more information on our long-term debt and associated interest rates.
At December 31, 2024 and 2023, the principal outstanding of our long-term debt, including current portion, was $5.7 billion and $6.2 billion, respectively, and the fair value of our long-term debt, including current portion, was $4.6 billion and $5.6 billion, respectively, as of December 31, 2024 and 2023. Fair value of our long-term debt is based on estimates provided by third-party financial professionals as of the respective dates.
Item 8. FINANCIAL STATEMENTS AND SUPPLEMENTARY DATA
| | Page |
| | |
Management’s Report on Internal Control Over Financial Reporting | 50 |
| | |
Report of Independent Registered Public Accounting Firm | 51 |
| | |
Consolidated Balance Sheets at December 31, 2024 and 2023 | 54 |
| | |
Consolidated Statements of Operations for the years ended December 31, 2024, 2023 and 2022 | 56 |
| | |
Consolidated Statements of Comprehensive Income (Loss) for the years ended December 31, 2024, 2023 and 2022 | 57 |
| | |
Consolidated Statements of Stockholders’ Equity for the years ended December 31, 2024, 2023 and 2022 | 58 |
| | |
Consolidated Statements of Cash Flows for the years ended December 31, 2024, 2023 and 2022 | 60 |
| | |
Notes to Consolidated Financial Statements | 61 |
Management’s Report on Internal Control Over Financial Reporting
Our management is responsible for establishing and maintaining adequate internal control over financial reporting and for the assessment of the effectiveness of internal control over financial reporting. As defined by the United States Securities and Exchange Commission (the “SEC”), internal control over financial reporting is a process designed by, or under the supervision of, our principal executive and principal financial officers and effected by our Board of Directors, management and other personnel, to provide reasonable assurance regarding the reliability of financial reporting and the preparation of the consolidated financial statements for external purposes in accordance with accounting principles generally accepted in the United States of America.
Our internal control over financial reporting includes those policies and procedures that (i) pertain to the maintenance of records that, in reasonable detail, accurately and fairly reflect our transactions and dispositions of our assets; (ii) provide reasonable assurance that transactions are recorded as necessary to permit preparation of the consolidated financial statements in accordance with generally accepted accounting principles, and that our receipts and expenditures are being made only in accordance with authorizations of our management and directors; and (iii) provide reasonable assurance regarding prevention or timely detection of unauthorized acquisition, use or disposition of our assets that could have a material effect on the consolidated financial statements.
Because of its inherent limitations, internal control over financial reporting may not prevent or detect all misstatements. Also, projections of any evaluation of effectiveness to future periods are subject to the risk that controls may become inadequate because of changes in conditions, or that the degree of compliance with the policies or procedures may deteriorate.
In connection with the preparation of our annual consolidated financial statements, management has undertaken an assessment of the effectiveness of our internal control over financial reporting as of December 31, 2024, based on criteria established in Internal Control – Integrated Framework issued by the Committee of Sponsoring Organizations of the Treadway Commission (“COSO 2013 framework”). Management’s assessment included an evaluation of the design of our internal control over financial reporting and testing of the operational effectiveness of those controls. Based on this evaluation, management has concluded that our internal control over financial reporting was effective as of December 31, 2024.
The effectiveness of our internal control over financial reporting as of December 31, 2024 has been audited by RSM US LLP, an independent registered public accounting firm, as stated in their report, which is included herein.
Report of Independent Registered Public Accounting Firm
To the Stockholders and the Board of Directors of Gray Media, Inc.
Opinion on the Financial Statements
We have audited the accompanying consolidated balance sheets of Gray Media, Inc. and its subsidiaries (the Company) as of December 31, 2024 and 2023, the related consolidated statements of operations, comprehensive income (loss), stockholders' equity and cash flows for each of the three years in the period ended December 31, 2024, and the related notes to the consolidated financial statements and schedule (collectively, the financial statements). In our opinion, the financial statements present fairly, in all material respects, the financial position of the Company as of December 31, 2024 and 2023, and the results of its operations and its cash flows for each of the three years in the period ended December 31, 2024, in conformity with accounting principles generally accepted in the United States of America.
We have also audited, in accordance with the standards of the Public Company Accounting Oversight Board (United States) (PCAOB), the Company's internal control over financial reporting as of December 31, 2024, based on criteria established in Internal Control — Integrated Framework issued by the Committee of Sponsoring Organizations of the Treadway Commission in 2013, and our report dated February 27, 2025 expressed an unqualified opinion on the effectiveness of the Company's internal control over financial reporting.
Basis for Opinion
These financial statements are the responsibility of the Company’s management. Our responsibility is to express an opinion on the Company’s financial statements based on our audits. We are a public accounting firm registered with the PCAOB and are required to be independent with respect to the Company in accordance with U.S. federal securities laws and the applicable rules and regulations of the Securities and Exchange Commission and the PCAOB.
We conducted our audits in accordance with the standards of the PCAOB. Those standards require that we plan and perform the audits to obtain reasonable assurance about whether the financial statements are free of material misstatement, whether due to error or fraud. Our audits included performing procedures to assess the risks of material misstatement of the financial statements, whether due to error or fraud, and performing procedures that respond to those risks. Such procedures included examining, on a test basis, evidence regarding the amounts and disclosures in the financial statements. Our audits also included evaluating the accounting principles used and significant estimates made by management, as well as evaluating the overall presentation of the financial statements. We believe that our audits provide a reasonable basis for our opinion.
Critical Audit Matter
The critical audit matter communicated below is a matter arising from the current period audit of the financial statements that was communicated or required to be communicated to the audit committee and that: (1) relates to accounts or disclosures that are material to the financial statements and (2) involved our especially challenging, subjective or complex judgments. The communication of this critical audit matter does not alter in any way our opinion on the financial statements, taken as a whole, and we are not, by communicating the critical audit matter below, providing separate opinions on the critical audit matter or on the accounts or disclosures to which it relates.
Indefinite-Lived Intangible Asset Impairment Assessment
As described in Notes 1 and 13 to the consolidated financial statements, the Company’s consolidated broadcast licenses are $5.3 billion as of December 31, 2024 and are tested for impairment at least annually. In the Company’s assessment of impairment, management identified those broadcast licenses for which a qualitative assessment would be performed to determine whether it is more likely than not that the broadcast license is impaired. For those broadcast licenses for which the Company did not elect to perform a qualitative analysis, the Company performed a quantitative analysis which involves comparing the estimated fair value of the broadcast licenses to their respective carrying values. To estimate the fair value of the broadcast licenses, management used an income approach. Under this approach, the broadcast license value is based on the estimated after-tax discounted future cash flows of the license, assuming an initial hypothetical start-up operation maturing into an average performing station in a specific television market and giving consideration to other relevant factors such as the technical qualities of the broadcast license and the number of competing broadcast licenses within that market. The assumptions considered by management in the analysis reflect historical market and station growth trends, third party market specific industry data, the anticipated performance of the stations and discount rates. The valuation technique used by management included theoretical assumptions of the costs that would be incurred to construct a station when the only owned asset is the broadcast license and the associated revenues, operating margins and capital expenditures expected to be incurred in the start-up years, which are inherently judgmental.
We identified the broadcast license impairment assessment as a critical audit matter because of the significant estimates and assumptions management used in the impairment analysis. Auditing management’s judgments used in the impairment assessment regarding forecasts of future revenue, operating margins, capital expenditures, and the discount rate to be applied involved a high degree of auditor judgment and increased audit effort, including the use of our valuation specialist.
Our audit procedures related to the Company’s broadcast license impairment assessment included the following, among others:
● | We obtained an understanding of the relevant controls related to the Company’s broadcast license impairment assessment, and tested such controls for design and operating effectiveness, including controls related to management’s review of the significant assumptions noted above. |
● | We tested management’s process for determining the fair value of the broadcast licenses subject to the quantitative impairment assessment. We compared management’s forecasts of future revenue and operating margin to historical operating results for the Company’s similar existing broadcast licenses, as well as third-party market specific industry data. We tested the assumptions related to the start-up years in the discounted cash flow model where there is no historical or third-party market data available to support those assumptions by evaluating the reasonableness of management’s build-up of revenues and operating margins over the start-up period. |
● | We utilized our valuation specialist to assist in testing the Company’s discounted cash flow models and certain significant assumptions, including discount rates, for broadcast licenses subject to a quantitative impairment assessment. |
/s/ RSM US LLP
We have served as the Company's auditor since 2006.
Atlanta, Georgia
February 27, 2025
Report of Independent Registered Public Accounting Firm
To the Stockholders and the Board of Directors of Gray Media, Inc.
Opinion on the Internal Control Over Financial Reporting
We have audited Gray Media, Inc (the Company) internal control over financial reporting as of December 31, 2024, based on criteria established in Internal Control — Integrated Framework issued by the Committee of Sponsoring Organizations of the Treadway Commission in 2013. In our opinion, the Company maintained, in all material respects, effective internal control over financial reporting as of December 31, 2024, based on criteria established in Internal Control — Integrated Framework issued by the Committee of Sponsoring Organizations of the Treadway Commission in 2013.
We have also audited, in accordance with the standards of the Public Company Accounting Oversight Board (United States) (PCAOB), the consolidated balance sheets of Gray Media, Inc. and subsidiaries as of December 31, 2024 and 2023, and the related consolidated statements of operations, comprehensive income (loss), stockholders' equity and cash flows for each of the three years in the period ended December 31, 2024, and the related notes to the consolidated financial statements and schedule of the Company and our report dated February 27, 2025 expressed an unqualified opinion.
Basis for Opinion
The Company’s management is responsible for maintaining effective internal control over financial reporting and for its assessment of the effectiveness of internal control over financial reporting in the accompanying Management’s Report on Internal Control Over Financial Reporting . Our responsibility is to express an opinion on the Company’s internal control over financial reporting based on our audit. We are a public accounting firm registered with the PCAOB and are required to be independent with respect to the Company in accordance with U.S. federal securities laws and the applicable rules and regulations of the Securities and Exchange Commission and the PCAOB.
We conducted our audit in accordance with the standards of the PCAOB. Those standards require that we plan and perform the audit to obtain reasonable assurance about whether effective internal control over financial reporting was maintained in all material respects. Our audit included obtaining an understanding of internal control over financial reporting, assessing the risk that a material weakness exists, and testing and evaluating the design and operating effectiveness of internal control based on the assessed risk. Our audit also included performing such other procedures as we considered necessary in the circumstances. We believe that our audit provides a reasonable basis for our opinion.
Definition and Limitations of Internal Control Over Financial Reporting
A company's internal control over financial reporting is a process designed to provide reasonable assurance regarding the reliability of financial reporting and the preparation of financial statements for external purposes in accordance with generally accepted accounting principles. A company's internal control over financial reporting includes those policies and procedures that (1) pertain to the maintenance of records that, in reasonable detail, accurately and fairly reflect the transactions and dispositions of the assets of the company; (2) provide reasonable assurance that transactions are recorded as necessary to permit preparation of financial statements in accordance with generally accepted accounting principles, and that receipts and expenditures of the company are being made only in accordance with authorizations of management and directors of the company; and (3) provide reasonable assurance regarding prevention or timely detection of unauthorized acquisition, use or disposition of the company's assets that could have a material effect on the financial statements.
Because of its inherent limitations, internal control over financial reporting may not prevent or detect misstatements. Also, projections of any evaluation of effectiveness to future periods are subject to the risk that controls may become inadequate because of changes in conditions, or that the degree of compliance with the policies or procedures may deteriorate.
/s/ RSM US LLP
Atlanta, Georgia
February 27, 2025
GRAY MEDIA, INC.
CONSOLIDATED BALANCE SHEETS
(in millions)
| | | December 31, | |
| | | 2024 | | | 2023 | |
Assets: | | | | | | | | |
Current assets: | | | | | | | | |
Cash | | $ | 135 | | | $ | 21 | |
Accounts receivable, less allowance for credit losses of $15 and $17, respectively | | | 337 | | | | 342 | |
Current portion of program broadcast rights, net | | | 17 | | | | 18 | |
Income tax refunds receivable | | | 6 | | | | 21 | |
Prepaid income taxes | | | 25 | | | | 18 | |
Prepaid and other current assets | | | 21 | | | | 48 | |
Total current assets | | | 541 | | | | 468 | |
| | | | | | | | | |
Property and equipment, net | | | 1,577 | | | | 1,601 | |
Operating lease right of use asset | | | 69 | | | | 75 | |
Broadcast licenses | | | 5,311 | | | | 5,320 | |
Goodwill | | | 2,642 | | | | 2,643 | |
Other intangible assets, net | | | 290 | | | | 415 | |
Investments in broadcasting and technology companies | | | 66 | | | | 85 | |
Deferred pension assets | | | 19 | | | | 17 | |
Other | | | 27 | | | | 16 | |
Total assets | | $ | 10,542 | | | $ | 10,640 | |
See accompanying notes.
GRAY MEDIA, INC.
CONSOLIDATED BALANCE SHEETS
(in millions, except for share data)
| | | December 31, | |
| | | 2024 | | | 2023 | |
Liabilities and stockholders’ equity: | | | | | | | | |
Current liabilities: | | | | | | | | |
Accounts payable | | $ | 75 | | | $ | 23 | |
Employee compensation and benefits | | | 111 | | | | 110 | |
Accrued interest | | | 112 | | | | 63 | |
Accrued network programming fees | | | 79 | | | | 37 | |
Other accrued expenses | | | 53 | | | | 57 | |
Federal and state income taxes | | | 5 | | | | 22 | |
Current portion of program broadcast obligations | | | 18 | | | | 20 | |
Deferred revenue | | | 29 | | | | 23 | |
Dividends payable | | | 15 | | | | 14 | |
Current portion of operating lease liabilities | | | 10 | | | | 11 | |
Current portion of long-term debt | | | 20 | | | | 15 | |
Total current liabilities | | | 527 | | | | 395 | |
| | | | | | | | | |
Long-term debt, less current portion and less deferred financing costs | | | 5,601 | | | | 6,145 | |
Program broadcast obligations, less current portion | | | 1 | | | | 1 | |
Deferred income taxes | | | 1,347 | | | | 1,359 | |
Operating lease liabilities, less current portion | | | 62 | | | | 69 | |
Other | | | 71 | | | | 50 | |
Total liabilities | | | 7,609 | | | | 8,019 | |
| | | | | | | | | |
Commitments and contingencies (Note 12) | | | | | | | | |
| | | | | | | | | |
Series A Perpetual Preferred Stock, no par value; cumulative; redeemable; designated 1,500,000 shares, issued and outstanding 650,000 shares at each date and $650 aggregate liquidation value, at each date | | | 650 | | | | 650 | |
| | | | | | | | | |
| | | | | | | | | |
Stockholders’ equity: | | | | | | | | |
Common stock, no par value; authorized 200,000,000 shares issued 111,166,022 shares and 107,179,827 shares, respectively outstanding 90,768,247 shares and 87,227,481 shares, respectively | | | 1,198 | | | | 1,174 | |
Class A common stock, no par value; authorized 25,000,000 shares, issued 11,237,386 shares and 10,413,993 shares, respectively outstanding 8,814,187 shares and 8,162,266 shares, respectively | | | 57 | | | | 50 | |
Retained earnings | | | 1,375 | | | | 1,084 | |
Accumulated other comprehensive loss | | | (30 | ) | | | (23 | ) |
| | | | 2,600 | | | | 2,285 | |
Treasury stock at cost, common stock, 20,397,775 shares and 19,952,346 shares, respectively | | | (284 | ) | | | (282 | ) |
Treasury stock at cost, Class A common stock, 2,423,199 shares and 2,251,727 shares, respectively | | | (33 | ) | | | (32 | ) |
Total stockholders’ equity | | | 2,283 | | | | 1,971 | |
Total liabilities and stockholders’ equity | | $ | 10,542 | | | $ | 10,640 | |
See accompanying notes.
GRAY MEDIA, INC.
CONSOLIDATED STATEMENTS OF OPERATIONS
(in millions, except for net income per share data)
| | | Year Ended December 31, | |
| | | 2024 | | | 2023 | | | 2022 | |
| | | | | | | | | | | | | |
Revenue (less agency commissions): | | | | | | | | | | | | |
Broadcasting | | $ | 3,539 | | | $ | 3,195 | | | $ | 3,583 | |
Production companies | | | 105 | | | | 86 | | | | 93 | |
Total revenue (less agency commissions) | | | 3,644 | | | | 3,281 | | | | 3,676 | |
Operating expenses before depreciation, amortization, impairment and loss (gain) on disposals of assets, net: | | | | | | | | | | | | |
Broadcasting | | | 2,317 | | | | 2,268 | | | | 2,165 | |
Production companies | | | 83 | | | | 115 | | | | 83 | |
Corporate and administrative | | | 104 | | | | 112 | | | | 104 | |
Depreciation | | | 144 | | | | 145 | | | | 129 | |
Amortization of intangible assets | | | 125 | | | | 194 | | | | 207 | |
Impairment of goodwill and other intangible assets | | | - | | | | 43 | | | | - | |
Loss (gain) on disposal of assets, net | | | 20 | | | | 21 | | | | (2 | ) |
Operating expenses, net | | | 2,793 | | | | 2,898 | | | | 2,686 | |
Operating income | | | 851 | | | | 383 | | | | 990 | |
Other income (expense): | | | | | | | | | | | | |
Miscellaneous income (expense), net | | | 117 | | | | 7 | | | | (4 | ) |
Impairment of investments | | | (25 | ) | | | (29 | ) | | | (18 | ) |
Interest expense | | | (485 | ) | | | (440 | ) | | | (354 | ) |
Gain (loss) on early extinguishment of debt | | | 34 | | | | (3 | ) | | | - | |
Income (loss) before income taxes | | | 492 | | | | (82 | ) | | | 614 | |
Income tax expense (benefit) | | | 117 | | | | (6 | ) | | | 159 | |
Net income (loss) | | | 375 | | | | (76 | ) | | | 455 | |
Preferred stock dividends | | | 52 | | | | 52 | | | | 52 | |
Net income (loss) attributable to common stockholders | | $ | 323 | | | $ | (128 | ) | | $ | 403 | |
| | | | | | | | | | | | | |
Basic per share information: | | | | | | | | | | | | |
Net income (loss) attributable to common stockholders | | $ | 3.40 | | | $ | (1.39 | ) | | $ | 4.38 | |
Weighted average shares outstanding | | | 95 | | | | 92 | | | | 92 | |
| | | | | | | | | | | | | |
Diluted per share information: | | | | | | | | | | | | |
Net income (loss) attributable to common stockholders | | $ | 3.36 | | | $ | (1.39 | ) | | $ | 4.33 | |
Weighted average shares outstanding | | | 96 | | | | 92 | | | | 93 | |
| | | | | | | | | | | | | |
Dividends declared per common share | | $ | 0.32 | | | $ | 0.32 | | | $ | 0.32 | |
See accompanying notes.
GRAY MEDIA, INC.
CONSOLIDATED STATEMENTS OF COMPREHENSIVE INCOME (LOSS)
(in millions)
| | | Year Ended December 31, | |
| | | 2024 | | | 2023 | | | 2022 | |
| | | | | | | | | | | | | |
Net income (loss) | | $ | 375 | | | $ | (76 | ) | | $ | 455 | |
| | | | | | | | | | | | | |
Other comprehensive (loss) income: | | | | | | | | | | | | |
| | | | | | | | | | | | | |
Adjustment to pension liability | | | (1 | ) | | | 7 | | | | 20 | |
Adjustment to fair value of interest rate caps | | | (8 | ) | | | (23 | ) | | | - | |
Income tax (benefit) expense of adjustments | | | (2 | ) | | | (5 | ) | | | 5 | |
Other comprehensive (loss) income | | | (7 | ) | | | (11 | ) | | | 15 | |
| | | | | | | | | | | | | |
Comprehensive income (loss) | | $ | 368 | | | $ | (87 | ) | | $ | 470 | |
See accompanying notes.
GRAY MEDIA, INC.
CONSOLIDATED STATEMENTS OF STOCKHOLDERS' EQUITY
(in millions, except for number of shares)
| | | | | | | | | | | | | | | | | | | | | | | | | | | | | | | | | | | | | | | Accumulated | | | | | |
| | | Class A | | | | | | | | | | | | | | | Treasury Stock | | | Treasury Stock | | | Other Comprehensive | | | | | |
| | | Common Stock | | | Common Stock | | | Retained | | | Class A Common Stock | | | Common Stock | | | (Loss) | | | | | |
| | | Shares | | | Amount | | | Shares | | | Amount | | | Earnings | | | Shares | | | Amount | | | Shares | | | Amount | | | Income | | | Total | |
| | | | | | | | | | | | | | | | | | | | | | | | | | | | | | | | | | | | | | | | | | | | | |
Balance at December 31, 2021 | | | 9,424,691 | | | $ | 39 | | | | 104,286,324 | | | $ | 1,127 | | | $ | 869 | | | | (1,998,179 | ) | | $ | (28 | ) | | | (16,747,268 | ) | | $ | (223 | ) | | $ | (27 | ) | | $ | 1,757 | |
| | | | | | | | | | | | | | | | | | | | | | | | | | | | | | | | | | | | | | | | | | | | | |
Net income | | | - | | | | - | | | | - | | | | - | | | | 455 | | | | - | | | | - | | | | - | | | | - | | | | - | | | | 455 | |
| | | | | | | | | | | | | | | | | | | | | | | | | | | | | | | | | | | | | | | | | | | | | |
Preferred stock dividends | | | - | | | | - | | | | - | | | | - | | | | (52 | ) | | | - | | | | - | | | | - | | | | - | | | | - | | | | (52 | ) |
| | | | | | | | | | | | | | | | | | | | | | | | | | | | | | | | | | | | | | | | | | | | | |
Common stock dividends | | | - | | | | - | | | | - | | | | - | | | | (30 | ) | | | - | | | | - | | | | - | | | | - | | | | - | | | | (30 | ) |
| | | | | | | | | | | | | | | | | | | | | | | | | | | | | | | | | | | | | | | | | | | | | |
Adjustment to pension liability, net of income tax | | | - | | | | - | | | | - | | | | - | | | | - | | | | - | | | | - | | | | - | | | | - | | | | 15 | | | | 15 | |
| | | | | | | | | | | | | | | | | | | | | | | | | | | | | | | | | | | | | | | | | | | | | |
Issuance of common stock: | | | | | | | | | | | | | | | | | | | | | | | | | | | | | | | | | | | | | | | | | | | | |
401(k) Plan | | | - | | | | - | | | | 307,885 | | | | 7 | | | | - | | | | - | | | | - | | | | - | | | | - | | | | - | | | | 7 | |
2017 Equity and Incentive Compensation Plan: | | | | | | | | | | | | | | | | | | | | | | | | | | | | | | | | | | | | | | | | | | | | |
Restricted stock awards | | | 250,448 | | | | - | | | | 400,927 | | | | - | | | | - | | | | (132,545 | ) | | | (3 | ) | | | (210,367 | ) | | | (4 | ) | | | - | | | | (7 | ) |
Restricted stock unit awards | | | - | | | | - | | | | 108,921 | | | | - | | | | - | | | | - | | | | - | | | | (32,958 | ) | | | (1 | ) | | | - | | | | (1 | ) |
| | | | | | | | | | | | | | | | | | | | | | | | | | | | | | | | | | | | | | | | | | | | | |
Repurchase of common stock | | | - | | | | - | | | | - | | | | - | | | | - | | | | - | | | | - | | | | (2,646,193 | ) | | | (50 | ) | | | - | | | | (50 | ) |
| | | | | | | | | | | | | | | | | | | | | | | | | | | | | | | | | | | | | | | | | | | | | |
Stock-based compensation | | | - | | | | 6 | | | | - | | | | 16 | | | | - | | | | - | | | | - | | | | - | | | | - | | | | - | | | | 22 | |
| | | | | | | | | | | | | | | | | | | | | | | | | | | | | | | | | | | | | | | | | | | | | |
Balance at December 31, 2022 | | | 9,675,139 | | | $ | 45 | | | | 105,104,057 | | | $ | 1,150 | | | $ | 1,242 | | | | (2,130,724 | ) | | $ | (31 | ) | | | (19,636,786 | ) | | $ | (278 | ) | | $ | (12 | ) | | $ | 2,116 | |
| | | | | | | | | | | | | | | | | | | | | | | | | | | | | | | | | | | | | | | | | | | | | |
Net loss | | | - | | | | - | | | | - | | | | - | | | | (76 | ) | | | - | | | | - | | | | - | | | | - | | | | - | | | | (76 | ) |
| | | | | | | | | | | | | | | | | | | | | | | | | | | | | | | | | | | | | | | | | | | | | |
Preferred stock dividends | | | - | | | | - | | | | - | | | | - | | | | (52 | ) | | | - | | | | - | | | | - | | | | - | | | | - | | | | (52 | ) |
| | | | | | | | | | | | | | | | | | | | | | | | | | | | | | | | | | | | | | | | | | | | | |
Common stock dividends | | | - | | | | - | | | | - | | | | - | | | | (30 | ) | | | - | | | | - | | | | - | | | | - | | | | - | | | | (30 | ) |
| | | | | | | | | | | | | | | | | | | | | | | | | | | | | | | | | | | | | | | | | | | | | |
Adjustment to pension liability, net of income tax | | | - | | | | - | | | | - | | | | - | | | | - | | | | - | | | | - | | | | - | | | | - | | | | 6 | | | | 6 | |
| | | | | | | | | | | | | | | | | | | | | | | | | | | | | | | | | | | | | | | | | | | | | |
Adjustment to fair value of interest rate cap, net of income | | | - | | | | - | | | | - | | | | - | | | | - | | | | - | | | | - | | | | - | | | | - | | | | (17 | ) | | | (17 | ) |
| | | | | | | | | | | | | | | | | | | | | | | | | | | | | | | | | | | | | | | | | | | | | |
Issuance of common stock: | | | | | | | | | | | | | | | | | | | | | | | | | | | | | | | | | | | | | | | | | | | | |
401(k) Plan | | | - | | | | - | | | | 819,898 | | | | 9 | | | | - | | | | - | | | | - | | | | - | | | | - | | | | - | | | | 9 | |
2022 Equity and Incentive Compensation Plan: | | | | | | | | | | | | | | | | | | | | | | | | | | | | | | | | | | | | | | | | | | | | |
Restricted stock awards | | | 738,854 | | | | - | | | | 1,007,919 | | | | - | | | | - | | | | (121,003 | ) | | | (1 | ) | | | (234,938 | ) | | | (3 | ) | | | - | | | | (4 | ) |
Restricted stock unit awards | | | - | | | | - | | | | 247,953 | | | | - | | | | - | | | | - | | | | - | | | | (80,622 | ) | | | (1 | ) | | | - | | | | (1 | ) |
| | | | | | | | | | | | | | | | | | | | | | | | | | | | | | | | | | | | | | | | | | | | | |
Stock-based compensation | | | - | | | | 5 | | | | - | | | | 15 | | | | - | | | | - | | | | - | | | | - | | | | - | | | | - | | | | 20 | |
| | | | | | | | | | | | | | | | | | | | | | | | | | | | | | | | | | | | | | | | | | | | | |
Balance at December 31, 2023 | | | 10,413,993 | | | $ | 50 | | | | 107,179,827 | | | $ | 1,174 | | | $ | 1,084 | | | | (2,251,727 | ) | | $ | (32 | ) | | | (19,952,346 | ) | | $ | (282 | ) | | $ | (23 | ) | | $ | 1,971 | |
See accompanying notes.
GRAY MEDIA, INC.
CONSOLIDATED STATEMENTS OF STOCKHOLDERS' EQUITY
(in millions, except for number of shares)
| | | | | | | | | | | | | | | | | | | | | | | | | | | | | | | | | | | | | | | Accumulated | | | | | |
| | | Class A | | | | | | | | | | | | | | | Treasury Stock | | | Treasury Stock | | | Other Comprehensive | | | | | |
| | | Common Stock | | | Common Stock | | | Retained | | | Class A Common Stock | | | Common Stock | | | (Loss) | | | | | |
| | | Shares | | | Amount | | | Shares | | | Amount | | | Earnings | | | Shares | | | Amount | | | Shares | | | Amount | | | Income | | | Total | |
| | | | | | | | | | | | | | | | | | | | | | | | | | | | | | | | | | | | | | | | | | | | | |
Balance at December 31, 2023 | | | 10,413,993 | | | $ | 50 | | | | 107,179,827 | | | $ | 1,174 | | | $ | 1,084 | | | | (2,251,727 | ) | | $ | (32 | ) | | | (19,952,346 | ) | | $ | (282 | ) | | $ | (23 | ) | | $ | 1,971 | |
| | | | | | | | | | | | | | | | | | | | | | | | | | | | | | | | | | | | | | | | | | | | | |
Net income | | | - | | | | - | | | | - | | | | - | | | | 375 | | | | - | | | | - | | | | - | | | | - | | | | - | | | | 375 | |
| | | | | | | | | | | | | | | | | | | | | | | | | | | | | | | | | | | | | | | | | | | | | |
Preferred stock dividends | | | - | | | | - | | | | - | | | | - | | | | (52 | ) | | | - | | | | - | | | | - | | | | - | | | | - | | | | (52 | ) |
| | | | | | | | | | | | | | | | | | | | | | | | | | | | | | | | | | | | | | | | | | | | | |
Common stock dividends | | | - | | | | - | | | | - | | | | - | | | | (32 | ) | | | - | | | | - | | | | - | | | | - | | | | - | | | | (32 | ) |
| | | | | | | | | | | | | | | | | | | | | | | | | | | | | | | | | | | | | | | | | | | | | |
Adjustment to pension liability, net of income tax | | | - | | | | - | | | | - | | | | - | | | | - | | | | - | | | | - | | | | - | | | | - | | | | (1 | ) | | | (1 | ) |
| | | | | | | | | | | | | | | | | | | | | | | | | | | | | | | | | | | | | | | | | | | | | |
Adjustment to fair value of interest rate cap, net of income tax | | | - | | | | - | | | | - | | | | - | | | | - | | | | - | | | | - | | | | - | | | | - | | | | (6 | ) | | | (6 | ) |
| | | | | | | | | | | | | | | | | | | | | | | | | | | | | | | | | | | | | | | | | | | | | |
Issuance of common stock: | | | | | | | | | | | | | | | | | | | | | | | | | | | | | | | | | | | | | | | | | | | | |
401(k) Plan | | | - | | | | - | | | | 1,765,444 | | | | 9 | | | | - | | | | - | | | | - | | | | - | | | | - | | | | - | | | | 9 | |
2022 Equity and Incentive | | | | | | | | | | | | | | | | | | | | | | | | | | | | | | | | | | | | | | | | | | | | |
Compensation Plan: | | | | | | | | | | | | | | | | | | | | | | | | | | | | | | | | | | | | | | | | | | | | |
Restricted stock awards | | | 823,393 | | | | - | | | | 1,655,958 | | | | - | | | | - | | | | (171,472 | ) | | | (1 | ) | | | (257,029 | ) | | | (1 | ) | | | - | | | | (2 | ) |
Restricted stock unit awards | | | - | | | | - | | | | 564,793 | | | | | | | | - | | | | - | | | | - | | | | (188,400 | ) | | | (1 | ) | | | - | | | | (1 | ) |
| | | | | | | | | | | | | | | | | | | | | | | | | | | | | | | | | | | | | | | | | | | | | |
Stock-based compensation | | | - | | | | 7 | | | | - | | | | 15 | | | | - | | | | - | | | | - | | | | - | | | | - | | | | - | | | | 22 | |
| | | | | | | | | | | | | | | | | | | | | | | | | | | | | | | | | | | | | | | | | | | | | |
Balance at December 31, 2024 | | | 11,237,386 | | | $ | 57 | | | | 111,166,022 | | | $ | 1,198 | | | $ | 1,375 | | | | (2,423,199 | ) | | $ | (33 | ) | | | (20,397,775 | ) | | $ | (284 | ) | | $ | (30 | ) | | $ | 2,283 | |
See accompanying notes.
GRAY MEDIA, INC. |
CONSOLIDATED STATEMENTS OF CASH FLOWS |
(in millions) |
| | | Year Ended December 31, | |
| | | 2024 | | | 2023 | | | 2022 | |
Cash flows from operating activities: | | | | | | | | | | | | |
Net income (loss) | | $ | 375 | | | $ | (76 | ) | | $ | 455 | |
Adjustments to reconcile net income (loss) to net cash provided by operating activities: | | | | | | | | | | | | |
Depreciation | | | 144 | | | | 145 | | | | 129 | |
Amortization of intangible assets | | | 125 | | | | 194 | | | | 207 | |
Amortization of deferred loan costs | | | 15 | | | | 13 | | | | 16 | |
Accretion of original issue discount and premium related to long-term debt, net | | | - | | | | (1 | ) | | | (1 | ) |
Amortization of stock based compensation | | | 22 | | | | 20 | | | | 22 | |
Amortization of program broadcast rights | | | 28 | | | | 37 | | | | 48 | |
Payments on program broadcast obligations | | | (29 | ) | | | (38 | ) | | | (49 | ) |
Common stock contributed to 401(k) plan | | | - | | | | 10 | | | | 9 | |
Deferred income taxes | | | (9 | ) | | | (91 | ) | | | (20 | ) |
Loss (gain) on disposal of assets, net | | | 20 | | | | 21 | | | | (2 | ) |
Gain on sale of investment | | | (110 | ) | | | - | | | | - | |
(Gain) loss on early extinguishment of debt | | | (34 | ) | | | 3 | | | | - | |
Impairment of investments | | | 25 | | | | 29 | | | | 18 | |
Impairment of goodwill and other intangible assets | | | - | | | | 43 | | | | - | |
Other | | | (1 | ) | | | 14 | | | | - | |
Changes in operating assets and liabilities, net of acquisitions: | | | | | | | | | | | | |
Accounts receivable, net | | | 5 | | | | 308 | | | | (26 | ) |
Income tax receivable or prepaid | | | 8 | | | | 26 | | | | (4 | ) |
Other current assets | | | 27 | | | | 7 | | | | - | |
Accounts payable | | | 52 | | | | (32 | ) | | | (5 | ) |
Employee compensation, benefits and pension costs | | | 1 | | | | 12 | | | | 3 | |
Accrued network fees and other expenses | | | 49 | | | | (5 | ) | | | 6 | |
Accrued interest | | | 49 | | | | 3 | | | | 8 | |
Income taxes payable | | | (17 | ) | | | 7 | | | | 5 | |
Deferred revenue | | | 6 | | | | (1 | ) | | | 10 | |
Net cash provided by operating activities | | | 751 | | | | 648 | | | | 829 | |
| | | | | | | | | | | | | |
Cash flows from investing activities: | | | | | | | | | | | | |
Acquisitions of businesses and broadcast licenses, net of cash acquired | | | (1 | ) | | | (6 | ) | | | (58 | ) |
Proceeds from sale of television stations | | | - | | | | 6 | | | | - | |
Purchases of property and equipment | | | (143 | ) | | | (348 | ) | | | (436 | ) |
Proceeds from Repack reimbursement (Note 1) | | | - | | | | - | | | | 7 | |
Proceeds from asset sales | | | 14 | | | | 54 | | | | 4 | |
Proceeds from sale of investment | | | 110 | | | | - | | | | - | |
Reimbursement of development costs | | | - | | | | 18 | | | | - | |
Investments in broadcast, production and technology companies | | | (7 | ) | | | (14 | ) | | | (16 | ) |
Other | | | (1 | ) | | | (1 | ) | | | (4 | ) |
Net cash used in investing activities | | | (28 | ) | | | (291 | ) | | | (503 | ) |
| | | | | | | | | | | | | |
Cash flows from financing activities: | | | | | | | | | | | | |
Proceeds from borrowings on long-term debt | | | 2,070 | | | | 300 | | | | - | |
Repayments of borrowings on long-term debt | | | (2,544 | ) | | | (610 | ) | | | (315 | ) |
Repurchases of common stock | | | - | | | | - | | | | (50 | ) |
Payments of common stock dividends | | | (32 | ) | | | (30 | ) | | | (30 | ) |
Payments of preferred stock dividends | | | (52 | ) | | | (52 | ) | | | (52 | ) |
Deferred and other loan costs | | | (47 | ) | | | - | | | | - | |
Payments for taxes related to net share settlement of equity awards | | | (4 | ) | | | (5 | ) | | | (7 | ) |
Net cash used in financing activities | | | (609 | ) | | | (397 | ) | | | (454 | ) |
Net (decrease) increase in cash | | | 114 | | | | (40 | ) | | | (128 | ) |
Cash at beginning of year | | | 21 | | | | 61 | | | | 189 | |
Cash at end of year | | $ | 135 | | | $ | 21 | | | $ | 61 | |
See accompanying notes.
GRAY MEDIA, INC.
NOTES TO CONSOLIDATED FINANCIAL STATEMENTS
1. | Description of Business and Summary of Significant Accounting Policies |
Overview. We are a multimedia company headquartered in Atlanta, Georgia. We are the nation’s largest owner of top-rated local television stations and digital assets serving 113 television markets that collectively reach approximately 37 percent of US television households. The portfolio includes 78 markets with the top-rated television station and 99 markets with the first and/or second highest rated television station, as well as the largest Telemundo Affiliate group with 44 markets totaling over 1.5 million Hispanic TV Households. We also own Gray Digital Media, a full-service digital agency offering national and local clients digital marketing strategies with the most advanced digital products and services. Our additional media properties include video production companies Raycom Sports, Tupelo Media Group, and PowerNation Studios, and studio production facilities Assembly Atlanta and Third Rail Studios.
Investments in Broadcasting, Production and Technology Companies. We have investments in several television, production and technology companies. We account for all material investments in which we have significant influence over the investee under the equity method of accounting. Upon initial investment, we record equity method investments at cost. The amounts initially recognized are subsequently adjusted for our appropriate share of the net earnings or losses of the investee. We record any investee losses up to the carrying amount of the investment plus advances and loans made to the investee, and any financial guarantees made on behalf of the investee. We recognize our share in earnings and losses of the investee as miscellaneous income (expense), net in our consolidated statements of operations. Investments are also increased by contributions made to and decreased by the distributions from the investee. The Company evaluates equity method investments for impairment whenever events or changes in circumstances indicate that the carrying amounts of such investments may be impaired.
Investments in non-public businesses that do not have readily determinable pricing, and for which the Company does not have control or does not exert significant influence, are carried at cost less impairments, if any, plus or minus changes in observable prices for those investments. During each of the years ended December 31, 2024, 2023 and 2022, we determined that several of our investments were impaired and we recorded an impairment expense of $25 million, $29 million and $18 million, respectively. Gains or losses resulting from changes in the carrying value of these investments are included as miscellaneous income (expense), net in our consolidated statements of operations. These investments are reported together as a non-current asset on our consolidated balance sheets.
Use of Estimates. The preparation of financial statements in conformity with U.S. GAAP requires management to make estimates and assumptions that affect the amounts reported in the financial statements and accompanying notes. Our actual results could differ materially from these estimated amounts. Our most significant estimates are our allowance for credit losses in receivables, valuation of goodwill and intangible assets, amortization of program rights and intangible assets, pension costs, income taxes, employee medical insurance claims, useful lives of property and equipment and contingencies.
Allowance for Credit Losses. We are exposed to credit risk primarily through sales of broadcast and digital advertising with a variety of direct and agency-based advertising customers, retransmission consent agreements with multichannel video program distributors and program production sales and services. We recorded expenses for this allowance of $2 million, $21 million and $1 million for the years ended December 31, 2024, 2023 and 2022, respectively.
Our allowance for credit losses is an estimate of expected losses over the remaining contractual life of our receivables based on an ongoing analysis of collectability, historical collection experience, current economic and industry conditions and reasonable and supportable forecasts. The allowance is calculated using a historical loss rate applied to the current aging analysis. We may also apply an additional allowance when warranted by specific facts and circumstances. We generally write off account receivable balances when the customer files for bankruptcy or when all commonly used methods of collection have been exhausted.
During 2023, our credit losses included amounts written-off of $17 million for the full amount owed to us by Diamond Sports Group, LLC (“Diamond”), a counterparty to certain contracts with us, as a result of Diamond’s voluntary Chapter 11 bankruptcy proceedings.
On February 23, 2023, we, certain of our subsidiaries and a wholly-owned special purpose subsidiary (the “SPV”), entered into a three-year $300 million revolving accounts receivable securitization facility (the “Securitization Facility”) with Wells Fargo Bank, N.A., as administrative agent, and certain third-party financial institutions (the “Purchasers”). The Securitization Facility permits the SPV to draw up to a total of $300 million, subject to the outstanding amount of the receivables pool and other factors. The Securitization Facility matures on February 23, 2026, and is subject to customary termination events related to transactions of this type. The sale of receivables from the SPV is accounted for in the Company’s financial statements as a "true-sale" under Accounting Standards Codification ("ASC") Topic 860.
Under the Securitization Facility, the SPV sells to the Purchasers certain receivables, including all rights, title, and interest in the related receivables (“Sold Receivables”). The parties intend that the conveyance of accounts receivables to the Purchasers, for the ratable benefit of the Purchasers will constitute a purchase and sale of receivables and not a pledge for security. The SPV has guaranteed to each Purchaser the prompt payment of Sold Receivables, and to secure the prompt payment and performance of such guaranteed obligations, the SPV has granted a security interest to the Purchasers in all assets of the SPV. In our capacity as servicer under the Securitization Facility, we are responsible for administering and collecting receivables and have made customary representations, warranties, covenants and indemnities. We do not record a servicing asset or liability since the estimated fair value of the servicing of the receivables approximates the servicing income. We also provided a performance guarantee for the benefit of the Purchasers.
The Securitization Facility is subject to interest charges, at the adjusted one-month Secured Overnight Financing Rate (“SOFR”) plus a margin (100-point basis) on the amount of the outstanding facility. The SPV was required to pay an upfront fee and a commitment fee in connection with the Securitization Facility. The SPV is a separate legal entity with its own separate creditors who will be entitled to access the SPV’s assets before the assets become available to us. As a result, the SPV’s assets are not available to pay our creditors or any of our subsidiaries, although collections from the receivables in excess of amounts required to repay the Purchasers under the Securitization Facility and other creditors of the SPV may be remitted to us.
The proceeds of the Securitization Facility are classified as operating activities in our Consolidated Statement of Cash Flows. Cash received from collections of Sold Receivables is used by the SPV to fund additional purchases of receivables on a revolving basis or to return all or any portion of outstanding capital of the Purchasers. Subsequent collections on the pledged receivables, which have not been sold, will be classified as operating cash flows at the time of collection.
The amount sold to the Purchasers was $300 million at December 31, 2024 and 2023, which was derecognized from the Consolidated Balance Sheets. As collateral against sold receivables, the SPV maintains a certain level of unsold receivables, which was $337 million and $296 million at December 31, 2024 and 2023, respectively. Total receivables sold under the Securitization Facility were $597 million and $596 million at December 31, 2024 and 2023, respectively. Pursuant to the Securitization Facility, we recognized a charge of $9 million for the year ended December 31, 2023, that representing the discount on the accounts receivable balance transferred to the SPV. This discount was included in our loss on disposal of assets in our Consolidated Statements of Operations in 2023.
The following table provides a roll-forward of the allowance for credit losses. The allowance is deducted from the amortized cost basis of accounts receivable in our consolidated balance sheets (in millions):
| | | Year Ended December 31, | |
| | | 2024 | | | 2023 | |
Beginning balance | | $ | 17 | | | $ | 16 | |
Provision for credit losses | | | 2 | | | | 21 | |
Amounts written off | | | - | | | | (20 | ) |
Amounts recovered from previous write-offs | | | (4 | ) | | | - | |
Ending balance | | $ | 15 | | | $ | 17 | |
Program Broadcast Rights. We have two types of syndicated television program contracts: first run programs and off network reruns. First run programs are programs such as Wheel of Fortune and off network reruns are programs such as The Big Bang Theory. First run programs have not been produced at the time the contract to air such programming is signed, and off network rerun programs have already been produced. We record an asset and corresponding liability for payments to be made only for the current year of first run programming and for the entire contract period for off network programming. Only an estimate of the payments anticipated to be made in the year following the balance sheet date of first run program contracts are recorded on the current balance sheet, because the programs for the later years of the contract period have not been produced or delivered.
The total license fee payable under a program license agreement allowing us to broadcast programs is recorded at the beginning of the license period and is charged to operating expense over the period that the programs are broadcast. The portion of the unamortized balance expected to be charged to operating expense in the succeeding year is classified as a current asset, with the remainder classified as a non-current asset. The liability for license fees payable under program license agreements is classified as current or long-term, in accordance with the payment terms of the various license agreements.
Property and Equipment. Property and equipment are recorded at cost, or in the case of acquired businesses, at fair value. Depreciation is computed principally by the straight-line method. The following table lists the components of property and equipment by major category (dollars in millions):
| | | | | | | | | | | Estimated | |
| | | December 31, | | | Useful Lives | |
| | | 2024 | | | 2023 | | | (in years) | |
| | | | | | | | | | | | | | |
Property and equipment, net: | | | | | | | | | | | | | |
Land | | $ | 385 | | | $ | 368 | | | | | | |
Buildings and improvements | | | 908 | | | | 868 | | | 7 | to | 40 | |
Equipment | | | 1,105 | | | | 1,082 | | | 3 | to | 20 | |
Construction in progress | | | 82 | | | | 81 | | | | | | |
| | | | 2,480 | | | | 2,399 | | | | | | |
Accumulated depreciation | | | (903 | ) | | | (798 | ) | | | | | |
Total | | $ | 1,577 | | | $ | 1,601 | | | | | | |
Maintenance, repairs and minor replacements are charged to operations as incurred; major replacements and betterments are capitalized. The cost of any assets divested, sold or retired and the related accumulated depreciation are removed from the accounts at the time of disposition, and any resulting gain or loss is reflected in income or expense for the period.
We incurred costs to build public infrastructure within the Assembly Atlanta project. Pursuant to our Purchase and Sale Agreement with the Doraville Community Improvement District (the “CID”), we receive cash reimbursements for the transfer of specific infrastructure projects to the CID and for other construction costs previously incurred. During the years ended December 31, 2024 and 2023, we received cash proceeds from the CID. The following table lists the type of proceeds received (in millions):
| | | December 31, | |
| | | 2024 | | | 2023 | |
| | | | | | | | | |
Proceeds received for assets sold to the CID | | $ | 9 | | | $ | 46 | |
Proceeds received for reimbursement of development costs | | | - | | | | 18 | |
| | | $ | 9 | | | $ | 64 | |
The following tables provide additional information related to gain on disposal of assets, net included in our consolidated statements of operations and purchases of property and equipment included in our consolidated statements of cash flows (in millions):
| | | Year ended December 31, | |
| | | 2024 | | | 2023 | | | 2022 | |
(Loss) Gain on disposal of assets, net: | | | | | | | | | | | | |
Proceeds from sale of television stations and other assets | | $ | 13 | | | $ | 60 | | | $ | 4 | |
Proceeds from FCC Repack | | | - | | | | - | | | | 7 | |
Net book value of assets disposed | | | (33 | ) | | | (73 | ) | | | (9 | ) |
Non-cash loss on divestitures | | | - | | | | 1 | | | | - | |
Securitization Facility | | | - | | | | (9 | ) | | | - | |
Total | | $ | (20 | ) | | $ | (21 | ) | | $ | 2 | |
| | | | | | | | | | | | | |
Purchase of property and equipment: | | | | | | | | | | | | |
Recurring purchases - operations | | $ | 97 | | | $ | 107 | | | $ | 170 | |
Assembly Atlanta project | | | 46 | | | | 240 | | | | 264 | |
Repack | | | - | | | | 1 | | | | 2 | |
Total | | $ | 143 | | | $ | 348 | | | $ | 436 | |
Deferred Loan Costs. Loan acquisition costs are amortized over the life of the applicable indebtedness using a straight-line method that approximates the effective interest method. These debt issuance costs related to a recognized debt liability are presented in our balance sheets as a direct deduction from the carrying amount of that debt liability, consistent with debt discounts. Debt issuance costs associated with line-of-credit arrangements are included in other assets on our balance sheets, and amortized over the life of the line-of-credit arrangement.
Asset Retirement Obligations. We own office equipment, broadcasting equipment, leasehold improvements and transmission towers, some of which are located on, or are housed in, leased property or facilities. At the conclusion of several of these leases we are obligated to dismantle, remove and otherwise properly dispose of and remediate the facility or property. We estimate our asset retirement obligations based upon the net present value of the cash flows of the costs expected to be incurred. Asset retirement obligations are recognized as a non-current liability and as a component of the cost of the related asset. Changes to our asset retirement obligations resulting from revisions to the timing or the amount of the original undiscounted cash flow estimates are recognized as an increase or decrease in the carrying amount of the asset retirement obligation and the related asset retirement cost is capitalized as part of the related property, plant or equipment. Changes in asset retirement obligations resulting from accretion of the net present value of the estimated cash flows are recognized as operating expenses. We recognize depreciation expense of the capitalized cost over the estimated life of the lease. Our estimated obligations are due at varying times through 2062. The liability recognized for our asset retirement obligations was $4 million as of each of December 31, 2024 and 2023, and included in other liabilities on our balance sheets. During the years ended December 31, 2024, 2023 and 2022, expenses related to our asset retirement obligations were not material.
Concentration of Credit Risk. We sell advertising airtime on our broadcasts and advertising space on our websites to national and local advertisers within the geographic areas in which we operate. Credit is extended based on an evaluation of the customer’s financial condition, and generally advance payment is not required, except for political advertising. Credit losses are provided for in the financial statements and consistently have been within our expectations that are based upon our prior experience.
We derived a material portion of our non-political broadcast advertising revenue from advertisers in a limited number of industries, particularly the services sector, comprising financial, legal and medical advertisers, and the automotive industry. The services sector has become an increasingly important source of advertising revenue over the past few years. During the years ended December 31, 2024, 2023 and 2022 approximately 23%, 27% and 28%, respectively, of our broadcast advertising revenue (excluding political advertising revenue) was obtained from advertising sales to the services sector. During the years ended December 31, 2024, 2023 and 2022 approximately 20%, 20% and 17%, respectively, of our broadcast advertising revenue (excluding political advertising revenue) was obtained from advertising sales to automotive customers. Although our revenues can be affected by changes within our customer base, we believe this risk is in part mitigated due to the fact that no one customer accounted for in excess of 5% of our broadcast advertising revenue in any of these periods. Furthermore, we believe that our large geographic operating area partially mitigates the potential effect of regional economic impacts.
Earnings Per Share. We compute basic earnings per share by dividing net income available to common stockholders by the weighted-average number of common shares outstanding during the relevant period. The weighted-average number of common shares outstanding does not include restricted shares. These shares, although classified as issued and outstanding, are considered contingently returnable until the restrictions lapse and, in accordance with U.S. GAAP, are not included in the basic earnings per share calculation until the shares vest. Diluted earnings per share is computed by including all potentially dilutive common shares, including restricted shares and shares underlying stock options, in the diluted weighted-average shares outstanding calculation, unless their inclusion would be antidilutive.
The following table reconciles basic weighted-average shares outstanding to diluted weighted-average shares outstanding for the years ended December 31, 2024, 2023 and 2022 (in millions):
| | | Year Ended December 31, | |
| | | 2024 | | | 2023 | | | 2022 | |
Weighted average shares outstanding, basic | | | 95 | | | | 92 | | | | 92 | |
Weighted average shares underlying stock options and restricted shares | | | 1 | | | | - | | | | 1 | |
Weighted average shares outstanding, diluted | | | 96 | | | | 92 | | | | 93 | |
Valuation of Broadcast Licenses, Goodwill and Other Intangible Assets. We have acquired a significant portion of our assets in acquisition transactions. Among the assets acquired in these transactions were broadcast licenses issued by the FCC, goodwill and other intangible assets.
For broadcast licenses acquired prior to January 1, 2002, we recorded their respective values using a residual method (analogous to “goodwill”) where the excess of the purchase price paid in the acquisition over the fair value of all identified tangible and intangible assets acquired was attributed to the broadcast license. This residual basis approach generally produces higher valuations of broadcast licenses when compared to applying an income method as discussed below.
For broadcast licenses acquired after December 31, 2001, we record their respective values using an income approach. Under this approach, a broadcast license is valued based on analyzing the estimated after-tax discounted future cash flows of the acquired station, assuming an initial hypothetical start-up operation maturing into an average performing station in a specific television market and giving consideration to other relevant factors such as the technical qualities of the broadcast license and the number of competing broadcast licenses within that market. For television stations acquired after December 31, 2001, we allocate the residual value of the station to goodwill.
When renewing broadcast licenses, we incur regulatory filing fees and legal fees. We expense these fees as they are incurred.
Goodwill represents the excess of acquisition cost over the fair value of assets acquired, identifiable intangible assets, less liabilities assumed in business combination transactions. Goodwill is tested for impairment on an annual basis (at year end) or between annual tests if events or changes in circumstances indicate that the fair value of a reporting unit may be below its carrying amount.
Other intangible assets that we have acquired include network affiliation agreements, retransmission agreements, advertising contracts, client lists, talent contracts and leases. Although each of our stations is affiliated with at least one broadcast network, we believe that the value of a television station is derived primarily from the attributes of its broadcast license rather than its network affiliation agreement. As a result, we allocate only minimal values to our network affiliation agreements. We classify our other intangible assets as finite-lived intangible assets. The amortization period of our other intangible assets is equal to the shorter of their estimated useful life or contract period, including expected extensions thereof. When renewing other intangible asset contracts, we incur legal fees that are expensed as incurred.
Impairment Testing of Indefinite-Lived Intangible Assets. We test for impairment of our indefinite-lived intangible assets on an annual basis on December 31. However, if certain triggering events occur, we test for impairment when such events occur.
For purposes of testing goodwill for impairment, our broadcast television stations as a whole, and each of our production companies, is considered a separate reporting unit. In the performance of our annual assessment of goodwill for impairment, we have the option to qualitatively assess whether it is more likely than not that a reporting unit has been impaired. As part of this qualitative assessment, we evaluate the relative impact of factors that are specific to the reporting units as well as industry, regulatory and macroeconomic factors that could affect the significant inputs used to determine the fair value of the assets. We also consider the significance of the excess fair value over the carrying value reflected in prior quantitative assessments and the changes to each reporting unit’s carrying value since the last impairment test.
If we conclude that it is more likely than not that a reporting unit is impaired, or if we elect not to perform the optional qualitative assessment, we will determine the fair value of the reporting unit and compare that to the net book value of the reporting unit. If the fair value is less than the net book value, we will record an impairment to goodwill for the amount of the difference, limited to the amount of goodwill included in the reporting unit.
To estimate the fair value of our reporting units for a quantitative assessment, we utilize a discounted cash flow model supported by a market multiple approach. We believe that a discounted cash flow analysis is the most appropriate methodology to test the recorded value of long-term assets with a demonstrated long-lived/enduring franchise value. We believe the results of the discounted cash flow and market multiple approaches provide reasonable estimates of the fair value of our reporting units because these approaches are based on our actual results and reasonable estimates of future performance, and also take into consideration a number of other factors deemed relevant by us including, but not limited to, expected future market revenue growth, market revenue shares and operating profit margins. We have historically used these approaches in determining the value of our reporting units. We also consider a market multiple approach to corroborate our discounted cash flow analysis. We believe that this methodology is consistent with the approach that a strategic market participant would utilize if they were to value one of our reporting units.
In the performance of our annual assessment of broadcast licenses for impairment, we have the option to qualitatively assess whether it is more likely than not that these assets are impaired. When evaluating our broadcast licenses for impairment, the qualitative assessment is done at the individual television station level. If we conclude that it is more likely than not that one of our broadcast licenses is impaired, we will perform a quantitative assessment by comparing the fair value of the broadcast license to its carrying value. If the fair value is greater than the asset’s recorded value, no impairment expense is recorded. If the fair value does not exceed the asset’s recorded value, we record an impairment expense equal to the amount that the asset’s recorded value exceeded the asset’s fair value. We use the income method to estimate the fair value of all broadcast licenses, irrespective of whether they were initially recorded using the residual or income methods.
For further discussion of our goodwill, broadcast licenses and other intangible assets, see Note 13 “Goodwill and Intangible Assets.”
Accumulated Other Comprehensive Loss. Our accumulated other comprehensive loss balances as of December 31, 2024, consist of adjustments to our pension asset, the fair value of our interest rate caps and the related income tax effects. Our comprehensive income for the year ended December 31, 2024, consisted of adjustments to our pension asset, the fair value of our Interest Rate Caps and the related income tax effect of each. Our comprehensive loss for the year ended December 31, 2023, consisted of the adjustment of the fair value of our pension liability and the related income tax effects. As of December 31, 2024 and 2023, the balances were as follows (in millions):
| | | December 31, | |
| | | 2024 | | | 2023 | |
Items included in accumulated other comprehensive loss: | | | | | | | | |
Adjustment to pension liability | | $ | (8 | ) | | $ | (7 | ) |
Adjustment to fair value of interest rate caps | | | (31 | ) | | | (23 | ) |
Income tax benefit | | | (9 | ) | | | (7 | ) |
Accumulated other comprehensive loss | | $ | (30 | ) | | $ | (23 | ) |
Recent Accounting Pronouncements. In December 2023, the Financial Accounting Standards Board (“FASB”) issued Accounting Standards Update (“ASU”) 2023-09, Income Taxes (Topic 740), Improvements to Income Tax Disclosures. The purpose of this amendment was to enhance the transparency and decision usefulness of income tax disclosures. The amendments in this ASU are effective for annual periods beginning after December 15, 2024. Currently we do not expect that the implementation of these changes will have a material effect on our financial statements.
In November 2024, the FASB issued ASU 2024-03, Income Statement—Reporting Comprehensive Income—Expense Disaggregation Disclosures (Subtopic 220-40), Disaggregation of Income Statement Expenses. The purpose of this amendment was to improve the disclosures about a public business entity’s expenses and address requests from investors for more detailed information about the types of expenses in commonly presented expense captions. The amendments in this ASU are effective for annual reporting periods beginning after December 15, 2026, and interim reporting periods beginning after December 15, 2027. Currently we do not expect that the implementation of these changes will have a material impact on our financial statements.
In addition to the accounting standards described above, certain amounts have also been reclassified to conform to the current presentation.
Revenue Recognition. We recognize revenue when we have completed a specified service and effectively transferred the control of that service to a customer in return for an amount of consideration we expect to be entitled to receive. The amount of revenue recognized is determined by the amount of consideration specified in a contract with our customers. We have elected to exclude taxes assessed by a governmental authority on transactions with our customers from our revenue. Any unremitted balance is included in current liabilities on our balance sheets.
Advertising Revenue. Broadcast advertising revenue is generated primarily from the broadcast of television advertising time to local, national and political advertisers, including digital advertising revenue. Most advertising contracts are short-term, and generally run only for a few weeks. Our performance obligation is satisfied when the advertisement is broadcast or appears on our stations’ websites or mobile applications. Advertising revenue is recognized when the performance obligation is satisfied and then billed to the customer in the period the revenue is recognized. We have an unconditional right to receive payment of the amount billed generally within 30 days of the invoice date. Payment terms are expressly stated in our standard terms and conditions. The invoiced amount to be received is recorded in accounts receivable on our balance sheets.
We broadcast the customer’s advertisement either preceding or following a television station’s network programming and within local and syndicated programming. Broadcast advertising is sold in time increments and is priced primarily on the basis of a program’s popularity among the specific audience an advertiser desires to reach. In addition, broadcast advertising rates are affected by the number of advertisers competing for the available time, the size and demographic makeup of the market served by the station and the availability of alternative advertising media in the market area. Broadcast advertising rates are generally the highest during the most desirable viewing hours, with corresponding reductions during other hours. The ratings of a local station affiliated with a major network can be affected by ratings of network programming. Digital advertising is placed on our stations’ websites and mobile applications. These advertisements may be in the form of banner advertisements, pre-roll advertisements or video and other types of advertisements or sponsorships.
We generate advertising revenue either by the efforts of our direct sales employees or through third-party advertising agency intermediaries. Third party advertising intermediaries represent the customer and contract with us to deliver broadcast or digital advertising for the customer.
Retransmission Consent Revenue. We enter into license agreements with cable, satellite, multichannel video programming distributors and digital delivery system (or “OTT”) customers (collectively “MVPD”) that provide them the right to use our broadcast signal for retransmission across the MVPD system for an agreed period of time. These agreements represent a sales-based and usage-based functional intellectual property license based on the number of subscribers to the licensee’s delivery systems. Our performance obligation is to provide the licensee with access to our intellectual property when it is broadcast. The duration of the typical retransmission consent contract is three years. Retransmission consent revenue is recognized continuously during the period of the contract as we transmit our broadcast signal to the MVPD. The amount of revenue recognized is determined based upon a fixed rate per subscriber multiplied by the number of active subscribers to our MVPD customer systems for the given month. We bill our MVPD customers monthly over the life of the retransmission consent contract. We have an unconditional right to receive payment of the amount billed generally within 30 days from the invoice date. Payment terms are expressly stated in our retransmission consent contracts as well as in the standard terms and conditions. The invoiced amount to be received is recorded in accounts receivable on our balance sheets.
Subscriber data necessary to calculate the amount of retransmission consent revenue to be recognized for the current month is not received until subsequent to that month. We estimate the current month retransmission consent revenue based upon the subscriber data from the most recent subscriber report by the MVPD. We record the estimate in the current month as retransmission consent revenue and then adjust the amount recorded in that month when we receive the actual subscriber data. We typically have monthly adjustments to our revenue to account for changes in MVPD subscribers on a monthly basis, however, the number of MVPD subscribers does not change materially on a monthly basis and this adjustment does not materially impact our recorded retransmission consent revenue on a quarterly or annual basis.
Production Company Revenue. Our production company revenues include sports marketing, production and event management, sports and entertainment production services and automotive programming production and marketing solutions. We recognize revenue of marketing, production and events at the time the events are aired or delivered. We recognize advertising revenues related to the events when the advertisements are aired. Sponsorship revenue is recognized ratably over the contractual period of the sponsorship. Included in this category is revenue earned under lease agreements for use of our Assembly Studios and Third Rail Studios production facilities by third parties.
Other Revenues. Other revenues consist of production, tower rental and other miscellaneous items. Production revenue is derived from the production of programming. Production revenue is recognized as the programming is produced. Tower rental income is recognized monthly over the life of the lease. All of our leases under which we are lessor are considered operating leases. Other revenue is comprised of one-time or infrequently occurring special projects, dubbing, fees and other miscellaneous items. Other revenue is recognized as the services are performed. Other revenue is generated by our direct sales employees.
Expedients. We expense direct and agency commissions when incurred because our advertising contracts are one year or less in duration and the amortization period for capitalized expenses would be less than one year. Direct commissions are included in broadcast operating expense and agency commissions are netted against gross revenue in our consolidated statements of operations.
The nature of our contracts with advertising customers is such that our performance obligations arise and are satisfied concurrent with the broadcast or web placement of the advertisement. We did not have material incomplete or unsatisfied performance obligations at the end of any period presented.
Deferred Revenue. We record a deferred revenue for cash deposits received from our customers that are to be applied as payment once the performance obligation arises and is satisfied. These deposits are recorded as deferred revenue on our consolidated balance sheet as advertising deposit liabilities. When we invoice our customers for completed performance obligations, we are unconditionally entitled to receive payment of the invoiced amounts. Therefore, we record invoiced amounts in accounts receivable on our balance sheet. We generally require amounts payable under advertising contracts with our political advertising customers to be paid for in advance. We record the receipt of this cash as an advertising deposit liability. Once the advertisement has been broadcast, the revenue is earned, and we record the revenue and reduce the balance in this deposit liability account. We recorded $13 million of revenue in the year ended December 31, 2024 that was included in the advertising deposit liability balance as of December 31, 2023. We also record other deposit liabilities for cash received in advance for other arrangements, for which revenue is recorded as earned in future periods.
The following table presents our deferred revenue by type (in millions):
| | | December 31, | |
| | | 2024 | | | 2023 | |
| | | | | | | | | |
Advertising deposit liabilities | | $ | 12 | | | $ | 13 | |
Other deposit liabilities | | | 17 | | | | 10 | |
Total deferred revenue | | $ | 29 | | | $ | 23 | |
Disaggregation of Revenue. Revenue from our broadcast segment is generated through both our direct and advertising agency intermediary sales channels. Revenue from our production companies segment is generated through our direct sales channel. The following table presents our revenue from contracts with customers disaggregated by type of service and sales channel (in millions):
| | | Year Ended December 31, | |
| | | 2024 | | | 2023 | | | 2022 | |
Market and service type: | | | | | | | | | | | | |
Advertising: | | | | | | | | | | | | |
Core | | $ | 1,490 | | | $ | 1,514 | | | $ | 1,496 | |
Political | | | 497 | | | | 79 | | | | 515 | |
Total advertising | | | 1,987 | | | | 1,593 | | | | 2,011 | |
Retransmission consent | | | 1,482 | | | | 1,532 | | | | 1,496 | |
Production companies | | | 105 | | | | 86 | | | | 93 | |
Other | | | 70 | | | | 70 | | | | 76 | |
Total revenue | | $ | 3,644 | | | $ | 3,281 | | | $ | 3,676 | |
| | | | | | | | | | | | | |
Sales channel: | | | | | | | | | | | | |
Direct | | $ | 2,236 | | | $ | 2,225 | | | $ | 2,163 | |
Advertising agency intermediary | | | 1,408 | | | | 1,056 | | | | 1,513 | |
Total revenue | | $ | 3,644 | | | $ | 3,281 | | | $ | 3,676 | |
3. | Acquisitions and Divestitures |
During 2024, 2023 and 2022, we completed a number of acquisition and divestiture transactions. The acquisition transactions were and are expected to, among other things, increase our revenues and cash flows from operating activities, and allow us to operate more efficiently and effectively by increasing our scale and providing us, among other things, with the ability to negotiate more favorable terms in our agreements with third parties. For each television station described, the DMA rank presented is the DMA rank at the time of acquisition.
2024 Acquisition and Divestitures
On July 1, 2024, we completed transactions with Marquee Broadcasting, Inc. (“Marquee”) in which we sold our television stations KCWY (NBC) in the Casper, Wyoming market (DMA 198) and KGWN (CBS) in the Cheyenne, Wyoming market (DMA 194) in exchange for Marquee’s FCC permit authorizing the construction of a new television station, to be built in the Salt Lake City, Utah market (DMA 27), which will be known as KCBU. No cash or other consideration was exchanged to fulfill the terms of this exchange.
The value of the construction permit acquired from Marquee is $1 million, which is based upon management’s estimate of the fair value using valuation techniques including income, cost and market approaches. In determining the fair value of the acquired asset, the fair values were determined based on, among other factors, expected future revenue and cash flows, expected future growth rates and estimated discount rates.
The acquisition of the construction permit for station KCBU and the sale of television stations KCWY and KGWN resulted in a net non-cash loss on disposal of $14 million.
In addition, we acquired broadcast licenses totaling approximately $1 million that did not qualify as acquisitions of businesses.
BMI Investment Sale
On February 8, 2024, we received $110 million in pre-tax cash proceeds from the closing of the sale of Broadcast Music, Inc. (“BMI”) to a shareholder group led by New Mountain Capital, LLC. Our basis in this investment was not material and the related gain was recorded in miscellaneous income, net.
2023 Acquisition and Divestiture
On May 1, 2023, we and Marquee completed transactions in which we sold television station KNIN (FOX) in the Boise, Idaho market (DMA 102) for $6 million, and purchased television station WPGA (MeTV) in the Macon, Georgia market (DMA 126) for $6 million.
The following table summarizes the values of the assets acquired of WPGA (in millions):
Property and equipment | | $ | 2 | |
Broadcast licenses | | | 4 | |
Total | | $ | 6 | |
These amounts are based upon management’s estimate of the fair values using valuation techniques including income, cost and market approaches. In determining the fair value of the acquired assets, the fair values were determined based on, among other factors, expected future revenue and cash flows, expected future growth rates and estimated discount rates.
Property and equipment are recorded at their fair value and are being depreciated over their estimated useful lives ranging from 3 to 40 years.
In this transaction, an immaterial amount of goodwill was acquired.
The sale of television station KNIN resulted in a loss on disposal of $14 million.
2022 Acquisition
On April 1, 2022, we acquired television station WKTB-TV the Telemundo Network Group, LLC affiliate in the Atlanta, Georgia market (DMA 6), as well as certain digital media assets, for a combined purchase price of $31 million, using cash on hand (the “Telemundo Atlanta Transaction”).
The following table summarizes the values of the assets acquired and resulting goodwill of the Telemundo Atlanta Transaction (in millions):
Accounts receivable, net | | $ | 1 | |
Property and equipment | | | 1 | |
Goodwill | | | 10 | |
Broadcast licenses | | | 1 | |
Network affiliation | | | 14 | |
Other intangible assets | | | 4 | |
Total | | $ | 31 | |
These amounts are based upon management’s estimate of the fair values using valuation techniques including income, cost and market approaches. In determining the fair value of the acquired assets and assumed liabilities, the fair values were determined based on, among other factors, expected future revenue and cash flows, expected future growth rates and estimated discount rates.
Property and equipment are recorded at their fair value and are being depreciated over their estimated useful lives ranging from 3 to 40 years.
Amounts related to network affiliation and other intangible assets are being amortized over their estimated useful lives of approximately 1 to 4 years.
Goodwill is calculated as the excess of the consideration transferred over the fair value of the identifiable net assets acquired and liabilities assumed, and represents the future economic benefits expected to arise from other intangible assets acquired that do not qualify for separate recognition, as well as future synergies that we expect to generate from each acquisition. The goodwill recognized related to this acquisition is deductible for income tax purposes.
In addition, we acquired broadcast licenses totaling approximately $27 million that did not qualify as acquisitions of businesses.
As of December 31, 2024 and 2023, long-term debt consisted of obligations under our 2019 Senior Credit Facility (as defined below), our 5.875% senior notes due 2026 (the “2026 Notes”), our 7.0% senior notes due 2027 (the “2027 Notes”), our 10.5% senior notes due 2029 (the “2029 Notes”), our 4.75% senior notes due 2030 (the “2030 Notes”) and our 5.375% senior notes due 2031 (the “2031 Notes”) as follows (in millions):
| | | December 31, | |
| | | 2024 | | | 2023 | |
Long-term debt: | | | | | | | | |
2019 Senior Credit Facility: | | | | | | | | |
2019 Term Loan (matures January 2, 2026) | | $ | - | | | $ | 1,190 | |
2021 Term Loan (matures December 1, 2028) | | | 1,395 | | | | 1,470 | |
2024 Term Loan (matures June 4, 2029) | | | 498 | | | | - | |
2026 Notes (matures July 15, 2026) | | | 10 | | | | 700 | |
2027 Notes (matures May 15, 2027) | | | 528 | | | | 750 | |
2029 Notes (matures July 15, 2029) | | | 1,250 | | | | - | |
2030 Notes (matures October 15, 2030) | | | 790 | | | | 800 | |
2031 Notes (matures November 15, 2031) | | | 1,219 | | | | 1,300 | |
Total outstanding principal, including current portion | | | 5,690 | | | | 6,210 | |
Unamortized deferred loan costs - Senior Credit Facility | | | (34 | ) | | | (18 | ) |
Unamortized deferred loan costs - 2026 Notes | | | - | | | | (3 | ) |
Unamortized deferred loan costs - 2027 Notes | | | (3 | ) | | | (6 | ) |
Unamortized deferred loan costs - 2029 Notes | | | (12 | ) | | | - | |
Unamortized deferred loan costs - 2030 Notes | | | (8 | ) | | | (10 | ) |
Unamortized deferred loan costs - 2031 Notes | | | (12 | ) | | | (14 | ) |
Unamortized premium - 2026 Notes | | | - | | | | 1 | |
Less current portion | | | (20 | ) | | | (15 | ) |
Long-term debt, less current portion and deferred financing costs | | $ | 5,601 | | | $ | 6,145 | |
| | | | | | | | | |
Borrowing availability under Revolving Credit Facility | | $ | 674 | | | $ | 494 | |
2024 Refinancing Activities. On June 3, 2024, we issued $1.25 billion in aggregate principal amount of 10.5% Senior Secured First Lien Notes due 2029 (the “2029 Notes”) pursuant to an indenture, dated as of June 3, 2024, between us, the guarantors party thereto and U.S. Bank Trust Company, National Association, as trustee and collateral agent (the “2029 Notes Indenture”). The 2029 Notes were issued at par. Interest in the 2029 Notes accrues from June 3, 2024, and is payable semiannually, on January 15 and July 15 of each year, beginning on January 15, 2025.
The net proceeds from the 2029 Notes were used, together with the net proceeds from a $500 million tranche F term loan (the “2024 Term Loan”) and a $150 million draw under our Revolving Credit Facility (as defined below), both under the Senior Credit Facility (as defined below), and cash on hand, to fully pre-pay our $1.2 billion tranche E 2019 Term Loan under the Senior Credit Facility; repurchase in a tender offer $690 million of face value of our outstanding 5.875% 2026 Notes; and pay all costs and accrued interest in connection with the offering.
The 2029 Notes and related guarantees are our senior secured first lien obligations. The 2029 Notes rank:
● | equally in right of payment with all of our existing and future pari passu senior debt; senior in right of payment to all of our existing and future subordinated debt; |
● | effectively senior to all of our existing and future unsecured debt or junior lien debt to the extent of the value of the collateral securing the 2029 Notes; |
● | effectively subordinated to any existing and future debt that is secured by a lien on any assets not constituting collateral securing the 2029 Notes to the extent of the value of such assets; and |
● | structurally subordinated to any existing and future debt and liabilities of our subsidiaries that do not guarantee the 2029 Notes. |
On June 4, 2024, we entered into a third amendment to the Fifth Amended and Restated Credit Agreement (the “Third Amendment” and as amended, including by the Third Amendment, the “Senior Credit Facility”), dated as of December 1, 2021.
The Third Amendment, among other things, provided for (i) the new $500 million 2024 Term Loan and (ii) increased aggregate commitments under our existing $552.5 million revolving credit facility (the “Revolving Credit Facility”) that matures December 31, 2027 by $127.5 million, and a concurrent termination of the separate commitments under a $72.5 million tranche of revolving commitments that were to mature on December 1, 2026, resulting in aggregate commitments under the Revolving Credit Facility of $680 million.
The 2024 Term Loan bears interest, at our option, at either the Secured Overnight Financing Rate (“SOFR”) plus an applicable margin or the Base Rate plus an applicable margin. “Base Rate” is defined as the greatest of (i) the administrative agent’s prime rate, (ii) the overnight federal funds rate plus 0.50% and (iii) Adjusted Term SOFR (as defined in the Senior Credit Facility) for a one-month tenor in effect on such day plus 1.0%. The applicable margin with respect to the 2024 Term Loan is 5.25% for all SOFR borrowings and 4.25% for all Base Rate borrowings. The 2024 Term Loan also requires us to make quarterly principal reductions of $1.25 million beginning September 30, 2024. To the extent all or any portion of the 2024 Term Loan is repaid or prepaid prior to the one year anniversary of the effective date of the Third Amendment, a prepayment fee equal to 1.0% of the amount of the 2024 Term Loan being repaid or prepaid will apply.
The Revolving Credit Facility bears interest, at our option, based on SOFR plus 1.75%-2.75% or the Base Rate plus 0.75%-1.75%, in each case based on a first lien leverage ratio (the “First Lien Leverage Ratio”) as set forth in the Senior Credit Facility. The Company is required to pay a commitment fee on the average daily unused portion of the Revolving Credit Facility, which rate may range from 0.375% to 0.5%, based on the First Lien Leverage Ratio.
The costs associated with these 2024 refinancing activities totaled $47 million, of which $45 million were capitalized as deferred loan costs, to be amortized over the lives of the respective debt obligations. Our loss from the early extinguishment of debt for these 2024 refinancing activities was $10 million, which was composed of expensing of the remaining $4 million of costs and the write-off of $6 million of unamortized deferred loan costs and premiums related to the debts that were pre-paid.
Repurchase of Debt. On May 6, 2024, our Board of Directors authorized us to use up to $250 million of available liquidity to repurchase our outstanding indebtedness. This authorization has been replenished and extended through December 31, 2025. The extent of such repurchases, including the amount and timing of any repurchases, will depend on general market conditions, regulatory requirements, alternative investment opportunities and other considerations. This repurchase program does not require us to repurchase a minimum amount of debt, and it may be modified, suspended or terminated at any time without prior notice. During the year ended December 31, 2024, we used $327 million of cash to purchase and retire a total of $373 million of the outstanding principal amount of our 2019 Term Loan, 2027 Notes, 2030 Notes and 2031 Notes in the open market. These open market transactions resulted in a gain of $46 million, excluding the write-off of a proportional amount of the deferred financing costs related to each of the outstanding debt amounts that were retired.
Interest Rate Caps. On February 23, 2023, we entered into two interest rate caps pursuant to an International Swaps and Derivatives Association Master Agreement (the “ISDA Master Agreement”) with two counterparties, Wells Fargo Bank, NA and Truist Bank, respectively. On June 25, 2024, we amended the notional amount of the interest rate caps in order to better match the outstanding amounts of the related outstanding indebtedness. At December 31, 2024, the caps had a combined notional value of approximately $1.9 billion and mature on December 31, 2025. The interest rate caps protect us against adverse fluctuations in interest rates by reducing our exposure to variability in cash flows on a portion of our variable-rate debt. The interest rate caps are designated as cash flow hedges of our risk of changes in our cash flows attributable to changes in 1-month SOFR on our outstanding variable-rate debt in accordance with ASC 815. We elected to apply the optional expedient in ASC 848, Reference Rate Reform, that enabled us to consider the amended swaps a continuation of the existing contracts. As a result, the transition did not have an impact on our hedge accounting or a material impact to our financial statements.
The interest rate caps, as amended, effectively limit the annual interest charged on our 2021 Term Loan and our 2024 Term Loan to a maximum of 1-month Adjusted Term SOFR of 4.96% and 5.047%. We are required to pay aggregate fees in connection with the interest rate caps of approximately $34 million that is due and payable at maturity on December 31, 2025. On the initial designation date, we recognized an asset and corresponding liability for the deferred premium payable equal to $34 million. The asset is amortized into interest expense straight-line over the term of the hedging relationship. At December 31, 2024 and 2023, the recorded value of the asset was $12 million and $24 million, net of accumulated amortization, respectively. At December 31, 2024 and 2023, the fair value of the derivative liability was $32 million and $23 million, respectively. We present the deferred premium, the asset, and the fair value of the derivative, net within other non-current liabilities in our condensed consolidated balance sheets.
The ISDA Master Agreement, together with its related schedules, contain customary representations, warranties and covenants. The interest rate caps were not entered into for speculative trading purposes. Changes in the fair value of the interest rate caps are reported as a component of other comprehensive income. Actual gains and losses are reclassified into earnings in the same period or periods during which the hedged transaction affects earnings and are presented in the same income statement line item as the earnings effect of the hedged transaction. Gains and losses on the derivative instrument representing hedge components excluded from the assessment of effectiveness are recognized currently in earnings and are presented in the same line of the income statement for the hedged item. We recognized $12 million and $10 million, respectively, of amortization expense for the asset during the years ended December 31, 2024 and 2023, which is included as a component of cash flows from operating activities in our condensed consolidated statements of cash flows. Cash flows received from the counterparties pursuant to the interest rate caps are included as components of cash flows from financing activities in our condensed consolidated statements of cash flows. During the years ended December 31, 2024 and 2023, we received $6 million and $4 million, respectively, of cash payments from the counterparties that we reclassified as reductions of interest expense from the interest rate caps in our condensed consolidated statements of operations.
For all of our interest bearing obligations, we made interest payments of approximately $394 million, $419 million and $339 million during the years ended December 31, 2024, 2023 and 2022, respectively. During the years ended December 31, 2024, 2023 and 2022, we capitalized $2 million, $20 million and $9 million of interest payments, respectively, related to the Assembly Atlanta project.
As of December 31, 2024, the aggregate minimum principal maturities of our long-term debt were as follows (in millions):
| | | Minimum Principal Maturities | |
| | | 2019 Senior | | | 2026 | | | 2027 | | | 2029 | | | 2030 | | | 2031 | | | | | |
Year | | Credit Facility | | | Notes | | | Notes | | | Notes | | | Notes | | | Notes | | | Total | |
2025 | | $ | 20 | | | $ | - | | | $ | - | | | $ | - | | | $ | - | | | $ | - | | | $ | 20 | |
2026 | | | 20 | | | | 10 | | | | - | | | | - | | | | - | | | | - | | | | 30 | |
2027 | | | 20 | | | | - | | | | 528 | | | | - | | | | - | | | | - | | | | 548 | |
2028 | | | 1,355 | | | | - | | | | - | | | | - | | | | - | | | | - | | | | 1,355 | |
2029 | | | 478 | | | | - | | | | - | | | | 1,250 | | | | - | | | | - | | | | 1,728 | |
Thereafter | | | - | | | | - | | | | - | | | | - | | | | 790 | | | | 1,219 | | | | 2,009 | |
Total | | $ | 1,893 | | | $ | 10 | | | $ | 528 | | | $ | 1,250 | | | $ | 790 | | | $ | 1,219 | | | $ | 5,690 | |
Collateral, Covenants and Restrictions of our Credit Agreements. Our obligations under the Senior Credit Agreement and the 2029 Notes are secured by substantially all of our consolidated assets, excluding real estate. In addition, substantially all of our subsidiaries are joint and several guarantors of, and our ownership interests in those subsidiaries are pledged to collateralize, our obligations under the Senior Credit Agreement. Gray Media, Inc. is a holding company, and has no material independent assets or operations. For all applicable periods, the 2026 Notes, 2027 Notes, 2030 Notes and 2031 Notes have been fully and unconditionally guaranteed, on a joint and several, senior unsecured basis, by substantially all of Gray Media, Inc.’s subsidiaries. Any subsidiaries of Gray Media, Inc. that do not guarantee the 2026 Notes, 2027 Notes, 2030 Notes and 2031 Notes are not material or are designated as unrestricted under the Senior Credit Agreement. As of December 31, 2024, there were no significant restrictions on the ability of Gray Media, Inc.’s subsidiaries to distribute cash to Gray or to the guarantor subsidiaries.
The 2019 Senior Credit Facility contains affirmative and restrictive covenants with which we must comply, including: (a) limitations on additional indebtedness, (b) limitations on liens, (c) limitations on the sale of assets, (d) limitations on guarantees, (e) limitations on investments and acquisitions, (f) limitations on the payment of dividends and share repurchases, (g) limitations on mergers and (h) maintenance of the First Lien Leverage Ratio while any amount is outstanding under the revolving credit facility, as well as other customary covenants for credit facilities of this type. The 2026 Notes, 2027 Notes, 2029 Notes, 2030 Notes and 2031 Notes include covenants with which we must comply which are typical for borrowing transactions of their nature. As of December 31, 2024 and 2023, we were in compliance with all required covenants under all of our debt obligations.
We measure certain assets and liabilities at fair value, which are classified by the FASB Codification within the fair value hierarchy as level 1, 2 or 3, on the basis of whether the measurement employs observable or unobservable inputs. Observable inputs reflect market data obtained from independent sources, while unobservable inputs reflect the Company’s own assumptions and consider information about readily available market participant assumptions.
| | ● | Level 1: Quoted prices for identical instruments in active markets. |
| | ● | Level 2: Quoted prices for similar instruments in active markets; quoted prices for identical or similar instruments in markets that are not active; and model-derived valuations in which all significant inputs and significant value drivers are observable in active markets. |
| | ● | Level 3: Valuations derived from valuation techniques in which one or more significant inputs or significant value drivers are unobservable. |
Fair value is defined as the price that would be received to sell an asset, or paid to transfer a liability, in an orderly transaction between market participants at the measurement date. The use of different market assumptions or methodologies could have a material effect on the fair value measurement.
The carrying amounts of accounts receivable, prepaid and other current assets, accounts payable, employee compensation and benefits, accrued interest, other accrued expenses and deferred revenue approximate fair value at both December 31, 2024 and 2023.
The value of all of our investments in broadcasting and technology companies are classified as Level 3.
As of December 31, 2024, the carrying amount of our long-term debt was $5.6 billion and the fair value was $4.6 billion. As of December 31, 2023, the carrying amount of our long-term debt was $6.2 billion and the fair value was $5.6 billion. Fair value of our long-term debt is based on observable estimates provided by third-party financial service providers and is classified as Level 2.
We are authorized to issue 245 million shares in total of all classes of stock consisting of 25 million shares of Class A common stock, 200 million shares of common stock, and 20 million shares of “blank check” preferred stock for which our Board of Directors has the authority to determine the rights, powers, limitations and restrictions. The rights of our common stock and Class A common stock are identical, except that our Class A common stock has 10 votes per share and our common stock has one vote per share.
Our common stock and Class A common stock are entitled to receive cash dividends, if declared, on an equal per-share basis. During the years ended December 31, 2024, 2023 and 2022, we declared and paid quarterly cash dividends totaling $0.32 per share of our common stock and Class A common stock.
On May 5, 2022, our shareholders approved, and our Board of Directors adopted, our 2022 Equity and Incentive Compensation Plan (the “2022 EICP”). The 2022 EICP replaced our 2017 Equity and Incentive Compensation Plan. Under 2022 EICP, we may, at our discretion, issue authorized and unissued shares, or previously issued shares held in treasury, of our Class A common stock or common stock. As of December 31, 2024, we had reserved three million shares and one million shares of our common stock and Class A common stock, respectively, for future issuance under our 2022 EICP. As of December 31, 2024, we also have 10 million shares of our common stock reserved for issuance under the 401(k) Plan (as defined below).
At December 31, 2024 and 2023 there were 650,000 shares of our Series A Perpetual Preferred Stock outstanding with a stated face value and liquidation value of $1,000 per share (the “Series A Preferred Stock”). Holders of shares of the Series A Preferred Stock are entitled to receive mandatory and cumulative dividends paid quarterly in cash or, at the Company’s option, paid quarterly in kind by issuance of additional shares of Series A Preferred Stock. The per-share amount of such quarterly mandatory and cumulative dividends will be calculated by multiplying the face value by 8% per annum if the dividends are to be paid in cash, or 8.5% per annum if such dividends are to be paid in additional shares of Series A Preferred Stock (“PIK Election Dividends”). If the Company elects to pay any portion of accrued dividends with PIK Election Dividends, it will be prohibited from repurchasing, redeeming or paying dividends on any stock that is junior to the Series A Preferred Stock through the end of that quarter and the subsequent two quarters, subject to certain exceptions.
With respect to the payment of dividends, the Series A Preferred Stock will rank senior to all classes and series of our common stock and all other equity securities designated as ranking junior to the Series A Preferred Stock, and no new issuances of common or preferred stock will rank on a parity with, nor senior to, the Series A Preferred Stock.
All or any portion of the outstanding Series A Preferred Stock may be redeemed at the Company’s option at any time, upon written notice to the holders of Series A Preferred Stock at least 30 and not more than 60 days prior to the date of such optional redemption. The per-share redemption price for Series A Preferred Stock will be equal to the sum of the liquidation value and the per-share amount of any unpaid dividends for the current quarterly dividend period, up to and including the date of redemption. Holders of shares of Series A Preferred Stock redeemed will be paid in cash.
The Series A Preferred Stock is also subject to mandatory redemption upon the occurrence of certain change of control transactions or upon the sale or other disposition of all or substantially all of our assets. The holders of Series A Preferred Stock do not have any right to exchange or convert the shares into any other securities.
In general, the holders of the Series A Preferred Stock do not have any voting rights except as set forth in the terms of the Series A Preferred Stock or as otherwise required by law, in which case, each share of Series A Preferred Stock will be entitled to one vote.
The approval of the holders of the Series A Preferred Stock, voting separately as a class, is required in order to authorize, create or issue new shares of Series A Perpetual Preferred stock (other than to pay dividends), or alter the rights of any other shares that are or would be equal to or senior to the Series A Preferred Stock, or to amend, alter or repeal the articles of incorporation as amended from time to time if such amendment, alteration or repeal adversely affects the powers, preferences or special rights of the Series A Preferred Stock.
The Series A Preferred Stock does not have preemptive rights as to any of our other securities, or any warrants, rights, or options to acquire any of our securities.
In the event that the Company voluntarily or involuntarily liquidates, dissolves or winds up its affairs, holders of Series A Preferred Stock will be entitled to receive for each share of Series A Preferred Stock, out of the Company’s assets or proceeds thereof available for distribution to shareholders, subject to the rights of any creditors, payment in full in an amount equal to the liquidation value and the per-share amount of any unpaid dividends for the current quarterly dividend period. Holders of Series A Preferred Stock would be entitled to receive this amount before any distribution of assets or proceeds to holders of our common stock and any other stock whose rights are junior to the Series A Preferred Stock. If in any distribution described above, our assets are not sufficient to pay in full the amounts payable with respect to the outstanding shares of Series A Preferred Stock or any stock whose rights are equal to the Series A Preferred Stock, holders of the Series A Preferred Stock would share ratably in any such distribution in proportion to the full respective distributions to which they are entitled. Shareholders are not subject to further assessments on their shares of the Series A Preferred Stock.
8. | Stock-Based Compensation |
We recognize compensation expense for stock-based payment awards made to our employees, consultants and directors under our active stock-based compensation plan, the “2022 EICP”. The following table presents our stock-based compensation expense and the related income tax benefits for the years ended December 31, 2024, 2023 and 2022 (in millions):
| | | Year Ended December 31, | |
| | | 2024 | | | 2023 | | | 2022 | |
Stock-based compensation expense, gross | | $ | 22 | | | $ | 20 | | | $ | 22 | |
Income tax benefit at our statutory rate associated with stock-based compensation | | | (6 | ) | | | (5 | ) | | | (6 | ) |
Stock-based compensation expense, net | | $ | 16 | | | $ | 15 | | | $ | 16 | |
Currently, the 2022 EICP provides for the grant of incentive stock options, nonqualified stock options, restricted stock awards, restricted stock unit awards, stock appreciation rights and performance awards to acquire shares of our Class A common stock or common stock, or other awards based on our performance. All shares of common stock and Class A common stock underlying outstanding options (if any), restricted stock units and performance awards are counted as issued under the 2022 EICP for purposes of determining the number of shares available for future issuance.
As of December 31, 2024, we had $16 million of total unrecognized compensation expense related to all non-vested stock-based compensation arrangements. This expense is expected to be recognized over a period of 1.5 years.
A summary of activity for the years ended December 31, 2024, 2023 and 2022 under our stock based compensation plans is as follows:
| | | Year Ended December 31, | |
| | | 2024 | | | 2023 | | | 2022 | |
| | | | | | | Weighted- | | | | | | | Weighted- | | | | | | | Weighted- | |
| | | | | | | Average | | | | | | | Average | | | | | | | Average | |
| | | Number | | | Grant Date | | | Number | | | Grant Date | | | Number | | | Grant Date | |
| | | of | | | Fair Value | | | of | | | Fair Value | | | of | | | Fair Value | |
| | | Shares | | | Per Share | | | Shares | | | Per Share | | | Shares | | | Per Share | |
| | | | | | | | | | | | | | | | | | | | | | | | | |
Restricted stock - common: | | | | | | | | | | | | | | | | | | | | | | | | |
Outstanding - beginning of period | | | 1,467,936 | | | $ | 12.17 | | | | 997,745 | | | $ | 20.62 | | | | 1,035,728 | | | $ | 19.69 | |
Granted | | | 1,785,958 | | | | 7.47 | | | | 1,007,919 | | | | 8.15 | | | | 400,927 | | | | 21.68 | |
Vested | | | (556,187 | ) | | | 12.51 | | | | (537,728 | ) | | | 20.32 | | | | (438,910 | ) | | | 19.38 | |
Forfeited | | | (130,000 | ) | | | 8.10 | | | | - | | | | - | | | | - | | | | - | |
Outstanding - end of period | | | 2,567,707 | | | $ | 9.03 | | | | 1,467,936 | | | $ | 12.17 | | | | 997,745 | | | $ | 20.62 | |
| | | | | | | | | | | | | | | | | | | | | | | | | |
Restricted stock - Class A common: | | | | | | | | | | | | | | | | | | | | | | | | |
Outstanding - beginning of period | | | 1,148,233 | | | $ | 12.37 | | | | 677,238 | | | $ | 19.36 | | | | 720,421 | | | $ | 18.22 | |
Granted | | | 823,393 | | | | 8.25 | | | | 738,854 | | | | 8.34 | | | | 250,448 | | | | 20.52 | |
Vested | | | (382,606 | ) | | | 14.24 | | | | (267,859 | ) | | | 18.95 | | | | (293,631 | ) | | | 17.55 | |
Outstanding - end of period | | | 1,589,020 | | | $ | 9.78 | | | | 1,148,233 | | | $ | 12.37 | | | | 677,238 | | | $ | 19.36 | |
| | | | | | | | | | | | | | | | | | | | | | | | | |
Restricted stock units - common: | | | | | | | | | | | | | | | | | | | | | | | | |
Outstanding - beginning of period | | | 587,168 | | | $ | 11.50 | | | | 274,145 | | | $ | 23.60 | | | | 125,247 | | | $ | 19.02 | |
Granted | | | 1,229,390 | | | | 5.72 | | | | 587,168 | | | | 11.50 | | | | 259,079 | | | | 23.87 | |
Vested | | | (564,793 | ) | | | 11.50 | | | | (247,953 | ) | | | 23.64 | | | | (108,921 | ) | | | 19.03 | |
Forfeited | | | (22,375 | ) | | | 11.50 | | | | (26,192 | ) | | | 23.15 | | | | (1,260 | ) | | | 19.05 | |
Outstanding - end of period | | | 1,229,390 | | | $ | 5.72 | | | | 587,168 | | | $ | 11.50 | | | | 274,145 | | | $ | 23.60 | |
Operating Leases. We lease various assets with non-cancellable lease terms that range between one and 99 years. Many of these leases have optional renewal periods ranging between one and 20 years. We define the lease term as the original lease base period plus optional renewal periods that we reasonably expect to exercise. We do not include renewal periods exercisable more than 10 years from the commencement date in the lease term as we cannot reasonably expect to exercise an option that far into the future. Some of our leases have free rent periods, tenant allowances and/or fixed or variable rent escalators. We record operating lease expense on a straight-line basis over the lease term. Operating lease expense is included in operating expenses in our consolidated statements of operations.
We lease land, buildings, transmission towers, right of way easements and equipment through operating leases. We generally lease land for the purpose of erecting transmission towers for our broadcast operations. Our building leases consist of office space and broadcast studios. For transmission towers we do not own, we lease space for our transmission equipment on third-party towers. We lease right-of-ways for various purposes, including ingress and egress for tower locations and guyed wire space. Our equipment leases consist of office, transmission and production equipment.
We allocate consideration paid in the contract to lease and non-lease components based upon the contract or associated invoice received if applicable. Lease components include base rent, fixed rate escalators and in-substance fixed payments associated with the leased asset. Non-lease components include common area maintenance and operating expenses associated with the leased asset. We have not elected the practical expedient to combine lease and non-lease components. As such, we only include the lease component in the calculation of right of use (“ROU”) asset and lease liability. The incremental borrowing rate we use for the calculation is the rate of interest that we would pay to borrow on a collateralized basis over a similar term based upon our borrower risk profile.
Variable lease payments are not material and are included in operating lease expense as a component of operating expenses in our consolidated statement of operations. Variable lease payments are generally associated with usage-based leases and variable payment escalators, such as consumer price index (“CPI”) increases. Some of our land leases require us to pay a percentage of the revenue earned from leasing space on the towers we erect on the leased land. We included the payment level of CPI and percentage rent amounts in the base rent for calculating the ROU asset and lease liability. CPI adjustments and percentage rent amounts that differ from the amount included in ROU asset and liability calculations are included in variable lease payments.
We recognize leases with an initial term of 12 months or less as short-term leases and generally consist of rentals of production or broadcast equipment for short periods of time. Lease payments associated with short-term leases are expensed as incurred.
As of December 31, 2024, the weighted average remaining term of our operating leases was nine years. The weighted average discount rate used to calculate the values associated with our operating leases was 6.7%. The table below describes the nature of lease expense and classification of operating lease expense recognized in the years ended December 31, 2024, 2023 and 2022, respectively (in millions):
| | | Year Ended December 31, | |
| | | 2024 | | | 2023 | | | 2022 | |
Operating lease expense: | | | | | | | | | | | | |
Operating lease expense | | $ | 16 | | | $ | 18 | | | $ | 17 | |
Short-term lease expense | | | 5 | | | | 5 | | | | 3 | |
Total operating lease expense | | $ | 21 | | | $ | 23 | | | $ | 20 | |
The following table presents the maturities of operating lease liabilities were as follows (in millions):
Year: | | | | |
2025 | | $ | 15 | |
2026 | | | 13 | |
2027 | | | 11 | |
2028 | | | 8 | |
2029 | | | 8 | |
Thereafter | | | 43 | |
Total lease payments | | | 98 | |
Less: Imputed interest | | | (26 | ) |
Present value of lease liabilities | | $ | 72 | |
As a Lessor. We lease or sublease our owned or leased production facilities, land, towers and office space through operating leases with third parties. Payments received associated with these leases consist of fixed and variable payments. Fixed payments are received for the rental of space including fixed rate rent escalations over the applicable term of the lease agreements. Variable payments are received for short-term rental of space, variable rent escalations and reimbursement of operating costs related to the asset leased or subleased.
We recognize revenue from fixed payments on a straight-line basis over the applicable term of the lease agreements, whose lives range between one and 43 years. The excess of straight-line revenue recognized over the fixed payments received is recorded as deferred rent receivable in other assets on our condensed consolidated balance sheets. The deferred rent receivable balance was $9 million and $6 million as of December 31, 2024 and 2023, respectively. We recognize revenue from variable payments each period as earned.
Cash flow activities related to our lease activities for assets we lease to third parties are included in other assets and accounts receivable as presented in net cash provided by operating activities in our consolidated statement of cash flows.
The following table describes the nature of our lease revenue and classification of operating lease revenue recognized in the years ended December 31, 2024, 2023 and 2022, respectively (in millions):
| | | Year Ended December 31, | |
| | | 2024 | | | 2023 | | | 2022 | |
Operating lease revenue: | | | | | | | | | | | | |
Fixed lease revenue | | $ | 22 | | | $ | 8 | | | $ | 1 | |
Variable lease revenue | | | 15 | | | | 15 | | | | 14 | |
Total operating lease revenue | | $ | 37 | | | $ | 23 | | | $ | 15 | |
The following table presents our future minimum rental receipts for non-cancelable leases and subleases as of December 31, 2024 (in millions):
Year: | | | | |
2025 | | $ | 25 | |
2026 | | | 24 | |
2027 | | | 23 | |
2028 | | | 23 | |
2029 | | | 23 | |
Thereafter | | | 226 | |
Total lease receipts | | | 344 | |
We recognize deferred tax assets and liabilities for future tax consequences attributable to differences between our financial statement carrying amounts of existing assets and liabilities and their respective tax bases. We measure deferred tax assets and liabilities using enacted tax rates expected to apply to taxable income in the years in which those temporary differences are expected to reverse. We recognize the effect on deferred tax assets and liabilities resulting from a change in tax rates in income in the period that includes the date of the change.
Under certain circumstances, we recognize liabilities in our financial statements for positions taken on uncertain tax issues. When tax returns are filed, it is highly certain that some positions taken would be sustained upon examination by the taxing authorities, while others may be subject to uncertainty about the merits of the position taken or the amount of the position that would be ultimately sustained. The benefit of a tax position is recognized in the financial statements in the period during which, based on all available evidence, we believe it is more likely than not that the position will be sustained upon examination, including the resolution of appeals or litigation processes, if any. Tax positions taken are not offset or aggregated with other positions. Tax positions that meet the more-likely-than-not recognition threshold are measured as the largest amount of tax benefit that is more than 50% likely of being realized upon settlement with the applicable taxing authority. The portion of the benefits associated with tax positions taken that exceeds the amount measured as described above is reflected as a liability for unrecognized tax benefits on the balance sheets along with any associated interest and penalties that would be payable to the taxing authorities upon examination. Interest and penalties associated with unrecognized tax benefits are classified as income tax expense in the statement of operations.
Federal and state and local income tax expense is summarized as follows (in millions):
| | | Year Ended December 31, | |
| | | 2024 | | | 2023 | | | 2022 | |
Current: | | | | | | | | | | | | |
Federal | | $ | 106 | | | $ | 73 | | | $ | 148 | |
State and local | | | 20 | | | | 12 | | | | 31 | |
Current income tax expense | | | 126 | | | | 85 | | | | 179 | |
Deferred: | | | | | | | | | | | | |
Federal | | | (6 | ) | | | (76 | ) | | | (21 | ) |
State and local | | | (3 | ) | | | (15 | ) | | | 1 | |
Deferred income tax benefit | | | (9 | ) | | | (91 | ) | | | (20 | ) |
Total income tax (benefit) expense | | $ | 117 | | | $ | (6 | ) | | $ | 159 | |
Significant components of our deferred tax liabilities and assets are as follows (in millions):
| | | December 31, | |
| | | 2024 | | | 2023 | |
Deferred tax liabilities: | | | | | | | | |
Net book value of property and equipment | | $ | 135 | | | $ | 149 | |
Broadcast licenses, goodwill and other intangible assets | | | 1,340 | | | | 1,338 | |
Other | | | 6 | | | | 3 | |
Total deferred tax liabilities | | | 1,481 | | | | 1,490 | |
| | | | | | | | | |
Deferred tax assets: | | | | | | | | |
Liability for compensated absences | | | 6 | | | | 6 | |
Liability for accrued bonus | | | 12 | | | | 13 | |
Liability under health and welfare plan | | | 2 | | | | 3 | |
State and local operating loss carryforwards | | | 11 | | | | 7 | |
Unearned income | | | 4 | | | | 2 | |
Restricted stock | | | 3 | | | | 2 | |
Investments | | | 7 | | | | 3 | |
Interest expense limitation | | | 76 | | | | 88 | |
| Other comprehensive income | | | 8 | | | | 6 | |
Other | | | 12 | | | | 10 | |
Total deferred tax assets | | | 141 | | | | 140 | |
Valuation allowance for deferred tax assets | | | (7 | ) | | | (9 | ) |
Net deferred tax assets | | | 134 | | | | 131 | |
| | | $ | 1,347 | | | $ | 1,359 | |
As of December 31, 2024, we have an aggregate of approximately $252 million of various state operating loss carryforwards, of which we expect that approximately one-third will be utilized. We expect that the unutilized portion of these state net operating loss carryforwards will not be utilized due to Internal Revenue Code section 382 limitations and those that will expire prior to utilization. After applying our state effective tax rate, this amount is included in our valuation allowance for deferred tax assets.
A reconciliation of income tax expense at the statutory federal income tax rate and income taxes as reflected in the consolidated financial statements for the years ended December 31, 2024, 2023 and 2022 is as follows (in millions):
| | | Year Ended December 31, | |
| | | 2024 | | | 2023 | | | 2022 | |
Statutory federal rate applied to income before income tax expense | | $ | 103 | | | $ | (17 | ) | | $ | 129 | |
Current year permanent items | | | 6 | | | | 11 | | | | 5 | |
State and local taxes, net of federal tax benefit | | | 21 | | | | (4 | ) | | | 26 | |
Change in valuation allowance | | | (1 | ) | | | (1 | ) | | | - | |
| Reserve for uncertain tax positions | | | (14 | ) | | | 1 | | | | - | |
Other items, net | | | 2 | | | | 4 | | | | (1 | ) |
Income tax (benefit) expense as recorded | | $ | 117 | | | $ | (6 | ) | | $ | 159 | |
| | | | | | | | | | | | | |
Effective income tax rate | | | 24 | % | | | 7 | % | | | 26 | % |
Each year-end, we adjust our other comprehensive income on a net of tax basis. During 2024, we increased our recorded non-current pension asset by $1 million; we recorded an adjustment of the fair value of our interest rate caps of $8 million; and together, we recorded a $2 million tax benefit. During 2023, we increased our recorded non-current pension asset by $7 million; we recorded an adjustment of the fair value of our interest rate caps of $23 million; and together, we recorded a $5 million tax benefit. During 2022, we decreased our recorded non-current pension liability by $20 million and recognized other comprehensive income of $15 million, net of a $5 million tax provision.
We made income tax payments (net of refunds) of $135 million, $50 million and $180 million during the years ended December 31, 2024, 2023 and 2022, respectively.
We prescribe a recognition threshold and measurement attribution for the financial statement recognition and measurement of a tax position taken or expected to be taken in a tax return. For benefits to be recognized, a tax position must be more likely than not to be sustained upon examination by taxing authorities.
We file a federal consolidated income tax return in the United States and state or local consolidated income tax returns in various state or local jurisdictions. Certain of our subsidiaries file separate tax returns in other various state and local jurisdictions. With few exceptions, we are no longer subject to federal, state and local tax examinations by tax authorities for years before 2004.
The following table summarizes the activity related to our reserve for uncertain tax positions (in millions):
| | | Year Ended December 31, | |
| | | 2024 | | | 2023 | | | 2022 | |
Balance at beginning of period | | $ | 14 | | | $ | 15 | | | $ | 15 | |
Statute expirations | | | (14 | ) | | | (1 | ) | | | - | |
Balance at end of period | | $ | - | | | $ | 14 | | | $ | 15 | |
We recognize accrued interest and penalties related to uncertain tax positions in income tax expense in the accompanying Consolidated Statements of Operations and Consolidated Statements of Comprehensive (Loss) Income. During the years ended December 31, 2024, 2023 and 2022, our penalty and interest expense related to uncertain tax positions was not material. At December 31, 2024, 2023 and 2022, the total accrual for interest and penalties related to uncertain tax positions was not material.
We sponsor and contribute to defined benefit and defined contribution retirement plans. The Gray Pension Plan is a defined benefit pension plan. Benefits under the Gray Pension Plan are frozen and can no longer increase, and no new participants can be added to the Gray Pension Plan.
The Gray Pension Plan’s funding policy is consistent with the funding requirements of existing federal laws and regulations under the Employee Retirement Income Security Act of 1974. The measurement dates used to determine the benefit information for the Gray Pension Plan were December 31, 2024 and 2023, respectively. The following summarizes the Gray Pension Plan’s funded status and amounts recognized on our consolidated balance sheets at December 31, 2024 and 2023, respectively (in millions):
| | | December 31, | |
| | | 2024 | | | 2023 | |
Change in projected benefit obligation: | | | | | | | | |
Projected benefit obligation at beginning of year | | $ | 104 | | | $ | 102 | |
Interest cost | | | 4 | | | | 5 | |
Actuarial (gain) loss | | | (7 | ) | | | 2 | |
Benefits paid | | | (5 | ) | | | (5 | ) |
Projected benefit obligation at end of year | | $ | 96 | | | $ | 104 | |
| | | | | | | | | |
Change in plan assets: | | | | | | | | |
Fair value of pension plan assets at beginning of year | | $ | 117 | | | $ | 104 | |
Actual return on plan assets | | | - | | | | 14 | |
Company contributions | | | - | | | | 4 | |
Benefits paid | | | (5 | ) | | | (5 | ) |
Fair value of pension plan assets at end of year | | | 112 | | | | 117 | |
Funded status of pension plan | | $ | 16 | | | $ | 13 | |
| | | | | | | | | |
Amounts recognized on our balance sheets consist of: | | | | | | | | |
Accrued benefit cost | | $ | 28 | | | $ | 26 | |
Accumulated other comprehensive loss | | | (12 | ) | | | (13 | ) |
Net asset recognized | | $ | 16 | | | $ | 13 | |
Because the Gray Pension Plan is a frozen plan, the projected benefit obligation and the accumulated benefit obligation are the same. The accumulated benefit obligation was $96 million and $104 million at December 31, 2024 and 2023, respectively. The long-term rate of return on assets assumption was chosen from a best estimate range based upon the anticipated long-term returns for asset categories in which the Gray Pension Plan is invested. An estimate of the rate of increase in compensation levels used to calculate the net periodic benefit cost is not required because of the Plan’s frozen status:
| | | Year Ended December 31, | |
| | | 2024 | | | 2023 | |
Weighted-average assumptions used to determine net periodic benefit cost for the Gray Pension Plan: | | | | | | | | |
Discount rate | | | 4.79 | % | | | 4.99 | % |
Expected long-term rate of return on pension plan assets | | | 6.25 | % | | | 6.25 | % |
Estimated rate of increase in compensation levels | | | N/A | | | | N/A | |
| | | As of December 31, | |
| | | 2024 | | | 2023 | |
Weighted-average assumptions used to determine benefit obligations: | | | | | | | | |
Discount rate | | | 5.48 | % | | | 4.79 | % |
Pension expense is computed using the projected unit credit actuarial cost method. The net periodic pension cost for the Gray Pension Plan includes the following components (in millions):
| | | Year Ended December 31, | |
| | | 2024 | | | 2023 | | | 2022 | |
Components of net periodic pension cost: | | | | | | | | | | | | |
Interest cost | | $ | 4 | | | $ | 5 | | | $ | 4 | |
Expected return on plan assets | | | (7 | ) | | | (7 | ) | | | (8 | ) |
Recognized net actuarial loss | | | - | | | | - | | | | 1 | |
Net periodic pension benefit | | $ | (3 | ) | | $ | (2 | ) | | $ | (3 | ) |
For the Gray Pension Plan, the estimated future benefit payments are as follows (in millions):
Years | | | Amount | |
2025 | | | $ | 5 | |
2026 | | | $ | 6 | |
2027 | | | $ | 6 | |
2028 | | | $ | 6 | |
2029 | | | $ | 6 | |
| 2030 | - | 2034 | | | $ | 33 | |
The Gray Pension Plan’s weighted-average asset allocations by asset category were as follows:
| | | As of December 31, | |
| | | 2024 | | | 2023 | |
Asset category: | | | | | | | | |
Insurance general account | | | 13 | % | | | 13 | % |
Cash management accounts | | | 3 | % | | | 4 | % |
Equity accounts | | | 0 | % | | | 50 | % |
Fixed income accounts | | | 84 | % | | | 30 | % |
Real estate accounts | | | 0 | % | | | 3 | % |
Total | | | 100 | % | | | 100 | % |
The investment objective is to achieve a consistent total rate of return (income, appreciation, and reinvested funds) that will equal or exceed the actuarial assumption with aversion to significant volatility. The following is the target asset allocation:
| | | Target Range | |
| | | Strategic Allocation | | | Lower Limit | | | Upper Limit | |
| Asset class: | | | | | | | | | | | | |
Equities: | | | | | | | | | | | | |
Large Cap Blend | | | 27.0 | % | | | 0.0 | % | | | 50.0 | % |
Mid Cap Blend | | | 10.0 | % | | | 0.0 | % | | | 40.0 | % |
Small Cap Blend | | | 6.0 | % | | | 0.0 | % | | | 25.0 | % |
Foreign Large Blend | | | 11.0 | % | | | 0.0 | % | | | 40.0 | % |
Emerging Markets | | | 3.0 | % | | | 0.0 | % | | | 25.0 | % |
Real Estate | | | 3.0 | % | | | 0.0 | % | | | 20.0 | % |
Fixed Income: | | | | | | | | | | | | |
U.S. Treasury Inflation Protected | | | 3.5 | % | | | 0.0 | % | | | 25.0 | % |
Intermediate Core Plus Bond | | | 25.0 | % | | | 0.0 | % | | | 50.0 | % |
Short-Term Bond | | | 3.0 | % | | | 0.0 | % | | | 25.0 | % |
Bank Loan | | | 0.0 | % | | | 0.0 | % | | | 25.0 | % |
High Yield Bond | | | 4.0 | % | | | 0.0 | % | | | 25.0 | % |
Emerging Markets Bond | | | 3.0 | % | | | 0.0 | % | | | 20.0 | % |
Money Market Taxable | | | 1.5 | % | | | 0.0 | % | | | 100.0 | % |
Our equity portfolio contains securities of companies necessary to build a diversified portfolio that we believe are financially sound. Our fixed income portfolio contains obligations generally rated A or better with no maturity restrictions and an actively managed duration. The cash equivalents strategy uses securities of the highest credit quality.
Fair Value of Gray Pension Plan Assets. We calculate the fair value of the Gray Pension Plan’s assets based upon the observable and unobservable net asset value of its underlying investments. We utilize valuation techniques that maximize the use of observable inputs and minimize the use of unobservable inputs. These inputs are prioritized by the fair value hierarchy proscribed by ASU Topic 820, described in Note 5 “Fair Value Measurement.”
The following table presents the fair value of the Gray Pension Plan’s assets and classifies them by level within the fair value hierarchy as of December 31, 2024 and 2023 (in millions):
| | | As of December 31, 2024 | |
| | | Level 1 | | | Level 2 | | | Level 3 | | | Total | |
Assets: | | | | | | | | | | | | | | | | |
Insurance general account | | $ | - | | | $ | 14 | | | $ | - | | | $ | 14 | |
Cash management accounts | | | 4 | | | | - | | | | - | | | | 4 | |
Equity accounts | | | - | | | | - | | | | - | | | | - | |
Fixed income accounts | | | 94 | | | | - | | | | - | | | | 94 | |
Real estate accounts | | | - | | | | - | | | | - | | | | - | |
Total | | $ | 98 | | | $ | 14 | | | $ | - | | | $ | 112 | |
| | | As of December 31, 2023 | |
| | | Level 1 | | | Level 2 | | | Level 3 | | | Total | |
Assets: | | | | | | | | | | | | | | | | |
Insurance general account | | $ | - | | | $ | 15 | | | $ | - | | | $ | 15 | |
Cash management accounts | | | 5 | | | | - | | | | - | | | | 5 | |
Equity accounts | | | 59 | | | | - | | | | - | | | | 59 | |
Fixed income account | | | 35 | | | | - | | | | - | | | | 35 | |
Real estate accounts | | | 3 | | | | - | | | | - | | | | 3 | |
Total | | $ | 102 | | | $ | 15 | | | $ | - | | | $ | 117 | |
Expected Pension Contributions. We do not expect to make a contribution to our frozen defined benefit pension plan during the year ending December 31, 2025.
401(k) Savings Plan. The Gray 401(k) Plan is a defined contribution plan intended to meet the requirements of Section 401(k) of the Internal Revenue Code. In 2024, employer contributions under The Gray 401(k) Plan include matching cash contributions at a rate of 100% of the first 1% of each employee’s salary deferral, and 50% of the next 5% of each employee’s salary deferral. For the years ended December 31, 2024, 2023 and 2022, our matching contributions to The Gray 401(k) Plan were $28 million, $26 million and $17 million, respectively. We estimate that our matching cash contributions to The Gray 401(k) Plan for 2025 will be approximately $24 million.
In addition, the Company, at its discretion, may make an additional profit-sharing contribution, based on annual Company performance, to those employees who meet certain criteria. For the year ended December 31, 2024, we did not record a profit-sharing contribution. For the years ended December 31, 2023 and 2022, we accrued contributions of approximately $10 million and $9 million, respectively, as discretionary profit-sharing contributions. Each of these discretionary profit-sharing contributions was subsequently made in the form of shares of our common stock. We may also make matching and discretionary contributions of our common stock under the The Gray 401(k) Plan. As of December 31, 2024, we had 10 million shares of common stock reserved for issuance under this plan.
Meredith Plan. In connection with the Meredith Transaction, On December 1, 2021, we assumed a defined benefit pension plan covering certain legacy Meredith bargaining class employees. At December 31, 2024, this plan had combined plan assets of $22 million and combined projected benefit obligations of $18 million. The net asset for this plan is recorded as an asset in our financial statements as of December 31, 2024.
12. | Commitments and Contingencies |
From time to time we may have various contractual and other commitments requiring future payments. These commitments may include amounts required to be paid for: the purchase of property and equipment; service and other agreements; commitments for various programs, including affiliation agreements with networks; and commitments under our accounts receivable securitization facility. Programming agreements include variable fee components such as percentage of revenue or rate per subscriber. Future estimated minimum payments for these commitments, in addition to the liabilities accrued for on our consolidated balance sheets as of December 31, 2024, were as follows (in millions):
| | | Accounts | | | Service and | | | | | | | | | | | | | |
| | | Receivable | | | Other | | | Assembly | | | Programming | | | | | |
Year | | Securitization | | | Agreements | | | Development | | | Agreements | | | Total | |
2025 | | $ | - | | | $ | 55 | | | $ | 23 | | | $ | 731 | | | $ | 809 | |
2026 | | | 300 | | | | 35 | | | | - | | | | 117 | | | | 452 | |
2027 | | | - | | | | 19 | | | | - | | | | 82 | | | | 101 | |
2028 | | | - | | | | 15 | | | | - | | | | 73 | | | | 88 | |
2029 | | | - | | | | 5 | | | | - | | | | 5 | | | | 10 | |
Total | | $ | 300 | | | $ | 129 | | | $ | 23 | | | $ | 1,008 | | | $ | 1,460 | |
Legal Proceedings and Claims. We are and expect to continue to be subject to legal actions, proceedings and claims that arise in the normal course of our business. In the opinion of management, the amount of ultimate liability, if any, with respect to these known actions, proceedings and claims will not materially affect our financial condition, results of operations or cash flows, although legal proceedings are subject to inherent uncertainties, and unfavorable rulings or events could result in materially adverse outcomes.
Local TV Advertising Antitrust Litigation. In 2018, several broadcasting companies, including Raycom Media (which the Company subsequently acquired in January 2019) and the Meredith Corporation (which the Company acquired in December 2021) agreed to enter into substantially identical consent decrees with the Department of Justice (the “DOJ”). This consent decree provided for the settlement of a confidential investigation by the DOJ into the alleged exchange of certain competitively sensitive information relating to advertising sales among certain stations in some local markets. The consent decree and related settlement were finalized on May 22, 2019. The consent decree is not an admission of any wrongdoing by the parties and does not subject the parties to any monetary damages or penalties. The consent decree requires the parties to adopt certain antitrust compliance measures, including the appointment of an Antitrust Compliance Officer, consistent with what the DOJ has required in previous consent decrees in other industries. The consent decree also requires the parties’ stations not exchange pacing and certain other information with other stations in their local markets, which aligns with Gray’s current policy. Gray Media, Inc. was not a subject of, or party to, any consent decree or settlement thereof, although certain of the Company’s operations that we later acquired from Raycom and Meredith do remain subject to the terms of such settlement.
Following published reports of the DOJ investigation and settlement, various putative class action lawsuits were filed against a number of owners of television stations. The cases have been consolidated in a single multidistrict litigation in the District Court for the Northern District of Illinois under the caption In re Local TV Advertising Litigation, and the plaintiffs’ operative complaint alleges price fixing and unlawful information exchange among the defendants’ advertisement sales teams. Gray is a defendant solely due to its acquisition of Raycom and Meredith, who were named defendants. The consolidated action seeks damages, attorneys’ fees, costs and interest, as well as injunctions against adopting practices or plans that would restrain competition in the ways the plaintiffs have alleged. The Company believes the lawsuits are without merit and continues to vigorously defend itself against all such claims.
13. | Goodwill and Intangible Assets |
During the years ended December 31, 2024 and 2023, we acquired, adjusted and disposed of various television broadcast stations and broadcast licenses. As a result of these transactions, our goodwill and intangible balances changed during each of these years. See Note 3 “Acquisitions and Divestitures” for more information regarding these transactions.
Several years ago, our Raycom Sports subsidiary sublicensed certain Atlantic Coast Conference (“ACC”) football and basketball games from ESPN to Fox Sports that were assumed by Diamond Sports Group, LLC (“Diamond”) upon its acquisition of Fox Sports. In March 2023, Diamond sought bankruptcy protection. On July 7, 2023, the bankruptcy court granted the request of Diamond (supported by us) for the early rejection, and therefore the termination, of the ACC sports rights agreements. On July 13, 2023, The CW Network (“CW”) announced that it had entered into an agreement with Raycom Sports for a similar package of sports rights related to the ACC games that had been included in the now-terminated agreement with Diamond. Concurrently, Raycom Sports and ESPN modified their license agreement to correspond with the terms of the CW sublicense agreement. The new agreements mitigate a portion of the losses caused by Diamond’s rejection of its ACC sports rights agreement with Raycom Sports. As a result of the bankruptcy filings and these new July 2023 agreements, our production companies segment recorded a non-cash charge of $43 million, for impairment of goodwill and other intangible assets.
The following table presents a summary of changes in our goodwill and other intangible assets, on a net basis (in millions):
| | | Net Balance at | | | Acquisitions | | | | | | | | | | | Net Balance at | |
| | | December 31, | | | and | | | | | | | | | | | December 31, | |
| | | 2023 | | | Adjustments, Net | | | Impairment | | | Amortization | | | 2024 | |
Goodwill | | $ | 2,643 | | | $ | (1 | ) | | $ | - | | | $ | - | | | $ | 2,642 | |
Broadcast licenses | | | 5,320 | | | | (9 | ) | | | - | | | | - | | | | 5,311 | |
Finite-lived intangible assets | | | 415 | | | | - | | | | - | | | | (125 | ) | | | 290 | |
Total intangible assets net of accumulated amortization | | $ | 8,378 | | | $ | (10 | ) | | $ | - | | | $ | (125 | ) | | $ | 8,243 | |
| | | Net Balance at | | | Acquisitions | | | | | | | | | | | Net Balance at | |
| | | December 31, | | | and | | | | | | | | | | | December 31, | |
| | | 2022 | | | Adjustments | | | Impairment | | | Amortization | | | 2023 | |
Goodwill | | $ | 2,663 | | | $ | (4 | ) | | $ | (16 | ) | | $ | - | | | $ | 2,643 | |
Broadcast licenses | | | 5,331 | | | | (11 | ) | | | - | | | | - | | | | 5,320 | |
Finite-lived intangible assets | | | 636 | | | | - | | | | (27 | ) | | | (194 | ) | | | 415 | |
Total intangible assets net of accumulated amortization | | $ | 8,630 | | | $ | (15 | ) | | $ | (43 | ) | | $ | (194 | ) | | $ | 8,378 | |
The following table presents a summary of changes in our goodwill, on a gross basis (in millions):
| | | | | | | Acquisitions | | | | | | | | | |
| | | As of | | | and | | | | | | | As of | |
| | | December 31, 2023 | | | Adjustments | | | Impairment | | | December 31, 2024 | |
Goodwill, gross | | $ | 2,742 | | | $ | (1 | ) | | $ | - | | | $ | 2,741 | |
Accumulated goodwill impairment | | | (99 | ) | | | - | | | | - | | | | (99 | ) |
Goodwill, net | | $ | 2,643 | | | $ | (1 | ) | | $ | - | | | $ | 2,642 | |
| | | | | | | Acquisitions | | | | | | | | | |
| | | As of | | | and | | | | | | | As of | |
| | | December 31, 2022 | | | Adjustments | | | Impairment | | | December 31, 2023 | |
Goodwill, gross | | $ | 2,762 | | | $ | (4 | ) | | $ | (16 | ) | | $ | 2,742 | |
Accumulated goodwill impairment | | | (99 | ) | | | - | | | | - | | | | (99 | ) |
Goodwill, net | | $ | 2,663 | | | $ | (4 | ) | | $ | (16 | ) | | $ | 2,643 | |
The following table presents a summary of our intangible assets and related accumulated amortization (in millions):
| | | As of December 31, 2024 | | | As of December 31, 2023 | |
| | | | | | | Accumulated | | | | | | | | | | | Accumulated | | | | | |
| | | Gross | | | Amortization | | | Net | | | Gross | | | Amortization | | | Net | |
Intangible assets not currently subject to amortization: | | | | | | | | | | | | | | | | | | | | | | | | |
Broadcast licenses | | $ | 5,365 | | | $ | (54 | ) | | $ | 5,311 | | | $ | 5,374 | | | $ | (54 | ) | | $ | 5,320 | |
Goodwill | | | 2,642 | | | | - | | | | 2,642 | | | | 2,643 | | | | - | | | | 2,643 | |
| | | $ | 8,007 | | | $ | (54 | ) | | $ | 7,953 | | | $ | 8,017 | | | $ | (54 | ) | | $ | 7,963 | |
| | | | | | | | | | | | | | | | | | | | | | | | | |
Intangible assets subject to amortization: | | | | | | | | | | | | | | | | | | | | | | | | |
Network affiliation agreements | | $ | 216 | | | $ | (160 | ) | | $ | 56 | | | $ | 216 | | | $ | (126 | ) | | $ | 90 | |
Other finite-lived intangible assets | | | 992 | | | | (758 | ) | | | 234 | | | | 992 | | | | (667 | ) | | | 325 | |
| | | $ | 1,208 | | | $ | (918 | ) | | $ | 290 | | | $ | 1,208 | | | $ | (793 | ) | | $ | 415 | |
| | | | | | | | | | | | | | | | | | | | | | | | | |
Total intangible assets | | $ | 9,215 | | | $ | (972 | ) | | $ | 8,243 | | | $ | 9,225 | | | $ | (847 | ) | | $ | 8,378 | |
Based on our intangible assets subject to amortization as of December 31, 2024, we expect that amortization of intangible assets for the succeeding five years will be as follows: 2025, $113 million; 2026, $83 million; 2027, $47 million; 2028, $13 million; and 2029, $3 million. If and when acquisitions and dispositions occur in the future, actual amounts may vary from these estimates.
Impairment of Goodwill and Broadcast Licenses. We evaluate broadcast licenses and goodwill for impairment on an annual basis, or more often when certain triggering events occur. Goodwill is evaluated at the reporting unit level.
Our broadcasting operating segment is comprised of a single reporting unit. Each of the distinct businesses within our production companies operating segment represent a reporting unit. Therefore, we evaluate our goodwill for impairment for five reporting units. One reporting unit for all of our broadcast television operations and four for each of the distinct businesses within our production companies. The Company has considered the requirements as stipulated within ASC 350. Management has identified the applicable assets and liabilities for each of the reporting units in accordance with ASC 350.
In the performance of our annual broadcast license and reporting unit impairment assessments, we have the option of performing a qualitative assessment to determine if it is more likely than not that the respective asset has been impaired. In 2024, we performed a qualitative assessment for 56 of our broadcast licenses and three of our reporting units. In 2023, we performed a qualitative assessment for 59 of our broadcast licenses and three of our reporting units.
As part of this qualitative assessment we evaluate the relative impact of factors that are specific to the reporting units as well as industry, regulatory and macroeconomic factors that could affect the significant inputs used to determine the fair value of the assets. We also consider the significance of the excess fair value over the carrying value reflected in prior quantitative assessments and the changes to the reporting units’ carrying value since the last impairment test.
If we conclude that it is more likely than not that a broadcast license or reporting unit is impaired, or if we elect not to perform the optional qualitative assessment, we perform the quantitative assessment which involves comparing the estimated fair value of the broadcast license or reporting unit to its respective carrying value.
For our annual broadcast licenses impairment test in 2024 and 2023, for those broadcast licenses that we deemed to qualify for qualitative assessment, we concluded that it was more likely than not that all of our broadcast licenses that were evaluated were not impaired based upon our assessments. For the remaining broadcast licenses, we elected to perform a quantitative assessment and concluded that their fair values exceeded their carrying values. To estimate the fair value of our broadcast licenses, we considered assumptions related to historical market and station growth trends, third party market specific industry data, the anticipated performance of the stations and discount rates. Our valuation technique included theoretical assumptions of the costs that would be incurred to construct a station when the only owned asset is the broadcast license and theoretical assumptions for the associated revenues, operating margins and capital expenditures expected to be incurred in the start-up years. We also consider other relevant factors such as the technical qualities of the broadcast license and the number of competing broadcast licenses within that market.
For our annual goodwill impairment test in 2024 and 2023, we concluded that it was more likely than not that goodwill was not impaired based upon our qualitative assessments for one of our production company reporting units. We elected to perform a quantitative assessment for our broadcasting and remaining production company reporting units and concluded that their fair values exceeded their carrying values. To estimate the fair value of our reporting units, we utilize a discounted cash flow model supported by a market multiple approach. We believe that a discounted cash flow analysis is the most appropriate methodology to test the recorded value of long-term assets with a demonstrated long-lived/enduring franchise value. We believe the results of the discounted cash flow and market multiple approaches provide reasonable estimates of the fair value of our reporting units because these approaches are based on our actual results and reasonable estimates of future performance, and also take into consideration a number of other factors deemed relevant by us including, but not limited to, expected future market revenue growth, market revenue shares and operating profit margins. We have historically used these approaches in determining the value of our reporting units. We also consider a market multiple approach to corroborate our discounted cash flow analysis. We believe that this methodology is consistent with the approach that a strategic market participant would utilize if they were to value our television stations.
We believe we have made reasonable estimates and utilized appropriate assumptions to evaluate whether the fair values of our broadcast licenses and reporting units were less than their carrying values. If future results are not consistent with our assumptions and estimates, including future events such as a deterioration of market conditions or significant increases in discount rates, we could be exposed to impairment charges in the future. Any resulting impairment loss could have a material adverse impact on our consolidated balance sheets, consolidated statements of operations and consolidated statements of cash flows.
See Note 1 “Description of Business and Summary of Significant Accounting Policies” for further discussion of our accounting policies regarding goodwill, broadcast licenses and other intangible assets.
14. Segment Information
The Company’s chief operating decision maker (“CODM”) is the chief executive officer (“CEO”). The CODM assesses segment performance and allocates resources to each segment by using each segment’s operating profit. The CODM uses operating profit for each segment in the annual budgeting and forecasting process as well as reviewing segment operating profit quarterly when making decisions about allocating capital and operating resources to segments. Disaggregated total assets and goodwill by segment are not regularly provided to the CODM. The following tables present our business segment information (in millions):
| | | | | | | Production | | | | | | | | | |
As of and for the Year ended December 31, 2024: | | Broadcasting | | | Companies | | | Other | | | Consolidated | |
| | | | | | | | | | | | | | | | | |
Revenue (less agency commissions) | | $ | 3,539 | | | $ | 105 | | | $ | - | | | $ | 3,644 | |
Less:(1) | | | | | | | | | | | | | | | | |
Payroll and employee benefits | | | 892 | | | | 24 | | | | 55 | | | | 971 | |
| Network affiliation fees | | | 932 | | | | - | | | | - | | | | 932 | |
Programming | | | 108 | | | | 20 | | | | - | | | | 128 | |
Depreciation and amortization | | | 248 | | | | 19 | | | | 2 | | | | 269 | |
Other segment items(2) | | | 403 | | | | 41 | | | | 49 | | | | 493 | |
Segment operating income (loss) | | $ | 956 | | | $ | 1 | | | $ | (106 | ) | | $ | 851 | |
Other income (expense): | | | | | | | | | | | | | | | | |
Miscellaneous income (expense), net | | | | | | | | | | | | | | | 117 | |
Impairment of investments | | | | | | | | | | | | | | | (25 | ) |
Interest expense | | | | | | | | | | | | | | | (485 | ) |
Gain on early extinguishment of debt | | | | | | | | | | | | | | | 34 | |
Income before income tax | | | | | | | | | | | | | | $ | 492 | |
| | | | | | | | | | | | | | | | | |
Capital expenditures (excluding business combinations) | | $ | 97 | | | $ | 46 | | | $ | - | | | $ | 143 | |
Goodwill | | $ | 2,614 | | | $ | 28 | | | $ | - | | | $ | 2,642 | |
Investments in broadcasting and technology companies | | $ | 49 | | | $ | 4 | | | $ | 13 | | | $ | 66 | |
Total assets | | $ | 9,636 | | | $ | 681 | | | $ | 225 | | | $ | 10,542 | |
| | | | | | | Production | | | | | | | | | |
As of and for the Year ended December 31, 2023: | | Broadcasting | | | Companies | | | Other | | | Consolidated | |
| | | | | | | | | | | | | | | | | |
Revenue (less agency commissions) | | $ | 3,195 | | | $ | 86 | | | $ | - | | | $ | 3,281 | |
Less:(1) | | | | | | | | | | | | | | | | |
Payroll and employee benefits | | | 865 | | | | 21 | | | | 54 | | | | 940 | |
| Network affiliation fees | | | 937 | | | | - | | | | - | | | | 937 | |
Programming | | | 98 | | | | 25 | | | | - | | | | 123 | |
Depreciation and amortization | | | 322 | | | | 13 | | | | 4 | | | | 339 | |
Impairment of goodwill and other inangible assets | | | - | | | | 43 | | | | - | | | | 43 | |
Other segment items(2) | | | 386 | | | | 72 | | | | 58 | | | | 516 | |
Segment operating income (loss) | | $ | 587 | | | $ | (88 | ) | | $ | (116 | ) | | $ | 383 | |
Other income (expense): | | | | | | | | | | | | | | | | |
Miscellaneous income (expense), net | | | | | | | | | | | | | | | 7 | |
Impairment of investments | | | | | | | | | | | | | | | (29 | ) |
Interest expense | | | | | | | | | | | | | | | (440 | ) |
Loss on early extinguishment of debt | | | | | | | | | | | | | | | (3 | ) |
Income before income tax | | | | | | | | | | | | | | $ | (82 | ) |
| | | | | | | | | | | | | | | | | |
Capital expenditures (excluding business combinations) | | $ | 107 | | | $ | 240 | | | $ | 1 | | | $ | 348 | |
Goodwill | | $ | 2,615 | | | $ | 28 | | | $ | - | | | $ | 2,643 | |
Investments in broadcasting and technology companies | | $ | 68 | | | $ | 4 | | | $ | 13 | | | $ | 85 | |
Total assets | | $ | 9,897 | | | $ | 658 | | | $ | 85 | | | $ | 10,640 | |
| | | | | | | Production | | | | | | | | | |
As of and for the Year ended December 31, 2022: | | Broadcasting | | | Companies | | | Other | | | Consolidated | |
| | | | | | | | | | | | | | | | | |
Revenue (less agency commissions) | | $ | 3,583 | | | $ | 93 | | | $ | - | | | $ | 3,676 | |
Less:(1) | | | | | | | | | | | | | | | | |
Payroll and employee benefits | | | 799 | | | | 20 | | | | 50 | | | | 869 | |
| Network affiliation fees | | | 903 | | | | - | | | | - | | | | 903 | |
Programming | | | 98 | | | | 26 | | | | - | | | | 124 | |
Depreciation and amortization | | | 321 | | | | 12 | | | | 3 | | | | 336 | |
Other segment items(2) | | | 363 | | | | 37 | | | | 54 | | | | 454 | |
Segment operating income (loss) | | $ | 1,099 | | | $ | (2 | ) | | $ | (107 | ) | | $ | 990 | |
Other income (expense): | | | | | | | | | | | | | | | | |
Miscellaneous income (expense), net | | | | | | | | | | | | | | | (4 | ) |
Impairment of investments | | | | | | | | | | | | | | | (18 | ) |
Interest expense | | | | | | | | | | | | | | | (354 | ) |
Income before income tax | | | | | | | | | | | | | | $ | 614 | |
| | | | | | | | | | | | | | | | | |
Capital expenditures (excluding business combinations) | | $ | 163 | | | $ | 267 | | | $ | 6 | | | $ | 436 | |
Goodwill | | $ | 2,618 | | | $ | 45 | | | $ | - | | | $ | 2,663 | |
Investments in broadcasting and technology companies | | $ | 86 | | | $ | 6 | | | $ | 13 | | | $ | 105 | |
Total assets | | $ | 10,444 | | | $ | 535 | | | $ | 173 | | | $ | 11,152 | |
(1) The significant expense categories and amounts align with the segment-level information that is regularly provided to the chief operating decision maker. Intersegment expenses are included within the amounts shown.
(2) Other segment items for each reportable segment includes; (gain) loss on disposal of assets, professional services expense, repairs and maintenance expense, occupancy expense (including property tax expense), and certain overhead expenses.
15. Subsequent Events
In December 2024, we entered into a series of agreements through which we anticipate recieving approximately $35 million in return for (a) all of Gray’s interests in certain third-party leases for space at Gray-owned tower sites, and (b) the exclusive right to market and lease space at those Gray-owned tower sites to third parties. We will retain ownership and control of each such tower site and will not incur any additional operating costs with respect to the subject tower sites. We anticipate closing the transactions at various times during 2025, with the majority of closings occurring in the first half of 2025.
Item 9. CHANGES IN AND DISAGREEMENTS WITH ACCOUNTANTS ON ACCOUNTING AND FINANCIAL DISCLOSURE
None.
Item 9A. CONTROLS AND PROCEDURES
Evaluation of Disclosure Controls and Procedures
Our management, including our CEO and Chief Financial Officer (“CFO), regularly perform an evaluation of our disclosure controls and procedures, which have been designed to permit us to record, process, summarize and report, within time periods specified by the SEC's rules and forms, information required to be disclosed.
Management necessarily applies its judgment in assessing the costs and benefits of such controls and procedures, which, by their nature, can provide only reasonable assurance regarding management’s control objectives. The Company’s management, including the CEO and the CFO, does not expect that our disclosure controls and procedures can prevent all possible errors or fraud. A control system, no matter how well conceived and operated, can provide only reasonable, not absolute, assurance that misstatements due to error or fraud will not occur or that all control issues and instances of fraud, if any, within the company have been detected. Judgments in decision-making can be faulty and breakdowns can occur because of simple errors or mistakes. Additionally, controls can be circumvented by the individual acts of one or more persons. The design of any system of controls is based in part upon certain assumptions about the likelihood of future events, and while our disclosure controls and procedures are designed to be effective under circumstances where they should reasonably be expected to operate effectively, there can be no assurance that any design will succeed in achieving its stated goals under all potential future conditions. Because of the inherent limitations in any control system, misstatements due to possible errors or fraud may nevertheless occur and not be detected.
Our CEO and CFO, with assistance from other members of management, have reviewed the effectiveness of our disclosure controls and procedures as of December 31, 2024, and, based on their evaluation, have concluded that the disclosure controls and procedures were effective as of such date.
Changes in Internal Control Over Financial Reporting
During the three months ended December 31, 2024, we did not make any changes in our internal control over financial reporting that have materially affected, or are reasonably likely to materially affect, our internal control over financial reporting.
Management’s Report on Internal Control Over Financial Reporting
Management is responsible for establishing and maintaining adequate internal control over financial reporting, as such term is defined in Rules 13a-15(f) and 15d-15(f) under the Securities Exchange Act of 1934. Our internal control over financial reporting is designed to provide reasonable assurance regarding the reliability of financial reporting and the preparation of financial statements for external purposes in accordance with U.S. GAAP.
Because of its inherent limitations, internal control over financial reporting may not prevent or detect misstatements. Projections of any evaluation of effectiveness to future periods are subject to the risk that controls may become inadequate because of changes in conditions, or that the degree of compliance with the policies may deteriorate.
In connection with the preparation of our annual consolidated financial statements, management has undertaken an assessment of the effectiveness of our internal control over financial reporting as of December 31, 2024, based on criteria established in “Internal Control – Integrated Framework” issued by the Committee of Sponsoring Organizations of the Treadway Commission (“COSO 2013 framework”). Management’s assessment included an evaluation of the design of our internal control over financial reporting and testing of the operational effectiveness of those controls. Based on this evaluation, management has concluded that our internal control over financial reporting was effective as of December 31, 2024.
The effectiveness of our internal control over financial reporting as of December 31, 2024 has been audited by RSM US LLP (“RSM”), an independent registered public accounting firm, which also audited our Consolidated Financial Statements for the year ended December 31, 2024. RSM's report on our internal control over financial reporting is set forth in Item 8. of the Annual Report on Form 10-K.
Item 9B. OTHER INFORMATION
None.
Item 9C. DISCLOSURE REGARDING FOREIGN JURISDICTION THAT PREVENT INSPECTION
None.
PART III
Item 10. DIRECTORS, EXECUTIVE OFFICERS AND CORPORATE GOVERNANCE
The information to be set forth under the headings “Election of Directors,” “Corporate Governance - Board Committees and Membership,” and “Section 16(a) Beneficial Ownership Reporting Compliance” in our definitive Proxy Statement for the 2025 Annual Meeting of Stockholders (to be filed within 120 days after December 31, 2024) is incorporated herein by reference. In addition, the information set forth under "Information about our Executive Officers" in Part I of this Report is incorporated herein by reference.
Item 11. EXECUTIVE COMPENSATION
The information to be set forth under the headings “Executive Compensation,” “Report of Compensation Committee” and “Compensation Committee Interlocks and Insider Participation” in our definitive Proxy Statement for the 2025 Annual Meeting of Stockholders is incorporated herein by reference.
Item 12. SECURITY OWNERSHIP OF CERTAIN BENEFICIAL OWNERS AND MANAGEMENT AND RELATED STOCKHOLDER MATTERS
The information to be set forth under the heading “Stock Ownership” in our definitive Proxy Statement for the 2025 Annual Meeting of Stockholders is incorporated herein by reference.
Equity Compensation Plan Information
The following table gives information about the common stock and Class A common stock that may be issued upon the exercise of options, warrants and rights under all existing equity compensation plans as of December 31, 2024:
Equity Compensation Plan Information
| | | | | | | | | | | Number of securities remaining | |
| | | Number of securities to | | | Weighted-average | | | available for future issuance | |
| | | be issued upon exercise | | | exercise price of | | | under equity compensation | |
| | | of outstanding options, | | | outstanding options, | | | plans (excluding securities | |
Plan Category | | warrants and rights | | | warrants and rights | | | reflected in 1st column) | |
| | | | | | | | | | | | | |
Common Stock: | | | | | | | | | | | | |
Equity compensation plans approved by security holders | | | 1,229,390 | (1) | | $ | - | | | | 2,539,392 | (2) |
| | | | | | | | | | | | | |
Equity compensation plans not approved by security holders | | | - | | | $ | - | | | | - | |
Total | | | 1,229,390 | | | | | | | | 2,539,392 | |
| | | | | | | | | | | | | |
Class A Common Stock: | | | | | | | | | | | | |
Equity compensation plans approved by security holders | | | - | | | $ | - | | | | 1,234,827 | (2) |
| | | | | | | | | | | | | |
Equity compensation plans not approved by security holders | | | - | | | $ | - | | | | - | |
Total | | | - | | | | | | | | 1,234,827 | |
(1) Consists of shares of our common stock underlying our outstanding restricted stock units that are issuable under our 2022 EICP.
(2) Consists of shares of our Class A common stock and common stock that are issuable under our 2022 EICP.
Item 13. CERTAIN RELATIONSHIPS AND RELATED TRANSACTIONS, AND DIRECTOR INDEPENDENCE
The information to be set forth under the headings “Certain Relationships and Related Party Transactions” and “Corporate Governance” in our definitive Proxy Statement for the 2025 Annual Meeting of Shareholders is incorporated herein by reference.
Item 14. PRINCIPAL ACCOUNTANT FEES AND SERVICES
Our independent registered public accounting firm, RSM US, LLP (PCAOB ID: 49), has presented their opinion under Item 8. of this annual report on Form 10-K. No other independent registered public accounting firm has rendered an opinion as part of this annual report.
The information to be set forth under the heading “Ratification of the Company’s Independent Registered Public Accounting Firm for 2025” in our definitive Proxy Statement for the 2025 Annual Meeting of Shareholders concerning principal accountant fees and services is incorporated herein by reference.
PART IV
Item 15. EXHIBITS AND FINANCIAL STATEMENT SCHEDULES
(a) | List of Financial Statements and Financial Statement Schedules: |
| | (1) | Financial Statements. See Part II, Item 8. for the index to financial statements. |
| | (2) | Financial statement schedules: The following financial statement schedule of Gray Media, Inc. is included in Item 15(c): Schedule II – Valuation and qualifying accounts. |
All other schedules for which provision is made in the applicable accounting regulation of the SEC are not required under the related instructions or are inapplicable and therefore have been omitted.
| | Exhibit Number | Description of Documents |
| | | |
| | 3.1 | Amended and Restated Articles of Incorporation of Gray Media, Inc. |
| | | |
| | 3.2 | Bylaws of Gray Media, Inc. as amended |
| | | |
| | 4.1 | Indenture, dated as of June 14, 2016, by and among Gray Media, Inc., the guarantors signatory thereto and U.S. Bank National Association, as Trustee (incorporated by reference to Exhibit 4.1 to our Current Report on Form 8-K filed with the SEC on June 15, 2016) |
| | | |
| | 4.2 | First Supplemental Indenture, dated as of September 14, 2016, by and among Gray Media, Inc., the guarantors signatory thereto and U.S. Bank National Association, as Trustee (incorporated by reference to Exhibit 4.2 to our Current Report on Form 8-K filed with the SEC on September 14, 2016) |
| | Exhibit Number | Description of Documents |
| | | |
| | 4.3 | Second Supplemental Indenture, dated as of January 2, 2019, by and among Gray Media, Inc., the guarantors signatory thereto and U.S. Bank National Association, as Trustee to the Indenture dated as of June 14, 2016 (incorporated by reference to Exhibit 4.3 to our Current Report on Form 8-K filed with the SEC on January 3, 2019) |
| | | |
| | 4.4 | Third Supplemental Indenture, dated as of December 1, 2021 by and among Gray Media, Inc., the guarantor signatory thereto and U.S. Bank National Association, as Trustee to the Indenture dated as of June 14, 2016 (incorporated by reference to Exhibit 4.4 to our Current Report on Form 8-K filed with the SEC on December 1, 2021) |
| | | |
| | 4.5 | Form of 5.875% Senior Note due 2026 (incorporated by reference to Exhibit A to Exhibit 4.1 to our Current Report on Form 8-K filed with the SEC on June 15, 2016) |
| | | |
| | 4.6 | Indenture, dated as of November 16, 2018, by and among Gray Escrow, Inc., Gray Media, Inc. and U.S. Bank National Association, as Trustee (incorporated by reference to Exhibit 4.1 to our Current Report on Form 8-K filed with the SEC on November 16, 2018) |
| | | |
| | 4.7 | First Supplemental Indenture, dated as of January 2, 2019, by and among Gray Media, Inc., the guarantors signatory thereto and U.S. Bank National Association, as Trustee to the Indenture dated as of November 16, 2018 (incorporated by reference to Exhibit 4.1 to our Current Report on Form 8-K filed with the SEC on January 3, 2019) |
| | | |
| | 4.8 | Second Supplemental Indenture, dated as of December 1, 2021 by and among Gray Media, Inc., the guarantor signatory thereto and U.S. Bank National Association, as Trustee to the Indenture dated as of November 16, 2018 (incorporated by reference to Exhibit 4.3 to our Current Report on Form 8-K filed with the SEC on December 1, 2021) |
| | | |
| | 4.9 | Form of 7.000% Senior Note due 2027 (incorporated by reference to Exhibit A to Exhibit 4.1 to our Current Report on form 8-K filed with the SEC on November 16, 2018) |
| | | |
| | 4.10 | Description of securities registered under Section 12 of the Exchange Act (incorporated by reference to Exhibit 4.11 to our Annual Report on Form 10-K filed with the SEC on February 27, 2020) |
| | | |
| | 4.11 | Indenture, dated as of October 19, 2020, by and among Gray Media, Inc., the Guarantors signatory thereto and U.S. Bank National Association, as Trustee (incorporated by reference to Exhibit 4.1 of the Company's Current Report on Form 8-K filed on October 19, 2020) |
| | | |
| | 4.12 | First Supplemental Indenture, dated as of December 1, 2021 by and among Gray Media, Inc., the guarantor signatory thereto and U.S. Bank National Association, as Trustee to the Indenture dated as of October 19, 2020 (incorporated by reference to Exhibit 4.2 to our Current Report on Form 8-K filed with the SEC on December 1, 2021) |
| | Exhibit Number | Description of Documents |
| | | |
| | 4.13 | Form of 4.750% Senior Note due 2030 (incorporated by reference to Exhibit A to Exhibit 4.1 of the Company's Current Report on Form 8-K filed with the SEC on October 19, 2020) |
| | | |
| | 4.14 | Indenture, dated as of November 9, 2021, by and among Gray Escrow II, Inc., Gray Media, Inc. and U.S. Bank National Association, as Trustee (incorporated by reference to Exhibit 4.1 to our Current Report on Form 8-K filed with the SEC on November 9, 2021) |
| | | |
| | 4.15 | Form of 5.375% Senior Note due 2031 (incorporated by reference to Exhibit A to Exhibit 4.1 of our Current Report on Form 8-K filed with the SEC on November 9, 2021) |
| | | |
| | 4.16 | First Supplemental Indenture, dated as of December 1, 2021 by and among Gray Media, Inc., the guarantors signatory thereto and U.S. Bank National Association, as Trustee to the Indenture dated as of November 9, 2021 (incorporated by reference to Exhibit 4.1 to our Current Report on Form 8-K filed with the SEC on December 1, 2021) |
| | | |
| | 4.17 | Indenture, dated as of June 3, 2024, by and among Gray Media, Inc., the Guarantors party thereto and U.S. Bank Trust Company, National Association, as Trustee and Notes Collateral Agent (incorporated by reference to Exhibit 4.1 of the Company’s Current Report on Form 8-K filed with the SEC on June 4, 2024) |
| | | |
| | 4.18 | Form of 10.500% Senior Secured First Lien Note due 2029 (incorporated by reference to Exhibit A to Exhibit 4.1 of our Current Report on Form 8-K filed with the SEC on June 4, 2024) |
| | | |
| | 10.1 | Third Restatement Agreement, dated as of December 1, 2021 by and among Gray Media, Inc., the guarantors party thereto, Wells Fargo Bank, National Association, as administrative agent, and the other lenders and agents party thereto. (incorporated by reference to Exhibit 10.1 to our Current Report on Form 8-K filed with the SEC on November 9, 2021) |
| | | |
| | 10.2 | Fifth Amended and Restated Credit Agreement, dated as of December 1, 2021, by and among Gray Media, Inc., the guarantors party thereto, Wells Fargo Bank, National Association, as administrative agent, and the other agents and lenders party thereto (incorporated by reference to Exhibit 10.2 to our Current Report on Form 8-K filed with the SEC on November 9, 2021) |
| | | |
| | 10.3 | First Amendment to Fifth Amended and Restated Credit Agreement, dated as of December 1, 2020, among Gray Media, Inc., the guarantors party thereto, the lenders party thereto and Wells Fargo Bank, National Association, as administrative agent (incorporated by reference to Exhibit 10.1 to our Current Report on Form 8-K filed with the SEC on March 21, 2023) |
| | Exhibit Number | Description of Documents |
| | | |
| | 10.4 | Second Amendment to Fifth Amended and Restated Credit Agreement, dated as of February 16, 2024, among Gray Media, Inc., the guarantors party thereto, the lenders party thereto and Wells Fargo Bank, National Association, as administrative agent (incorporated by reference to Exhibit 10.1 to our Current Report on Form 8-K filed with the SEC on February 20, 2024) |
| | | |
| | 10.5 | Third Amendment to Fifth Amended and Restated Credit Agreement, dated as of June 4, 2024, among Gray Media, Inc., the guarantors party thereto, the lenders party thereto and Wells Fargo Bank, National Association, as administrative agent (incorporated by reference to Exhibit 10.1 to our Current Report on Form 8-K filed with the SEC on June 4, 2024) |
| | | |
| | 10.6 | Director Restricted Stock Plan (incorporated by reference to Exhibit 10.12 to our Annual Report on Form 10-K (File No. 001-13796) for the year ended December 31, 2002)* |
| | | |
| | 10.7 | Form of Nonqualified Stock Option Award Agreement Pursuant to 2007 Long Term Incentive Plan (incorporated by reference to Exhibit 10.1 to our Quarterly Report on Form 10-Q for the quarter ended March 31, 2012)* |
| | | |
| | 10.8 | Form of Restricted Stock Award Agreement Pursuant to 2007 Long Term Incentive Plan (incorporated by reference to Exhibit 10.2 to our Quarterly Report on Form 10-Q for the quarter ended March 31, 2012)* |
| | | |
| | 10.9 | Gray Media, Inc. 2017 Equity and Incentive Compensation Plan (incorporated by reference to Exhibit 99.1 to our Registration Statement on Form S-8 filed with the SEC on May 3, 2017)* |
| | | |
| | 10.10 | Form of Director Restricted Stock Award Agreement pursuant to the Gray Media, Inc. 2017 Equity and Incentive Compensation Plan (incorporated by reference to Exhibit 10.3 to our Quarterly Report on Form 10-Q for the quarter ended June 30, 2017)* |
| | | |
| | 10.11 | Executive and Key Employee Change in Control Severance Plan (incorporated by reference to Exhibit 10.1 to our Quarterly Report on Form 10-Q for the quarter ended September 30, 2017)* |
| | | |
| | 10.12 | Form of Employee Restricted Stock Award Agreement pursuant to the Gray Media, Inc. 2017 Equity and Incentive Compensation Plan (incorporated by reference to Exhibit 10.2 to our Quarterly Report on Form 10-Q for the quarter ended September 30, 2017)* |
| | | |
| | 10.13 | Form of Employee Restricted Stock Units Award Agreement pursuant to the Gray Media, Inc. 2017 Equity and Incentive Compensation Plan (incorporated by reference to Exhibit 10.3 to our Quarterly Report on Form 10-Q for the quarter ended September 30, 2017)* |
| | | |
| | 10.14 | Gray Media, Inc. 2022 Equity and Incentive Compensation Plan (incorporated by reference to Exhibit 10.1 to our Quarterly Report on Form 10-Q for the quarter ended June 30, 2022) |
| | Exhibit Number | Description of Documents |
| | | |
| | 10.15 | Offer letter, dated June 22, 2018 (incorporated by reference to Exhibit 10.4 to our Current Report on Form 8-K filed with the SEC on January 3, 2019)* |
| | | |
| | 10.16 | Receivables Purchase Agreement, dated as of February 23, 2023, by and among Gray AR, LLC, as seller, the persons from time to time party thereto as Purchasers (as defined therein), Wells Fargo Bank, N.A., as administrative agent, and Gray Media, Inc., in its individual capacity and as initial Master Servicer (as defined therein) (incorporated by reference to Exhibit 10.1 to our Current Report on Form 8-K filed with the SEC on February 27, 2023) |
| | | |
| | 10.17 | First Amendment to the Receivables Purchase Agreement, dated as of June 18, 2024, by and among Gray AR, LLC, as seller, the persons from time to time party thereto as Purchasers (as defined therein), Wells Fargo Bank, N.A., as administrative agent, and Gray Media, Inc., in its individual capacity and as initial Master Servicer (as defined therein) (incorporated by reference to Exhibit 10.1 to our Current Report on Form 8-K filed with the SEC on June 21, 2024) |
| | | |
| | 10.18 | Second Amendment to the Receivables Purchase Agreement, dated as of July 19, 2024, by and among Gray AR, LLC, as seller, the persons from time to time party thereto as Purchasers (as defined therein), Wells Fargo Bank, N.A., as administrative agent, and Gray Television, Inc., in its individual capacity and as initial Master Servicer (as defined therein) (incorporated by reference to Exhibit 10.3 to our Quarterly Report on Form 10-Q filed with the SEC on August 8, 2024) |
| | | |
| | 10.19 | Receivables Sale Agreement, dated as of February 23, 2023, among Gray Media Group, Inc., the various entities listed on schedule I thereto, Gray Media, Inc., and Gray AR, LLC (incorporated by reference to Exhibit 10.2 to our Current Report on Form 8-K filed with the SEC on February 27, 2023) |
| | | |
| | 10.20 | Performance Undertaking, dated as of February 23, 2023, by Gray Media, Inc., in favor of Wells Fargo Bank, N.A., as administrative agent (incorporated by reference to Exhibit 10.3 to our Current Report on Form 8-K filed with the SEC on February 27, 2023) |
| | | |
| | 19.1 | Insider Trading Policy |
| | 21.1 | Subsidiaries of the Registrant |
| | 23.1 | Consent of RSM US LLP |
| | 31.1 | Rule 13a-14(a) Certificate of Chief Executive Officer |
| | 31.2 | Rule 13a-14(a) Certificate of Chief Financial Officer |
| | | |
| | 32.1 | Section 1350 Certificate of Chief Executive Officer |
| | | |
| | 32.2 | Section 1350 Certificate of Chief Financial Officer |
| | | |
| | 97.1 | Compensation Clawback Policy |
| | | |
| | 101.SCH | Inline XBRL Taxonomy Extension Schema Document |
| | 101.CAL | Inline XBRL Taxonomy Extension Calculation Linkbase Document |
| | Exhibit Number | Description of Documents |
| | | |
| | 101.DEF | Inline XBRL Taxonomy Extension Definition Linkbase Document |
| | | |
| | 101.LAB | Inline XBRL Taxonomy Extension Label Linkbase Document |
| | | |
| | 101.PRE | Inline XBRL Taxonomy Extension Presentation Linkbase Document |
| | | |
| | 104 | The cover page from Gray Media, Inc.’s Annual Report on Form 10-K for the fiscal year ended December 31, 2024 has been formatted in Inline XBRL. |
| | * | Management contract or compensatory plan or arrangement. |
| | (c) | Financial Statement Schedules – The response to this section is submitted as a part of Item 15(a) (1) and (2). |
GRAY MEDIA, INC.
SCHEDULE II – VALUATION AND QUALIFYING ACCOUNTS
(in millions)
Col. A | | Col. B | | | Col. C | | | Col. D | | | Col. E | |
| | | | | | | Additions | | | | | | | | | |
| | | | | | | (1) | | | (2) | | | | | | | | | |
| | | Balance at | | | Charged to | | | Charged to | | | | | | | Balance at | |
| | | Beginning | | | Costs and | | | Other | | | | | | | End of | |
Description | | of Period | | | Expenses | | | Accounts (a) (b) | | | Deductions (b) | | | Period | |
| | | | | | | | | | | | | | | | | | | | | |
Year Ended December 31, 2024: | | | | | | | | | | | | | | | | | | | | |
Allowance for credit losses | | $ | 17 | | | $ | 2 | | | $ | - | | | $ | (4 | ) | | $ | 15 | |
Valuation allowance for deferred tax assets | | $ | 9 | | | $ | - | | | $ | (2 | ) | | $ | - | | | $ | 7 | |
| | | | | | | | | | | | | | | | | | | | | |
Year Ended December 31, 2023: | | | | | | | | | | | | | | | | | | | | |
Allowance for doubtful accounts | | $ | 16 | | | $ | 21 | | | $ | - | | | $ | (20 | ) | | $ | 17 | |
Valuation allowance for deferred tax assets | | $ | 10 | | | $ | - | | | $ | (1 | ) | | $ | - | | | $ | 9 | |
| | | | | | | | | | | | | | | | | | | | | |
Year Ended December 31, 2022: | | | | | | | | | | | | | | | | | | | | |
Allowance for doubtful accounts | | $ | 16 | | | $ | 1 | | | $ | - | | | $ | (1 | ) | | $ | 16 | |
Valuation allowance for deferred tax assets | | $ | 22 | | | $ | - | | | $ | (12 | ) | | $ | - | | | $ | 10 | |
| | (a) | The adjustment to the valuation allowance for deferred tax assets represents changes in estimates of our future taxable income and our estimated future usage of certain net operating loss carryforwards, as well as expiration of certain net operating loss carryforwards. |
| | (b) | The adjustments to our allowance for credit losses include net adjustments related to write-offs of receivable balances not considered collectible less recoveries of amounts previously considered to be uncollectable. |
Item 16. FORM 10-K SUMMARY
None
SIGNATURES
Pursuant to the requirements of Section 13 or 15(d) of the Securities and Exchange Act of 1934, the Registrant has duly caused this report to be signed on its behalf by the undersigned, thereunto duly authorized.
| | | Gray Media, Inc. |
| | | |
Date: February 27, 2025 | By: | /s/ Hilton H. Howell, Jr. |
| | | Hilton H. Howell, Jr., |
| | | Chief Executive Officer |
Pursuant to the requirements of the Securities Exchange Act of 1934, this report has been signed below by the following persons on behalf of the Registrant and in the capacities and on the dates indicated.
| | | |
Date: February 27, 2025 | By: | /s/Hilton H. Howell, Jr. |
| | | Hilton H. Howell, Jr., Executive Chairman and Chief Executive Officer |
| | | |
Date: February 27, 2025 | By | /s/ Donald P. LaPlatney |
| | | Donald P. LaPlatney, Director, President and Co-Chief Executive Officer |
| | | |
Date: February 27, 2025 | By: | /s/ Richard L. Boger |
| | | Richard L. Boger, Director |
| | | |
Date: February 27, 2025 | By: | /s/ Luis A. Garcia |
| | | Luis A. Garcia, Director |
| | | |
Date: February 27, 2025 | By: | /s/ Richard B. Hare |
| | | Richard B. Hare, Director |
| | | |
Date: February 27, 2025 | By: | /s/ Robin R. Howell |
| | | Robin R. Howell, Director |
| | | |
Date: February 27, 2025 | By: | /s/ Paul H. McTear |
| | | Paul H. McTear, Director |
| | | |
Date: February 27, 2025 | By: | /s/ Howell W. Newton |
| | | Howell W. Newton, Director |
| | | |
Date: February 27, 2025 | By: | /s/ Sterling A. Spainhour, Jr. |
| | | Sterling A Spainhour, Jr, Director |
| | | |
Date: February 27, 2025 | By: | /s/ Lorraine McClain |
| | | Lorraine McClain, Director |
| | | |
Date: February 27, 2025 | By: | /s/ Jeffrey R. Gignac |
| | | Jeffrey R. Gignac, Executive Vice President and |
| | | Chief Financial Officer |
| | | |
Date: February 27, 2025 | By: | /s/ Jackson S. Cowart, IV |
| | | Jackson S. Cowart, IV, Senior Vice President and Chief Accounting Officer |