UNITED STATES
SECURITIES AND EXCHANGE COMMISSION
Washington, D. C. 20549
FORM 10-K
| [X] | ANNUAL REPORT PURSUANT TO SECTION 13 OR 15(d) OF THE SECURITIES EXCHANGE ACT OF 1934 |
For the fiscal year ended December 31, 2012
or
| [ ] | TRANSITION REPORT PURSUANT TO SECTION 13 OR 15(d) OF THE SECURITIES EXCHANGE ACT OF 1934 |
For the transition period from to
Commission file number 001-34585
GAS NATURAL INC.
(Exact name of registrant as specified in its charter)
| | |
| Ohio | | 27-3003768 |
(State or other jurisdiction of incorporation or organization) | | (I.R.S. Employer Identification No.) |
| | |
1 First Avenue South Great Falls, Montana | | 59401 |
| (Address of principal executive office) | | (Zip Code) |
Registrant’s telephone number, including area code:(800) 570-5688
Securities registered pursuant to Section 12(b) of the Act:
| | |
Title of Each Class | | Name of Each Exchange on Which Registered |
Common, par value $.15 per share | | NYSE Amex Equities |
Securities registered pursuant to Section 12(g) of the Act:
| | |
Title of Each Class | | Name of Each Exchange on Which Registered |
None | | None |
Indicate by check mark if the registrant is a well-known seasoned issuer, as defined in Rule 405 of the Securities Act. Yes [ ] No [X]
Indicate by check mark if the registrant is not required to file reports pursuant to Section 13 or Section 15(d) of the Act. Yes [ ] No [X]
Indicate by check mark whether the registrant (1) has filed all reports required to be filed by Section 13 or 15(d) of the Securities Exchange Act of 1934 during the preceding 12 months (or for such shorter period that the registrant was required to file such reports), and (2) has been subject to such filing requirements for the past 90 days. Yes [X] No [ ]
Indicate by check mark whether the registrant has submitted electronically and posted on its corporate Website, if any, every Interactive Data File required to be submitted and posted pursuant to Rule 405 of Regulation S-T (§232.405 of this chapter) during the preceding 12 months (or for such shorter period that the registrant was required to submit and post such files). Yes [X] No [ ]
Indicate by check mark if disclosure of delinquent filers pursuant to Item 405 of Regulation S-K (§229.405 of this chapter) is not contained herein, and will not be contained, to the best of registrant’s knowledge, in definitive proxy or information statements incorporated by reference in Part III of this Form 10-K or any amendment to this Form 10-K. [ ]
Indicate by check mark whether the registrant is a large accelerated filer, an accelerated filer, a non-accelerated filer, or a smaller reporting company. See the definition of “large accelerated filer”, “accelerated filer” and “smaller reporting company” in Rule 12b-2 of the Exchange Act.
| | | | | | |
Large accelerated filer | | ¨ | | Accelerated filer | | ¨ |
| | | |
Non-accelerated filer | | ¨ (Do not check if a smaller reporting company) | | Smaller Reporting Company | | ü |
Indicate by check mark whether the registrant is a shell company (as defined in Rule 12b-2 of the Act). Yes ¨ No ü
The aggregate market value of the registrant’s common stock held by non-affiliates as of June 30, 2012 was $61,433,816.
The number of shares outstanding of the registrant’s common stock as of March 14, 2013 was 8,389,752 shares.
DOCUMENTS INCORPORATED BY REFERENCE
Portions of the registrant’s definitive proxy statement for the 2012 annual meeting of shareholders of Gas Natural Inc. are incorporated by reference into Part III of this Form 10-K.
As used in this Form 10-K, the terms “Company,” “Gas Natural,” “Registrant,” “we,” “us” and “our” mean Gas Natural Inc. and its consolidated subsidiaries as a whole, unless the context indicates otherwise. Except as otherwise stated, the information is this Form 10-K is as of December 31, 2012.
GLOSSARY OF TERMS
Unless otherwise stated or the context requires otherwise, references to “we,” “us,” the “Company” and “Gas Natural” refer to Gas Natural Inc. and its consolidated subsidiaries. In addition, this glossary contains terms and acronyms that are relevant to natural gas distribution, natural gas marketing and natural gas pipeline operations and that are used in this Form 10-K.
AECO. Alberta Energy Company Limited (used in reference to the AECO natural gas price index).
ASC. Accounting Standard Codification, standards issued by FASB with respect to GAAP.
Bangor Gas Company. Bangor Gas Company, LLC.
Brainard. Brainard Gas Corp.
Bcf. One billion cubic feet, used in reference to natural gas.
Citizens.Citizens Bank of Michigan.
Clarion River. Clarion River Gas Company.
CNG.Compressed Natural Gas.
Cut Bank Gas. Cut Bank Gas Company.
Dekatherm.One million British thermal units, used in reference to natural gas. Abbreviated as Dkt.
EBITDA. Earnings before interest, taxes, depreciation, and amortization.
EPA. The United States Environmental Protection Agency.
EWR. Energy West Resources, Inc.
Energy West. Energy West, Incorporated.
Energy West Development.Energy West Development, Inc.
Energy West Montana.Energy West Montana, Inc.
Energy West Wyoming.Energy West Wyoming, Inc.
Exchange Act. The Securities Exchange Act of 1934, as amended.
FASB. Financial Accounting Standards Board.
FERC. The Federal Energy Regulatory Commission.
Frontier Natural Gas. Frontier Natural Gas, LLC.
Frontier Utilities. Frontier Utilities of North Carolina, Inc.
GAAP. Generally accepted accounting principles in the United States of America.
Gas Natural.Gas Natural Inc.
GNSC. Gas Natural Service Company, LLC.
GPL. Great Plains Land Development Co., Ltd.
Great Plains. Great Plains Natural Gas Company.
Independence. Independence Oil, LLC.
IFRS. International Financial Reporting Standards.
JDOG Marketing. John D. Oil and Gas Marketing Company, LLC.
i
KPSC. Kentucky Public Service Commission.
Kykuit. Kykuit Resources, LLC.
LIBOR. London Interbank Offered Rate.
Lightning Pipeline. Lightning Pipeline Company, Inc.
LNG. Liquefied Natural Gas.
Lone Wolfe.Lone Wolfe Insurance, LLC.
MHRA.Maine Human Rights Act.
MMcf. One million cubic feet, used in reference to natural gas.
MPSC. The Montana Public Service Commission.
MPUC. The Maine Public Utilities Commission.
NCUC. The North Carolina Utilities Commission.
NEO. Northeast Ohio Natural Gas Corp.
NGA. The Natural Gas Act.
OCC,Ohio Consumers’ Counsel
Orwell. Orwell Natural Gas Company.
Osborne Trust. The Richard M. Osborne Trust.
PaPUC. The Pennsylvania Public Utility Commission.
Penobscot Natural Gas. Penobscot Natural Gas Company, Inc.
PGC. Public Gas Company, Inc.
PUCO. The Public Utilities Commission of Ohio.
SEC. The United States Securities and Exchange Commission.
Spelman.Spelman Pipeline Holdings, LLC.
Sun Life.Sun Life Assurance Company of Canada
USPF. United States Power Fund, L.P.
Walker Gas. Walker Gas & Oil Company, Inc.
WPSC. The Wyoming Public Service Commission.
ii
TABLEOF CONTENTS
iii
FORWARD-LOOKING STATEMENTS
This Form 10-K contains forward-looking statements within the meaning of the federal securities laws. Statements that are not historical facts, including statements about our beliefs and expectations, are forward-looking statements. Forward-looking statements include statements preceded by, followed by or that include the words “may,” “could,” “would,” “should,” “believe,” “expect,” “anticipate,” “plan,” “estimate,” “target,” “project,” “intend,” or similar expressions. These statements include, among others, statements regarding our current expectations, estimates and projections about future events and financial trends affecting the financial condition and operations of our business. Forward-looking statements are only predictions and not guarantees of performance and speak only as of the date they are made. We undertake no obligation to update any forward-looking statement in light of new information or future events.
Although we believe that the expectations, estimates and projections reflected in the forward-looking statements are based on reasonable assumptions when they are made, we can give no assurance that these expectations, estimates and projections can be achieved. We believe the forward-looking statements in this Form 10-K are reasonable; however, you should not place undue reliance on any forward-looking statement, as they are based on current expectations. Future events and actual results may differ materially from those discussed in the forward-looking statements. Factors that could cause actual results to differ materially from our expectations include, but are not limited to:
| | • | | fluctuating energy commodity prices, |
| | • | | the possibility that regulators may not permit us to pass through all of our costs to our customers, |
| | • | | the impact of the FERC and state public service commission statutes, regulations, and actions, including allowed rates of return, and the resolution of other regulatory matters, |
| | • | | the impact of weather conditions and alternative energy sources on our sales volumes, |
| | • | | future utilization of pipeline capacity, which can depend on energy prices, competition from alternative fuels, the general level of natural gas and propane demand, decisions by customers not to renew expiring supply contracts and weather conditions, |
| | • | | the ability to obtain adequate supplies of propane for retail sale in the event of an interruption in supply or transportation and the availability of capacity to transport propane to customers, |
| | • | | changes in federal or state laws and regulations to which we are subject, including tax, environmental, and employment laws and regulations, |
| | • | | the ability to meet financial covenants imposed by lenders, |
| | • | | the effect of changes in accounting policies, if any, |
| | • | | the ability to manage our growth, |
| | • | | the ability to control costs, |
| | • | | the ability of each business unit to successfully implement key systems, such as service delivery systems, |
| | • | | the ability to develop expanded markets and product offerings and our ability to maintain existing markets, |
| | • | | the ability to maintain effective internal controls in accordance with Section 404 of the Sarbanes-Oxley Act of 2002, and |
| | • | | the ability to obtain governmental and regulatory approval of various expansion or other projects, including acquisitions. |
iv
PART I
ITEM 1. BUSINESS.
OUR BUSINESS
Gas Natural Inc. is a natural gas company, primarily operating local distribution companies in seven states and serving approximately 73,000 customers in total. We report results in five primary business segments.
| | • | | Natural Gas Operations. Representing the majority of our revenue, we annually distribute approximately 33 Bcf of natural gas to approximately 69,000 customers through regulated utilities operating in Kentucky, Maine, Montana, North Carolina, Ohio, Pennsylvania and Wyoming. Our natural gas utility subsidiaries include Bangor Gas Company (Maine), Brainard (Ohio), Cut Bank Gas (Montana), Energy West Montana, Energy West Wyoming, Frontier Natural Gas (North Carolina), NEO (Ohio), Orwell (Ohio and Pennsylvania), PGC (Kentucky). |
| | • | | Marketing and Production. Annually, we market approximately 1.4 Bcf of natural gas to commercial and industrial customers in Montana and Wyoming and manage midstream supply and production assets for transportation customers and utilities through our subsidiary, EWR. EWR owns an average 46% gross working interest (average 39% net revenue interest) in 160 natural gas producing wells and gas gathering assets located in Glacier and Toole Counties in Montana. |
| | • | | Pipeline Operations. We own the Shoshone interstate and the Glacier gathering natural gas pipelines located in Montana and Wyoming through our subsidiary EWD. |
| | • | | Propane Operations.We deliver liquid propane, heating oil and kerosene to approximately 3,400 residential, commercial and agricultural customers in North Carolina and Virginia through our subsidiary, Independence Oil, LLC (Independence). The operations were acquired in August 2011. |
| | • | | Corporate and Other.Corporate and other encompasses the results of corporate acquisitions and other equity transactions. Included in corporate and other are costs associated with business development and acquisitions, dividend income and recognized gains or losses from the sale of marketable securities. |
Energy West, Incorporated was originally incorporated in Montana in 1909 and was reorganized as a holding company in 2009 to facilitate future acquisitions and corporate-level financing to support our growth strategy. On July 9, 2010, we changed our name to Gas Natural Inc. and reincorporated from Montana to Ohio. Moving the incorporation to Ohio enhances our flexibility and provides a more efficient and sophisticated platform from which to operate and grow.
Recent Events
2012 LNG/CNG
In May 2012, EWR began construction on a liquefied natural gas regasification plant in Waterville, Maine to service a large retail manufacturer of premium disposable tableware. The LNG business is unregulated. The plant was completed in July 2012, and a contract was signed with the new customer. The plant consists of two 15,000 gallon liquid tanks along with a series of valves, odorizers, and vaporizers. In 2012, we also invested in assets for the startup and transport of our CNG business. In March 2013, we sold these assets to Global CNG. We also entered into a sublease agreement with Global CNG for land in Bangor Maine to house a facility for CNG as well as an agreement to supply Global CNG with natural gas for the CNG business. We invested approximately $1.8 million in capital to start up the LNG/CNG business. We believe our presence in the LNG/CNG market will provide us the opportunity to increase earnings in a very fast-growing sector of the gas business.
2012 Lone Wolfe Insurance
In December 2012 we launched our new subsidiary, Lone Wolfe Insurance, LLC, to serve as an insurance agent for the Gas Natural companies as well as other businesses, particularly those engaged in the energy industry. Lone Wolfe currently markets commercial insurance products including workers compensation, commercial auto, umbrella, crime, fidelity, general liability, property and excess. Lone Wolfe’s 2012 reported revenue was not significant and, accordingly under guidance of ASC 280, the accompanying revenue and expense were included in our corporate and other segments on the accompanying financial statements.
1
2013 Potential Acquisition of JDOG Marketing
On August 15, 2012, we entered into an asset purchase agreement with JDOG Marketing and Richard M. Osborne, as trustee of the Osborne Trust to purchase JDOG Marketing. JDOG Marketing is engaged in the business of marketing natural gas. The purchase agreement provides for the acquisition of substantially all of the assets, rights, and properties of JDOG Marketing by Gas Natural.
As consideration for the purchase of the assets, we will pay JDOG Marketing the sum of $2,875,000 at closing, paid by the issuance of 256,926 shares of our common stock at a price of $11.19 per share. In addition, the purchase agreement provides for contingent “earn-out” payments for a period of five years after the closing of the transaction if JDOG Marketing achieves an annual EBITDA target in the amount of $810,432, which is JDOG Marketing’s EBITDA for the year-ended December 31, 2011. If actual EBITDA for a certain year is less than target EBITDA, then no earn-out payment will be due and payable for that particular earn-out period. We obtained shareholder approval of the transaction on March 1, 2013. The consummation of the transaction is subject to the satisfaction or waiver of the receipt of regulatory approvals and the consent of certain of our lenders.
Recent Industry Trends
Since 2000, domestic energy markets have experienced significant price fluctuations. Natural gas experienced peak prices in the mid-2000’s as a result of weather and concerns over supply. However, new technology in drilling has expanded potential sources of natural gas, including shale gases, making natural gas an abundant, economic, clean energy source for the foreseeable future. Given the current environment, we expect that natural gas will maintain a favorable competitive position compared with other fossil fuels which have experienced significant price increases. We believe that conditions are favorable for consumers to convert to natural gas from more expensive fossil fuels even if the cost of conversion includes equipment purchases. Because natural gas is cleaner burning than coal, we feel it will continue to be preferred for electric power generation and industrial applications. Additionally, given the clean burning attributes of natural gas, we believe environmental regulations may enhance this competitive outlook.
Business Strategy
Our strategy is to grow our earnings and increase cash flow by providing energy sources to users in a safe and reliable manner by in the following areas:
| | • | | Invest in existing utilities to expand our distribution system, grow our customer base and maintain reliable, high quality service. To maintain our position as a respected natural gas utility, we have invested, and will continue to invest, substantial capital and resources in our core utility operations in order to meet or exceed applicable regulatory requirements and maintain our infrastructure. We are focused on prudently increasing our customer count and volumes, and increasing our market penetration and market share in areas where we have a competitive advantage on installed services, customer service or pricing to ensure that new customers provide sufficient margins for an appropriate return on the capital investments required to serve those customers. These capital improvements and expansion projects add to our existing utilities and enable us to continue to build rate base throughout our service footprint. |
| | • | | Continue Active Acquisition Strategy. We are actively pursuing potential bolt-on acquisitions to increase our market penetration by acquiring utility operations in or near our current service territories with minimal corporate platform expansion. We also will opportunistically explore acquisition opportunities in new markets that would provide significant operational and customer growth, as well as assist in ensuring access to long-term sources of capital and credit. |
| | • | | Focus on Efficiency to Maximize Returns. We strive to quickly and effectively respond to changing regulatory and public policy initiatives, leverage new technology solutions that significantly improve productivity and customer service and implement organizational changes that improve our performance. By focusing on these critical areas and continuous improvement of operational |
2
| | efficiencies, we expect to be able to effectively control costs and provide reasonable returns to stakeholders by attaining our regulated allowable return on equity as established by our regulators. |
Competitive Strengths
We believe we are well-positioned to execute our business strategy given the following competitive strengths:
| | • | | Growth-Oriented Utilities. Our core assets consist of distribution facilities necessary for the delivery of our customers’ natural gas supply needs within our service territories and regulatory assets related to our regulated utility operations. Approximately 87% of our 2012 revenue was from regulated gas distribution operations, providing a level of stability to our earnings and cash flows. As we have invested in our rate base, our earnings and cash flows have grown with that investment. We operate under a cost-of-service regulatory regime that allows us to recover our reasonable operating costs from customers and earn a reasonable return on our invested capital. We believe that there are significant opportunities for us to expand operations organically in some of our existing service areas as there are currently relatively low penetration rates of gas distribution among potential customers. |
| | • | | Focused Acquisition Strategy. We continue to emphasize growth and have a successful track record of executing on our acquisition strategy. Since 2007, we have made acquisitions in six states representing more than 25,000 additional gas utility customers. These recent acquisitions and our integration of their operations, management, infrastructure, technology and employees provide us with the necessary platform and experience to replicate these successes through new acquisitions opportunities. We believe our track record to date promotes positive relationships and credibility with regulators, municipalities, developers and customers in both existing and prospective service areas. |
| | • | | Geographically Diverse Customer Base. As a result of our recent acquisitions, we now have operations in eight states located in the West, Midwest, Northeast and Mid-Atlantic regions of the country. We believe that this geographically diverse customer base enhances stability of operations and provides us with the opportunity to increase our market penetration in various regions. Additionally, our customers represent a mix of residential, commercial, industrial, agricultural and transportation and no single customer represented more than 1.4% of our natural gas revenue for 2012. Our sales ratio to large commercial and industrial customers is not concentrated in one industry segment but varies across several industry segments, reflecting the diverse nature of the communities we serve. |
| | • | | Experienced Management Team. Our senior management team is highly experienced in the gas utility industry. Our senior management team averages over 25 years’ experience in the industry. We believe our management team is well-equipped to lead the continued execution of our business strategy. |
Natural Gas Operations
Our natural gas operations are located in Kentucky, Maine, Montana, North Carolina, Ohio, Pennsylvania, and Wyoming, and our revenue from the natural gas operations are generated under tariffs regulated by those states. In many states, including all of our service territories, the tariff rates of natural gas utilities are generally established to allow the utility to earn revenue sufficient to recover operating and maintenance costs, plus profits in amounts equal to a reasonable rate of return on their “rate base.” A gas utility’s rate base generally includes the utility’s original cost, cost of inventory and an allowance for working capital, less accumulated depreciation of installed used and useful gas pipeline and other gas distribution or transmission facilities. Each state’s regulatory body, in addition to regulating rates, also regulate adequacy of service, issuance of securities, compliance with U.S. Department of Transportation safety regulations and other matters.
Kentucky
In April, 2012, we acquired the stock of PGC from Kentucky Energy Development, LLC. Our operations in Kentucky provide natural gas service to customers in Breathitt, Wolfe, Johnson, Lawrence, Lee, Morgan, and Magoffin counties through 49 miles of distribution pipe. Our rates are subject to a tariff governed by the KPSC. Our service area has a population of approximately 176,000 people. Our Kentucky operations provide service to approximately 1,600 residential and commercial customers. The primary firm gas supply marketer for Kentucky is Jefferson Gas, LLC.
3
Maine
Our operations in Maine provide natural gas service to customers in Bangor, Brewer, Bucksport, Old Town, Orono and Veazie through 10 miles of transmission pipeline and 142 miles of distribution system. This service area has a population of approximately 63,000 people. Our Maine operations provide service to approximately 3,600 residential, commercial and industrial customers. We offer transportation services to approximately 50 customers through special pricing contracts. These customers accounted for approximately 24.3% of the revenue of our Maine operations in 2012.
In Maine, our primary gas supply marketer is Repsol Energy North America Corporation. We receive our gas supply from the Maritimes & Northeast Pipeline transmission system. Our supply contract is on a full requirements basis with Repsol Energy North America Corporation. We review the gas supply agreement every two years.
Montana
Our operations in Montana provide natural gas service to customers in and around Great Falls, Cascade, West Yellowstone, and Cut Bank. The population of our service area is approximately 88,000 people. Our Montana operations provide service to approximately 30,800 customers.
The primary gas supply marketers for our Montana natural gas distribution operations are Jefferson Energy Trading and Tenaska Marketing Ventures.
Our Montana operations use the Northwestern Energy pipeline transmission system to transport supplies of natural gas for its core load and to provide transportation and balancing services to customers who have chosen to obtain natural gas from other suppliers. Our gas supply needs are secured under a one-year contract with Northwestern Energy that includes annual renewals.
North Carolina
Our North Carolina operations provide natural gas service to customers in Ashe, Surry, Warren, Wilkes, Watauga, and Yadkin Counties. This service area has a population of approximately 47,000 people. The major communities in our North Carolina service area are Boone, Elkin, Mount Airy, Wilkesboro, Warrenton, West Jefferson and Yadkinville. Our North Carolina operations provide service to approximately 2,000 residential, commercial and transportation customers through 139 miles of transmission pipeline and 282 miles of distribution system. We offer transportation services to approximately 25 customers through special pricing contracts. These customers accounted for approximately 37.2% of the revenue of our North Carolina operations in 2012.
In North Carolina, our primary gas supply marketers are BP Energy Company and Twin Eagle. We receive our gas supply from the Transcontinental Gas Pipe Line Company transmission system. Our supply contract with BP Energy expired in October 2012, and a new two year contract was signed with Twin Eagle to provide 100% of our gas needs.
Ohio and Pennsylvania
Our Ohio operations provide natural gas service to customers in Ashland, Ashtabula, Carroll, Columbiana, Coshocton, Cuyahoga, Fairfield, Franklin, Geauga, Guernsey, Harrison, Hocking, Holmes, Huron, Knox, Lake, Lorain, Mahoning, Medina, Portage, Richland, Stark, Summit, Trumbull, Tuscarawas, Washington, and Wayne counties. This service area has a population of approximately 5.9 million people. Our Pennsylvania operations provide natural gas service to customers in Armstrong, Butler, Clarion, Elk, Forest and Jefferson counties. This service area has a population of approximately 398,000 people. Together, our Ohio and Pennsylvania operations provide service to approximately 24,500 residential, commercial and industrial customers through approximately 1,231 miles of transmission and distribution pipelines.
Our Ohio and Pennsylvania utilities receive gas supply from various sources, including JDOG Marketing (owned by our chairman and CEO), BP Energy, Compass Energy Gas Services LLC, Constellation Energy, Exelon Energy Company, Mid-American Natural Resources, and Sequent Energy Management. We transport natural gas
4
on the following interstate pipelines: Columbia NiSource Gas Transmission Systems, Dominion East Ohio, National Fuel, and Tennessee Gas Pipeline. We transport natural gas on the following intrastate pipelines: Central Penn, North Coast Gas Transmission, Cobra Pipeline (owned by our chairman and CEO), Orwell Trumbull Pipeline (owned by our chairman and CEO), and Spelman.
Our Ohio and Pennsylvania companies have local gas supply purchase agreements with JDOG Marketing. These arrangements are at variable NYMEX based market prices. In addition, JDOG Marketing acts as agent for these utilities to identify and arrange supply of natural gas in the interstate market at variable and (or) fixed prices.
In April 2011, we acquired intrastate pipeline assets from Marathon Petroleum Company, LP by our subsidiary, Spelman Pipeline Holdings, LLC, an Ohio regulated intrastate pipeline company. The assets include a pipeline and rights-of-way located in Ohio and Kentucky. We have converted the pipeline to transport natural gas to new markets where natural gas service is currently not available, as well as connect it to markets served by our Ohio subsidiaries. In October 2011, the PUCO approved the transportation service tariff of Spelman.
Wyoming
Our operations in Wyoming provide natural gas service to customers in and around Cody, Meeteetse, and Ralston. This service area has a population of approximately 11,000 people. Our Wyoming operations provide service to approximately 6,700 customers, including one large industrial customer. Our Wyoming operations transport gas for third parties pursuant to a tariff approved by the WPSC.
Our Wyoming operation has an industrial customer whose pricing is subject to an industrial tariff. This tariff provides for decreasing tiered pricing based on volume. This customer accounted for approximately 11.0% of the revenue of our Wyoming operations and approximately 1.0% of the consolidated revenue of the natural gas segment of our business in 2012. This customer’s business is cyclical and depends upon the growth in housing market in this area.
The primary gas supply marketers for our Wyoming natural gas distribution operations have been Concord Energy and Tenaska Marketing Ventures. Our marketing and production operations supply natural gas to our Wyoming operations pursuant to an agreement through March 2014.
Marketing and Production
We market approximately 1.4 Bcf of natural gas annually to commercial and industrial customers in Montana and Wyoming and manage midstream supply and production assets for transportation customers and utilities through our subsidiary, EWR. In order to provide a stable source of physical natural gas volumes for a portion of its requirements, EWR currently holds an average 46% gross working interest (average 39% net revenue interest) in 160 natural gas producing wells in operation on state lease mineral rights in Glacier and Toole Counties in Montana. This production gives EWR a partial natural hedge when market prices of natural gas are greater than the cost of production. The gas production from these wells and assets provided approximately 19.9% of the volume requirements for EWR in our Montana market for the year ended December 31, 2012. These wells are relatively shallow and we have not yet explored the deeper formations on our production properties.
EWR owns a 24.5% interest in Kykuit, a developer and operator of oil, gas and mineral leasehold estates located in Montana. We have invested a total of approximately $2.1 million in Kykuit and may invest additional funds in the future as Kykuit could provide a supply of natural gas in close proximity to our natural gas operations in Montana. However, our obligations to make additional investments in Kykuit are limited under our agreement with the other Kykuit investors. We are entitled to cease further investments in Kykuit if, in our reasonable discretion after the results of certain initial exploration activities are known. At December 31, 2012, we are obligated to invest no more than an additional $114,000 over the life of the venture. Other investors in Kykuit include our chairman and CEO, Richard M. Osborne, and John D. Oil and Gas Company, a publicly held gas exploration company, which is also the managing member of Kykuit. Additional investors include Thomas J. Smith, a director and our chief financial officer, and a director of John D. Oil and Gas Company, and Gregory J. Osborne, a director and employee and former president and director of John D. Oil and Gas Company. Our net investment in Kykuit after deducting undistributed losses of approximately $1.8 million is approximately $322,000.
5
Pipeline Operations
Through EWD, we operate two natural gas pipelines, the “Glacier” natural gas gathering pipeline and the “Shoshone” transmission pipeline. The pipelines extend from the north of Cody, Wyoming to Warren, Montana. The Shoshone pipeline is an approximately 30 mile long bidirectional pipeline that transports natural gas between Montana and Wyoming. This enables us to sell natural gas to customers in Wyoming and Montana through our EWR subsidiary and gives EWR access to the AECO and the CIG natural gas price indices. The Glacier gathering pipeline is approximately 40 miles in length and enables us to transport production gas for processing. We believe that our pipeline operations represent an opportunity to increase our profitability over time by taking advantage of summer/winter pricing differentials, as well as, AECO and CIG natural gas index differentials and to continue transporting more production gas to market. We currently are seeking ways in which we can maximize our pipeline operations by increasing the capacity and throughput of our existing pipeline assets.
Propane Operations
Through Independence we deliver liquid propane, heating oil and kerosene to approximately 3,400 customers from our facilities in West Jefferson, North Carolina and Independence, Virginia. The operations were acquired in August 2011.
Corporate and Other
Our corporate and other reporting segment is intended primarily to encompass the results of corporate acquisitions and other equity transactions, as well as certain other income and expense items associated with holding company functions. As we continue to implement our acquisition strategy and grow, we will report additional items associated with potential and completed acquisitions under this reporting segment.
Acquisitions
As a result of our success in strengthening our core natural gas business, we are now able to focus on our growth strategy which includes the acquisition and expansion of our natural gas utility operations in small and emerging markets. We regularly evaluate gas utilities of varying sizes for potential acquisitions. We believe we have the operating expertise to handle a significantly greater number of customers. For example, several operational managers have joined our team who have natural gas utility experience with larger companies. We intend to focus on acquisitions that will enable us to grow our customer base in a manner and scale consistent with the full strategic vision of our senior leadership team. We believe there are opportunities to acquire financially-sound smaller natural gas utility companies that are individually owned or controlled. In addition, we intend to target larger diversified utility companies that have a natural gas distribution operating segment.
We have combined newly acquired operations with our current operations to maximize efficiency and profitability. Upon acquiring a distribution company, management may decide to centralize functions (i.e. accounting) or decentralize functions (i.e. gas marketing). We believe our senior management’s gas utility experience and expertise will improve the acquired company’s operating efficiency and gas marketing capabilities resulting in improved profitability.
Acquisition Strategy
Our acquisition strategy includes identifying geographic areas that have low market saturation rates in terms of natural gas utilization as a result of historical reliance by customers on alternate fuels such as heating oil. According to the American Gas Association, the national average for natural gas saturation in the residential heating market was approximately 51% in 2005, whereas large segments of the North Carolina and Maine market remain unsaturated, with penetration rates of less than 3% and as low as 1% in certain areas. We believe these low penetration rates are partially the result of these geographic areas being overlooked by other gas distributors in light of this historical reliance on other energy sources. The large disparity between competitive fuels presents an opportunity for gas distributors to capture a larger share of the energy market in these states. This strategy led to our acquisitions of Frontier Natural Gas Company and Bangor Gas Company.
6
In addition to acquiring utilities in low saturation markets or close proximity to our current service areas, we continue to evaluate acquiring under-performing utilities in more mature gas markets or smaller utilities that are part of larger utility holding companies. We believe our focus on operational excellence, cost controls, and prudent capital investment facilitates our ability to increase performance and profitability of under-performing assets and non-core assets. Our strategy also includes adding geographic locations that provide balance and organic growth prospects to our overall performance, while mitigating weather, economic, regulatory and/or competitive risks.
We will evaluate potential natural gas related acquisitions to determine whether these operations could expand our core utility business. For example, we may acquire pipeline assets in order to bring natural gas service to new customers such as the Spelman pipeline in Ohio and Loring Pipeline in Maine. In addition, we believe our acquisition of Independence will provide us with opportunities to convert liquid propane and heating oil customers to natural gas due to the cost benefit and reliability associated with natural gas. Also, we may acquire natural gas related non-utility operations such as gathering, storage and marketing operations.
2011 Expansion in Ohio and into Kentucky
On April 21, 2011, we acquired 140 miles of pipeline assets located from Marion to Youngstown, Ohio and 60 miles of rights-of-way located in the Louisville area and points south in Kentucky. We have converted the Ohio pipeline to transport natural gas to new markets where natural gas service is not currently available, as well as to connect to markets served by the Ohio subsidiaries. We do not currently have any plans for the Kentucky assets. The PUCO authorized Spelman to operate as an intrastate pipeline company in Ohio under a tariff regulating rates governed by the PUCO.
2011 Expansion into North Carolina and Virginia
On August 1, 2011, we completed the acquisition of Independence Oil & LP Gas, Inc. Independence Oil & LP Gas, Inc. delivered liquid propane, heating oil and kerosene to approximately 3,400 customers in North Carolina and Virginia. We created a new subsidiary and continue to serve the customers acquired in the acquisition and plan to expand to other customers within the region. Additionally where feasible, we plan to convert customers from their current source over to natural gas as the cost of natural gas is currently a cheaper and more reliable fuel source.
2012 Expansion in Kentucky
In April, 2012, we acquired the stock of Public Gas Company, Inc. from Kentucky Energy Development, LLC. Our operations in Kentucky provide natural gas service to customers in Breathitt, Wolfe, Johnson, Lawrence, Lee, Morgan, and Magoffin counties through 49 miles of distribution pipe. Our Kentucky operations provide service to approximately 1,600 residential and commercial customers.
2012 Expansion in Maine
On April 17, 2012, we entered into an agreement with United States Power Fund, L.P. to place a bid at a public auction on certain assets that were being foreclosed upon by USPF. Those assets included various parcels of land as well as a leasehold interest in a pipeline corridor easement running from Searsport to Limestone, Maine. The assets were owned by Loring BioEnergy, LLC and were being foreclosed upon by USPF due to LBE’s default on a loan that it had obtained from USPF. On June 4, 2012 we attended the public foreclosure auction and were the successful bidder.
Competition
Natural Gas Operations
In our natural gas operations, we generally face competition in the distribution and sales of natural gas from suppliers of other fuels, including coal, electricity, oil and propane. Traditionally, the principal considerations affecting a customer’s selection of utility gas service over competing energy sources include service, price, equipment conversion costs, reliability, and ease of delivery. In addition, the type of equipment already installed in a business and residence significantly affects the customer’s choice of energy. However, with respect to the
7
majority of our service territory, previously installed equipment is not an issue. Households in recent years have generally preferred the installation of natural gas and/or propane for space and water heating as an energy source.
In Montana and Ohio, the regulatory framework does not provide gas distribution companies with exclusive geographic service territories. In Maine, new territory and expansion is uncertified until a natural gas company builds a gas system in the community. Maine is an emerging natural gas market and new natural gas companies are entering the market. Alternative energy sources such as wood, electric, landfill gas, oil and propane continue to provide a competitive threat. However, in Montana, we have faced relatively little competition from other gas companies primarily because geographic barriers to entry make it cost-prohibitive for competitors to enter noncontiguous locations. By contrast, in Ohio, we face significant competition from larger natural gas companies where our service territories are contiguous to other gas distribution utilities.
The following table summarizes our major competitors by state.
| | |
State | | Competition |
Kentucky | | Columbia Gas of Kentucky, Delta Gas, Kentucky Frontier Gas |
| |
Maine | | Northern Utilities Inc., Maine Natural Gas, various fuel oil distributors, electric providers |
| |
Montana | | Northwestern Energy, Montana-Dakota Utilities Co. |
| |
North Carolina | | Various fuel oil distributors, electric providers |
| |
Ohio | | Dominion East Ohio, Columbia Gas of Ohio, National Gas & Oil, various propane and fuel oil distributors, electric providers |
| |
Pennsylvania | | Various propane and fuel oil distributors, electric providers |
| |
Wyoming | | Various propane distributors, electric providers |
Our marketing and production operations compete principally with other natural gas marketing firms doing business in Montana and Wyoming.
Propane Operations
We have propane operations in North Carolina and Virginia. We generally face competition in the distribution and sales of natural gas from suppliers of other fuels, including coal, electricity, natural gas and oil. Traditionally, the principal considerations affecting a customer’s selection over competing energy sources include service, price, equipment costs, reliability, and ease of delivery. In addition, the type of equipment already installed in a business or residence significantly affects the customer’s choice of energy. Households in recent years have generally preferred the installation of natural gas and/or propane for space and water heating as an energy source.
Gas Supply Marketers and Gas Supply Contracts
Our local distribution companies purchase gas from various gas supply marketers for resale to our customers. The market forces of supply and demand determine the price of natural gas and affect the purchase price that our companies will pay for gas. The price we charge to our end users is a pass through commodity rate. This gas cost recovery rate includes not only the cost of the commodity, but also the transportation fees to move gas from major supply areas to our customers. We maintain a portfolio of both fixed price and market price contracts for its gas cost recovery customers. We use such arrangements to protect profit margins on future obligations and for protection in volatile natural gas markets. This portfolio includes a supply mixture of both interstate natural gas as well as locally produced natural gas. Our cost of gas is reviewed and approved by various public utility commissions. Jefferson Energy Trading has been a significant, non-exclusive gas supply marketer for our marketing and production subsidiary, EWR. EWR also supplies itself with natural gas through the ownership of natural gas producing wells in operation in north central Montana. For more information, see the sections captioned “Marketing and Production” and “Natural Gas Operations”.
Natural gas can be stored for indefinite periods of time. Traditionally, natural gas has been a seasonal fuel. We purchase and store natural gas during the summer months when demand and prices are low. This stored gas plays a vital role in ensuring that any excess supply delivered during the summer months is available to meet the increased demand of our customers during the winter months.
8
Governmental Regulation
State Regulation
Our utility operations are subject to regulation by the KPSC, MPUC, MPSC, NCUC, PUCO, PaPUC, and the WPSC. These authorities regulate many aspects of our distribution operations, including construction and maintenance of facilities, operations, safety, and regulatory rates charged to our customers which control the rate of return we are allowed to realize. For additional discussion of our Natural Gas Operations segment’s rates and regulation, see “Management’s Discussion and Analysis of Financial Condition and Results of Operations – Critical Accounting Policies and Estimates”.
Rate Regulation, Cost Recovery and Rate Cases
Utility ratemaking is the statutory process by which our utilities set the price we charge to our customers for utility service. It determines a utility’s revenue requirements and sets the prices paid for service accordingly. Ratemaking, carried out through “rate cases” before a public utility commission, serves as one of the primary instruments of government regulation of our utilities. The various regulatory commissions approve rates intended to permit a reasonable rate of return on investment. Funds for capital expenditures are typically obtained from capital loans or investments, revenue which recovers investment cost as depreciation expense, and undistributed retained earnings. Under regulation, our total revenue requirements (the prices paid by our customers) are limited to an amount that will yield a specified annual return on the value investment of property used and useful in public service (rate base), plus reimbursement of all necessary and proper operating expenses, taxes, interest, and depreciation. The price charged meets the test of reasonableness by our regulatory commissions and customers and at the same time permits our shareholders to earn a fair return on their investment. When our fair rate of return deviates from the assumptions used in establishing the rates, a deviation in our earned return occurs. When this becomes substantial, new proceedings are necessary to adjust the rates to provide for a fair return.
Kentucky
Our Kentucky operation generates revenue under a traditional rate-base tariff subject to regulation by the KPSC. Our tariff is structured to enable a reasonable rate of return on investment based upon a “rate base” process. Along with the traditional rate is the gas cost mechanism which is a pass-through to the customer. The KPSC incorporates a purchased-gas commodity cost adjustment mechanism that allows PGC to adjust rates periodically to recover changes in its wholesale gas costs.
Maine
Our Maine operations generates revenue under tariffs regulated by the MPUC, and as in other states, our tariffs are generally structured to enable us to realize a sufficient rate of return on investment. However, our tariffs and permitted return are not based upon a “rate base” as in other states, but on an alternative market-based framework. Because heating oil and other alternative fuels are historically prevalent in Maine and because Bangor Gas Company entered the market in 1999 with few customers and sizeable start-up costs, the MPUC established a rate plan for Bangor Gas Company that was based upon the costs of distribution of alternative fuels. The goal of this alternative framework was to allow Bangor Gas Company to compete as a start-up gas utility with distributors of alternative fuels.
Accordingly, our rates include transportation charges and customer charges. Additionally, if our cumulative profits exceed certain levels, we are then subject to a revenue sharing mechanism. Bangor Gas Company has never exceeded that cumulative profit level, thus the revenue sharing mechanism has not been triggered. Our Maine tariff also includes a purchased gas adjustment clause, which allows our operation to adjust rates monthly to recover changes in gas costs. In connection with our acquisition of Bangor Gas Company, the MPUC extended the ten-year rate plan that had been established in 1999 for Bangor Gas Company for an additional three years. The existing rate plan in Maine was effective until December 2012. The Company has submitted an application to continue the plan with the MPUC. The current rate plan remains in place while the Company’s application is processed by the MPUC.
9
Montana
Our Montana gas utility operations are subject to regulation by the MPSC and generate revenue under regulated tariffs designed to recover a base cost of gas and administrative and operating expenses and to provide a sufficient rate of return to cover interest and profit. Our largest utility, Energy West, has a traditional rate base structure in Montana, as established in a rate proceeding at the MPSC, and its rates are based upon the opportunity to earn an allowed return on equity and an overall rate of return. Cut Bank, which is a subsidiary of Energy West, has separate rates that were also established in a rate case where cost of service analysis was employed and an authorized overall rate of return identified. The MPSC allows customers to choose a natural gas supplier other than our Montana operations, and we provide gas transportation services to customers who purchase from other suppliers.
Our Montana utility’s tariffs include a purchased gas adjustment clause, which allows our Montana operations to adjust rates periodically to recover changes in gas costs. We have right of way privileges for our Montana distribution systems either through franchise agreements or right of way agreements within our service territories.
North Carolina
Our North Carolina operations generate revenues under tariffs regulated by the NCUC. The tariffs are market-based rates structured to enable us to be competitive in the market place and provide a sufficient rate of return. In connection with our acquisition of Frontier Natural Gas, Energy West and NCUC agreed to extend the rate plan in place at the time of the acquisition for a period of five years. Accordingly, the staff of the NCUC did not reduce our rates during that period. The North Carolina regulatory framework, however, incorporates a purchased-gas commodity cost adjustment mechanism that allows Frontier to adjust rates periodically to recover changes in its wholesale gas costs.
When the NCUC approved our acquisition of Frontier Natural Gas, it instituted a set of regulatory conditions including a rate moratorium for a period of five years and a reduction of its margin rates for residential and small general firm service by 10%. These rates were maintained through September 2012, and the NCUC is satisfied with the continuance of our current rate. The margin rate consists of the tariff rate less benchmark gas costs.
Ohio and Pennsylvania
Our Ohio and Pennsylvania operations are regulated by the PUCO and the PaPUC. Our Ohio utilities operate under a traditional rate base regulatory mechanism. However, only NEO has tariff rates established by a general rate case. A cost of service analysis was done in that case resulting in a stipulation of all parties. The stipulation identified an authorized rate of return on rate base but did not articulate a capital structure or an allowable return on equity.
Orwell’s currently approved tariff rates were established in June 2007 in an “application not for an increase in rates,” sometimes referred to as a “first filing.” No cost of service analysis is required in a “first filing” and the PUCO approved the current rates by finding them not to be unjust or unreasonable.
When Orwell acquired its Clarion River and Walker Gas divisions in Pennsylvania in 2005, it adopted the tariffs of those utilities without cost of service analysis being performed. Brainard adopted the tariff of its predecessor company when the PUCO approved its acquisition of Power Energy in August 1999. The rates included in that tariff were originally approved by the PUCO as not being unjust and unreasonable in a “first filing” by Power Energy in 1998. No cost of service analysis was performed.
Wyoming
Our Wyoming operations generate their revenues under tariffs regulated by the WPSC. The tariffs are structured to enable us to recover a reasonable rate of return based on investment plus reimbursement of reasonable operating expenses, taxes, interest, and depreciation. Our rate of return is subject to annual review by the WPSC. Our Wyoming operations’ tariffs include a purchased gas adjustment clause, which allows our Wyoming operations to adjust rates periodically to recover changes in gas costs.
10
We have a certificate of public convenience and necessity granted by the WPSC for transportation and distribution covering the west side of the Big Horn Basin, which extends approximately 70 miles north and south and 40 miles east and west from Cody. Our Wyoming operations also offer transportation through its pipeline system. This service is designed to permit producers and other purchasers of gas to transport their gas to markets outside of our Wyoming operations’ distribution and transmission system.
Holding Company Reorganization and Ring-Fencing Measures
In August 2009, we implemented a holding company structure to reduce the regulatory limitations imposed by state regulatory commissions on our non-utility operations or on utility operations in states outside of their individual jurisdictions. However, each of our state regulatory commissions may still place limitations on us with respect to certain corporate and financial activities and with respect to the regulated activities in their states. For example, as a condition to approving our holding company reorganization, the MPSC and WPSC each imposed certain ring-fencing measures. These regulatory conditions covered a variety of activities, including a requirement that our regulated natural gas operating subsidiaries in Maine, Montana, North Carolina and Wyoming must meet certain notice and financial requirements prior to paying dividends, and that our Maine and North Carolina utilities, which are currently subsidiaries of our subsidiary Energy West, be converted to direct subsidiaries of Gas Natural upon the earlier of the expiration or refinance of Energy West’s debt, unless segregating the Maine and North Carolina operations would be detrimental to our Montana or Wyoming customers. In that event, Energy West would have the opportunity to request a waiver of the spin-off requirement from the MPSC and WPSC. When Energy West sought to refinance its debt in 2012, it determined the required spin-off of the Maine and North Carolina operations would be detrimental to its customers in all four states, and therefore, sought appropriate waivers from the MPSC and WPSC. The MPSC and WPSC each granted the requested waiver, but any future refinancing will require an additional waiver or the spin-off of our Maine and North Carolina operations. In addition, the MPUC and the NCUCC have both expressed reluctance to permit the spin-off required by the MPSC. Therefore, it is unclear what regulatory conditions will be imposed with respect to the structure of Energy West in the future and the impact on Energy West in the event it receives conflicting regulatory orders from different commissions. In addition, each of the MPSC, MPUC, NCUCC and WPSC have issued ring-fencing and regulatory compliance requirements that Energy West and its regulated subsidiaries in Montana, Maine, North Carolina and Wyoming must continue to meet on an on-going basis. We obtained the approval of the WPSC for our holding company reorganization in October 2008, but in connection with its approval of our acquisition of the Ohio and Pennsylvania utilities, the WPSC issued an order, affirmed on rehearing issued in November 2011, holding Gas Natural subject to its general jurisdiction over public utilities. In December 2011, we timely filed a petition for review of the WPSC order in the Laramie County, Wyoming District Court. On October 9, 2012, the District Court reversed the WPSC’s finding of jurisdiction and remanded to the WPSC for additional findings. The WPSC has scheduled a hearing on the matter on April 3 and 4, 2013. Until the jurisdictional issue is resolved, we cannot predict whether or when the WPSC will assert jurisdiction over us in the future, including activities that take place at the holding company level. If, following the hearing, the WPSC rules that is has jurisdiction over us with respect to a potential acquisition, refinancing of debt or other significant transaction and denies a request by us for exemption with respect to the transaction, it could delay, hinder or prevent us from completing the transaction. To date, none of the other public service commissions’ have asserted jurisdiction over Gas Natural, although we cannot predict whether or not any commission will attempt to do so in the future or under what circumstances.
Certificated Territories and Franchise Agreements
In some states in our natural gas operations, local distribution companies are required to obtain certificates of public convenience or necessity from the state regulatory commissions before they may distribute gas in a particular geographic area. In addition, local distribution companies are often subject to franchise agreements entered into with local governments. While the number of local governments that require franchise agreements is diminishing historically, many of the local governments in our service areas still require them and could require us to cease our occupation of the streets and public grounds or prohibit us from extending our facilities into any new area of that city or community if a franchise agreement is not in effect. Accordingly, when and where franchise agreements are required, we enter into agreements for franchises with the cities and communities in
11
which we operate authorizing us to place our facilities in the streets and public grounds, and we attempt to acquire or reacquire franchises whenever feasible.
We have obtained all certificates of convenience and necessity and/or franchise agreements from state regulatory commissions and from local governments in those states where required in order to provide natural gas utility service. In most cases, certificates of public convenience and necessity and franchise agreements do not provide us with exclusive distribution rights. The specific requirements of the states and services areas in which we operate are discussed below.
Certificates of public convenience and necessity are required in Kentucky, Maine, North Carolina, Pennsylvania and Wyoming. In Maine, we have been granted the right by the MPUC to distribute gas in our service areas under certificates of public convenience and necessity. A currently certificated gas utility is not required to seek MPUC authority to serve in a municipality not served by another gas utility, but otherwise must seek MPUC approval to serve. In North Carolina, the right to distribute gas is regulated by the NCUC, which generally divides service territories by county, and we have been granted the right by the NCUC to distribute gas in the six counties in which we operate under certificates of public convenience and necessity from the NCUC. In Pennsylvania, our service territories are exclusive under certificates of public convenience and authority granted by PaPUC. In Wyoming, we have a certificate of public convenience and necessity granted by the WPSC for transportation and distribution covering the west side of the Big Horn Basin. Certificates of public convenience and necessity are not required in Ohio or Montana. In Kentucky, we cannot commence providing utility service to or for the public or begin the construction of any plant, equipment, property, or facility for furnishing to the public any services until we have obtained from the KPSC a certificate that public convenience and necessity require the service or construction. Upon the filing of an application for a certificate, and after any public hearing which the commission may in its discretion conduct for all interested parties, the commission may issue or refuse to issue the certificate. No utility can apply for or obtain any franchise, license, or permit from any city or other governmental agency until it has obtained a certificate of convenience and necessity from the KPSC.
Franchise agreements are utilized in Montana, North Carolina and Wyoming. In Montana, we hold franchise agreements in the cities of Great Falls and West Yellowstone. In North Carolina, we have franchise agreements with all of the incorporated municipalities in the six counties certificated by NCUC to install and operate gas lines in those municipalities’ streets and right-of-ways. In Wyoming, we hold franchise agreements in the cities of Cody and Meeteetse. We are not required to obtain franchise agreements for our operations in Kentucky, Maine, Ohio or Pennsylvania; although in Ohio, non-exclusive franchise ordinances or agreements are permitted.
Federal Regulations
Our interstate natural gas operations are also subject to federal regulations with respect to rates, services, construction/maintenance and safety standards. This regulation plays a significant role in determining our profitability. Various aspects of the transportation of natural gas are also subject to, or affected by, federal regulation under the NGA, the Natural Gas Policy Act of 1978 and the Natural Gas Wellhead Decontrol Act of 1989. The Federal Energy Regulatory Commission (FERC) is the federal agency vested with authority to regulate the interstate gas transportation industry. Our Shoshone transmission pipeline is subject to certain FERC regulations applicable to interstate activities, including (among other things) regulations regarding rates charged. Our pipeline rates must be filed with FERC. The Shoshone pipeline has rates on file with FERC for firm and interruptible transportation that have been determined to be just and reasonable. The operations of the Shoshone pipeline are subject to certain standards of conduct established by FERC that require the Shoshone pipeline to operate separately from, and without sharing confidential business information with, EWR to the maximum extent practicable. In contrast, FERC has determined that our interstate pipeline and natural gas operations in Wyoming may share operating personnel so long as our natural gas operations in Wyoming do not market natural gas. Also, to the extent that our utilities have contracts for transportation and storage services under FERC-approved tariffs with interstate pipelines, our utilities are subject to FERC rules and regulations pertaining to those services. If we fail to follow applicable FERC rules and regulations, we may be subject to judgments, fines or penalties.
12
Under certain circumstances, gathering pipelines are exempt from regulation by FERC. Our Glacier gathering pipeline has been determined to be non-jurisdictional by FERC, and is therefore not subject to regulation by FERC. Our interstate pipeline operations are also subject to federal safety standards promulgated by the Department of Transportation under applicable federal pipeline safety legislation, as supplemented by various state safety statutes and regulations.
Environmental Matters
Environmental Laws and Regulations
Our business is subject to environmental risks normally incident to the operation and construction of gathering lines, pipelines, plants and other facilities for gathering, processing, treatment, storing and transporting natural gas and other products. These environmental risks include uncontrollable flows of natural gas, fluids and other substances into the environment, explosions, fires, pollution and other environmental and safety risks. The following is a discussion of certain environmental and safety concerns related to our business. It is not intended to constitute a complete discussion of the various federal, state and local statutes, rules, regulations, or orders to which our operations may be subject. For example, we, even without regard to fault, could incur liability under the Comprehensive Environmental Response, Compensation, and Liability Act of 1980, as amended (also known as the “Superfund” law), or state counterparts, in connection with the disposal or other releases of hazardous substances and for damage to natural resources.
Our activities in connection with the operation and construction of gathering lines, pipelines, plants, storage caverns, and other facilities for gathering, processing, treatment, storing and transporting natural gas and other products are subject to environmental and safety regulation by federal and state authorities, including, without limitation, the state environmental agencies and the EPA, which can increase the costs of designing, installing and operating such facilities. In most instances, the regulatory requirements relate to the discharge of substances into the environment and include measures to control water and air pollution. Environmental laws and regulations may require the acquisition of a permit or other authorization before certain activities may be conducted. These laws also include fines and penalties for non-compliance. Further, these laws and regulations may limit or prohibit activities on certain lands lying within wilderness areas, wetlands, areas providing habitat for certain species or other protected areas. We are also subject to other federal, state, and local laws covering the handling, storage or discharge of materials used in our business and laws otherwise relating to protection of the environment, safety and health. Because the requirements imposed by environmental laws and regulations frequently change, we are unable to predict the ultimate costs of compliance with such requirements or whether the incurrence of such costs would have a material adverse effect on our operations.
Remediation of North Carolina Diesel Fuel Site
Included as part of our acquisition of Independence, we identified a piece of property that encountered a diesel fuel spill and required environmental cleanup. This property is currently used as a storage facility for the diesel fuel and propane that is utilized in our daily operations. We completed our voluntary remediation of the soil contaminants at the property and plan to monitor the site for future contaminants.
Seasonality
Our business and that of our subsidiaries in all segments is temperature-sensitive. In any given period, sales volumes reflect the impact of weather, in addition to other factors. Colder temperatures generally result in increased sales, while warmer temperatures generally result in reduced sales. Most of our gas sales revenue is generated in the first and fourth quarters of the year (January 1 to March 31 and October 1 to December 31) as we typically experience losses in the non-heating season, which occurs in the second and third quarters of the year (April 1 to September 30). We anticipate that this sensitivity to seasonal and other weather conditions will continue to be reflected in our sales volumes in future periods.
In 2012, the unseasonably warm weather in the first quarter materially impacted our sales revenue for the year. Heat degree days were down on average across all of our utilities by 10%. Since we do not have a weather normalization adjustment in our rates, our revenue is temperature-sensitive as reflected in our gross margin for 2012.
13
Employees
We had a total of 244 employees as of December 31, 2012 of which, 238 are full time, 206 are employed by our natural gas operations, 3 by our marketing and production operations, 17 by our propane operations, and 18 that spend time in all of the segments of operations. Our natural gas operations include 16 employees represented by two labor unions, the Laborers Union and Local Union No. 41. Negotiations were completed in June 2010 with the Laborers Union, with a contract in place until June 30, 2013. A three-year contract with Local Union No. 41 expires June 30, 2013. We believe our relationship with our employees and unions is good.
ITEM 1A. RISK FACTORS.
An investment in our common stock involves a substantial degree of risk. Before making an investment decision, you should give careful consideration to the following risk factors in addition to the other information contained in this report. The following risk factors, however, may not reflect all of the risks associated with our business or an investment in our common stock.
RISKS RELATED TO OUR BUSINESS
We are subject to comprehensive regulation by federal, state and local regulatory agencies that impact the rates we are able to charge, our costs and profitability.
The public utility commissions in states where we operate and FERC regulate many aspects of our distribution and transmission operations. State regulatory agencies set the rates that we may charge customers, which effectively limit the rate of return we are permitted to realize. Our ability to obtain rate increases and rate supplements to maintain the current rate of return and/or recover costs depends upon regulatory discretion. There can be no assurance that we will be able to obtain rate increases or rate supplements or continue to receive the current authorized rates of return, which could negatively impact our financial condition and results of operations.
The state utility regulatory agencies also regulate our public utilities’ gas purchases, construction and maintenance of facilities, the terms of service to our customers, safety and various other aspects of our distribution operations. FERC regulates interstate transportation and storage of natural gas. FERC exercises jurisdiction over the Shoshone transmission pipeline with respect to terms of service, maintenance of facilities, safety and various other aspects of our transmission operations. Also, to the extent that our utilities have contracts for transportation and storage services under FERC-approved tariffs with interstate pipelines, our utilities are subject to FERC rules and regulations pertaining to those services. If we fail to comply with applicable state and federal regulations, we may be subject to fines or penalties.
Our gas purchase practices are subject to annual reviews by state regulatory agencies (a PUCO review is currently pending) which could impact our earnings and cash flow.
The regulatory agencies that oversee our utility operations may review retrospectively our purchases of natural gas on an annual basis. The purpose of these annual reviews is to reconcile the differences, if any, between the amount we paid for natural gas and the amount our customers paid for natural gas. If any costs are disallowed in this review process, these disallowed costs would be expensed in the cost of gas but would not be recoverable in the rates charged to our customers. The various state regulatory agencies’ review of our gas purchase practices create the potential for the disallowance of our recovery through gas cost recovery pricing mechanisms. Significant disallowances could affect our earnings and cash flow.
An examination is currently pending for NEO and Orwell under the GCR mechanism. NEO’s audit covered the GCR mechanism from September 2009 through May 2012, and Orwell’s GCR mechanism covered July 2010 through June 2012. A hearing is scheduled for April 30, 2013 and we are currently evaluating the report and the impact on our financial statements.
Operational issues beyond our control could have an adverse effect on our business.
We operate in geographically dispersed areas. Our ability to provide natural gas depends both on our own operations and facilities and those of third parties, including local gas producers and natural gas pipeline
14
operators from whom we receive our natural gas supply. The loss of use or destruction of our facilities or the facilities of third parties due to extreme weather conditions, breakdowns, war, acts of terrorism or other occurrences could greatly reduce potential earnings and cash flows and increase our costs of repairs and replacement of assets. Our losses may not be fully recoverable through insurance or customer rates.
Storing and transporting natural gas and propane involves inherent risks that could cause us to incur significant financial losses.
There are inherent hazards and operation risks in gas and propane distribution activities, such as leaks, accidental explosions and mechanical problems that could cause the loss of human life, significant damage to property, environmental pollution, impairment of operations and substantial losses to us. The location of pipelines and storage facilities near populated areas, including residential areas, commercial business centers and industrial sites, could increase the level of damages resulting from these risks. These activities may subject us to litigation and administrative proceedings that could result in substantial monetary judgments, fines or penalties against us. To the extent that the occurrence of any of these events is not fully covered by insurance, they could adversely affect our earnings and cash flow.
Our earnings and cash flow are sensitive to decreases in customer consumption resulting from warmer than normal temperatures and customer conservation.
Our natural gas and propane sales revenue is generated primarily through the sale and delivery of natural gas and propane to residential and commercial customers who use natural gas and propane mainly for space heating. Consequently, temperatures have a significant impact on sales and revenue. Given the impact of weather on our utility operations, our business is a seasonal business. In addition, the average annual natural gas consumption of customers has been decreasing because, among other things, new homes and appliances are typically more energy efficient than older homes and appliances, and customers appear to be continuing a pattern of conserving energy by utilizing more energy efficient heating systems, insulation, alternative energy sources, and other energy savings devices and techniques. A mild winter, as well as continued or increased conservation, in any of our service areas can have a significant adverse impact on demand for natural gas and propane and, consequently, earnings and cash flow.
In 2012, the seasonably warm weather in the first quarter materially impacted our sales revenue for the year. Heat degree days were down on average across all of our utilities by 10%. Since we do not have a weather normalization adjustment in our rates, our revenue is temperature-sensitive as reflected in our gross margin for 2012.
The increased cost of purchasing natural gas during periods in which natural gas prices are rising significantly could adversely impact our earnings and cash flow.
The rates we are permitted to charge allow us to recover our cost of purchasing natural gas. In general, the various regulatory agencies allow us to recover the costs of natural gas purchased for customers on a dollar-for-dollar basis (in the absence of disallowances), without a profit component. We periodically adjust customer rates for increases and decreases in the cost of gas purchased by us for sale to our customers. Under the regulatory body-approved gas cost recovery pricing mechanisms, the gas commodity charge portion of gas rates we charge to our customers may be adjusted upward on a periodic basis. If the cost of purchasing natural gas increases and we are unable to recover these costs from our customers immediately, or at all, we may incur increased costs associated with higher working capital requirements. In addition, any increases in the cost of purchasing natural gas may result in higher customer bad debt expense for uncollectible accounts and reduced sales volume and related margins due to lower customer consumption.
Volatility in the price of natural gas could result in customers switching to alternative energy sources which could reduce our revenue, earnings and cash flow.
The market price of alternative energy sources such as coal, electricity, propane, oil and steam is a competitive factor affecting the demand for our gas distribution services. Our customers may have or may acquire the capacity to use one or more of the alternative energy sources if the price of natural gas and our distribution
15
services increase significantly. Natural gas has typically been less expensive than these alternative energy sources. However, if natural gas prices increase significantly, some of these alternative energy sources may become more economical or more attractive than natural gas, which could reduce our earnings and cash flow.
The gas industry is intensely competitive and competition has increased in recent years as a result of changes in the price negotiation process within the supply and distribution chain of the gas industry, both of which could negatively impact earnings.
We compete with companies from various regions of the United States and may compete with foreign companies for domestic sales. Many of these companies are larger and have greater financial, technological, human and other resources than we do. Additionally, legislative and regulatory initiatives, at both the federal and state levels, are designed to promote competition. These challenges have been compounded by changes in the gas industry that have allowed certain customers to negotiate gas purchases directly with producers or brokers. We could lose market share or our profit margins may decline in the future if we are unable to remain competitive.
Our earnings and cash flow may be adversely affected by downturns in the economy.
Our operations are affected by the conditions and overall strength of the national, regional and local economies, which impact the amount of residential and industrial growth and actual gas consumption in our service territories. Our commercial customers use natural gas in the production of their products. During economic downturns, these customers may see a decrease in demand for their products, which in turn may lead to a decrease in the amount of natural gas they require for production. In addition, during periods of slow or little economic growth, energy conservation efforts often increase and the amount of uncollectible customer accounts increases. These factors may reduce earnings and cash flow.
Changes in the market price and transportation costs of natural gas could result in financial losses that would negatively impact our results of operations.
We are exposed to the impact of market fluctuations in the price and transportation costs of natural gas. We purchase and store gas for distribution later in the year. We also enter agreements to buy or sell gas at a fixed price. We may use such arrangements to protect profit margins on future obligations to deliver gas at a fixed price, or to attempt to protect against adverse effects of potential market price declines on future obligations to purchase gas at fixed prices. Further, we are exposed to losses in the event of nonperformance or nonpayment by the counterparties to our supply agreements, which could have a material adverse impact on our earnings for a given period.
Changes in current regulations, the regulatory environment and events in the energy markets that are beyond our control may reduce our earnings and limit our access to capital markets.
As a result of the energy crisis in California during 2000 and 2001, the bankruptcy of some energy companies, and the volatility of natural gas prices in North America, companies in regulated and unregulated energy businesses have generally been under increased scrutiny by regulators, participants in the capital markets and debt rating agencies. In addition, the Financial Accounting Standards Board or the Securities and Exchange Commission may enact new accounting standards that could impact the way we are required to record revenue, expenses, assets and liabilities. In addition, state utility regulatory agencies could enact more stringent rules or standards with respect to rates, cost recovery, safety, construction, maintenance or other aspects of our operations. We cannot predict or control what effect proposed regulations, events in the energy markets or other future actions of regulatory agencies or others in response to such events may have on our earnings or access to the capital markets.
We acquired interests in our natural gas wells by quitclaim deed and cannot guarantee that we hold clear title to our interests or that our interests will not be challenged in the future.
We have an ownership interest in 160 natural gas producing wells in Montana, which provide our marketing and production operations a partial natural hedge when market prices of natural gas are greater than the cost of production. The gas production from these wells provided approximately 19.9% of the volume requirements for EWR’s Montana market for 2012. We acquired our interests in the wells in 2002 and 2003 by quitclaim deed
16
conveying interests in certain oil and gas leases for the wells. Because the sellers conveyed their interests by quitclaim, we received no warranty or representation from them that they owned their interests free and clear from adverse claims by third parties or other title defects. We have no title insurance, guaranty or warranty for our interests in the wells. Further, the wells may be subject to prior, unregistered agreements, or transfers which have not been recorded.
Accordingly, we cannot guarantee that we hold clear title to our interests or that our interests will not be challenged in the future. If our interests were challenged, expenses for curative title work, litigation or other dispute resolution mechanisms may be incurred. Loss of our interests would reduce or eliminate our production operations and reduce or eliminate the partial natural hedge that our marketing and production subsidiary currently enjoys as a result of our production capabilities. For all of these reasons, a challenge to our ownership could negatively impact our earnings, profits and results of operations.
We are subject to numerous environmental laws and regulations that may increase our cost of operations, impact our business plans and expose us to environmental liabilities.
Environmental regulations that may affect our present and future operations include regulation of air emissions, water quality, wastewater discharges, solid waste and hazardous waste. These laws and regulations generally require us to obtain and comply with a wide variety of environmental licenses, permits, inspections and other approvals, and can result in increased capital expenditures and operating costs. Both public officials and private individuals may seek to enforce applicable environmental laws and regulations. We cannot predict the outcome (financial or operational) of any related litigation that may arise.
We may be a responsible party for environmental clean-up at sites identified by a regulatory body in the future. If that occurs, we cannot predict with certainty the amount and timing of all future expenditures related to environmental matters because of the difficulty of estimating clean-up costs. There is also uncertainty in quantifying liabilities under environmental laws that impose joint and several liabilities on all potentially responsible parties.
We cannot be sure that existing environmental regulations will not be revised or that new regulations intended to protect the environment will not be adopted or become applicable to us. Revised or additional regulations that result in increased compliance costs or additional operating restrictions could have a material adverse effect on our results of operations.
We have a net deferred tax asset of $12.8 million and we cannot guarantee that we will be able to generate sufficient future taxable income to realize a significant portion of this net deferred tax asset, which could lead to a write-down (or even a loss) of the net deferred tax asset and adversely affect our operating results and financial position.
We recorded a net deferred tax asset as the result of our acquisitions of Frontier Natural Gas and Bangor Gas Company in 2007. This tax asset was $12.8 million at December 31, 2012. We may continue to depreciate approximately $82.0 million of Frontier and Bangor’s capital assets using the useful lives and rates employed by those companies, resulting in future potential federal and state income tax benefits over a 20-year period using applicable federal and state income tax rates. Under Internal Revenue Code Section 382, our ability to recognize tax deductions as a result of this tax benefit was limited during the first five years following the acquisitions.
Management will reevaluate the valuation allowance each year on completion of updated estimates of taxable income for future periods, and will reduce the deferred tax asset by the new valuation allowance if, based on the weight of available evidence, it is more likely than not that we will not realize some portion or all of the recognized deferred tax assets. In addition, we cannot guarantee that we will be able to generate sufficient future taxable income to realize the $12.8 million net deferred tax asset over the remaining useful life of the asset. A write down in the deferred tax asset or expiration of the asset before it is utilized would adversely affect our operating results and financial position.
17
Failure to maintain effective internal controls in accordance with Section 404 of the Sarbanes-Oxley Act could have a material adverse effect on our business and stock price.
Section 404 of the Sarbanes-Oxley Act of 2002 contains provisions requiring an annual assessment by management, as of the end of the fiscal year, of the effectiveness of internal control for financial reporting, as well as attestation and reporting by independent auditors on our internal control over financial reporting as well as other control-related matters. Because we are currently a smaller reporting company, our independent auditors are not required to attest to our internal controls over financial reporting in accordance with the Dodd-Frank Wall Street Reform and Consumer Protection Act.
Compliance with Section 404 is both costly and challenging. Going forward, there is a risk that we will not be able to conclude that our internal control over financial reporting is effective as required by Section 404. Further, during the course of our testing we may identify deficiencies that we may not be able to remediate in time to meet the deadlines imposed under the Sarbanes-Oxley Act for compliance with Section 404. Moreover, effective internal controls, particularly those related to revenue recognition, are necessary for us to produce reliable financial reports and are important to help prevent financial fraud. If we cannot provide reliable financial reports or prevent fraud, our business and operating results could be harmed, investors could lose confidence in our reported financial information, and the trading price of our stock could be adversely affected.
Our actual results of operations could differ from estimates used to prepare our financial statements.
In preparing our financial statements in accordance with generally accepted accounting principles, our management often must make estimates and assumptions that affect the reported amounts of assets, liabilities, revenue, expenses and related disclosures at the date of the financial statements and during the reporting period. Some of those judgments can be subjective and complex, and actual results could differ from those estimates. We consider the regulatory accounting policy to be our most critical because of the uncertainties, judgments, and complexities of the underlying accounting standards and operations involved. Regulatory accounting allows for the actions of regulators to be reflected in the financial statements. Their actions may cause us to capitalize costs that would otherwise be included as an expense in the current period by unregulated companies. If future recovery of costs ceases to be probable, the assets will be written off as a charge in current period earnings.
Our Company’s operations could give rise to risk in cyber security attacks.
On October 13, 2011, the SEC’s Division of Corporation Finance issued Topic No.2, Cyber security, relating to cyber security risks and cyber incidents. We rely extensively on computer systems to process transactions, maintain information and manage our business. Disruptions in our computer systems could impact our ability to service our customers and adversely affect our sales and the interruption of operations.
RISKS RELATED TO OUR ACQUISITION STRATEGY
We face a variety of risks associated with acquiring and integrating new business operations.
The growth and success of our business will depend to a great extent on our ability to acquire new assets or business operations and to integrate the operations of businesses that we have recently acquired as well as those that we may acquire in the future. We cannot provide assurance that we will be able to:
| | • | | identify suitable acquisition candidates or opportunities, |
| | • | | detect all actual and potential problems that may exist in the operations or financial condition of an acquisition candidate, |
| | • | | acquire assets or business operations on commercially acceptable terms, |
| | • | | effectively integrate the operations of any acquired assets or businesses with our existing operations, |
| | • | | manage effectively the combined operations of the acquired businesses, |
| | • | | achieve our operating and growth strategies with respect to the acquired assets or businesses, |
| | • | | reduce our overall selling, general, and administrative expenses associated with the acquired assets or businesses, or |
| | • | | comply with the internal control requirements of Section 404 as a result of an acquisition. |
18
The integration of the management, personnel, operations, products, services, technologies, and facilities of any businesses that we have acquired or may acquire in the future could involve unforeseen difficulties. These difficulties could disrupt our ongoing businesses, distract our management and employees, and increase our expenses, which could have a material adverse effect on our business, financial condition, and operating results.
To the extent we are successful in making an acquisition, we may face a number of related risks.
Any acquisition may involve a number of risks, including the assumption of material liabilities, the terms and conditions of any state or federal regulatory approvals required for an acquisition, the diversion of management’s attention from the management of daily operations to the integration of acquired operations, difficulties in the integration and retention of employees and difficulties in the integration of different cultures and practices, as well as in the integration of broad and geographically dispersed personnel and operations. The failure to make and integrate acquisitions successfully could have an adverse effect on our ability to grow our business.
Subsequent to the consummation of an acquisition, we may be required to take write-downs or write-offs, restructuring and impairment charges or other charges that could have a significant negative impact on our financial condition, results of operations and our stock price.
There could be material issues present inside a particular target business that are not uncovered in the course of due diligence performed prior to the acquisition, and there could be factors outside of the target business and outside of our control that later arise. As a result of these factors, after an acquisition is completed, we may be forced to write-down or write-off assets, restructure our operations or incur impairment or other charges relating to an evaluation of goodwill and acquisition-related intangible assets that could result in our reporting losses. In some acquisitions, goodwill is a significant portion of the purchase price, increasing the losses we would incur if such write-downs or write-offs occurred. In addition, unexpected risks may arise and previously known risks may materialize in a manner not consistent with our preliminary risk analysis.
RISKS RELATED TO OUR COMMON STOCK
Our ability to pay dividends on our common stock is limited.
We cannot assure you that we will continue to pay dividends at our current monthly dividend rate or at all. In particular, our ability to pay dividends in the future will depend upon, among other things, our future earnings, cash requirements, state ring fencing provisions, and covenants under our existing credit facilities and any future credit agreements to which we may be a party. In addition, acquisitions funded by the issuance of our common stock increase the number of our shares outstanding and may make it more difficult to continue dividends at our current rate.
In 2011, we failed to meet certain financial covenants in the note purchase agreements with Sun Life. Sun Life waived its rights and remedies of the breaches of these covenants and we modified the financial covenants related thereto. Pursuant to the amendments to the note purchase agreements, we had agreed to deliver an irrevocable standby letter of credit to Sun Life in the amount of $750,000 by May 31, 2012 to be drawn upon by Sun Life if and when any event of default had occurred.
After discussion with Sun Life, the parties agreed to change the $750,000 letter of credit requirement to a cash deposit in a reserve account whereas Sun Life is the beneficiary. Sun Life requires debt service reserve accounts to be created for $1,072,476 to cover approximately one year of interest payments. We are not able to use these funds in the debt service reserve accounts for operational cash purposes. The terms allow us to withdraw the money if a letter of credit is received to replace the restricted cash.
These covenants place constraints on our business and may adversely affect our growth, business, earnings, cash flow, liquidity, and financial condition. Our failure to comply with any of the financial covenants in the credit facilities may result in an event of default which, if not cured or waived, could result in the acceleration of the debt under the credit facilities or other agreements we may enter into from time to time that contain cross-acceleration or cross-default provisions. If this occurs, there can be no assurance that we would be able to refinance or otherwise repay such indebtedness, which could result in a material adverse effect on our business, earnings, cash flow, liquidity and financial condition.
19
Like other small-cap companies, the price of our common stock can be volatile due to its relatively low trading volume, and sales of shares by our directors and officers could cause decreases in price.
As a smaller public company, our common stock typically has a lower trading volume than Fortune 500 companies and other larger public companies. As of December 31, 2012, our average daily volume for 2012 was 14,124 shares. This low trading volume may have a significant effect on the market price of our common stock. As of December 31, 2012, our directors and officers control 15.4% of our outstanding shares, which contributes to our low public float, and sales by those individuals could be perceived unfavorably in the market and adversely affect the price of the Company’s common stock. Also, Mr. Osborne has pledged his stock to secure various debts. If a default occurs on one or more of these obligations, the pledgees may seek to sell Mr. Osborne’s shares, which could adversely affect our stock price.
Our directors and officers own a significant interest in the Company and could limit new shareholders’ influence on corporate decisions.
Our directors and officers possess a significant influence on all matters submitted to a vote of our shareholders including the election of the members of our board. The interests of these shareholders may not always coincide with our corporate interests or the interests of other shareholders, and they may act in a manner with which you may not agree or that may not be in the best interests of our other shareholders. Also, this concentration of ownership may have the effect of preventing or discouraging transactions involving an actual or a potential change of control of the Company, regardless of whether a premium is offered over then current market prices.
The possible issuance of future series of preferred stock could adversely affect the holders of our common stock.
Pursuant to our articles of incorporation, our board of directors has the authority to fix the rights, preferences, privileges and restrictions of unissued preferred stock and to issue those shares without any further action or vote by the shareholders. The rights of the holders of our common stock will be subject to, and may be adversely affected by, the rights of the holders of any series of preferred stock that may be issued in the future. These adverse effects could include subordination to preferred shareholders in the payment of dividends and upon our liquidation and dissolution, and the use of preferred stock as an anti-takeover measure, which could impede a change in control that is otherwise in the interests of holders of our common stock.
Our charter documents and Ohio law, as well as certain utility laws and regulations, may discourage a third party from attempting to acquire us by means of a tender offer, proxy contest or otherwise, which could adversely affect the market price of our common shares.
Provisions of our articles of incorporation and code of regulations and state utility laws and regulations, including regulatory approval requirements, could make it more difficult for a third party to acquire us, even if doing so would be perceived to be beneficial to our shareholders. For example, our charter documents do not permit cumulative voting, allow the removal of directors only for cause, and establish certain advance notice procedures for nomination of candidates for election as directors and for shareholder proposals to be considered at shareholders’ meetings. Additionally, Ohio corporate law provides that certain notice and informational filings and special shareholder meeting and voting procedures must be followed prior to consummation of a proposed “control share acquisition” as defined in the Ohio Revised Code. Assuming compliance with the prescribed notice and information filings, a proposed control share acquisition may be made only if, at a special meeting of shareholders, the acquisition is approved by both a majority of our voting power represented at the meeting and a majority of the voting power remaining after excluding the combined voting of the “interested shares,” as defined in the Ohio Revised Code. Some takeover attempts may even be subject to approval by the Ohio Division of Securities or PUCO. The application of these provisions may inhibit a non-negotiated merger or other business combination, which, in turn, could adversely affect the market price of our common stock.
20
The value of our common stock may decline significantly if we do not maintain our listing on the NYSE Amex Equities stock exchange.
In addition to federal and state regulation of our utility operations and regulation by the SEC, we are subject to the listing requirements of NYSE Amex. NYSE Amex rules contain requirements with respect to corporate governance, communications with shareholders, the trading price of shares of our common stock, and various other matters. We believe we are in compliance with NYSE Amex listing requirements, but there can be no assurance that we will continue to meet those listing requirements in the future. If we fail to comply with listing requirements, NYSE Amex could de-list our stock. If our stock was de-listed from NYSE Amex, our shares would likely trade in the Over-The-Counter Bulletin Board, but the ability of our shareholders to sell our stock could be more difficult because smaller quantities of shares would likely be bought and sold, transactions could be delayed, and security analysts’ coverage of the Company may be reduced. Further, because of the additional regulatory burdens imposed upon broker-dealers with respect to de-listed companies, delisting could discourage broker-dealers from effecting transactions in our stock, further limiting the liquidity of our shares. These factors could have a material adverse effect on the trading price, liquidity, value and marketability of our stock.
ORGANIZATION, STRUCTUREAND MANAGEMENT RISKS
Our credit facilities contain restrictive covenants that may reduce our flexibility, and adversely affect our business, earnings, cash flow, liquidity and financial condition.
The terms of our credit facilities impose significant restrictions on our ability and, in some cases, the ability of our subsidiaries, to take a number of actions that we may otherwise desire to take, including:
| | • | | requiring us to dedicate a substantial portion of our cash flow from operations to the payment of principal and interest on our indebtedness, thereby reducing the availability of cash flow for working capital, capital expenditures and other business activities, |
| | • | | requiring us to meet certain financial tests, which may affect our flexibility in planning for, or reacting to, changes in our business and the industries in which we operate, |
| | • | | limiting our ability to sell assets, make investments or acquire assets of, or merge or consolidate with, other companies, |
| | • | | limiting our ability to repurchase or redeem our stock or enter into transactions with our shareholders or affiliates, and |
| | • | | limiting our ability to grant liens, incur additional indebtedness or contingent obligations or obtain additional financing for working capital, capital expenditures, acquisitions and general corporate and other activities. |
In 2011, we failed to meet certain financial covenants in the note purchase agreements with Sun Life. Sun Life waived its rights and remedies of the breaches of these covenants and we modified the financial covenants related thereto. Pursuant to the amendments to the note purchase agreements, we had agreed to deliver an irrevocable standby letter of credit to Sun Life in the amount of $750,000 by May 31, 2012 to be drawn upon by Sun Life if and when any event of default had occurred.
After discussion with Sun Life, the parties agreed to change the $750,000 letter of credit requirement to a cash deposit in a reserve account whereas Sun Life is the beneficiary. Sun Life requires debt service reserve accounts to be created for $1,072,476 to cover approximately one year of interest payments. We are not able to use these funds in the debt service reserve accounts for operational cash purposes. The terms allow us to withdraw the money if a letter of credit is received to replace the restricted cash.
These covenants place constraints on our business and may adversely affect our growth, business, earnings, cash flow, liquidity, and financial condition. Our failure to comply with any of the financial covenants in the credit facilities may result in an event of default which, if not cured or waived, could result in the acceleration of the debt under the credit facilities or other agreements we may enter into from time to time that contain cross-acceleration or cross-default provisions. If this occurs, there can be no assurance that we would be able to
21
refinance or otherwise repay such indebtedness, which could result in a material adverse effect on our business, earnings, cash flow, liquidity and financial condition.
Our primary assets are our operating subsidiaries, and there are limits on our ability to obtain revenue from those subsidiaries, which may limit our ability to pay dividends to shareholders.
We are a holding company with no direct operations and our principal assets are the equity securities of our subsidiary utilities. We rely on dividends from our subsidiaries for our cash flows, thus our ability to pay dividends to our shareholders and finance acquisitions depends on the ability of our subsidiaries to generate sufficient net income and cash flows to pay upstream dividends to us. Currently, as a result of covenants contained in the note purchase agreements with Sun Life, our Ohio subsidiaries are not able to distribute any funds to the holding company. The inability of our Ohio subsidiaries to distribute any funds to the holding company may impact our ability to pay dividends to our shareholders. Further, our subsidiaries are legally distinct from us, and although they are wholly-owned and controlled by us, our ability to obtain distributions from them by way of dividends, interest or other payments (including intercompany loans) is subject to restrictions imposed by their term loans and credit facilities (under which they are borrowers and we are a guarantor). For example:
| | • | | we may cause our Maine, Montana, North Carolina and Wyoming operating subsidiaries to pay a dividend only if the dividend, when combined with dividends over the previous five years, would not exceed 75% of their net income over those years, |
| | • | | we may cause Ohio and Pennsylvania subsidiaries to distribute dividends only if the aggregate amount of all such dividends and any distributions, redemptions and repurchases for the fiscal year do not exceed 70% of the net income of the Ohio and Pennsylvania subsidiaries on a consolidated basis. |
Additionally, as a condition to approving our holding company reorganization, the MPSC required that we stipulate to ring-fencing restrictions under which our Maine, Montana, North Carolina and Wyoming operating subsidiaries must meet certain notice and financial requirements prior to paying dividends that are above certain financial thresholds or irregularly timed. Similar ring-fencing provisions were recently approved by the WPSC as well.
These dividend restrictions, in addition to other financial covenants contained in the credit facilities and ring-fencing restrictions, place constraints on our business and may adversely affect our cash flow, liquidity and financial condition as well as our ability to finance acquisitions or pay dividends. Further, we may be required to comply with additional covenants. Failure to comply with financial covenants may result in the acceleration of the debt and foreclosure of our assets, which would have a material adverse effect on our business, earnings, cash flow, liquidity and financial condition. For further details on the financial covenants contained in the credit facilities, see “Restrictions on Payment of Dividends” in this Form 10-K.
The Wyoming Public Service Commission has asserted jurisdiction over Gas Natural’s activities, which could hinder, delay or prevent us from pursuing acquisitions and other transactions that are important to our short term and long term financial condition and growth.
We obtained the approval of the WPSC for our holding company reorganization in October 2008, but subsequently in connection with our acquisition of the Ohio operations, the WPSC issued an order, affirmed on rehearing issued in November 2011, holding us subject to its general jurisdiction over public utilities. In December 2011, we timely filed a Petition for Review of the WPSC order in the Laramie County, Wyoming District Court. On October 9, 2012, the District Court reversed the WPSC’s finding of jurisdiction and remanded to the WPSC for additional findings. The WPSC has scheduled a hearing on the matter on April 3 and 4, 2013. Until the jurisdictional issue is resolved, we cannot predict whether or when the WPSC will assert jurisdiction over us, including activities that take place at the holding company level. If, following the hearing, the WPSC rules that it has jurisdiction over us with respect to any potential acquisition, refinancing of debt or other significant transaction and denies a request by us for exemption with respect to the transaction, it could delay, hinder or prevent us from completing the transaction, negatively impacting our financial condition, results of operations, and growth.
22
Our performance depends substantially on the performance of our executive officers and other key personnel and the ability of our management team to fully implement our business strategy.
The success of our business depends on our ability to attract, train, retain, and motivate high quality personnel, especially highly qualified managerial personnel. Poor execution in the performance of our management team or the loss of services of key executive officers or personnel could impair our ability to successfully operate the Company and to acquire and integrate new business operations, either of which could have a material adverse effect on our business, results of operations and financial condition.
We have entered into a limited liability operating agreement with third parties to develop and operate oil, gas and mineral leasehold estates, which exposes us to the risk associated with oil, gas and mineral exploration as well as the risks inherent in relying upon third parties in business ventures and we may enter into similar agreements in the future.
We depend upon the performance of third party participants in endeavors such as Kykuit, and their performance of their obligations to us are outside our control. If these parties do not meet or satisfy their obligations under these arrangements, the performance and success of endeavors such as Kykuit may be adversely affected. If third parties to operating agreements and similar agreements are unable to meet their obligations we may be forced to undertake the obligations ourselves or incur additional expenses in order to have some other party perform such obligations. We may also be required to enforce our rights that may cause disputes among third parties and us. If any of these events occur, they may adversely impact us, our financial performance and results of operations.
We have entered into various transactions in which some of our directors have a financial interest, and stockholders and potential investors in Gas Natural may not value these transactions in the same manner as our board.
We have entered into agreements and transactions in which our directors have a financial interest. For example, we have entered into an agreement with Richard M. Osborne, our chairman of the board and chief executive officer to purchase the assets of JDOG Marketing. JDOG Marketing is engaged in the business of marketing natural gas and is controlled by Mr. Osborne. In the future we may enter into other additional related party transactions on a case by case basis. For more information on our related party transactions, see “Certain Relationships and Related Party Transactions” on page 27 of our definitive proxy statement for the 2012 annual meeting filed with the SEC on November 19, 2012.
ITEM 2. PROPERTIES.
MAINE
In Bangor, Maine, we leased two office buildings under long-term lease agreements. On December 30, 2012, we completed construction of a 16,000 square foot building that has a combination of office, shop and warehouse space which supports our office, maintenance and construction operations. We have approximately 152 miles of transmission and distribution lines and related metering and regulating equipment in Maine.
MONTANAAND WYOMING
In Great Falls, Montana, we own an 11,000 square foot office building and a 3,000 square foot service and operating center (with various outbuildings), which supports day-to-day maintenance and construction operations. We own approximately 581 miles of underground distribution lines, or “mains,” and related metering and regulating equipment in Montana. In West Yellowstone, Montana, we own an office building and a liquefied natural gas plant. In the town of Cascade we own two large propane storage tanks. In Cut Bank, Montana we own an office building/operating center.
In Cody, Wyoming, we lease office and service buildings under long-term lease agreements. We own approximately 653 miles of transmission and distribution mains and related metering and regulating equipment, all of which are located in or around Cody, Meeteetse, and Ralston, Wyoming.
Our pipeline operations own two pipelines in Montana and Wyoming. One is currently being operated as a gathering system. The other pipeline is operating as a FERC regulated natural gas interstate transmission line. The pipelines extend from north of Cody, Wyoming to Warren, Montana.
23
NORTH CAROLINAAND VIRGINIA
Our North Carolina natural gas operations are headquartered in Elkin, North Carolina. We rented a 16,000 square foot building that has a combination of office, shop and warehouse space during 2011. On January 1, 2012, we completed construction of a 15,324 square foot building that has a combination of office, shop and warehouse space. We own approximately 421 miles of transmission and distribution lines and related metering and regulating equipment in North Carolina. In Boone, North Carolina, we lease an office building/operating center.
Our North Carolina propane operations are headquartered in West Jefferson, North Carolina. The 3,000 square foot space is rented as a combination of office building and operating center.
Our Virginia propane operations are headquartered in Independence, Virginia. The 3,600 square foot space is rented as a combination of office building and operating center.
OHIOAND WESTERN PENNSYLVANIA
The Company maintains facilities for its Ohio and Western Pennsylvania operations located in Lancaster, Mentor, Orwell, and Strasburg, Ohio. The Lancaster, Orwell, and Strasburg leases serve as office and service space with various long-term lease agreements with related parties. In addition, we lease 11,000 square feet of office space in Mentor, Ohio that serves as the offices for our chief executive officer, chief financial officer and certain other personnel associated with our Ohio subsidiaries and our holding company operations under a three year lease agreement. We own approximately 1,231 miles of transmission and distribution lines and related metering and regulating equipment in Ohio and Western Pennsylvania.
ITEM 3.LEGALPROCEEDINGS.
From time to time, we are involved in lawsuits that have arisen in the ordinary course of business. We are contesting each of these lawsuits vigorously and believe we have defenses to the allegations that have been made.
On June 20, 2012, Gas Natural was named as a defendant in a lawsuit captionedRBS Citizens N.A., dba Charter One v. Richard M. Osborne, Gas Natural Inc. (f/k/a Energy, Inc.) and the Richard M. Osborne Trust, Case No. CV-12-784656, which was filed in the Cuyahoga County Court of Common Pleas in Ohio. In an effort to collect on judgments obtained against Richard M. Osborne, our chairman and chief executive officer, the complaint seeks: (1) an order requiring Gas Natural to pay over to RBS Citizens any distributions due to Mr. Osborne by virtue of his ownership in Gas Natural as well as any proceeds payable to him as part of the previously announced proposed acquisition of JDOG Marketing; (2) the imposition of a constructive trust on dividends or assets that Mr. Osborne might receive as part of the acquisition of JDOG Marketing; and (3) an injunction preventing the acquisition of JDOG Marketing. We believe the claims concerning the JDOG Marketing transaction to be without merit and have filed a motion for summary judgment. On March 18 2013, RBS filed a motion to dismiss counts two and three and for summary judgment on count one of its complaint. The court has not yet ruled on the motion which we are not opposing.
In 2010, Bangor Gas Company, our Maine utility, asserted a claim against H.Q. Energy Services (US), Inc. for a breach of a firm gas transportation service agreement between the parties. HQ filed a counterclaim against us for reimbursement of certain transportation charges that HQ paid to a third party. The parties agreed to arbitration and on September 1, 2011, the arbitrators awarded HQ the sum of approximately $280,000 for past transportation charges that HQ paid to us. The arbitrators also ordered us to pay future transportation charges that will be incurred during the remaining term of the agreement while HQ was ordered to pay us for future fuel reimbursements for the remaining term of the agreement. On September 23, 2011, the arbitrators clarified their initial order to require HQ to reimburse us for the past transportation charges awarded by the arbitrators if the FERC determined that our payment of the transportation charges was not consistent with FERC policy. On November 10, 2011, the FERC’s Office of General Counsel issued a no-action letter indicating that the FERC staff could not assure us that the FERC would not recommend enforcement action if we made the payments to HQ required by the arbitration award. As a result, on November 30, 2011, we filed an action in the United States District Court, District of Maine against HQ seeking to vacate the arbitration award against us and confirm that portion of the award requiring HQ to return the transportation payments to us and obtain an award of past fuel
24
reimbursements in addition to the prospective award made by the arbitrators. On March 1, 2012, the court issued an order confirming the arbitration award against us, rejecting our claim for past fuel costs, and denying our claim for reimbursement of transportation charges on the grounds that the FERC no-action letter was not a final, binding finding by the FERC of the consistency of the payments with FERC policy. On March 30, 2012, we filed an action with the United States Court of Appeals for the First Circuit appealing the district court’s decision in its entirety. The appeal was denied on September 26, 2012.
Additionally, we also made a claim against HQ for personal property and real estate tax reimbursements which the Company claimed were due under the transportation contract with HQ. The parties participated in an arbitration hearing in connection with this matter on August 14 and 15, 2012, and on October 30, 2012, the arbitrators ruled that no reimbursements were due from HQ under the contract. The Company wrote off $427,083 in receivables due to the arbitrators’ decision.
On February 25, 2013, one of our former officers, Jonathan Harrington, filed a lawsuit captioned “Jonathan Harrington v. Energy West, Inc. and Does 1-4,” Case No. DDV-13-159 in the Montana Eighth Judicial District Court, Cascade County. Mr. Harrington claims that he was terminated in violation of Montana statute requiring just cause for termination. In addition, he alleges claims for negligent infliction of emotional distress and negligent slander. Mr. Harrington is seeking relief for economic loss, including lost wages and fringe benefits for a period of at least four years from the date of discharge, together with interest. Mr. Harrington is an Ohio resident and was employed in our Ohio corporate offices. As a result, we believe his claims under Montana law are without merit, and we intend to vigorously defend this case on all grounds.
In our opinion, the outcome of these legal actions will not have a material adverse effect on our financial condition, cash flows, or results of operations.
ITEM 4. MINE SAFETY DISCLOSURES.
Not applicable.
PART II
ITEM 5. MARKETFOR REGISTRANT’S COMMON EQUITY, RELATED STOCKHOLDER MATTERSAND ISSUER PURCHASESOF EQUITY SECURITIES.
OUR COMMON STOCK
Our common stock trades on the NYSE Amex under the symbol “EGAS”.
The following table sets forth, for the quarters indicated, the range of high and low prices of our common stock from the NYSE Amex Equities.
| | | | | | | | |
Year Ended 12/31/12 | | High | | | Low | |
First Quarter | | $ | 11.66 | | | $ | 11.00 | |
Second Quarter | | $ | 11.49 | | | $ | 9.88 | |
Third Quarter | | $ | 10.27 | | | $ | 9.83 | |
Fourth Quarter | | $ | 10.07 | | | $ | 8.63 | |
| | |
Year Ended 12/31/11 | | High | | | Low | |
First Quarter | | $ | 11.73 | | | $ | 10.40 | |
Second Quarter | | $ | 11.83 | | | $ | 11.09 | |
Third Quarter | | $ | 11.87 | | | $ | 10.54 | |
Fourth Quarter | | $ | 11.42 | | | $ | 10.85 | |
Holders of Record
As of March 18, 2013, there were approximately 294 record owners of our common stock. We estimate that approximately 7,425 additional shareholders own stock in accounts at brokerage firms and other financial institutions.
25
Dividend Policy
We paid a monthly dividend of $0.045 per share from January 01, 2012 through December 31, 2012.
Restrictions on Payment of Dividends
As a holding company, our primary assets and sources of cash flow are our operating subsidiaries. The credit facilities of our operating subsidiaries restrict their ability to pay dividends to us, which restricts our ability to pay dividends to our shareholders. Payment of future cash dividends, if any, and their amounts, will be dependent upon a number of factors, including those restrictions, our earnings, financial requirements, number of shares of capital stock outstanding and other factors deemed relevant by our board of directors.
For additional information on loan covenants and restrictions contained in our debt documents, please see “Management Discussion and Analysis of Financial Condition and Results of Operations – Capital Sources”.
Performance Graph
The graph below matches our cumulative five-year total shareholder return on common stock with the cumulative total returns of the S&P 500 index and the S&P Utilities index. The graph tracks the performance of a $100 investment in our common stock and in each of the indexes (with the reinvestment of all dividends) from December 31, 2007 to December 31, 2012.
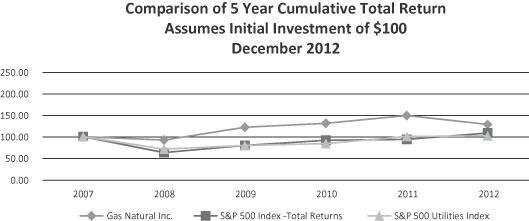
26
ITEM 6. SELECTED FINANCIAL DATA.
The selected financial data presented below are derived from our historical consolidated financial statements, which were audited by our independent registered public accounting firms in each of those years. The selected financial data should be read in conjunction with Management’s Discussion and Analysis of Financial Condition and Results of Operations and our Consolidated Financial Statements and the related notes included elsewhere in this Form 10-K.
| | | | | | | | | | | | |
| | | Years Ended December 31, | |
| ($ in thousands, except share and per share) | | 2012 | | | 2011 | | | 2010 | |
Summary of Operations: | | | | | | | | | | | | |
Operating revenues | | $ | 93,816 | | | $ | 99,217 | | | $ | 91,500 | |
Operating expenses: | | | | | | | | | | | | |
Cost of sales | | | 51,785 | | | | 60,184 | | | | 54,706 | |
General and administrative | | | 22,131 | | | | 19,610 | | | | 17,338 | |
Maintenance | | | 1,259 | | | | 1,122 | | | | 1,052 | |
Depreciation and amortization | | | 5,327 | | | | 4,465 | | | | 4,035 | |
Accretion | | | 161 | | | | 142 | | | | 128 | |
Taxes other than income | | | 3,552 | | | | 3,452 | | | | 3,162 | |
| | | | | | | | | | | | |
| | | |
Total operating expenses | | | 84,215 | | | | 88,975 | | | | 80,421 | |
| | | | | | | | | | | | |
| | | |
Operating income | | | 9,601 | | | | 10,242 | | | | 11,079 | |
| | | |
Other income (expense) | | | (802) | | | | 304 | | | | 385 | |
| | | |
Total interest expense | | | (2,723) | | | | (2,034) | | | | (2,178) | |
| | | | | | | | | | | | |
| | | |
Income before taxes | | | 6,076 | | | | 8,512 | | | | 9,286 | |
| | | |
Income tax expense | | | (2,357) | | | | (3,142) | | | | (3,489) | |
| | | | | | | | | | | | |
| | | |
Net income | | $ | 3,719 | | | $ | 5,370 | | | $ | 5,797 | |
| | | | | | | | | | | | |
| | | |
Other comprehensive income | | | | | | | | | | | | |
Unrealized (loss) gain on available for sale securities, net of tax of $9, ($20), and $12, respectively | | | (15) | | | | 33 | | | | 26 | |
| | | | | | | | | | | | |
| | | |
Comprehensive income | | | 3,704 | | | | 5,403 | | | | 5,823 | |
| | | | | | | | | | | | |
| | | |
Earnings per common share - basic | | $ | 0.46 | | | $ | 0.66 | | | $ | 0.92 | |
Earnings per common share - diluted | | $ | 0.46 | | | $ | 0.66 | | | $ | 0.92 | |
Dividends per common share | | $ | 0.54 | | | $ | 0.54 | | | $ | 0.56 | |
Weighted average common share outstanding - diluted | | | 8,169,679 | | | | 8,159,827 | | | | 6,300,972 | |
| | | |
At Year End: | | | | | | | | | | | | |
Current assets | | $ | 33,767 | | | $ | 39,958 | | | $ | 41,738 | |
Total assets | | | 174,463 | | | | 156,411 | | | | 137,728 | |
| | | |
Current liabilities | | | 44,115 | | | | 44,499 | | | | 38,916 | |
| | | |
Total long-term debt | | | 43,701 | | | | 31,345 | | | | 21,959 | |
Total stockholders’ equity | | | 76,344 | | | | 74,772 | | | | 73,702 | |
| | | | | | | | | | | | |
| | | |
Total capitalization | | $ | 120,045 | | | $ | 106,117 | | | $ | 95,661 | |
| | | | | | | | | | | | |
27
ITEM 7. MANAGEMENT’S DISCUSSIONAND ANALYSISOF FINANCIAL CONDITIONAND RESULTSOF OPERATIONS.
This discussion should be read in conjunction with the consolidated financial statements, notes and tables included elsewhere in this Form 10-K. Management’s discussion and analysis contains forward-looking statements that are provided to assist in the understanding of anticipated future performance. However, future performance involves risks and uncertainties which may cause actual results to differ materially from those expressed in the forward-looking statements. See “Forward-Looking Statements”.
EXECUTIVE OVERVIEW
Gas Natural is a natural gas company, primarily operating local distribution companies in seven states and serving approximately 73,000 customers in total. Our natural gas utility subsidiaries are Bangor Gas Company (Maine), Brainard (Ohio), Cut Bank Gas Company (Montana), Energy West, Incorporated (Montana and Wyoming), Frontier Natural Gas (North Carolina), Northeast Ohio Natural Gas Company (Ohio), Orwell (Ohio and Pennsylvania), and Public Gas Company (Kentucky). Our operations also include production and marketing of natural gas, gas pipeline transmission, gathering and propane operations. Approximately 87% of our revenues in 2012 were derived from our natural gas utility operations.
The following summarizes the critical events that impacted our results of operations during the year ended December 31, 2012:
Although it was negatively impacted during 2012 by unusually warm weather in most of our markets, gross margin increased by $2,996,000 as a result of:
| | • | | Customer growth in our North Carolina and Maine markets |
| | • | | A $774,000 increase for a take or pay contract with a large customer in Montana |
| | • | | Our newly formed LNG business returned new revenue and gross margin |
| | • | | The 2012 period includes the results of operations from PGC which was acquired on April 1, 2012 |
| | • | | The 2012 period includes a full year of operations from our propane operations segment |
Net income decreased $1,651,000 in 2012 primarily due to an increase in costs as follows:
| | • | | Operating expenses increased in 2012 compared to 2011 due to increases in bad debt expense including an increase in the allowance for doubtful accounts for the $774,000 take or pay contract discussed above, and depreciation from increased capital expenditures |
| | • | | The 2012 period includes the expenses of operations from PGC and a full year of operations from our propane operations segment |
| | • | | Costs related to acquisitions were significantly higher in 2012 than in 2011. |
| | • | | We incurred costs in 2012 in connection with our CEO’s stock sale which was completed during the second quarter of 2012. |
| | • | | The average balance on our Bank of America line of credit was higher in 2012 compared to 2011, causing an increase in interest expense. |
In addition, 2011 included a pre-tax gain of $955,000 on the bargain purchase of the assets of Independence Oil & LP Gas, Inc., which was offset in part in 2011 by an impairment charge of $790,000 in Kykuit Resources, our unconsolidated affiliate.
We are focused on building rate base profitably in all of our jurisdictions, maintaining cost discipline, adherence to safety standards, and generating recurring streams of earnings and cash flow that support our continued investment in fixed assets, as well as a return of capital to our shareholders in the form of dividends. In addition, we are actively pursuing our acquisition strategy to further grow our operations.
28
CRITICAL ACCOUNTING POLICIESAND ESTIMATES
Our discussion and analysis of our financial condition and results of operation are based upon consolidated financial statements, which have been prepared in accordance with accounting principles generally accepted in the United States of America. The preparation of these financial statements requires us to make estimates and judgments that affect the reported amounts of assets, liabilities, revenues and expenses, and disclosure of contingent assets and liabilities, if any, at the date of the financial statements. We analyze our estimates, including those related to regulatory assets and liabilities, income taxes and contingencies and litigation. We base our estimates on historical experience and various other assumptions that are believed to be reasonable under the circumstances. Actual results may differ from these estimates. We believe the following critical accounting policies affect our more significant judgments and estimates used in the preparation of our consolidated financial statements. See a complete list of significant accounting policies in Note 1 of the notes to the consolidated financial statements included herein.
Regulatory Accounting
Our accounting policies historically reflect the effects of the rate-making process in accordance with Regulated Operations (ASC 980). Our regulated natural gas segment continues to be cost-of-service rate regulated, and we believe the application of ASC 980 to that segment continues to be appropriate. We must reaffirm this conclusion at each balance sheet date. If, as a result of a change in circumstances, we determine that the regulated natural gas segment no longer meets the criteria of regulatory accounting under ASC 980, that segment will have to discontinue regulatory accounting and write off the respective regulatory assets and liabilities.
The application of ASC 980 results in recording regulatory assets and liabilities. Regulatory assets represent the deferral of incurred costs that are probable of future recovery in customer rates. In some cases, we record regulatory assets before we have received approval for recovery from the state regulatory agencies. We must use judgment to conclude that costs deferred as regulatory assets are probable of future recovery. We base this conclusion on certain factors, including changes in the regulatory environment, recent rate orders issued by regulatory agencies, and the status of any potential new legislation. Regulatory liabilities represent revenues received from customers to fund expected costs that have not yet been incurred or for probable future refunds to customers. At December 31, 2012, our total regulatory assets were $3.3 million and our total regulatory liabilities were $1.3 million. A write-off of the regulatory assets and liabilities could have a material impact on our consolidated financial statements.
Our natural gas segment contains regulated utility businesses in the states of Kentucky, Maine, Montana, North Carolina, Ohio, Pennsylvania, and Wyoming and the regulation varies from state to state. If future recovery of costs, in any such jurisdiction, ceases to be probable, we would be required to charge these assets to current earnings. However, there are no current or expected proposals or changes in the regulatory environment that impact the probability of future recovery of these assets. In addition, deregulation would be a change that occurs over time, due to legal processes and procedures, which could moderate the impact to our consolidated financial statements.
Our most significant regulatory asset/liability relates to the recoverable/refundable costs of gas purchases. We account for purchased gas costs in accordance with procedures authorized by the state regulatory agencies, under which purchased gas costs that are different from those provided for in present rates are accumulated and recovered or credited through future rate changes.
Our gas cost recoveries are monitored closely by the regulatory commissions in all of the states in which we operate. The gas cost recoveries are adjusted monthly in five of the seven states in which we operate, and semi-annually or annually in the other two. In addition, all of the states in which we operate require us to submit gas procurement plans, which we follow closely. These plans are reviewed annually by each of the regulatory commissions. The adjustment of gas cost recoveries and the gas procurement plans reduce the risk of disallowance of recoverable gas costs. Based on our experience, we believe it is highly probable that we will recover the regulatory assets that have been recorded.
We use our best judgment when recording regulatory assets and liabilities. Regulatory commissions, however, can reach different conclusions about the recovery of costs and those conclusions could have a material impact on our consolidated financial statements.
29
Accumulated Provisions for Doubtful Accounts
We encounter risks associated with the collection of our accounts receivable. As such, we record a provision for those accounts receivable that are considered to be uncollectible. In order to calculate the appropriate provision, we primarily utilize current conditions as well as historical bad debt write-offs as a percentage of aged receivables. The underlying assumptions used for the provision can change from period to period and the provision could potentially cause a material impact to the accompanying financial statements by overstating liquidity and over-valuing net worth. The actual weather, commodity prices, and other internal and external economic conditions, such as the mix of the customer base between residential, commercial and industrial, may vary significantly from our assumptions and may impact our operating income.
Unbilled Revenue and Gas Costs
We estimate the gas service that has been rendered from the latest date of each meter reading cycle to the month end. This estimate of unbilled usage is based on projected base load usage for each day unbilled plus projected weather sensitive usage for each degree day during the unbilled period. Unbilled revenues and gas costs are calculated from the estimate of unbilled usage multiplied by the rates in effect at month end.
Each month the estimated unbilled revenue amounts are recorded as revenue and a receivable, and the prior month’s estimate is reversed. Likewise, the associated gas costs are recorded as cost of revenue and a payable and the prior month’s estimate is reversed. Actual price and usage patterns may vary from these assumptions and may impact revenues recognized and costs recorded. The critical component of calculating unbilled revenue is estimating the usage on a calendar month basis. Our estimated volumes used in the unbilled revenue calculation have varied from our actual monthly metered volumes by less than plus or minus 10% on December 31, 2012 and December 31, 2011. A variance of 10% on our gross margin from unbilled revenue at December 31, 2012 would have been plus or minus $136,000.
Fair Value of Financial Instruments
Our financial instruments consist of cash and cash equivalents, accounts receivable, accounts payable, and bank borrowings. The carrying amounts of cash and cash equivalents, accounts receivable and accounts payable approximate fair value due to the highly liquid nature of these short-term instruments. The fair values of marketable securities are estimated based on closing share price on the quoted market price for those investments.
Deferred Tax Asset and Income Tax Accruals
Judgment, uncertainty, and estimates are a significant aspect of the income tax accrual process that accounts for the effects of current and deferred income taxes. Uncertainty associated with the application of tax statutes, regulations, and income tax examinations require that judgments and estimates be made in the accrual process.
We have a deferred tax asset of approximately $12.8 million as of December 31, 2012 related to the carryover tax basis of Frontier Utilities and Penobscot Natural Gas. The $12.8 million deferred tax asset relates to acquisitions of these two subsidiaries during 2007. The carryover tax basis is subject to Section 382 of the Internal Revenue Code. Due to limitations imposed under Section 382, our tax depreciation is limited in tax years 2007 through 2012. We have approximately $35.4 million of carryover tax basis as of December 31, 2012. Starting in 2012, we will recognize potential future federal and state income tax benefits of approximately $12.8 million over the remaining life of the carryover tax basis of the assets. For the federal income tax purposes, we concluded that the realization of the deferred tax asset associated with the carryover tax basis will be realized in future reporting periods based on future taxable income projections. For state income tax purposes, we concluded that the realization of the deferred tax asset associated with the carryover tax basis will not be realized, due to state net operating loss carryovers and future state taxable income projections. As such, management has placed a valuation allowance of approximately $1.7 million on the state deferred tax assets associated with the carryover tax basis of its subsidiaries acquired during 2007.
Management will reevaluate the valuation allowance each year based on future taxable income projections, and will adjust the deferred tax asset valuation allowance, if based on the weight of available evidence, it is more-likely-than not that we will realize some portion or all of the deferred tax assets. If the projections indicate
30
that we are unable to use all or a portion of the net deferred tax assets, we will adjust the valuation allowance to income tax expense (benefit). The valuation allowance is based on projections of our taxable income in future reporting years. Based on future taxable income projections, our state net operating losses will not be realized, as such, management has placed a valuation allowance of approximately $2.4 million on the state deferred tax asset associated with state net operating losses.
For the federal tax portion, the five year Internal Revenue Code limitation period discussed above expired in 2012. Based on our estimates of taxable income, we project that we will recover approximately 97 of the remaining benefit in the next nine years, with 3% recovered in small increments in the remaining years. Based on this analysis, we believe that a valuation allowance on the federal portion of the benefit is not necessary. Failure to achieve projected levels of profitability could lead to a write-down in the deferred tax asset if the recovery period becomes uncertain or longer than expected and could also lead to the expiration of the deferred tax asset between now and 2029, either of which would adversely affect our operating results and financial position.
Goodwill
Goodwill represents the excess of the purchase price over the fair value of identifiable net tangible and intangible assets acquired in a business combination. Goodwill is required to be tested for impairment annually, which is completed in the fourth quarter or more frequently if events or changes in circumstances indicate that goodwill may be impaired.
Lease Commitments
Capital Leases
We apply the guidance of ASC 840 to determine if a lease meets the definition of a capital lease. A lease must meet one of four criteria to meet the requirements of a capital lease. If capital lease requirements are met, we must measure a capital lease asset and capital lease obligation initially at an amount equal to the present value at the beginning of the lease term of minimum lease payments during the lease term, excluding any executory costs. If the present value of the minimum lease payments exceeds the fair value of the leased property at lease inception, the amount measured initially as the asset and obligation shall be the fair value.
RESULTSOF OPERATIONS
The following discussion of financial condition and results of operations should be read in conjunction with the Consolidated Financial Statements and Notes thereto and other financial information included elsewhere in this Form 10-K.
For the year ended December 31, 2012, revenue decreased $5,402,000 due to warmer weather and lower natural gas prices. Gross margin increased $2,996,000 due to an increase in customer growth in our North Carolina and Maine markets, as well as a $774,000 increase for a take or pay contract with a large customer in Montana, offset by warmer weather in the majority of our markets. Net income decreased $1,651,000 due to increased operating expenses of $3,638,000. The increase was a result of an increase in bad debt expense of $895,000 which included a write off of the $774,000 take or pay contract discussed above, an increase in depreciation of $645,000 due to increased capital expenditures, an expense associated with our newly acquired subsidiary, PGC of $358,000, a full year of operations for our propane segment resulting in increased expenses of $1,206,000, and expenses in our corporate and other segment of $153,000.
EARNINGS
Year Ended December 31, 2012 Compared with Year Ended December 31, 2011
Net Income — Net income for the year ended December 31, 2012 was $3,719,000 or $0.46 per diluted share, compared to $5,370,000 or $0.66 per diluted share for the year ended December 31, 2011, a decrease of $1,651,000. This was primarily due to the warm weather in 2012 and higher operating and acquisition expenses. Net income from our natural gas operations decreased by $1,347,000, due primarily to warmer weather and higher operating expenses. Net income from our gas marketing and production operations increased by $887,000 due to increased net income from our LNG business. Net income from our pipeline operations decreased
31
$69,000. Net income from our propane operations decreased $603,000 mainly due to a pre-tax gain on the bargain purchase of the assets of Independence of $955,000 in 2011. Net loss from our corporate and other operations increased $519,000.
Revenues — Revenues decreased by $5,401,000 to $93,816,000 for the year ended December 31, 2012 compared to $99,217,000 for 2011. The decrease was primarily attributable to (1) a natural gas revenue decrease of $8,689,000 due to warmer weather in the majority of the markets we serve, lower prices for natural gas passed through to customers which was offset by growth in customers and revenue in our Maine and North Carolina markets (2) an offsetting increase in revenue from our marketing and production operation of $1,703,000, primarily as a result of sales from our newly formed LNG line of business; and (3) a full year of operations from our propane segment in 2012 compared to only five months in 2011 which caused an increase in revenue of $1,600,000.
Gross Margin — Gross margin increased by $2,997,000 to $42,031,000 for the year ended December 31, 2012 compared to $39,034,000 for the same period in 2011. Gross margin from our natural gas operations increased $1,843,000. Lower margin due to the warm weather was offset by growth in customers and margin in our North Carolina and Maine markets and margin of $774,000 recorded from a take or pay contract with a large customer in Montana now in Chapter 11 bankruptcy. Gross margin from our marketing and production operations increased $221,000, primarily from our LNG business and our propane operations returned an increase in gross margin of $948,000 on a full year of operations in 2012 compared to five months in 2011.
Operating Expenses — Operating expenses, other than cost of sales, increased by $3,638,000 to $32,429,000 for the year ended December 31, 2012 compared to $28,791,000 for the same period in 2011. Operating expenses in natural gas operations increased by $2,320,000 due primarily to increases in bad debt expense of $1,110,000, including the addition to our allowance for doubtful accounts for the $774,000 of revenue discussed above, depreciation of $645,000 due to the increases in capital expenditures, and expenses associated with our newly acquired subsidiary PGC of $358,000. A full year of operations from our propane operations segment resulted in an increase in expenses of $1,206,000 and expenses in the corporate and other segment increased by $153,000.
Loss from Unconsolidated Affiliate — Loss from unconsolidated affiliate decreased by $868,000 to $9,000 for the year ended December 31, 2012 compared to $877,000 for the same period in 2011. The 2011 period included an impairment charge of $790,000.
Other Income (Expense), net — Other income (expense) increased by $20,000 to $440,000 for the year ended December 31, 2012 compared to $420,000 for the same period in 2011. The increase was primarily due to the net income of our newly formed insurance agency, Lone Wolfe, which accounted for $7,000 of the increase.
Gain on Bargain Purchase — The gain on bargain purchase for the year ended December 31, 2011 is the result of the pre-tax gain of $955,000 due to the purchase of Independence on August 1, 2011.
Acquisition Expense — Acquisition expense increased by $871,000 to $959,000 for the year ended December 31, 2012 compared to $88,000 for the same period in 2011. The increase is primarily the result of the costs related to various growth opportunities, including $361,000 for potential expansion of natural gas into a new state and a $407,000 increase in costs related to the proposed acquisition of JDOG Marketing.
Stock Sale Expense — Stock sale expense increased by $167,000 to $274,000 for the year ended December 31, 2012 compared to $107,000 for the same period in 2011. The increase is due to the expenses paid in connection with our CEO’s stock sale which was completed in, 2012.
Interest Expense — Interest expense increased by $689,000 to $2,723,000 for the year ended December 31, 2012 compared to $2,034,000 for the same period in 2011. The balance on our Bank of America line of credit averaged $20,111,000 during 2012, compared to $14,548,000 during 2011, causing additional interest expense. In addition, our Ohio subsidiaries issued new debt in May 2011 resulting in $633,000 of interest expense in 2011 as compared to a full year of interest expense of $1,107,000 in 2012.
Income Tax Expense — Income tax expense decreased by $785,000 to $2,357,000 for the year ended December 31, 2012 compared to $3,142,000 for the same period in 2011. The decrease is primarily due to the
32
reduction in pre-tax income. In addition, the 2012 and 2011 periods each included a tax benefit from the true-up to the prior year’s tax return of $193,000 and $326,000, respectively, causing an offsetting increase in tax expense between the two years of $133,000.
Net Income by Service Area
The components of net income (loss) for 2012 and 2011 are:
| | | | | | | | |
| | | Years Ended December 31, | |
| ($ in thousands) | | 2012 | | | 2011 | |
| | |
Natural Gas Operations | | | | | | | | |
Energy West Montana (MT) | | $ | 798 | | | $ | 1,493 | |
Energy West Wyoming (WY) | | | (2) | | | | 367 | |
Frontier Natural Gas (NC) | | | 2,103 | | | | 1,510 | |
Bangor Gas (ME) | | | 1,439 | | | | 1,725 | |
Ohio Companies (OH and PA) | | | 229 | | | | 721 | |
Kentucky (KY) | | | (100) | | | | - | |
Gas Natural Energy Solutions | | | - | | | | (2) | |
| | | | | | | | |
Total Natural Gas Operations | | $ | 4,467 | | | $ | 5,814 | |
Marketing & Production Operations | | | 600 | | | | (287) | |
Pipeline Operations | | | 93 | | | | 162 | |
Propane Operations | | | (348) | | | | 255 | |
| | | | | | | | |
| | | 4,812 | | | | 5,944 | |
Corporate & Other | | | (1,093) | | | | (574) | |
| | | | | | | | |
| | |
Consolidated Net Income | | $ | 3,719 | | | $ | 5,370 | |
| | | | | | | | |
The following highlights our results by operating segments:
NATURAL GAS OPERATIONS
Income Statement
| | | | | | | | |
| | | Years Ended December 31, | |
| ($ in thousands) | | 2012 | | | 2011 | |
| | |
Natural Gas Operations | | | | | | | | |
Operating revenues | | $ | 81,306 | | | $ | 89,995 | |
Gas Purchased | | | 42,486 | | | | 53,018 | |
| | | | | | | | |
Gross Margin | | | 38,820 | | | | 36,977 | |
Operating expenses | | | 29,124 | | | | 26,804 | |
| | | | | | | | |
Operating income | | | 9,696 | | | | 10,173 | |
Other income | | | 418 | | | | 639 | |
| | | | | | | | |
Income before interest and taxes | | | 10,114 | | | | 10,812 | |
Interest expense | | | (2,512) | | | | (1,926) | |
| | | | | | | | |
Income before income taxes | | | 7,602 | | | | 8,886 | |
Income tax expense | | | (3,135) | | | | (3,072) | |
| | | | | | | | |
Net Income | | $ | 4,467 | | | $ | 5,814 | |
| | | | | | | | |
33
Operating Revenues
| | | | | | | | |
| | | Years Ended December 31, | |
| ($ in thousands) | | 2012 | | | 2011 | |
Full Service Distribution Revenues | | | | | | | | |
Residential | | $ | 35,016 | | | $ | 41,219 | |
Commercial | | | 33,501 | | | | 37,314 | |
Industrial | | | 814 | | | | 895 | |
Other | | | 104 | | | | 172 | |
| | | | | | | | |
Total full service distribution | | | 69,435 | | | | 79,600 | |
| | |
Transportation | | | 10,720 | | | | 9,244 | |
Bucksport | | | 1,151 | | | | 1,151 | |
| | | | | | | | |
| | |
Total operating revenues | | $ | 81,306 | | | $ | 89,995 | |
| | | | | | | | |
Utility Throughput
| | | | | | | | |
| | | Years Ended December 31, | |
| (in million cubic feet (MMcf)) | | 2012 | | | 2011 | |
| | |
Full Service Distribution | | | | | | | | |
Residential | | | 4,349 | | | | 4,644 | |
Commercial | | | 4,250 | | | | 4,552 | |
Industrial | | | 178 | | | | 150 | |
| | | | | | | | |
Total full service | | | 8,777 | | | | 9,346 | |
| | |
Transportation | | | 10,301 | | | | 9,050 | |
Bucksport | | | 14,144 | | | | 13,925 | |
| | | | | | | | |
| | |
Total Volumes | | | 33,222 | | | | 32,321 | |
| | | | | | | | |
Heating Degree Days
A heating degree day is a measure of coldness of the weather experienced, based on the extent to which the daily average temperature falls below a reference temperature, usually 65 degrees Fahrenheit.
| | | | | | | | | | | | | | | | | | | | |
| | | | | | Years Ended
December 31, | | | Percent (Warmer) Colder
2012 Compared to | |
| | | Normal | | | 2012 | | | 2011 | | | Normal | | | 2011 | |
Great Falls, MT | | | 7,508 | | | | 6,828 | | | | 7,800 | | | | (9.06%) | | | | (12.46%) | |
Cody, WY | | | 6,925 | | | | 6,291 | | | | 7,434 | | | | (9.16%) | | | | (15.38%) | |
Bangor, ME | | | 7,676 | | | | 7,020 | | | | 7,267 | | | | (8.55%) | | | | (3.40%) | |
Elkin, NC | | | 3,963 | | | | 3,661 | | | | 3,901 | | | | (7.62%) | | | | (6.15%) | |
Youngstown, OH | | | 6,349 | | | | 5,345 | | | | 6,024 | | | | (15.81%) | | | | (11.27%) | |
Jackson, KY | | | 4,451 | | | | 3,870 | | | | - | | | | (13.05%) | | | | - | |
34
Year Ended December 31, 2012 Compared with Year Ended December 31, 2011
Revenues and Gross Margin
Revenues decreased by $8,689,000 to $81,306,000 for the year ended December 31, 2012 compared to $89,995,000 for the same period in 2011. This decrease is the result of the following factors:
| | 1) | Revenue from our Montana and Wyoming markets decreased $7,475,000 on a volume decrease of 506 MMcf in the year ended December 31, 2012 compared to the year ended December 31, 2011 due to warmer weather and lower prices for natural gas passed through to customers. |
| | 2) | Revenues from our Ohio market decreased $4,931,000. Revenue to full service customers decreased $5,049,000 on a volume decrease in 2012 of 374 MMcf compared to 2011. |
| | 3) | Revenue from our Maine and North Carolina markets increased by $3,244,000 on a volume increase from full service and transportation customers of 916 MMcf in 2012 compared to 2011. |
| | 4) | The recently acquired PGC accounted for $473,000 of additional revenue on volumes of 99 MMcf. |
Gas purchased decreased by $10,532,000 to $42,486,000 for the year ended December 31, 2012 compared to $53,018,000 for the same period in 2011. The decrease is due to lower prices for natural gas in 2012 compared to 2011 combined with lower volume throughput to full service customers in our Montana, Wyoming and Ohio markets. Our gas costs are passed on dollar for dollar to our customers under tariffs regulated by the various public utility commissions in the jurisdictions in which we operate. Our gas costs are subject to periodic audits and prudency reviews in all of these jurisdictions.
Gross margin increased by $1,843,000 to $38,820,000 for the year ended December 31, 2012 compared to $36,977,000 for the same period in 2011. Customer growth in our Maine and North Carolina markets offset the decrease in margin due to warmer weather in all of our service territories. Maine and North Carolina accounted for $2,434,000 of the increase, PGC for $191,000 and Montana and Wyoming for $3,000, offset by a decrease in Ohio of $784,000. Revenue and margin of $774,000 recorded from a take or pay contract with a large customer in Montana now in Chapter 11 bankruptcy offsets the decrease in margin in Montana due to warmer weather.
Earnings
The Natural Gas Operations segment’s income for the year ended December 31, 2012 was $4,467,000, or $0.55 per diluted share, compared to $5,814,000 or $0.71 per diluted share for the year ended December 31, 2011.
Operating expenses increased by $2,320,000 to $29,124,000 for the year ended December 31, 2012 compared to $26,804,000 for the same period in 2011. Increases in bad debt expense totaled $1,012,000 and include the addition to our allowance for doubtful accounts for the $774,000 of revenue from a customer in bankruptcy discussed above. Depreciation increased by $645,000 due to the increases in capital expenditures, and expenses associated with our newly acquired subsidiary, PGC, totaled $358,000.
Other income decreased by $221,000 to $418,000 for the year ended December 31, 2012 compared to $639,000 for the same period in 2011. Acquisition costs increased $154,000 due to the Loring purchase.
Interest expense increased by $586,000 to $2,512,000 for the year ended December 31, 2012 compared to $1,926,000 for the same period in 2011. The balance on our Bank of America line of credit averaged $20,111,000 during 2012, compared to $14,548,000 during 2011, causing additional interest expense. In addition, our Ohio subsidiaries issued new debt in May 2011 resulting in $633,000 of interest expense in 2011 as compared to a full year of interest expense of $1,107,000 in 2012.
Income tax expense increased by $63,000 to $3,135,000 for the year ended December 31, 2012 compared to $3,072,000 for the same period in 2011. The 2012 period included expense of $144,000 related to the true-up of the prior year’s tax return, while the 2011 period included a tax benefit of $333,000, for an increase in expense of $477,000. This is offset by the income tax benefit related to the decrease in pre-tax income in 2012 compared to 2011.
35
MARKETINGAND PRODUCTION
Income Statement
| | | | | | | | |
| | | Years Ended December 31, | |
| ($ in thousands) | | 2012 | | | 2011 | |
| | |
Marketing and Production | | | | | | | | |
Operating revenues | | $ | 7,493 | | | $ | 5,790 | |
Gas Purchased | | | 5,953 | | | | 4,471 | |
| | | | | | | | |
Gross Margin | | | 1,540 | | | | 1,319 | |
Operating expenses | | | 805 | | | | 873 | |
| | | | | | | | |
Operating income | | | 735 | | | | 446 | |
Other income (loss) | | | (6) | | | | (877) | |
| | | | | | | | |
Income before interest and taxes | | | 729 | | | | (431) | |
Interest expense | | | (134) | | | | (88) | |
| | | | | | | | |
Income before income taxes | | | 595 | | | | (519) | |
Income tax benefit (expense) | | | 5 | | | | 232 | |
| | | | | | | | |
Net Income (Loss) | | $ | 600 | | | $ | (287) | |
| | | | | | | | |
Year Ended December 31, 2012 Compared with Year Ended December 31, 2011
Revenues and Gross Margin
Revenues increased by $1,703,000 to $7,493,000 for the year ended December 31, 2012 compared to $5,790,000 for the same period in 2011. Revenue from our new LNG business accounted for $2,087,000 of the increase, and is offset by a $318,000 decrease in production revenues due to lower prices received for volumes produced and a $66,000 decrease in revenues from our marketing operation. Revenue from increased sales volumes was offset by lower prices received for volumes sold.
Gross margin increased by $221,000 to $1,540,000 for the year ended December 31, 2012 compared to $1,319,000 for the same period in 2011. Our new LNG business returned $346,000 of gross margin and gross margin from our gas marketing operation increased by $176,000 due to the increased sales volumes. Offsetting these is a margin decrease from our production operation of $301,000 due to the lower prices received for volumes produced.
Earnings
The Marketing and Production segment’s income for the year ended December 31, 2012 was $600,000, or $0.07 per diluted share, compared to a loss of $287,000 or $0.04 per diluted share for the year ended December 31, 2011 due to increased income from our LNG business.
Operating expenses decreased by $68,000 to $805,000 for the year ended December 31, 2012 compared to $873,000 for the same period in 2011.
Other income (loss) increased by $871,000 to a loss of $6,000 for the year ended December 31, 2012 compared to a loss of $877,000 for the same period in 2011. The loss from an unconsolidated affiliate was $9,000 in 2012, compared to $877,000 in 2011. The 2011 period included an impairment charge of $790,000.
Income tax expense increased by $227,000 to a benefit of $5,000 for the year ended December 31, 2012 compared to benefit of $232,000 for the same period in 2011. Tax expense increased on the increase in pre-tax income in 2012 compared to 2011. The 2012 and 2011 periods each included a tax benefit from the true-up to the prior year’s tax return of $241,000 and $9,000 respectively, which causes an offsetting $232,000 benefit.
36
PIPELINE OPERATIONS
Income Statement
| | | | | | | | |
| | | Years Ended December 31, | |
| ($ in thousands) | | 2012 | | | 2011 | |
| | |
Pipeline Operations | | | | | | | | |
Operating revenues | | $ | 402 | | | $ | 418 | |
Gas Purchased | | | - | | | | - | |
| | | | | | | | |
Gross Margin | | | 402 | | | | 418 | |
Operating expenses | | | 198 | | | | 172 | |
| | | | | | | | |
Operating income | | | 204 | | | | 246 | |
Other income | | | - | | | | - | |
| | | | | | | | |
Income before interest and taxes | | | 204 | | | | 246 | |
Interest expense | | | (13) | | | | (16) | |
| | | | | | | | |
Income before income taxes | | | 191 | | | | 230 | |
Income tax expense | | | (98) | | | | (68) | |
| | | | | | | | |
Net Income | | $ | 93 | | | $ | 162 | |
| | | | | | | | |
Year Ended December 31, 2012 Compared with Year Ended December 31, 2011
Net income decreased by $69,000 to $93,000 for the year ended December 31, 2012 compared to $162,000 for the same period in 2011. The overall impact of the results of our pipeline operations was not material to our results of consolidated operations.
PROPANE OPERATIONS
Income Statement
| | | | | | | | |
| | | Years Ended December 31, | |
| ($ in thousands) | | 2012 | | | 2011 | |
| | |
Propane Operations | | | | | | | | |
Operating revenues | | $ | 4,615 | | | $ | 3,015 | |
Gas Purchased | | | 3,347 | | | | 2,695 | |
| | | | | | | | |
Gross Margin | | | 1,268 | | | | 320 | |
Operating expenses | | | 1,992 | | | | 786 | |
| | | | | | | | |
Operating loss | | | (724) | | | | (466) | |
Other income | | | 16 | | | | 1,005 | |
| | | | | | | | |
Income (loss) before interest and taxes | | | (708) | | | | 539 | |
Interest expense | | | (23) | | | | - | |
| | | | | | | | |
Income (loss) before income taxes | | | (731) | | | | 539 | |
Income tax expense | | | 383 | | | | (284) | |
| | | | | | | | |
Net Income (loss) | | $ | (348) | | | $ | 255 | |
| | | | | | | | |
Year Ended December 31, 2012 Compared with Year Ended December 31, 2011
Revenues and Gross Margin
Revenues increased by $1,600,000 to $4,615,000 for the year ended December 31, 2012 compared to $3,015,000 for the same period in 2011. The 2011 period included only five months of operations as the acquisition of the assets of Independence took place on August 1, 2011. This is offset by a decrease is sales of diesel fuel in 2012 due to the loss of a large customer.
37
Gross margin increased by $948,000 to $1,268,000 for the year ended December 31, 2012 compared to $320,000 for the same period in 2011. As explained above, the 2011 period included only five months of operations.
Earnings
The Propane Operations segment’s loss for the year ended December 31, 2012 was $348,000, or $0.04 per diluted share, compared to earnings of $255,000, or $0.03 per diluted share for the year ended December 31, 2011. The 2011 period included the pre-tax gain on the bargain purchase of the assets of Independence Oil & LP Gas, Inc. of $955,000.
Operating expenses increased by $1,206,000 to $1,992,000 for the year ended December 31, 2012 compared to $786,000 for the same period in 2011, as the 2011 period included only five months of operations.
Other income (loss) decreased by $989,000 to $16,000 for the year ended December 31, 2012 compared to $1,005,000 for the same period in 2011. The 2011 period included the pre-tax gain on the bargain purchase of the assets of Independence Oil & LP Gas, Inc. of $955,000.
Income tax expense decreased by $667,000 to a benefit of $383,000 for the year ended December 31, 2012 compared to an expense of $284,000 for the same period in 2011. The decrease is primarily due to the pre-tax loss in the 2012 period, compared to pre-tax income in the 2011 period.
CORPORATEAND OTHER
Our Corporate and Other reporting segment is intended primarily to encompass the results of corporate acquisitions and other equity transactions, as well as certain other income and expense items associated with Gas Natural’s holding company functions. Therefore, it does not have standard revenues, gas purchase costs, or gross margin.
Income Statement
| | | | | | | | |
| | | Years Ended December 31, | |
| ($ in thousands) | | 2012 | | | 2011 | |
| | |
Corporate and Other | | | | | | | | |
Operating revenues | | $ | - | | | $ | - | |
Gas Purchased | | | - | | | | - | |
| | | | | | | | |
Gross Margin | | | - | | | | - | |
Operating expenses | | | 310 | | | | 157 | |
| | | | | | | | |
Operating income (loss) | | | (310) | | | | (157) | |
Other income (loss) | | | (1,231) | | | | (463) | |
| | | | | | | | |
Income before interest and taxes | | | (1,541) | | | | (620) | |
Interest expense | | | (40) | | | | (3) | |
| | | | | | | | |
Income before income taxes | | | (1,581) | | | | (623) | |
Income tax benefit (expense) | | | 488 | | | | 49 | |
| | | | | | | | |
Net Loss | | $ | (1,093) | | | $ | (574) | |
| | | | | | | | |
Year Ended December 31, 2012 Compared with Year Ended December 31, 2011
Results of corporate and other operations for the year ended December 31, 2012 include administrative costs of $310,000, acquisition costs of $805,000, $429,000 of which relate to the acquisition of JDOG Marketing, costs related to expenses for our CEO’s stock sale of $274,000, corporate expenses of $163,000, interest expense of $40,000, offset by interest income of $12,000 and income tax benefit of $488,000, for an net loss of $1,093,000.
Results of corporate and other operations for the year ended December 31, 2011 include administrative costs of $227,000, costs related to acquisition activities of $88,000, costs related to expenses for our CEO’s stock sale of $107,000, corporate expenses of $208,000, interest expense of $3,000, offset by interest income of $10,000, for a
38
pre-tax loss of $623,000. The income tax benefit was $49,000 and consisted of a benefit of $234,000 related to the pre-tax loss, offset by an increase related to year-end allocation adjustments of $181,000 and an increase related to the difference in true-ups with the prior year’s tax return of $4,000. The end result is a net loss of $574,000.
CAPITAL SOURCESAND LIQUIDITY
Sources and Uses of Cash
Operating activities provide our primary source of cash. At December 31, 2012 and 2011, we had approximately $3.4 million and $10.5 million of cash on hand, respectively. Cash provided by operating activities consists of net income adjusted for non-cash items, including depreciation and amortization, accretion, deferred income taxes and changes in working capital.
Our ability to maintain liquidity depends upon our credit facility with Bank of America, shown as line of credit on the accompanying balance sheets. Our use of the Bank of America revolving line of credit was $23.9 million and $23.2 million at December 31, 2012 and 2011, respectively. This increase is primarily attributable to capital expenditures in our Maine and North Carolina markets due to expansion.
We made capital expenditures of $18.5 million and $23.2 million for the years ended December 31, 2012 and 2011, respectively. We finance our capital expenditures on an interim basis by the use of our operating cash flow and use of the Bank of America revolving line of credit.
We periodically repay our short-term borrowings under the Bank of America revolving line of credit by using the net proceeds from the sale of long-term debt and equity securities. Long-term debt was $44.3 million and $31.4 million at December 31, 2012 and December 31, 2011, respectively, including the amount due within one year.
Cash, excluding restricted cash, decreased to $3.4 million at December 31, 2012, compared to $10.5 million at December 31, 2011.
| | | | | | | | |
| | | For the Years Ended December 31, | |
| | | 2012 | | | 2011 | |
Cash provided by operating activities | | $ | 8,617,000 | | | $ | 14,896,000 | |
Cash used in investing activities | | | (23,252,000) | | | | (25,011,000) | |
Cash provided by financing activities | | | 7,566,000 | | | | 7,593,000 | |
| | | | | | | | |
Decrease in cash | | $ | (7,069,000) | | | $ | (2,522,000) | |
| | | | | | | | |
OPERATING CASH FLOW
For the year ended December 31, 2012, cash provided by operating activities decreased by $6.3 million as compared to the year ended December 31, 2011. Major items affecting operating cash included a decrease in accounts receivable collections of $3.0 million, a decrease of $2.8 million in purchases of inventory, a $1.9 million net increase in unbilled revenue, a $1.9 million decrease in collections of recoverable costs of gas, a $1.7 million increase in payments of other liabilities, a $1.7 million increase in prepayments, a decrease in net income of $1.7 million, and a $1.6 million decrease in payments for other assets.
INVESTING CASH FLOW
For the year ended December 31, 2012, cash used in investing activities decreased by $1.8 million as compared to the year ended December 31, 2011. This is primarily due to decreased construction expenditures of $4.7 million and expenditures of $3.9 million in 2012 for the acquisitions of Public Gas and the Loring Pipeline, compared to $1.4 million related to acquisition of the net assets of Independence in August 2011. There was also an increase of $1.3 million in cash restrictions for capital expenditures.
Capital Expenditures
Our capital expenditures for continuing operations totaled $18.5 million and $23.2 million for the years ended December 31, 2012 and 2011, respectively. These expenditures include $3.3 million related to the acquisition of Spelman in 2011.
39
The majority of our capital spending is focused on the growth of our Natural Gas Operations segment. We conduct ongoing construction activities in all of our utility service areas in order to support expansion, maintenance, and enhancement of our gas pipeline systems. We are actively expanding our systems in North Carolina and Maine to meet the high customer interest in natural gas service in those two service areas.
The table below details our capital expenditures for the years ended December 31, 2012 and 2011 and provides an estimate of future cash requirements for the year ended December 31, 2013:
| | | | | | | | | | | | |
| | | Years Ended December 31, | | | Estimated Future Cash
Requirements for
December 31, 2013 | |
| ($ in thousands) | | 2012 | | | 2011 | | |
Natural Gas Operations | | $ | 16,132 | | | $ | 22,496 | | | $ | 8,745 | |
Marketing and Production | | | 1,393 | | | | - | | | | 250 | |
Pipeline Operations | | | 23 | | | | 19 | | | | 69 | |
Propane Operations | | | 52 | | | | 583 | | | | 300 | |
Corporate and Other | | | 856 | | | | 108 | | | | 744 | |
| | | | | | | | | | | | |
Total Capital Expenditures | | $ | 18,456 | | | $ | 23,206 | | | $ | 10,108 | |
| | | | | | | | | | | | |
FINANCING CASH FLOW
For the year ended December 31, 2012, cash provided by financing activities decreased by $28,000 as compared with the year ended December 31, 2011. During 2012, we set up a new line of credit between Energy West and Bank of America, which increased line of credit proceeds by $20.8 million over last year. As a result, payments on the line increased $24.7 million, as we paid off the original line of credit with proceeds from the new one. We also repaid long-term debt of $3.0 million with Sun Life, and of $10 million with Bank of America, causing long-term debt proceeds to decrease by $5.4 million, against the $18.4 million in new long-term borrowings from Sun Life in 2011. We agreed to deliver an irrevocable standby letter of credit to Sun Life in the amount of $750,000 to be drawn upon by Sun Life if and when any event of default has occurred and is continuing. After discussion with Sun Life, the parties agreed to change the letter of credit requirement to depositing cash into a reserve account whereas Sun Life is the beneficiary. In addition, Sun Life restricted our cash balance and required two main types of debt service reserve accounts to be created to cover approximately one year of interest payments. The balance in both debt service reserve accounts was $1,079,000 and $950,000 at December 31, 2012 and 2011, respectively. For the first debt service reserve account, the reserve funds cannot be used for operating cash needs. For the second debt service reserve account, the reserve funds can only be used for capital expenditures.
We fund our operating cash needs, as well as dividend payments and capital expenditures, primarily through cash flow from operating activities and short-term borrowing. Historically, to the extent cash flow has not been sufficient to fund these expenditures, we have used our working capital line of credit. We have greater need for short-term borrowing during periods when internally generated funds are not sufficient to cover all capital and operating requirements, including costs of gas purchased and capital expenditures. In general, our short-term borrowing needs for purchases of gas inventory and capital expenditures are greatest during the summer and fall months and our short-term borrowing needs for financing customer accounts receivable are greatest during the winter months. Our ability to maintain liquidity depends upon our credit facility with Bank of America, shown as line of credit on the accompanying balance sheets. Our use of the Bank of America revolving line of credit was $23.9 million and $23.2 million at December 31, 2012 and 2011, respectively. We periodically repay our short-term borrowings under the Bank of America revolving line of credit by using the net proceeds from the sale of long-term debt and equity securities. Long-term debt was $44.3 million and $31.4 million at December 31, 2012, and 2011, respectively, including the amount due within one year.
Citizens Bank Term Loans
Our Ohio subsidiaries had term loans with Citizens in the aggregate amount of $11.3 million. Each term note had a maturity date of July 1, 2013 and bore interest at an annual rate of 30-day LIBOR plus 400 basis points with an
40
interest rate floor of 5.00% per annum. For the year ended December 31, 2011, the weighted average interest rate on the term loans was 5.00%, resulting in $156,022 of interest expense. The term loans were paid off on May 3, 2011.
The following discussion describes our credit facilities as of December 31, 2012.
Sun Life Assurance Company of Canada
On May 2, 2011, the Company and its Ohio subsidiaries, NEO, Orwell and Brainard (together “the Issuers”), issued $15.3 million of 5.38% Senior Secured Guaranteed Fixed Rate Notes due June 1, 2017 (“Fixed Rate Note”). Additionally, Great Plains issued $3.0 million of Senior Secured Guaranteed Floating Rate Notes due May 3, 2014 (“Floating Rate Note”). Both notes were placed with Sun Life.
The Fixed Rate Note, in the amount of $15.3 million, is a joint obligation of the Issuers, and is guaranteed by the Company, Lightning Pipeline and Great Plains (together with the Issuers, “the Fixed Rate Obligors”). Prepayment of this note prior to maturity is subject to a 50 basis point make-whole premium.
The Floating Rate Note, in the amount of $3.0 million, is an obligation of Great Plains and is guaranteed by the Company (together, “the Floating Rate Obligors”). The note is priced at a fixed spread of 385 basis points over three month Libor. Pricing for this note will reset on a quarterly basis to the then current yield of three month Libor. Prepayment of this note prior to maturity is at par.
Each of the notes is governed by a note purchase agreement. Concurrent with the funding and closing of the notes, which occurred on May 3, 2011, the parties executed amended note purchase agreements that are substantially the same as the note purchase agreements originally executed on November 2, 2010.
The use of proceeds for both notes extinguished existing amortizing bank debt and other existing indebtedness, funded $3.4 million for the 2011 capital program for Orwell and NEO, established two debt service reserve accounts, and replenished the Company’s treasuries for the previously described repayment of maturing bank debt and transaction expenses. The capital program funds and debt service reserve accounts are in interest bearing accounts and included in restricted cash.
Sun Life restricted our cash balance and required two main types of debt service reserve accounts to be created to cover approximately one year of interest payments. The balance in both debt service reserve accounts was $1,072,000 and $950,000 at December 31, 2012 and 2011, respectively. The debt service reserve accounts cannot be used for operating cash needs.
For the years ended December 31, 2012 and 2011, the weighted average interest rate on the Fixed Rate Note was 5.38% and 5.38% respectively resulting in $824,969 and $549,979 of interest expense. For the years ended December 31, 2012 and 2011, the weighted average interest rate on the Floating Rate Note was 4.31% and 4.16%, respectively, resulting in $129,200 and $83,075 of interest expense.
For the year ended December 31, 2011, the Company breached a financial covenant under the Fixed Rate Note and Floating Rate Note when the Obligors made restricted payments in the form of dividends to Gas Natural in excess of the amounts permissible. In addition, the Company did not timely notify Sun Life of certain newly-formed subsidiaries which were required to be obligors under the Fixed Rate Note and Floating Rate Note. The failure to timely notify Sun Life constituted a breach of the Fixed Rate Note and Floating Rate Note. The Company requested that Sun Life waive these breaches and amend the financial covenants.
On April 9, 2012, the Company entered into a waiver and amendment of the Fixed Rate Note and Floating Rate Note. Pursuant to the amendments, Sun Life waived its rights and remedies of the breaches of the covenants described above.
On October 24, 2012, Orwell, NEO, and Brainard issued a Senior Secured Guaranteed Note in the amount of $2.989 million. The Senior Note was placed with Sun Life, pursuant to a third amendment to the original Note Purchase Agreement dated as of November 1, 2010, by and among Orwell, NEO, and Brainard, and Great Plains Natural Gas Company, Lightning Pipeline Company, Inc., Gas Natural and Sun Life. The Senior Note will bear an interest rate of 4.15%, compounded semi-annually, and it matures on June 1, 2017. For the years ended December 31, 2012, the weighted average interest rate on the Senior Note was 4.15% resulting in $23,576 of interest expense.
41
The Senior Note is a joint obligation of the Ohio subsidiaries and is guaranteed by Gas Natural’s non-regulated Ohio and North Carolina subsidiaries. The Senior Note is subject to other customary loan covenants and default provisions. In the past, the SEC has asked us to detail these covenants.
The amendments also provide that any cash dividends, distributions, redemptions or repurchases of common stock may be made by the obligors to the holding company only if (i) the aggregate amount of all such dividends, distributions, redemptions and repurchases for the fiscal year do not exceed 70% of net income of the obligors for the four fiscal quarters then ending determined as of the end of each fiscal quarter for the four fiscal quarters then ending, and (ii) there exists no other event of default at the time the dividend, distribution, redemption or repurchase is made. The inability of the obligors to pay a dividend to the holding company may impact the Company’s ability to pay a dividend to shareholders. In addition, the Company agreed to deliver an irrevocable standby letter of credit to Sun Life in the amount of $750,000 to be drawn upon by Sun Life if and when any event of default has occurred and is continuing. After discussion with Sun Life, the parties agreed to change the letter of credit requirement to depositing cash into a reserve account whereas Sun Life is the beneficiary. The terms allow the Company to withdraw that money if a letter of credit is received to replace the restricted cash.
The Fixed Rate Note and Floating Rate Note require, on a consolidated basis, an interest coverage ratio of at least 2.0 to 1.0, measured quarterly on a trailing four quarter basis. The notes generally define the interest coverage ratio as the ratio of EBITDA to gross interest expense. The note defines EBITDA as net income plus the sum of interest expense, any provision for federal, state, and local taxes, depreciation, and amortization determined on a consolidated basis in accordance with GAAP, but excluding any extraordinary non-operating income or loss and any gain or loss from non-operating transactions. The interest coverage ratio is measured with respect to the Obligors on a consolidated basis and also with respect to the Company and all of its subsidiaries, on a consolidated basis. The notes also require that the Company does not permit indebtedness to exceed 60% of capitalization at any time. Like the interest coverage ratio, the ratio of debt to capitalization is measured on a consolidated basis for the Obligors, and again on a consolidated basis with respect to the Company and all of its subsidiaries.
The Ohio subsidiaries and PGC are prohibited from creating, assuming or incurring additional indebtedness except for (i) obligations under certain financing agreements, (ii) indebtedness incurred under certain capitalized leases and purchase money obligations not to exceed $500,000 at any one time outstanding, (iii) indebtedness outstanding as of March 31, 2011, (iv) certain unsecured intercompany indebtedness and (v) certain other indebtedness permitted under the notes.
The notes prohibit us from selling or otherwise transferring assets except in the ordinary course of business and to the extent such sales or transfers, in the aggregate, over each rolling twelve month period, do not exceed 1% of our total assets. Generally, we may consummate a merger or consolidation if there is no event of default and the provisions of the notes are assumed by the surviving or continuing corporation. We are also generally limited in making acquisitions in excess of 10% of our total assets. An event of default, if not cured, would require us to immediately pay the outstanding principal balance of the notes as well as any and all interest and other payments due. An event of default would also entitle Sun Life to exercise certain rights with respect to the collateral that secures the indebtedness incurred under the notes.
42
Bank of America
The following table represents borrowings under the Bank of America revolving line of credit for each of the fiscal quarters and the years ended December 31, 2012 and 2011.
| | | | | | | | | | | | | | | | | | | | |
| | | First
Quarter | | | Second Quarter | | | Third
Quarter | | | Fourth Quarter | | | Twelve Months
Ended
December 31,
2012 | |
Year Ended December 31, 2012 | | | | | | | | | | | | | | | | | | | | |
Minimum borrowing | | $ | 16,800,000 | | | $ | 15,100,000 | | | $ | 18,020,000 | | | $ | 18,020,000 | | | $ | 15,100,000 | |
Maximum borrowing | | $ | 23,610,000 | | | $ | 17,650,000 | | | $ | 26,966,000 | | | $ | 23,860,000 | | | $ | 26,966,000 | |
Average borrowing | | $ | 20,363,000 | | | $ | 16,381,000 | | | $ | 22,899,000 | | | $ | 20,802,000 | | | $ | 20,111,000 | |
| | | | | |
Year Ended December 31, 2011 | | | | | | | | | | | | | | | | | | | | |
Minimum borrowing | | $ | 9,700,000 | | | $ | 8,390,000 | | | $ | 10,140,000 | | | $ | 17,600,000 | | | $ | 8,390,000 | |
Maximum borrowing | | $ | 18,150,000 | | | $ | 11,840,000 | | | $ | 17,600,000 | | | $ | 23,160,000 | | | $ | 23,160,000 | |
Average borrowing | | $ | 13,852,000 | | | $ | 9,910,000 | | | $ | 14,238,000 | | | $ | 20,190,000 | | | $ | 14,548,000 | |
At December 31, 2012 and December 31, 2011 we had $23.9 million and $23.2 million and of borrowings under the Bank of America revolving line of credit. For the year ended December 31, 2012 and December 31, 2011, the weighted average interest rate on the facility was 3.33% and 1.72 % resulting in $500,063 and $262,514 of interest expense. The $23.9 million of borrowings as of December 31, 2012, leaves the remaining borrowing capacity on the line of credit at $6.1 million.
On September 20, 2012, the Company’s subsidiary, Energy West, entered into an amended credit facility with the Bank of America which modifies the original credit agreement entered into on June 29, 2007. The credit facility renewed the $30.0 million revolving credit facility available to Energy West and provides for a maturity date of April 1, 2017. In addition, Energy West entered into a $10.0 million term loan with Bank of America with a maturity date of April 1, 2017 (the “term loan”). Pursuant to the terms of the credit facility, Energy West issued a second amended and substitute note to Bank of America in the amount of $30.0 million for the revolving credit facility and another note in the original principal amount of $10.0 million for the term loan.
The credit facility includes an annual commitment fee ranging from 25 to 45 basis points of the unused portion of the Credit Agreement and interest on the amounts outstanding at the London Interbank Offered Rate (“LIBOR”) rate plus 175 to 225 basis points. The Term Loan has an interest rate of LIBOR plus 175 to 225 basis points with an interest rate swap provision that allows for the interest rate to be fixed in the future. The Term Loan will be amortized at a rate of $125,000 per quarter, with the first principal payment commencing on December 31, 2012. As of December 31, 2012, the Company had not exercised the swap provision for the fixed interest rate. The first principal payment was paid to Bank of America on January 3, 2013.
The amended credit facility required that Energy West and its subsidiaries maintain compliance with a number of financial covenants, including a limitation on investments in another entity by acquisition of any debt or equity securities or assets or by making loans or advances to such entity. In addition, Energy West must maintain a total debt to total capital ratio of not more than .55-to-1.00 (previously .65-to-1.00) and an interest coverage ratio of no less than 2.0-to-1.0. The credit facility restricted Energy West’s ability to create, incur or assume indebtedness except (i) indebtedness under the credit facility (ii) indebtedness incurred under certain capitalized leases including the capital lease related to the Loring pipeline, and purchase money obligations not to exceed $500,000, (iii) certain indebtedness of Energy West’s subsidiaries, (iv) certain subordinated indebtedness, (v) certain hedging obligations and (vi) other indebtedness not to exceed $1.0 million.
The credit facility also restricted Energy West’s ability to pay dividends and make distributions, redemptions and repurchases of stock during any 60-month period to 80% (previously 75%) of its net income over that period. In addition, no event of default may exist at the time such dividend, distribution, redemption or repurchase is made.
43
Energy West is also prohibited from consummating a merger or consolidation or selling all or substantially all of its assets or stock except for (i) any merger consolidation or sale by or with certain of its subsidiaries, (ii) any such purchase or other acquisition by Energy West or certain of its subsidiaries and (iii) sales and dispositions of assets for at least fair market value so long as the net book value of all assets sold or otherwise disposed of in any fiscal year does not exceed 5% of the net book value of Energy West’s assets as of the last day of the preceding fiscal year.
Senior Unsecured Notes of Energy West
On June 29, 2007, Energy West authorized the sale of $13,000,000 aggregate principal amount of its 6.16% Senior Unsecured Notes, due June 29, 2017 (the Senior Unsecured Notes). The proceeds of these notes were used to refinance existing notes.
The notes contain various covenants, including a limitation on Energy West’s total dividends and distributions made in the immediately preceding 60-month period to 75% of aggregate consolidated net income for such period. The notes restrict Energy West from incurring additional senior indebtedness in excess of 60% of capitalization at any time and require Energy West to maintain an interest coverage ratio of not more than 150% of the pro forma annual interest charges on a consolidated basis in two of the three preceding fiscal years.
Energy West is prohibited from selling or otherwise disposing of any of its property or assets except (i) in the ordinary course of business, (ii) property or assets that are no longer usable in its business or (iii) property or assets transferred between Energy West and its subsidiaries if the aggregate net book value of all properties and assets so disposed of during the twelve month period next preceding the date of such sale or disposition would constitute more than 15% of the aggregate book value of all Energy West’s tangible assets. In addition, Energy West may only consummate a merger or consolidation, dissolve or otherwise dispose of all or substantially all of its assets (i) if there is no event of default, (ii) the provisions of the notes are assumed by the surviving or continuing corporation and such entity further agrees that it will continue to operate its facilities as part of a system comprising a public utility regulated by the Public Service Commission of Montana or another federal or state agency or authority and (iii) the surviving or continuing corporation has a net worth immediately subsequent to such acquisition, consolidation or merger equal to or greater than $10 million.
The cash flow from our business is seasonal and the line of credit balance in December normally represents the high point of borrowings in our annual cash flow cycle. Our cash flow increases and our borrowings decrease, beginning in January, as monthly heating bills are paid and the gas we paid for and placed in storage in the summer months is used to supply our customers. The total amount outstanding under all of our long term debt obligations was approximately $44.3 million at December 31, 2012, with $508,498 being due within one year.
Yadkin Valley Bank
On February 13, 2012, Independence entered into a one year, $500,000 revolving credit facility with Yadkin Valley Bank with an interest rate based on the prime rate, with a floor of 4.5% per annum and a maximum of 16% per annum. For the year ended December 31, 2012, the weighted average interest rate on the facility was 4.5%, resulting in $11,350 of interest expense. The balance on the facility was $401,000 at December 31, 2012. The $401,000 of borrowings as of December 31, 2012, leaves the remaining borrowing capacity on the line of credit at $99,000.
The revolving credit facility expired February 13, 2013. We extended the $500,000 commercial line of credit agreement with Yadkin Valley Bank and Trust Company through May 13, 2013. The interest rate continues at 4.5% per annum.
Independence shall promptly notify Lender in writing of all threatened and actual litigation, governmental proceeding, default, and other material occurrences. We shall maintain adequate insurance coverage. Independence shall conform to any document requests, pay all taxes required by local, state, and federal agencies, and agree to keep our existence in its current organizational form. We must comply with all laws affecting the environment. Independence must use the loan proceeds in its operations. We shall not draw, permit, or pay any more than is reasonable for services provided to us. Independence cannot incur debt, borrow money, or guarantee any loan or other obligation. We cannot lend any money or sell our accounts receivable nor
44
encumber or transfer any assets without lender’s permission. Independence cannot pay or declare a dividend or distribution on shares. Independence cannot borrow or make any loans, advances, or investments. Failure by Independence to perform or meet any term, covenant or condition under any obligation to Yadkin Valley Bank shall constitute an event of default.
We are in compliance with the financial covenants under our debt agreements or have received waivers for any defaults.
OFF-BALANCE SHEET ARRANGEMENTS
We do not have any off-balance-sheet arrangements, other than those currently disclosed that have or are reasonably likely to have a current or future effect on financial condition, changes in financial condition, revenues or expenses, results of operations, liquidity, capital expenditures or capital resources that is material to investors.
NEW ACCOUNTING PRONOUNCEMENTS
Our recently adopted and issued accounting pronouncements can be found in footnote 1 to the notes of our consolidated financial statements.
ITEM 7A. QUANTITATIVEAND QUALITATIVE DISCLOSURES ABOUT MARKET RISK.
We are subject to certain market risks, including commodity price risk (i.e., natural gas prices) and credit risk. The adverse effects of potential changes in these market risks are discussed below. The sensitivity analyses presented do not consider the effects that such adverse changes may have on overall economic activity nor do they consider additional actions management may take to mitigate our exposure to such changes. Actual results may differ.
COMMODITY PRICE RISK
We seek to protect our self against natural gas price fluctuations by limiting the aggregate level of net open positions that are exposed to market price changes. We manage such open positions with policies that are designed to limit the exposure to market risk, with regular reporting to management of potential financial exposure. Our risk management committee has limited the types of contracts we will consider to those related to physical natural gas deliveries. Therefore, management believes that although revenues and cost of sales are impacted by changes in natural gas prices, our margin is not significantly impacted by these changes.
CREDIT RISK
Credit risk relates to the risk of loss that we would incur as a result of non-performance by counterparties of their contractual obligations under the various instruments with us. Credit risk may be concentrated to the extent that one or more groups of counterparties have similar economic, industry or other characteristics that would cause their ability to meet contractual obligations to be similarly affected by changes in market or other conditions. In addition, credit risk includes not only the risk that a counter-party may default due to circumstances relating directly to it, but also the risk that a counterparty may default due to circumstances that relate to other market participants that have a direct or indirect relationship with such counterparty. We seek to mitigate credit risk by evaluating the financial strength of potential counterparties. However, despite mitigation efforts, defaults by counterparties may occur from time to time. To date, no such default has occurred.
ITEM 8. FINANCIAL STATEMENTSAND SUPPLEMENTARY DATA.
Our Consolidated Financial Statements begin on page F-1 of this Annual Report on Form 10-K.
ITEM 9. CHANGESINAND DISAGREEMENTS WITH ACCOUNTANTSON ACCOUNTINGAND FINANCIAL DISCLOSURE.
None.
45
ITEM 9A. CONTROLSAND PROCEDURES.
EVALUATIONOF DISCLOSURE CONTROLSAND PROCEDURES
As of December 31, 2012, we evaluated the effectiveness of the design and operation of our disclosure controls and procedures as defined in Rule 13a-15(e) of the Exchange Act. The evaluation was carried out under the supervision of and with the participation of our management, including our principal executive officer and principal financial officer. Based upon this evaluation, our chief executive officer and chief financial officer each concluded that our disclosure controls and procedures were effective as of December 31, 2012.
MANAGEMENT’S REPORTON INTERNAL CONTROLOVER FINANCIAL REPORTING
Management of Gas Natural Inc. is responsible for establishing and maintaining an adequate system of internal control over financial reporting as such term is defined in Exchange Act Rule 13a-15(f). Our internal control over financial reporting is designed to provide reasonable assurance regarding the reliability of financial reporting and the preparation of our consolidated financial statements for external purposes in accordance with U.S. generally accepted accounting principles defined in the Exchange Act.
Because of its inherent limitations, internal control over financial reporting may not prevent or detect misstatements and even when determined to be effective, can only provide reasonable assurance with respect to financial statement preparation and presentation. Also, projections of any evaluation of effectiveness to future periods are subject to the risk that controls may become inadequate because of changes in conditions, or that the degree of compliance with the policies or procedures may deteriorate.
We carried out an evaluation under the supervision and with the participation of our management, including our chief executive officer and chief financial officer, of the effectiveness of our internal control over financial reporting. In making this evaluation, management used the criteria set forth by the Committee of Sponsoring Organizations of the Treadway Commission for the “Internal Control – Integrated Framework.” Based on that evaluation, our management concluded that our internal control over financial reporting was effective as of December 31, 2012.
CHANGESIN INTERNAL CONTROLOVER FINANCIAL REPORTING
There were no changes in our internal control over financial reporting during the last fiscal quarter of calendar year 2012, that have materially affected, or are reasonably likely to materially affect, our internal control over financial reporting.
ATTESTATION REPORTOF INDEPENDENT REGISTERED PUBLIC ACCOUNTING FIRM
This Form 10-K does not include an attestation report of our registered public accounting firm regarding internal control over financial reporting. Management’s report is not subject to attestation by our registered public accounting firm pursuant to Section 989G of the Dodd-Frank Wall Street Reform and Consumer Protection Act of 2010.
ITEM 9B. OTHER INFORMATION.
None.
PART III
ITEM 10. DIRECTORS, EXECUTIVE OFFICERSAND CORPORATE GOVERNANCE.
Information required by this item is incorporated by reference to the material appearing under the headings “The Board of Directors,” “Executive Officers,” “Section 16(a) Beneficial Ownership Reporting Compliance,” “Code of Ethics,” and “Audit Committee Report” in the Proxy Statement for our 2013 Annual Meeting.
ITEM 11. EXECUTIVE COMPENSATION.
Information required by this item is incorporated by reference to the material appearing under the headings “Director Compensation” and “Executive Compensation,” in the Proxy Statement for our 2013 Annual Meeting.
46
ITEM 12. SECURITY OWNERSHIPOF CERTAIN BENEFICIAL OWNERSAND MANAGEMENTAND RELATED STOCKHOLDER MATTERS.
Information required by this item is incorporated by reference to the material appearing under the heading “Security Ownership of Principal Shareholders and Management,” and “Equity Compensation Plan Information” in the Proxy Statement for our 2013 Annual Meeting.
ITEM 13. CERTAIN RELATIONSHIPSAND RELATED TRANSACTIONS,AND DIRECTOR INDEPENDENCE.
Information required by this item is incorporated by reference to the material appearing under the heading “Certain Relationships and Related Transactions” and “Director Independence” in the Proxy Statement for our 2013 Annual Meeting.
ITEM 14. PRINCIPAL ACCOUNTING FEESAND SERVICES.
Information required by this item is incorporated by reference to the material appearing under the heading “Principal Accountant Firm Fees and Services” in the Proxy Statement for our 2013 Annual Meeting.
47
PART IV
ITEM 15. EXHIBITS, FINANCIAL STATEMENT SCHEDULES.
(a) FINANCIAL STATEMENTS
(b) EXHIBIT INDEX
| | |
| 1 | | Underwriting Agreement, dated June 27, 2012, by and among Richard M. Osborne, as Trustee of the Chowder Trust dated February 24, 2012, the Selling Shareholder named therein, and Janney Montgomery Scott LLC, as representative of the several underwriters named therein. Filed as, and incorporated herein by reference to, Exhibit 10.1 to the Registrant’s Current Report on Form 8-K, as filed with the Securities and Exchange Commission on June 27, 2012 |
| |
| 2.1 | | Agreement and Plan of Merger, dated June 29, 2009, by and among Energy West, Incorporated, Various Acquisition Subsidiaries, Lightning Pipeline Co., Inc., Great Plains Natural Gas Company, Brainard Gas Corp., Richard M. Osborne, Trustee, Rebecca Howell, Stephen G. Rigo, Marty Whelan and Thomas J. Smith. Filed as, and incorporated herein by reference to, Exhibit 10.2 to Registrant’s Current Report on Form 8-K, as filed with the Securities and Exchange Commission on July 2, 2009 |
| |
| 2.2 | | Agreement and Plan of Merger, dated June 29, 2009, by and among Energy West, Incorporated, an Acquisition Subsidiary, Great Plains Land Development Company, LTD. and Richard M. Osborne, Trustee. Filed as, and incorporated herein by reference to, Exhibit 10.3 to Registrant’s Current Report on Form 8-K, as filed with the Securities and Exchange Commission on July 2, 2009 |
| |
| 2.3 | | Agreement and Plan of Merger, dated August 3, 2009, by and among Energy Inc., Energy West, Incorporated and Energy West Merger Sub, Inc. Filed as, and incorporated herein by reference to, Exhibit 2.1 to Registrant’s Current Report on Form 8-K, as filed with the Securities and Exchange Commission on August 4, 2009 |
| |
| 2.4 | | Assignment and Assumption Agreement, dated December 30, 2009, by and between Energy West, Incorporated and Gas Natural Inc. Filed as, and incorporated herein by reference to, Exhibit 2.3 to the Registrant’s Current Report on Form 8-K, as filed with the Securities and Exchange Commission on January 11, 2010 |
| |
| 2.5 | | Assignment and Assumption Agreement, dated December 30, 2009, by and between Energy West, Incorporated and Gas Natural Inc. Filed as, and incorporated herein by reference to, Exhibit 2.4 to the Registrant’s Current Report on Form 8-K, as filed with the Securities and Exchange Commission on January 11, 2010 |
| |
| 2.6 | | First Amendment to Agreement and Plan of Merger, dated as of January 4, 2010, by and among Richard M. Osborne, Trustee, Rebecca Howell, Stephen G. Rigo, Marty Whelan and Thomas J. Smith, Lightning Pipeline Co., Inc., Great Plains Natural Gas Company, and Brainard Gas Corp., Lightning Pipeline Acquisition Inc., Great Plains Acquisition Inc. and Brainard Acquisition Inc. and Gas Natural Inc. Filed as, and incorporated herein by reference to, Exhibit 2.5 to the Registrant’s Current Report on Form 8-K, as filed with the Securities Exchange Commission on January 11, 2010 |
48
| | |
| 2.7 | | First Amendment to Agreement and Plan of Merger, dated as of January 4, 2010, by and among Richard M. Osborne, Trustee, Great Plains Land Development Company, LTD., GPL Acquisition LLC and Gas Natural Inc. Filed as, and incorporated herein by reference to, Exhibit 2.6 to the Registrant’s Current Report on Form 8-K, as filed with the Securities Exchange Commission on January 11, 2010 |
| |
| 3.1 | | Articles of Incorporation of Gas Natural Inc., dated July 15, 2010. Filed as, and incorporated herein by reference to, Exhibit 3.1 to the Registrant’s Form S-1/A, as filed with the Securities and Exchange Commission on July 15, 2010 |
| |
| 3.2 | | Code of Regulations of Gas Natural Inc., dated July 15, 2010. Filed as, and incorporated herein by reference to, Exhibit 3.2 to the Registrant’s Form S-1/A, as filed with the Securities and Exchange Commission on July 15, 2010 |
| |
| 10.1 | | Note Purchase Agreement, dated June 29, 2007, between Energy West, Incorporated and various Purchasers relating to 6.16% Senior Unsecured Notes due June 29, 2017. Filed as, and incorporated herein by reference to, Exhibit 10.4 to the Registrant’s Current Report on Form 8-K, as filed with the Securities and Exchange Commission on July 5, 2007 |
| |
| 10.2† | | Employee Stock Ownership Plan Trust Agreement. Filed as, and incorporated herein by reference to, Exhibit 10.2 to Registration Statement on Form S-1 (File No. 33-1672), as filed with the Securities and Exchange Commission on November 20, 2005 |
| |
| 10.3† | | Employment Agreement, dated August 25, 2006, between Gas Natural Inc. and Kevin J. Degenstein. Filed as, and incorporated herein by reference to, Exhibit 10.01 to the Registrant’s Current Report on Form 8-K, as filed with the Securities and Exchange Commission on September 22, 2006 |
| |
| 10.4† | | First Amendment to Employment Agreement, dated as of December 31, 2008, between Gas Natural Inc. and Kevin J. Degenstein. Filed as, and incorporated herein by reference to, Exhibit 10.39 to the Registrant’s Transition Report on Form 10-K/T for the transition period ended December 31, 2008, as filed with the Securities and Exchange Commission on March 31, 2009 |
| |
| 10.5† | | Employment Agreement, dated April 13, 2007, between Gas Natural Inc. and David C. Shipley. Filed as, and incorporated herein by reference to, Exhibit 10.40 to the Registrant’s Transition Report on Form 10-K/T for the transition period ended December 31, 2008, as filed with the Securities and Exchange Commission on March 31, 2009 |
| |
| 10.6† | | Gas Natural Inc. 2012 Incentive and Equity Award Plan. Filed as, and incorporated herein by reference to, Annex B to the Registrant’s Proxy Statement on Schedule 14A, as filed with the Securities and Exchange Commission on November 19, 2012 |
| |
| 10.7† | | Gas Natural Inc. 2012 Non-Employee Director Stock Award Plan. Filed as, and incorporated herein by reference to, Annex C to the Registrant’s Proxy Statement on Schedule 14A, as filed with the Securities and Exchange Commission on November 19, 2012 |
| |
| 10.8 | | Lease Agreement, dated February 25, 2008, between OsAir, Inc. and Energy West, Incorporated. Filed as, and incorporated herein by reference to, Exhibit 10.1 to the Registrant’s Current Report on Form 8-K, as filed with the Securities and Exchange Commission on February 29, 2008 |
| |
| 10.9 | | Natural Gas Transportation Service Agreement, dated as of July 1, 2008, between Orwell-Trumbull Pipeline Co., LLC, Orwell Natural Gas Company and Brainard Gas Corp. Filed as, and incorporated herein by reference to, Exhibit 10.26 to the Registrant’s Annual Report on Form 10-K for the year ended June 30, 2008, as filed with the Securities and Exchange Commission on September 30, 2008 |
| |
| 10.10 | | Transportation Service Agreement, dated as of July 1, 2008, between Cobra Pipeline Co., Ltd., Northeast Ohio Natural Gas Company, Orwell Natural Gas Company and Brainard Gas Corp. Filed as, and incorporated herein by reference to, Exhibit 10.27 to the Registrant’s Annual Report on Form 10-K for the year ended June 30, 2008, as filed with the Securities and Exchange Commission on September 30, 2008 |
49
| | |
| 10.11 | | First Amendment to the Orwell-Trumbull Pipeline Co., LLC Operations Agreement, dated July 1, 2008, between Orwell Natural Gas Company and Orwell-Trumbull Pipeline Co., LLC. Filed as, and incorporated herein by reference to Exhibit 10.28 to the Registrant’s Annual Report on Form 10-K for the year ended June 30, 2008, as filed with the Securities and Exchange Commission on September 30, 2008 |
| |
| 10.12 | | Orwell-Trumbull Pipeline Co., LLC Operations Agreement, dated January 1, 2008, between Orwell Natural Gas Company and Orwell-Trumbull Pipeline Co., LLC. Filed as, and incorporated herein by reference to, Exhibit 10.29 to the Registrant’s Annual Report on Form 10-K for the year ended June 30, 2008, as filed with the Securities and Exchange Commission on September 30, 2008 |
| |
| 10.13 | | Triple Net Lease Agreement, dated as of July 1, 2008, between Station Street Partners, LLC and Orwell Natural Gas Company. Filed as, and incorporated herein by reference to, Exhibit 10.30 to the Registrant’s Annual Report on Form 10-K for the year ended June 30, 2008, as filed with the Securities and Exchange Commission on September 30, 2008 |
| |
| 10.14 | | Triple Net Lease Agreement, dated as of July 1, 2008, between Richard M. Osborne, Trustee and Orwell Natural Gas Company. Filed as, and incorporated herein by reference to, Exhibit 10.32 to the Registrant’s Annual Report on Form 10-K for the year ended June 30, 2008, as filed with the Securities and Exchange Commission on September 30, 2008 |
| |
| 10.15 | | Asset Management Agreement, dated January 3, 2010, by and between Orwell Natural Gas Company and John D. Oil and Gas Marketing Company, LLC. Filed as, and incorporated herein by reference to, Exhibit 10.1 to the Registrant’s Current Report on Form 8-K, as filed with the Securities and Exchange Commission on January 11, 2010 |
| |
| 10.16 | | Asset Management Agreement, dated January 3, 2010, by and between Northeast Ohio Natural Gas and John D. Oil and Gas Marketing Company, LLC. Filed as, and incorporated herein by reference to, Exhibit 10.2 to the Registrant’s Current Report on Form 8-K, as filed with the Securities and Exchange Commission on January 11, 2010 |
| |
| 10.17 | | Electronic Metering Service and Operation Agreement, dated April 15, 2009, by and between Orwell Trumbull Pipeline, LTD. and Orwell Natural Gas Co. Filed as, and incorporated herein by reference to, Exhibit 10.4 to Registrant’s Current Report on Form 8-K, as filed with the Securities and Exchange Commission on July 2, 2009 |
| |
| 10.18 | | Electronic Metering Service and Operation Agreement, dated April 15, 2009, by and between COBRA Pipeline Company, LTD. and Brainard Gas Corporation. Filed as, and incorporated herein by reference to, Exhibit 10.5 to Registrant’s Current Report on Form 8-K, as filed with the Securities and Exchange Commission on July 2, 2009 |
| |
| 10.19 | | Electronic Metering Service and Operation Agreement, dated April 15, 2009, by and between COBRA Pipeline Company, LTD. and Northeast Ohio Natural Gas Corporation. Filed as, and incorporated herein by reference to, Exhibit 10.6 to Registrant’s Current Report on Form 8-K, as filed with the Securities and Exchange Commission on July 2, 2009 |
| |
| 10.20 | | Electronic Metering Service and Operation Agreement, dated April 15, 2009, by and between COBRA Pipeline Company, LTD. and Orwell Natural Gas Co. Filed as, and incorporated herein by reference to, Exhibit 10.7 to Registrant’s Current Report on Form 8-K, as filed with the Securities and Exchange Commission on July 2, 2009 |
| |
| 10.21 | | Base Contract for Sale and Purchase of Natural Gas, dated February 23, 2011, between John D. Oil and Gas Marketing Company, LLC and Gas Natural Service Company, LLC. Filed as, and incorporated herein by reference to, Exhibit 10.52 to the Registrant’s Annual Report on Form 10-K for the year ended December 31, 2010, as filed with the Securities and Exchange Commission on April 4, 2011 |
50
| | |
| 10.22 | | Base Contract for Sale and Purchase of Natural Gas, dated February 23, 2011, between John D. Oil and Gas Marketing Company, LLC and Gas Natural Service Company, LLC. Filed as, and incorporated herein by reference to, Exhibit 10.54 to the Registrant’s Annual Report on Form 10-K for the year ended December 31, 2010, as filed with the Securities and Exchange Commission on April 4, 2011 |
| |
| 10.23 | | Intrastate Natural Gas Sales Contract, dated February 23, 2011, between Gas Natural Service Company, LLC and John D. Oil and Gas Marketing Company, LLC. Filed as, and incorporated herein by reference to, Exhibit 10.55 to the Registrant’s Annual Report on Form 10-K for the year ended December 31, 2010, as filed with the Securities and Exchange Commission on April 4, 2011 |
| |
| 10.24* | | Base Contract for Intrastate Sale and Purchase of Natural Gas, dated November 28, 2012, by and between John D. Oil and Gas Marketing Company, LLC and Gas Natural Service Company, LLC, as amended by the Intrastate Natural Gas Sales Contract between the same parties of even date therewith |
| |
| 10.25* | | Agency Agreement, dated November 28, 2012, by and between Gas Natural Service Company, LLC and John D. Oil and Gas Marketing Company, LLC |
| |
| 10.26 | | Brokerage Contract for Interstate Natural Gas Sales, dated February 23, 2011, between Gas Natural Service Company, LLC and John D. Oil and Gas Marketing Company, LLC. Filed as, and incorporated herein by reference to, Exhibit 10.53 to the Registrant’s Annual Report on Form 10-K for the year ended December 31, 2010, as filed with the Securities and Exchange Commission on April 4, 2011 |
| |
| 10.27* | | Brokerage Contract for Intrastate Gas Sales, dated November 28, 2012, by and between Gas Natural Service Company, LLC and John D. Oil & Gas Marketing Company, LLC |
| |
| 10.28* | | Base Contract for the Interstate Brokerage of Natural Gas, dated November 28, 2012, by and between Gas Natural Service Company, LLC and John D. Oil and Gas Marketing Company, as amended by the Brokerage Contract for Interstate Gas Sales between the same parties of even date therewith |
| |
| 10.29 | | Asset Management Agreement, dated February 24, 2011, between John D. Oil and Gas Marketing Company, LLC and Gas Natural Service Company. Filed as, and incorporated herein by reference to, Exhibit 10.56 to the Registrant’s Annual Report on Form 10-K for the year ended December 31, 2010, as filed with the Securities and Exchange Commission on April 4, 2011 |
| |
| 10.30 | | Asset Management Agreement, dated February 24, 2011, between John D. Oil and Gas Marketing Company, LLC and Gas Natural Service Company. Filed as, and incorporated herein by reference to, Exhibit 10.57 to the Registrant’s Annual Report on Form 10-K for the year ended December 31, 2010, as filed with the Securities and Exchange Commission on April 4, 2011 |
| |
| 10.31 | | Asset Management Agreement, dated February 24, 2011, between John D. Oil and Gas Marketing Company, LLC and Gas Natural Service Company. Filed as, and incorporated herein by reference to, Exhibit 10.58 to the Registrant’s Annual Report on Form 10-K for the year ended December 31, 2010, as filed with the Securities and Exchange Commission on April 4, 2011 |
| |
| 10.32 | | Appointment of Agent of Wholesale Propane Purchases, dated December 8, 2011, by and between Independence Oil & LP Gas, Inc. and John D. Oil and Gas Marketing Company, LLC. Filed as, and incorporated herein by reference to, Exhibit 10.1 to the Registrant’s Current Report on Form 8-K, as filed with the Securities and Exchange Commission on December 14, 2011 |
| |
| 10.33 | | Agreement of Purchase and Sale, dated December 8, 2011, by and between Black Bear Realty, Ltd. and Gas Natural Inc. Filed as, and incorporated herein by reference to, Exhibit 10.1 to the Registrant’s Current Report on Form 8-K, as filed with the Securities and Exchange Commission on December 21, 2011 |
| |
| 10.34 | | Base Contract for the Intrastate Sale and Purchase of Natural Gas, dated April 1, 2011, between Great Plains Exploration Ltd. and Gas Natural Service Company, LLC, as amended by the Intrastate Natural Gas Sales Contract between the same parties of even date therewith. Filed as, and incorporated herein by reference to, Exhibit 10.1 to the Registrant’s Current Report on Form 10-Q, as filed with the Securities and Exchange Commission on May 14, 2012 |
51
| | |
| 10.35* | | Base Contract for the Intrastate Sale and Purchase of Natural Gas, dated November 28, 2012, by and between Great Plains Exploration Ltd. and Gas Natural Service Company, LLC, as amended by the Intrastate Natural Gas Sales Contract between the same parties of even date therewith. |
| |
| 10.36 | | Base Contract for the Intrastate Sale and Purchase of Natural Gas, dated November 25, 2011, between OsAir, Inc., and Gas Natural Service Company, LLC, as amended by the Intrastate Natural Gas Sales Contract between the same parties of even date therewith. Filed as, and incorporated herein by reference to, Exhibit 10.2 to the Registrant’s Current Report on Form 10-Q, as filed with the Securities and Exchange Commission on May 14, 2012 |
| |
| 10.37* | | Base Contract for the Intrastate Sale and Purchase of Natural Gas, dated November 28, 2012, by and between OsAir, Inc. and Gas Natural Service Company, LLC, as amended by the Intrastate Natural Gas Sales Contract between the same parties of even date therewith. |
| |
| 10.38 | | Base Contract for the Intrastate Sale and Purchase of Natural Gas, dated November 25, 2011, between John D. Resources, LLC, and Gas Natural Service Company, LLC, as amended by the Intrastate Natural Gas Sales Contract between the same parties of even date therewith. Filed as, and incorporated herein by reference to, Exhibit 10.3 to the Registrant’s Current Report on Form 10-Q, as filed with the Securities and Exchange Commission on May 14, 2012 |
| |
| 10.39* | | Base Contract for the Intrastate Sale and Purchase of Natural Gas, dated November 28, 2012, by and between John D. Resources, LLC, and Gas Natural Service Company, LLC, as amended by the Intrastate Natural Gas Sales Contract between the same parties of even date therewith. |
| |
| 10.40 | | Base Contract for the Intrastate Sale and Purchase of Natural Gas, dated December 28, 2011, between Mentor Energy and Resources Company and Gas Natural Service Company, LLC, as amended by the Intrastate Natural Gas Sales Contract, dated December 28, 2011. Filed as, and incorporated herein by reference to, Exhibit 10.4 to the Registrant’s Current Report on Form 10-Q, as filed with the Securities and Exchange Commission on May 14, 2012 |
| |
| 10.41* | | Base Contract for the Intrastate Sale and Purchase of Natural Gas, dated November 28, 2012, by and between Mentor Energy and Resources Company and Gas Natural Services Company, LLC, as amended by the Intrastate Natural Gas Sales Contract between the same parties of even date therewith |
| |
| 10.42 | | Base Contract for Sale and Purchase of Natural Gas, dated November 25, 2011, between John D. Oil and Gas Company and Gas Natural Service Company, LLC, as amended by the Intrastate Natural Gas Sales Contract between the same parties of even date therewith. Filed as, and incorporated herein by reference to, Exhibit 10.5 to the Registrant’s Current Report on Form 10-Q, as filed with the Securities and Exchange Commission on May 14, 2012 |
| |
| 10.43 | | Reaffirmation and Second Amendment to Credit Facility, dated June 1, 2012, by and among Energy West, Incorporated and Bank of America, N.A. Filed as, and incorporated herein by reference to, Exhibit 10.1 to the Registrant’s Current Report on Form 8-K, as filed with the Securities and Exchange Commission on June 5, 2012 |
| |
| 10.44 | | Reaffirmation and Third Amendment to Credit Facility, dated August 22, 2012, by and among Energy West, Incorporated and Bank of America, N.A. Filed as, and incorporated herein by reference to, Exhibit 10.1 to the Registrant’s Current Report on Form 8-K, as filed with the Securities and Exchange Commission on August 28, 2012 |
| |
| 10.45 | | Amended and Restated Credit Agreement dated September 20, 2012, by and among Energy West, Incorporated and the Bank of America, N.A., as agent for various participating banks. Filed as, and incorporated herein by reference to, Exhibit 10.1 to the Registrant’s Current Report on Form 8-K, as filed with the Securities and Exchange Commission on September 26, 2012 |
52
| | |
| 10.46 | | Term Note dated September 20, 2012, in the original principal amount of $10.0 million, by and among Energy West, Incorporated and Bank of America, N.A., as agent for various participating banks. Filed as, and incorporated herein by reference to, Exhibit 10.2 to the Registrant’s Current Report on Form 8-K, as filed with the Securities and Exchange Commission on September 26, 2012 |
| |
| 10.47 | | Second Amended and Substitute Note dated September 20, 2012, regarding the $30.0 million Credit Facility, by and by and among Energy West, Incorporated and the Bank of America, N.A., as agent for various participating banks. Filed as, and incorporated herein by reference to, Exhibit 10.3 to the Registrant’s Current Report on Form 8-K, as filed with the Securities and Exchange Commission on September 26, 2012 |
| |
| 10.48 | | Continuing Guaranty dated September 20, 2012, by and among Penobscot Natural Gas Company, Bangor Gas Company, LLC, and Bank of America, N.A., as agent for various participant banks. Filed as, and incorporated herein by reference to, Exhibit 10.4(a) to the Registrant’s Current Report on Form 8-K, as filed with the Securities and Exchange Commission on September 26, 2012 |
| |
| 10.49 | | Continuing Guaranty dated September 20, 2012, by and among Energy West Montana Inc. and Bank of America N.A., as agent for various participant banks. Filed as, and incorporated herein by reference to, Exhibit 10.4(b) to the Registrant’s Current Report on Form 8-K, as filed with the Securities and Exchange Commission on September 26, 2012 |
| |
| 10.50 | | Continuing Guaranty dated September 20, 2012, by and among Frontier Utilities of North Carolina, Inc., Frontier Natural Gas Company, LLC and Bank of America N.A., as agent for various participant banks. Filed as, and incorporated herein by reference to, Exhibit 10.4(c) to the Registrant’s Current Report on Form 8-K, as filed with the Securities and Exchange Commission on September 26, 2012 |
| |
| 10.51 | | Continuing Guaranty dated September 20, 2012, by and among Energy West Properties, LLC, Energy West Development, Inc., Energy West Resources, Inc., and Energy West Propane, Inc, and Bank of America N.A., as agent for various participant banks. Filed as, and incorporated herein by reference to, Exhibit 10.4(d) to the Registrant’s Current Report on Form 8-K, as filed with the Securities and Exchange Commission on September 26, 2012 |
| |
| 10.52 | | Continuing Guaranty dated September 20, 2012, by and among Energy West Wyoming, Inc. and Bank of America N.A., as agent for various participant banks. Filed as, and incorporated herein by reference to, Exhibit 10.4(e) to the Registrant’s Current Report on Form 8-K, as filed with the Securities and Exchange Commission on September 26, 2012 |
| |
| 10.53 | | First Amendment and Joinder to Note Purchase Agreement, dated May 3, 2011, by and among Northeast Ohio Natural Gas Corp., Orwell Natural Gas Company, Brainard Gas Corp. and Great Plains Natural Gas Company, Lightning Pipeline Company, Inc., Spelman Pipeline Holdings, LLC, Kidron Pipeline, LLC, Gas Natural Service Company, LLC, Gas Natural Inc. and Sun Life Assurance Company of Canada. Filed as, and incorporated herein by reference to, Exhibit 10.3 to the Registrant’s Current Report on Form 8-K, as filed with the Securities and Exchange Commission on May 5, 2011 |
| |
| 10.54 | | First Amendment and Joinder to Note Purchase Agreement, dated May 3, 2011, by and among Great Plains Natural Gas Company and Lightning Pipeline Company, Inc., Spelman Pipeline Holdings LLC, Kidron Pipeline, LLC, Gas Natural Service Company, LLC and Gas Natural Inc. and Sun Life Assurance Company of Canada, as the purchaser. Filed as, and incorporated herein by reference to, Exhibit 10.4 to the Registrant’s Current Report on Form 8-K, as filed with the Securities and Exchange Commission on May 5, 2011 |
| |
| 10.55 | | Senior Secured Guaranteed Note Agreement, dated May 3, 2011, by and among Northeast Ohio Natural Gas Corp, Orwell Natural Gas Co., and Brainard Gas Corp. and Sun Life Assurance Company of Canada. Filed as, and incorporated herein by reference to, Exhibit 10.5 to the Registrant’s Current Report on Form 8-K, as filed with the Securities and Exchange Commission on May 5, 2011 |
53
| | |
| 10.56 | | Floating Rate Senior Secured Guaranteed Note Agreement, dated May 3, 2011, by and among Great Plains Natural Gas Company and Sun Life Assurance Company of Canada. Filed as, and incorporated herein by reference to, Exhibit 10.6 to the Registrant’s Current Report on Form 8-K, as filed with the Securities and Exchange Commission on May 5, 2011 |
| |
| 10.57 | | Security Agreement, dated May 3, 2011 by and among Northeast Ohio Natural Gas Corp., Orwell Natural Gas Company, Brainard Gas Corp., Great Plains Natural Gas Company, Lightning Pipeline Company Inc., Spelman Pipeline Holdings, Kidron Pipeline LLC, Gas Natural Service Company, LLC, Gas Natural Inc. and Sun Life Assurance Company of Canada. Filed as, and incorporated herein by reference to, Exhibit 10.7 to the Registrant’s Current Report on Form 8-K, as filed with the Securities and Exchange Commission on May 5, 2011 |
| |
| 10.58 | | Pledge Agreement, dated May 3, 2011, by and among Northeast Ohio Natural Gas Corp., Orwell Natural Gas Company, Brainard Gas Corp., Great Plains Natural Gas Company, Lightning Pipeline Inc., Spelman Pipeline Holdings, LLC, Kidron Pipeline LLC, Gas Natural Service Company, Gas Natural Inc. and Sun Life Assurance Company of Canada. Filed as, and incorporated herein by reference to, Exhibit 10.8 to the Registrant’s Current Report on Form 8-K, as filed with the Securities and Exchange Commission on May 5, 2011 |
| |
| 10.59 | | Mortgage, Security Agreement, Assignment of Leases and Rents and Fixture Filing Statement, dated May 3, 2011, by and among Northeast Ohio Natural Gas Corp., Orwell Natural Gas Company, Brainard Gas Corp., Great Plains Natural Gas Company, Lightning Pipeline, LLC, Gas Natural Service Company, LLC Gas Natural Inc. and Sun Life Assurance Company of Canada. Filed as, and incorporated herein by reference to, Exhibit 10.9 to the Registrant’s Current Report on Form 8-K, as filed with the Securities and Exchange Commission on May 5, 2011 |
| |
| 10.60 | | Second Amendment and Waiver to Note Purchase Agreement, dated April 9, 2012, by and among Northeast Ohio Natural Gas Corp., Orwell Natural Gas Company, Brainard Gas Corp., Great Plains Natural Gas Company, Lightning Pipeline Company, Inc., Spelman Pipeline Holdings LLC, Kidron Pipeline, LLC, Gas Natural Service Company, LLC, Gas Natural Inc. and Sun Life Assurance Company of Canada. Filed as, and incorporated herein by reference to, Exhibit 10.72 to the Registrant’s Annual Report on Form 10-K for the year ended December 31, 2011, as filed with the Securities and Exchange Commission on April 10, 2012 |
| |
| 10.61 | | Second Amendment and Waiver to Note Purchase Agreement, dated April 9, 2012, by and among Great Plains Natural Gas Company, Lightning Pipeline Company, Inc., Spelman Pipeline Holdings LLC, Kidron Pipeline, LLC, Gas Natural Service Company, LLC, Gas Natural Inc. and Sun Life Assurance Company of Canada. Filed as, and incorporated herein by reference to, Exhibit 10.73 to the Registrant’s Annual Report on Form 10-K for the year ended December 31, 2011, as filed with the Securities and Exchange Commission on April 10, 2012 |
| |
| 10.62 | | Omnibus Third Amendment, Supplement and Joinder to Note Purchase Agreement and Collateral Documents dated October 24, 2012, by and among Northeast Ohio Natural Gas Corp., Orwell Natural Gas Company, Brainard Gas Corp., Great Plains Natural Gas Company, Lightning Pipeline Company, Inc., Spelman Pipeline Holdings LLC, Kidron Pipeline, LLC, Gas Natural Service Company, LLC, Gas Natural Inc., Independence Oil, L.L.C., Independence Oil Real Estate 1, L.L.C., Independence Oil Real Estate 2, L.L.C., Independence Oil Real Estate 3, L.L.C., and Sun Life Assurance Company of Canada. Filed as, and incorporated herein by reference to, Exhibit 10.1 to the Registrant’s Current Report on Form 8-K, as filed with the Securities and Exchange Commission on October 30, 2012 |
| |
| 10.63 | | Senior Secured Guaranteed Note Agreement, dated October 24, 2012, by and among Northeast Ohio Natural Gas Corp, Orwell Natural Gas Co., and Brainard Gas Corp., and Sun Life Assurance Company of Canada. Filed as, and incorporated herein by reference to, Exhibit 10.2 to the Registrant’s Current Report on Form 8-K, as filed with the Securities and Exchange Commission on October 30, 2012 |
54
| | |
| 10.64 | | Joinder Agreement, dated October 24, 2012, by and among Independence Oil, L.L.C., Independence Oil Real Estate 1, L.L.C., Independence Oil Real Estate 2, L.L.C., Independence Oil Real Estate 3, L.L.C., and Sun Life Assurance Company of Canada. Filed as, and incorporated herein by reference to, Exhibit 10.3 to the Registrant’s Current Report on Form 8-K, as filed with the Securities and Exchange Commission on October 30, 2012 |
| |
| 10.65 | | Addendum to Pledge Agreement, dated October 24, 2012, by and among Independence Oil, L.L.C., Independence Oil Real Estate 1, L.L.C., Independence Oil Real Estate 2, L.L.C., Independence Oil Real Estate 3, L.L.C., and Sun Life Assurance Company of Canada. Filed as, and incorporated herein by reference to, Exhibit 10.4 to the Registrant’s Current Report on Form 8-K, as filed with the Securities and Exchange Commission on October 30, 2012 |
| |
| 10.66 | | Addendum to Security Agreement, dated October 24, 2012, by and among Independence Oil, L.L.C., Independence Oil Real Estate 1, L.L.C., Independence Oil Real Estate 2, L.L.C., Independence Oil Real Estate 3, L.L.C., and Sun Life Assurance Company of Canada. Filed as, and incorporated herein by reference to, Exhibit 10.5 to the Registrant’s Current Report on Form 8-K, as filed with the Securities and Exchange Commission on October 30, 2012 |
| |
| 10.67 | | Asset Purchase Agreement, dated August 15, 2012, by and among Gas Natural Inc., Acquisition Subsidiary, John D. Oil and Gas Marketing Company, LLC, and Richard M. Osborne, Trustee. Filed as, and incorporated herein by reference to, Exhibit 10.1 to the Registrant’s Current Report on Form 8-K, as filed with the Securities and Exchange Commission on August 20, 2012 |
| |
| 10.68 | | Purchase Agreement dated December 21, 2012, by and between McKay Real Estate Corporation, Matchworks, LLC and Nathan Properties, LLC by and through Mark E. Dottore, duly appointed Receiver in the United States District Court, Northern District of Ohio, Eastern Division, Case Number 1:11-CV-023464 and Gas Natural Inc. Filed as, and incorporated herein by reference to, Exhibit 10.1 |
| |
| 14 | | Code of Business Conduct. Filed as, and incorporated herein by reference to, Exhibit 14 to the Registrant’s Annual Report on Form 10-K for the year ended June 30, 2007, as filed with the Securities and Exchange Commission on September 27, 2007 |
| |
| 16 | | Letter from Hein & Associates LLP to the Securities and Exchange Commission, dated June 8, 2011. Filed as, and incorporated herein by reference to, Exhibit 16.1 to the Registrant’s Current Report on Form 8-K, as filed with the Securities and Exchange Commission on June 8, 2011 |
| |
| 21* | | List of Company Subsidiaries |
| |
| 23* | | Consent of Independent Registered Public Accounting Firm, ParenteBeard LLC |
| |
| 31* | | Certifications pursuant to SEC Release No. 33-8238, as adopted pursuant to Section 302 of the Sarbanes-Oxley Act of 2002 |
| |
| 32* | | Certifications pursuant to 18 U.S.C. Section 1350, as adopted pursuant to Section 906 of the Sarbanes-Oxley Act of 2002 |
| |
| 101.INS* | | XBRL Instance Document |
| |
| 101.SCH* | | XBRL Taxonomy Extension Schema |
| |
| 101.CAL* | | XBRL Taxonomy Extension Calculation Linkbase |
| |
| 101.LAB* | | XBRL Taxonomy Extension Label Linkbase |
| |
| 101.PRE* | | XBRL Taxonomy Extension Presentation Linkbase |
| |
| 101.DEF* | | XBRL Taxonomy Extension Definition Linkbase |
| † | Management contract or compensatory plan or arrangement |
55
SCHEDULE Condensed Financial Statements(c) FINANCIAL STATEMENT SCHEDULE
Schedule I
Gas Natural Inc. (Parent Company Only)
Condensed Financial Statements
As of and for the Years Ended December 31, 2012 and 2011
| | | | | | | | |
| | | 2012 | | | 2011 | |
BALANCE SHEETS | | | | | | | | |
ASSETS | | | | | | | | |
Current assets | | $ | 235,519 | | | $ | 3,852,807 | |
Investments | | | 75,417,951 | | | | 71,412,675 | |
Property, plant, & equipment, net | | | 611,575 | | | | - | |
Deferred tax asset, less current portion | | | 278,469 | | | | - | |
Restricted cash | | | 750,939 | | | | - | |
Other assets | | | - | | | | 7,245 | |
| | | | | | | | |
Total assets | | $ | 77,294,453 | | | $ | 75,272,727 | |
| | | | | | | | |
LIABILITIES AND CAPITALIZATION | | | | | | | | |
Current liabilities | | $ | 654,764 | | | $ | 410,115 | |
Intercompany payable, net | | | 295,565 | | | | 90,585 | |
Stockholders’ equity | | | 76,344,124 | | | | 74,772,027 | |
| | | | | | | | |
Total liabilities and capitalization | | $ | 77,294,453 | | | $ | 75,272,727 | |
| | | | | | | | |
STATEMENT OF COMPREHENSIVE INCOME | | | | | | | | |
Operating expenses | | $ | 250,045 | | | $ | 142,921 | |
| | | | | | | | |
Operating loss | | | (250,045) | | | | (142,921) | |
Other income (expense) | | | (804,775) | | | | (197,610) | |
Interest expense | | | - | | | | (726) | |
| | | | | | | | |
Income before income taxes and income from unconsolidated subsidiaries | | | (1,054,820) | | | | (341,257) | |
Income from unconsolidated subsidiaries | | | 4,377,406 | | | | 5,712,924 | |
Income tax benefit (expense) | | | 396,731 | | | | (2,150) | |
| | | | | | | | |
Net income | | $ | 3,719,317 | | | $ | 5,369,517 | |
Other comprehensive income, net of tax of $8,913, and ($20,107), respectively | | | (14,616) | | | | 33,815 | |
| | | | | | | | |
Comprehensive income | | $ | 3,704,701 | | | $ | 5,403,332 | |
| | | | | | | | |
56
Gas Natural Inc. (Parent Company Only)
Condensed Financial Statements, continued
For the Years Ended December 31, 2012 and 2011
| | | | | | | | |
| | | 2012 | | | 2011 | |
STATEMENTS OF CASH FLOWS | | | | | | | | |
Net income | | $ | 3,719,317 | | | $ | 5,369,517 | |
CASH FLOWS FROM OPERATING ACTIVITIES | | | | | | | | |
Income from unconsolidated subsidiaries | | | (4,377,406) | | | | (5,712,924) | |
Depreciation expense | | | 3,931 | | | | - | |
Stock based compensation | | | 60,009 | | | | 69,407 | |
Deferred income taxes | | | (256,291) | | | | (22,028) | |
Other assets | | | 7,245 | | | | 389,934 | |
Other liabilities | | | 432,430 | | | | 87,544 | |
| | | | | | | | |
Net cash (used in) provided by operating activities | | | (410,765) | | | | 181,450 | |
CASH FLOWS FROM INVESTING ACTIVITIES | | | | | | | | |
Capital expenditures | | | (615,506) | | | | - | |
Purchase of marketable securities | | | - | | | | (39,004) | |
Repayment of intercompany loans | | | - | | | | 10,823,412 | |
Investment in subsidiaries | | | (1,887,288) | | | | (16,221,291) | |
Dividends received from subsidiaries | | | 4,485,892 | | | | 6,730,705 | |
| | | | | | | | |
Net cash provided by investing activities | | | 1,983,098 | | | | 1,293,822 | |
CASH FLOWS FROM FINANCING ACTIVITIES | | | | | | | | |
Restricted cash – debt service | | | (750,939) | | | | - | |
Dividends paid | | | (4,432,920) | | | | (4,402,011) | |
| | | | | | | | |
Net cash used in financing activities | | | (5,183,859) | | | | (4,402,011) | |
| | | | | | | | |
Net decrease in cash and cash equivalents | | | (3,611,526) | | | | (2,926,739) | |
Cash and cash equivalents, beginning of period | | | 3,847,045 | | | | 6,773,784 | |
| | | | | | | | |
Cash and cash equivalents, end of period | | $ | 235,519 | | | $ | 3,847,045 | |
| | | | | | | | |
Basis of Presentation
Pursuant to rules and regulations of the SEC, the unconsolidated condensed financial statements of Gas Natural Inc. do not reflect all of the information and notes normally included with financial statements prepared in accordance with accounting principles generally accepted in the United States of America. Therefore, these condensed financial statements should be read in conjunction with the consolidated financial statements and related notes included in this Form 10-K.
Gas Natural Inc. has accounted for the earnings of its subsidiaries under the equity method in these unconsolidated condensed financial statements.
Common Dividends from Subsidiaries
Common stock cash dividends paid to Gas Natural Inc. by its subsidiaries were as follows:
| | | | | | | | |
| | | Years Ended December 31, | |
| | | 2012 | | | 2011 | |
Energy West, Inc. | | $ | 4,350,000 | | | $ | 5,100,000 | |
Great Plains Natural Gas Company | | | 98,759 | | | | 1,185,113 | |
Lightning Piepeline Company, Inc. | | | 37,133 | | | | 445,592 | |
| | | | | | | | |
Total | | $ | 4,485,892 | | | $ | 6,730,705 | |
| | | | | | | | |
57
Valuation and Qualifying AccountsSchedule II
Valuation and Qualifying
Accounts
Gas Natural Inc.
December 31, 2012
| | | | | | | | | | | | | | | | | | | | |
Description | | Balance at
Beginning of
Period | | | Balances
Acquired | | | Charged to
Costs and
Expenses | | | Write-Offs
Net of
Recoveries | | | Balance at
End
of Period | |
Allowance for bad debts | | | | | | | | | | | | | | | | | | | | |
Year Ended December 31, 2012 | | $ | 630,632 | | | $ | - | | | $ | 1,020,739 | | | $ | (261,609) | | | $ | 1,389,762 | |
Year Ended December 31, 2011 | | $ | 354,719 | | | $ | - | | | $ | 125,851 | | | $ | 150,062 | | | $ | 630,632 | |
All other schedules are omitted because they are not applicable or the required information is shown in the consolidated financial statements or notes thereto.
58
SIGNATURES
Pursuant to the requirements of Section 13 or 15 (d) of the Securities Exchange Act of 1934, the registrant has duly caused this report to be signed on its behalf by the undersigned, thereunto duly authorized.
|
| GAS NATURAL INC. |
|
| /s/ Richard M. Osborne |
Richard M. Osborne Chief Executive Officer (principal executive officer) |
Date: April 1, 2013
KNOW ALL THESE PERSONS BY THESE PRESENTS, that each person whose signature appears below constitutes and appoints Thomas J. Smith, his true and lawful attorney-in-fact and agents, with full power of substitution, for him in any and all capacities, to sign any and all amendments to this Report on Form 10-K, and to file the same, with exhibits thereto and other documents in connection therewith, with the Securities and Exchange Commission, hereby ratifying and confirming all that said attorney-in-fact or his substitute, may do or cause to be done by virtue hereof.
Pursuant to the requirements of the Securities Exchange Act of 1934, this report has been signed below by the following persons on behalf of the Registrant and in the capacities and on the dates indicated.
| | | | |
/s/ Richard M. Osborne Richard M. Osborne | | Chief Executive Officer (Principal Executive Officer) | | April 1, 2013 |
| | |
/s/ Thomas J. Smith Thomas J. Smith | | Chief Financial Officer (Principal Financial Officer and Principal Accounting Officer) | | April 1, 2013 |
| | |
/s/ W.E. Argo W.E. Argo | | Director | | April 1, 2013 |
| | |
/s/ Nicholas U. Fedeli Nicholas U. Fedeli | | Director | | April 1, 2013 |
| | |
/s/ John R. Male John R. Male | | Director | | April 1, 2013 |
| | |
/s/ Michael T. Victor Michael T. Victor | | Director | | April 1, 2013 |
| | |
/s/ Wade F. Brooksby Wade F. Brooksby | | Director | | April 1, 2013 |
| | |
/s/ Gregory J. Osborne Gregory J. Osborne | | Director | | April 1, 2013 |
59
CONSOLIDATED FINANCIAL STATEMENTSOF
GAS NATURAL INC.AND SUBSIDIARIES
TABLEOF CONTENTS
F-1
Report of Independent Registered Public Accounting Firm
Board of Directors and Stockholders
Gas Natural Inc.
We have audited the accompanying consolidated balance sheets of Gas Natural Inc. (the “Company”) as of December 31, 2012 and 2011, and the related consolidated statements of comprehensive income, changes in stockholders’ equity, and cash flows for the years then ended. In connection with our audits of the consolidated financial statements, we have also audited the financial statement schedules listed in the accompanying index as of and for the years ended December 31, 2012 and 2011. These consolidated financial statements and financial statement schedules are the responsibility of the Company’s management. Our responsibility is to express an opinion on the consolidated financial statements and financial statement schedules based on our audits.
We conducted our audits in accordance with the standards of the Public Company Accounting Oversight Board (United States). Those standards require that we plan and perform the audit to obtain reasonable assurance about whether the financial statements are free of material misstatement. The Company is not required to have, nor were we engaged to perform, an audit of its internal control over financial reporting. Our audits included consideration of internal control over financial reporting as a basis for designing audit procedures that are appropriate in the circumstances, but not for the purpose of expressing an opinion on the effectiveness of the Company’s internal control over financial reporting. Accordingly we express no such opinion. An audit also includes examining, on a test basis, evidence supporting the amounts and disclosures in the financial statements. An audit also includes assessing the accounting principles used and significant estimates made by management, as well as evaluating the overall financial statement presentation. We believe that our audits provide a reasonable basis for our opinion.
In our opinion, the consolidated financial statements referred to above present fairly, in all material respects, the financial position of Gas Natural Inc. as of December 31, 2012 and 2011, and the results of their operations and their cash flows for the years then ended in conformity with accounting principles generally accepted in the United States of America.
Also, in our opinion, the financial statement schedules as of and for the years ended December 31, 2012 and 2011, when considered in relation to the basic consolidated financial statements taken as a whole, present fairly, in all material respects, the information set forth therein.
/s/ ParenteBeard LLC
Pittsburgh, Pennsylvania
April 1, 2013
F-2
Gas Natural Inc. and Subsidiaries
Consolidated Balance Sheet
December 31, 2012 and December 31, 2011
| | | | | | | | |
| | | December 31,
2012 | | | December 31,
2011 | |
| ASSETS | | | | | | | | |
CURRENT ASSETS | | | | | | | | |
Cash and cash equivalents | | $ | 3,435,117 | | | $ | 10,504,845 | |
Marketable securities | | | 344,346 | | | | 367,875 | |
Accounts receivable | | | | | | | | |
Trade, less allowance for doubtful accounts of $1,389,762 and $630,632, respectively | | | 12,033,057 | | | | 9,381,625 | |
Related parties | | | 522,557 | | | | 519,084 | |
Unbilled gas | | | 4,612,258 | | | | 4,232,854 | |
Note receivable - related parties, current portion | | | 10,998 | | | | 10,256 | |
Inventory | | | | | | | | |
Natural gas and propane | | | 5,092,240 | | | | 6,967,739 | |
Materials and supplies | | | 1,835,816 | | | | 1,958,858 | |
Prepaid income taxes | | | 498,297 | | | | 1,584,869 | |
Prepayments and other | | | 2,224,267 | | | | 741,101 | |
Recoverable cost of gas purchases | | | 2,329,524 | | | | 2,627,416 | |
Deferred tax asset | | | 828,730 | | | | 1,061,314 | |
| | | | | | | | |
Total current assets | | | 33,767,207 | | | | 39,957,836 | |
| | |
PROPERTY, PLANT AND EQUIPMENT | | | | | | | | |
Gas transmission and distribution facilities | | | 125,067,279 | | | | 100,492,234 | |
Land | | | 3,530,639 | | | | 2,600,023 | |
Buildings and leasehold improvements | | | 9,029,773 | | | | 4,966,511 | |
Transportation equipment | | | 3,311,769 | | | | 2,968,405 | |
Computer equipment | | | 3,589,035 | | | | 3,501,492 | |
Other equipment | | | 8,751,626 | | | | 8,302,395 | |
Construction work-in-progress | | | 8,470,638 | | | | 12,003,916 | |
Producing natural gas properties | | | 3,911,404 | | | | 3,911,404 | |
| | | | | | | | |
Property, plant and equipment | | | 165,662,163 | | | | 138,746,380 | |
Less accumulated depreciation, depletion and amortization | | | (47,034,673) | | | | (41,134,123) | |
| | | | | | | | |
PROPERTY, PLANT AND EQUIPMENT, net | | | 118,627,490 | | | | 97,612,257 | |
| | |
OTHER ASSETS | | | | | | | | |
Notes receivable - related parties, less current portion | | | 24,411 | | | | 35,408 | |
Regulatory assets | | | | | | | | |
Property taxes | | | 307,732 | | | | 590,464 | |
Income taxes | | | 452,645 | | | | 452,645 | |
Rate case costs | | | 176,250 | | | | 205,714 | |
Debt issuance costs, net | | | 1,798,720 | | | | 869,593 | |
Goodwill | | | 14,891,377 | | | | 14,607,952 | |
Customer relationships | | | 616,500 | | | | 639,333 | |
Investment in unconsolidated affiliate | | | 321,731 | | | | 330,351 | |
Restricted cash | | | 3,150,847 | | | | 949,907 | |
Other assets | | | 328,549 | | | | 159,954 | |
| | | | | | | | |
Total other assets | | | 22,068,762 | | | | 18,841,321 | |
| | | | | | | | |
| | |
TOTAL ASSETS | | $ | 174,463,459 | | | $ | 156,411,414 | |
| | | | | | | | |
The accompanying notes are an integral part of these consolidated financial statements.
F-3
Gas Natural Inc. and Subsidiaries
Consolidated Balance Sheet
December 31, 2012 and December 31, 2011
| | | | | | | | |
| | | December 31,
2012 | | | December 31,
2011 | |
| LIABILITIES AND CAPITALIZATION | | | | | | | | |
CURRENT LIABILITIES | | | | | | | | |
Checks in excess of amounts on deposit | | $ | 720,340 | | | $ | 1,027,376 | |
Lines of credit | | | 24,260,755 | | | | 23,160,000 | |
Accounts payable | | | | | | | | |
Trade | | | 9,201,722 | | | | 8,755,623 | |
Related parties | | | 51,797 | | | | 191,763 | |
Notes payable, current portion | | | 633,498 | | | | 7,885 | |
Accrued liabilities | | | | | | | | |
Taxes other than income | | | 2,548,717 | | | | 3,018,964 | |
Vacation | | | 115,956 | | | | 115,940 | |
Employee benefit plans | | | 145,959 | | | | 140,149 | |
Interest | | | 191,263 | | | | 30,688 | |
Deferred payments received from levelized billing | | | 2,822,926 | | | | 2,948,188 | |
Customer deposits | | | 744,974 | | | | 707,062 | |
Property tax settlement, current portion | | | - | | | | 242,128 | |
Related parties | | | 595,240 | | | | 635,192 | |
Obligation under capital lease - current | | | 167,518 | | | | - | |
Other current liabilities | | | 729,550 | | | | 1,280,670 | |
Over-recovered gas purchases | | | 1,185,034 | | | | 2,237,827 | |
| | | | | | | | |
Total current liabilities | | | 44,115,249 | | | | 44,499,455 | |
| | |
LONG-TERM LIABILITIES | | | | | | | | |
Deferred investment tax credits | | | 155,317 | | | | 176,379 | |
Deferred tax liability | | | 5,144,002 | | | | 2,908,167 | |
Asset retirement obligation | | | 1,850,379 | | | | 1,689,081 | |
Customer advances for construction | | | 1,009,232 | | | | 880,851 | |
Regulatory liability for income taxes | | | 83,161 | | | | 83,161 | |
Regulatory liability for gas costs | | | 20,745 | | | | 57,570 | |
Long-term obligation under capital lease, less current portion | | | 2,040,508 | | | | - | |
| | | | | | | | |
Total long-term liabilities | | | 10,303,344 | | | | 5,795,209 | |
| | |
NOTES PAYABLE, less current portion | | | 43,700,742 | | | | 31,344,723 | |
| | |
COMMITMENTS AND CONTINGENCIES (see Note 12) | | | | | | | | |
| | |
STOCKHOLDERS’ EQUITY | | | | | | | | |
Preferred stock; $0.15 par value, 1,500,000 shares authorized, no shares issued or outstanding | | | - | | | | - | |
Common stock; $0.15 par value, 15,000,000 shares authorized, 8,369,752 and 8,154,301 shares issued and outstanding, respectively | | | 1,255,463 | | | | 1,223,145 | |
Capital in excess of par value | | | 44,256,493 | | | | 41,978,799 | |
Accumulated other comprehensive income | | | 65,789 | | | | 80,405 | |
Retained earnings | | | 30,766,379 | | | | 31,489,678 | |
| | | | | | | | |
Total stockholders’ equity | | | 76,344,124 | | | | 74,772,027 | |
| | | | | | | | |
| | |
TOTAL CAPITALIZATION | | | 120,044,866 | | | | 106,116,750 | |
| | | | | | | | |
| | |
TOTAL LIABILITIES AND CAPITALIZATION | | $ | 174,463,459 | | | $ | 156,411,414 | |
| | | | | | | | |
The accompanying notes are an integral part of these consolidated financial statements.
F-4
Gas Natural Inc. and Subsidiaries
Consolidated Statement of Comprehensive Income
For the Years Ended December 31, 2012 and 2011
| | | | | | | | |
| | | 2012 | | | 2011 | |
REVENUES | | | | | | | | |
Natural gas operations | | $ | 81,305,951 | | | $ | 89,994,616 | |
Marketing and production | | | 7,493,361 | | | | 5,789,938 | |
Pipeline operations | | | 401,933 | | | | 417,768 | |
Propane operations | | | 4,614,915 | | | | 3,014,971 | |
| | | | | | | | |
Total revenues | | | 93,816,160 | | | | 99,217,293 | |
| | |
COST OF SALES | | | | | | | | |
Natural gas purchased | | | 42,485,803 | | | | 53,017,926 | |
Marketing and production | | | 5,953,156 | | | | 4,470,504 | |
Propane purchased | | | 3,346,591 | | | | 2,695,187 | |
| | | | | | | | |
Total cost of sales | | | 51,785,550 | | | | 60,183,617 | |
| | | | | | | | |
| | |
GROSS MARGIN | | | 42,030,610 | | | | 39,033,676 | |
| | |
OPERATING EXPENSES | | | | | | | | |
Distribution, general, and administrative | | | 22,130,693 | | | | 19,610,054 | |
Maintenance | | | 1,258,631 | | | | 1,122,448 | |
Depreciation and amortization | | | 5,326,732 | | | | 4,464,881 | |
Accretion | | | 161,298 | | | | 142,214 | |
Taxes other than income | | | 3,551,872 | | | | 3,451,860 | |
| | | | | | | | |
Total operating expenses | | | 32,429,226 | | | | 28,791,457 | |
| | | | | | | | |
| | |
OPERATING INCOME | | | 9,601,384 | | | | 10,242,219 | |
| | |
LOSS FROM UNCONSOLIDATED AFFILIATE | | | (8,620) | | | | (877,465) | |
OTHER INCOME, net | | | 440,493 | | | | 419,983 | |
GAIN ON BARGAIN PURCHASE | | | - | | | | 955,423 | |
ACQUISITION EXPENSE | | | (959,267) | | | | (88,450) | |
STOCK SALE EXPENSE | | | (274,213) | | | | (106,595) | |
INTEREST EXPENSE | | | (2,723,335) | | | | (2,033,603) | |
| | | | | | | | |
| | |
INCOME BEFORE INCOME TAXES | | | 6,076,442 | | | | 8,511,512 | |
| | |
INCOME TAX EXPENSE | | | (2,357,125) | | | | (3,141,995) | |
| | | | | | | | |
| | |
NET INCOME | | | 3,719,317 | | | | 5,369,517 | |
| | |
EARNINGS PER SHARE - BASIC AND DILUTED | | $ | 0.46 | | | $ | 0.66 | |
| | |
WEIGHTED AVERAGE DIVIDENDS DECLARED PER COMMON SHARE | | $ | 0.54 | | | $ | 0.54 | |
| | |
WEIGHTED AVERAGE SHARES OUTSTANDING - BASIC | | | 8,163,814 | | | | 8,151,935 | |
| | |
WEIGHTED AVERAGE SHARES OUTSTANDING - DILUTED | | | 8,169,679 | | | | 8,159,827 | |
| | |
OTHER COMPREHENSIVE INCOME, NET OF TAX OF $8,913 and ($20,490), respectively | | | | | | | | |
Unrealized gain (loss) on available for sale securities | | | (14,616) | | | | 33,815 | |
| | | | | | | | |
| | |
COMPREHENSIVE INCOME | | $ | 3,704,701 | | | $ | 5,403,332 | |
| | | | | | | | |
The accompanying notes are an integral part of these consolidated financial statements.
F-5
Gas Natural Inc. and Subsidiaries
Consolidated Statement of Changes in Stockholders’ Equity
For the Years Ended December 31, 2012 and 2011
| | | | | | | | | | | | | | | | | | | | | | | | |
| | | Common
Shares | | | Common
Stock | | | Capital In
Excess Of Par
Value | | | Accumulated
Other
Comprehensive
Income | | | Retained
Earnings | | | Total | |
BALANCE AT DECEMBER 31, 2010 | | | 8,149,801 | | | $ | 1,222,470 | | | $ | 41,910,067 | | | $ | 46,590 | | | $ | 30,522,375 | | | $ | 73,701,502 | |
| | | | | | |
Net income | | | - | | | | - | | | | - | | | | - | | | | 5,369,517 | | | | 5,369,517 | |
Other Comprehensive Income | | | | | | | | | | | | | | | 33,815 | | | | | | | | 33,815 | |
Stock issued for services | | | 4,500 | | | | 675 | | | | 49,545 | | | | - | | | | - | | | | 50,220 | |
Stock option expense | | | - | | | | - | | | | 19,187 | | | | - | | | | - | | | | 19,187 | |
Dividends declared | | | - | | | | - | | | | - | | | | - | | | | (4,402,214) | | | | (4,402,214) | |
| | | | | | | | | | | | | | | | | | | | | | | | |
| | | | | | |
BALANCE AT DECEMBER 31, 2011 | | | 8,154,301 | | | $ | 1,223,145 | | | $ | 41,978,799 | | | $ | 80,405 | | | $ | 31,489,678 | | | $ | 74,772,027 | |
| | | | | | | | | | | | | | | | | | | | | | | | |
| | | | | | |
BALANCE AT DECEMBER 31, 2011 | | | 8,154,301 | | | $ | 1,223,145 | | | $ | 41,978,799 | | | $ | 80,405 | | | $ | 31,489,678 | | | $ | 74,772,027 | |
| | | | | | |
Net income | | | - | | | | - | | | | - | | | | - | | | | 3,719,317 | | | | 3,719,317 | |
Other Comprehensive Loss | | | | | | | | | | | | | | | (14,616) | | | | | | | | (14,616) | |
Stock issued for services | | | 4,500 | | | | 675 | | | | 49,927 | | | | - | | | | - | | | | 50,602 | |
Stock option expense | | | - | | | | - | | | | 9,406 | | | | - | | | | - | | | | 9,406 | |
Purchase of Loring Pipeline | | | 210,951 | | | | 31,643 | | | | 2,218,361 | | | | - | | | | - | | | | 2,250,004 | |
Dividends declared | | | - | | | | - | | | | - | | | | - | | | | (4,442,616) | | | | (4,442,616) | |
| | | | | | | | | | | | | | | | | | | | | | | | |
| | | | | | |
BALANCE AT DECEMBER 31, 2012 | | | 8,369,752 | | | $ | 1,255,463 | | | $ | 44,256,493 | | | $ | 65,789 | | | $ | 30,766,379 | | | $ | 76,344,124 | |
| | | | | | | | | | | | | | | | | | | | | | | | |
The accompanying notes are an integral part of these consolidated financial statements.
F-6
Gas Natural Inc. and Subsidiaries
Consolidated Statement of Cash Flows
For the Years Ended December 31, 2012 and 2011
| | | | | | | | |
| | | 2012 | | | 2011 | |
CASH FLOWS FROM OPERATING ACTIVITIES | | | | | | | | |
Net income | | $ | 3,719,317 | | | $ | 5,369,517 | |
Adjustments to reconcile net income to net cash provided by operating activities | | | | | | | | |
Depreciation and amortization | | | 5,326,732 | | | | 4,464,881 | |
Accretion | | | 161,298 | | | | 142,214 | |
Amortization of debt issuance costs | | | 275,858 | | | | 144,739 | |
Stock based compensation | | | 60,009 | | | | 69,407 | |
Loss on sale of assets | | | 56,026 | | | | 150,338 | |
Loss from unconsolidated affiliate | | | 8,620 | | | | 877,465 | |
Gain on bargain purchase | | | - | | | | (955,423) | |
Investment tax credit | | | (21,062) | | | | (21,062) | |
Deferred income taxes | | | 2,282,928 | | | | 3,745,373 | |
Changes in assets and liabilities | | | | | | | | |
Accounts receivable, including related parties | | | (2,585,772) | | | | 448,310 | |
Unbilled gas | | | (379,404) | | | | 1,491,492 | |
Natural gas and propane inventory | | | 1,875,499 | | | | (964,417) | |
Accounts payable, including related parties | | | 252,807 | | | | (1,259,006) | |
Recoverable/refundable cost of gas purchases | | | (834,814) | | | | 1,036,044 | |
Prepayments and other | | | (1,484,495) | | | | 171,858 | |
Other assets | | | 995,467 | | | | (644,075) | |
Other liabilities | | | (1,092,014) | | | | 628,649 | |
| | | | | | | | |
Net cash provided by operating activities | | | 8,617,000 | | | | 14,896,304 | |
CASH FLOWS FROM INVESTING ACTIVITIES | | | | | | | | |
Capital expenditures | | | (18,455,954) | | | | (23,205,518) | |
Proceeds from sale of fixed assets | | | 53,949 | | | | 43,058 | |
Purchase of marketable securities | | | - | | | | (39,004) | |
Proceeds from related party note receivable | | | 10,255 | | | | 9,566 | |
Purchase of Loring Pipeline | | | (2,250,000) | | | | - | |
Purchase of Independence Oil | | | - | | | | (1,400,656) | |
Purchase of Public Gas | | | (1,551,477) | | | | - | |
Cash acquired in acquisition | | | 502 | | | | - �� | |
Investment in unconsolidated affiliate | | | - | | | | (567,600) | |
Restricted cash - capital expenditures fund | | | (1,322,065) | | | | - | |
Customer advances for construction | | | 128,381 | | | | (68,583) | |
Contributions in aid of construction | | | 134,076 | | | | 217,277 | |
| | | | | | | | |
Net cash used in investing activities | | | (23,252,333) | | | | (25,011,460) | |
CASH FLOWS FROM FINANCING ACTIVITIES | | | | | | | | |
Proceeds from lines of credit | | | 51,791,754 | | | | 30,960,000 | |
Repayment on lines of credit | | | (50,690,999) | | | | (25,949,999) | |
Proceeds from notes payable | | | 12,989,552 | | | | 18,355,215 | |
Repayments of notes payable | | | (7,920) | | | | (9,872,140) | |
Repayment of related-party notes payable | | | - | | | | (49,361) | |
Debt issuance costs | | | (1,204,987) | | | | (498,381) | |
Restricted cash - debt service fund | | | (878,875) | | | | (949,907) | |
Dividends paid | | | (4,432,920) | | | | (4,402,011) | |
| | | | | | | | |
Net cash provided by financing activities | | | 7,565,605 | | | | 7,593,416 | |
| | | | | | | | |
NET DECREASE IN CASH AND CASH EQUIVALENTS | | | (7,069,728) | | | | (2,521,740) | |
CASH AND CASH EQUIVALENTS, BEGINNING OF PERIOD | | | 10,504,845 | | | | 13,026,585 | |
| | | | | | | | |
CASH AND CASH EQUIVALENTS, END OF PERIOD | | $ | 3,435,117 | | | $ | 10,504,845 | |
| | | | | | | | |
The accompanying notes are an integral part of these consolidated financial statements.
F-7
Gas Natural Inc. and Subsidiaries
Consolidated Statement of Cash Flows
For the Years Ended December 31, 2012 and 2011
| | | | | | | | |
| | | 2012 | | | 2011 | |
SUPPLEMENTAL DISCLOSURES OF CASH FLOW INFORMATION | | | | | | | | |
Cash paid for interest | | $ | 2,286,902 | | | $ | 1,942,448 | |
Cash refunded for income taxes, net | | | (989,503) | | | | (519,298) | |
| | |
SUPPLEMENTAL SCHEDULE OF NONCASH INVESTING AND | | | | | | | | |
FINANCING ACTIVITIES | | | | | | | | |
Shares issued to purchase Loring Pipeline | | $ | 2,250,004 | | | $ | - | |
Capital expenditures included in accounts payable | | | 745,402 | | | | 1,217,464 | |
Capitalized interest | | | 21,147 | | | | 12,778 | |
Accrued dividends | | | 376,639 | | | | 366,944 | |
The accompanying notes are an integral part of these consolidated financial statements.
F-8
GAS NATURAL INC. AND SUBSIDIARIES
NOTES TO CONSOLIDATED FINANCIAL STATEMENTS
Note 1 – Summary of Business and Significant Accounting Policies
Nature of Business
Gas Natural Inc. is the parent company of Brainard, Energy West, GNSC, Great Plains, Independence, Lightning Pipeline Company, and PGC. Brainard is a natural gas utility company with operations in Ohio. Energy West is the parent company of multiple entities that are natural gas utility companies with regulated operations in Maine, Montana, North Carolina and Wyoming as well as non-regulated operations in Montana and Wyoming. GNSC manages gas procurement, transportation, and storage for Brainard and subsidiaries of Lightning Pipeline and Great Plains. Great Plains is the parent company of NEO, which is a regulated natural gas distribution company with operations in Ohio. Independence is a non-regulated subsidiary that delivers liquid propane, heating oil, and kerosene to customers in North Carolina and Virginia. Lightning Pipeline is the parent company of Orwell, which is a regulated natural gas distribution company with operations in Ohio. Clarion River and Walker Gas are divisions of Orwell and are regulated natural gas distribution companies with operations in Pennsylvania. PGC is a regulated natural gas distribution company in Kentucky (together, the “Company”). The Company was originally incorporated in Montana in 1909. The Company currently has five reporting segments:
| | |
• Natural Gas Operations | | Annually distribute approximately 33 billion cubic feet of natural gas to approximately 69,000 customers through regulated utilities operating in Kentucky, Maine, Montana, North Carolina, Ohio, Pennsylvania and Wyoming. |
| |
• Marketing and Production Operations | | Annually market approximately 1.4 billion cubic feet of natural gas to commercial and industrial customers in Montana and Wyoming and manage midstream supply and production assets for transportation customers and utilities through the subsidiary, EWR. EWR owns an average 46% gross working interest (an average 39% net revenue interest) in 160 natural gas producing wells and gas gathering assets in Glacier and Toole Counties in Montana. |
| |
• Pipeline Operations | | The Shoshone interstate and Glacier gathering natural gas pipelines located in Montana and Wyoming are owned through the subsidiary, EWD. Certain natural gas producing wells owned by EWD are being managed and reported under the marketing and production operations. |
| |
• Propane Operations | | The operations were acquired in August 2011 and delivers liquid propane, heating oil and kerosene to approximately 3,400 residential, commercial and agricultural customers in North Carolina and Virginia through the subsidiary, Independence. |
| |
• Corporate and Other | | Corporate and other encompasses the results of corporate acquisitions and other equity transactions. Included in corporate and other are costs associated with business development and acquisitions, dividend income and recognized gains or losses from the sale of marketable securities. |
F-9
GAS NATURAL INC. AND SUBSIDIARIES
NOTES TO CONSOLIDATED FINANCIAL STATEMENTS
Basis of Presentation
The Company follows accounting standards set by the FASB. The FASB sets GAAP to ensure the consistent reporting of the Company’s financial condition, results of operations and cash flows. Over the years, the FASB and other designated GAAP-setting bodies, have issued standards in the form of FASB Statements, Interpretations, FASB Staff Positions, EITF consensuses, AICPA Statements of Position, etc. References to GAAP issued by the FASB in these footnotes are to theFASB Accounting Standards Codification, sometimes referred to as the Codification or ASC.
Principles of Consolidation
The consolidated financial statements of Gas Natural Inc. and all of its wholly-owned subsidiaries also include the proportionate share of assets, liabilities, revenues, and expenses of certain producing natural gas properties. All intercompany transactions and accounts have been eliminated.
Effects of Regulation
The Company follows the provisions of ASC 980, Regulated Operations, and the accompanying financial statements reflect the effects of the different rate-making principles followed by the various jurisdictions regulating the Company. The economic effects of regulation can result in regulated companies recording costs that have been, or are expected to be, allowed in the rate-making process in a period different from the period in which the costs would be charged to expense by an unregulated enterprise. When this occurs, costs are deferred as assets in the balance sheet (regulatory assets) and recorded as expenses in the periods when those same amounts are reflected in rates. Additionally, regulators can impose liabilities upon a regulated company for amounts previously collected from customers and for amounts that are expected to be refunded to customers which are recorded as liabilities in the balance sheet (regulatory liabilities).
Use of Estimates
The preparation of financial statements in conformity with accounting principles generally accepted in the United States of America requires management to make estimates and assumptions that affect the reported amounts of assets and liabilities, the disclosure of contingent assets and liabilities at the date of the financial statements, and the reported amounts of revenues and expenses during the reporting period. Actual results could differ from these estimates.
The Company has used estimates in measuring certain deferred charges and deferred credits related to items subject to approval of the various public service commissions with jurisdiction over the Company. Estimates are also used in development of the allowances for doubtful accounts, unbilled gas, asset retirement obligations, and determination of depreciable lives of utility plant. The deferred tax asset and valuation allowance require a significant amount of judgment and are significant estimates. The estimates are based on projected future tax deductions, future taxable income, estimated limitations under the Internal Revenue Code, and other assumptions.
The Company makes acquisitions which involve combining the assets and liabilities of the acquired company with our Company. The assets and liabilities acquired are reported at their fair value at the date of acquisition. Measuring this fair value may require the use of estimates.
Such estimates could change in the near term and could significantly impact the Company’s results of operations and financial position.
F-10
GAS NATURAL INC. AND SUBSIDIARIES
NOTES TO CONSOLIDATED FINANCIAL STATEMENTS
Cash and Cash Equivalents
The Company considers all highly liquid investments with original maturities of three months or less, at the date of acquisition, to be cash equivalents. The Company maintains, at various financial institutions, cash and cash equivalents which may exceed federally insurable limits and which may, at times, significantly exceed balance sheet amounts.
Receivables
The accounts receivable are generated from sales and delivery of natural gas and propane as measured by inputs from meter reading devices. Trade accounts receivable are carried at the expected net realizable value. There is credit risk associated with the collection of these receivables. As such, a provision is recorded for the receivables considered to be uncollectible. The provision is based on management’s assessment of the collectability of specific customer accounts, the aging of the accounts receivable and historical write-off amounts. The underlying assumptions used for the provision can change from period to period and the provision could potentially cause a negative material impact to the income statement and working capital. Included in the accounts receivable, trade line item on the accompanying consolidated balance sheet are $1,139,778 and $370,118, net of allowance for doubtful accounts of $774,000 and $0 at December 31, 2012 and December 31, 2011, respectively for amounts due to the Company by a large industrial customer that is currently under Chapter 11 bankruptcy protection. All but $185,786 of the amounts were incurred after the customer’s petition for bankruptcy was filed and the Company believes it will ultimately receive payment as the customer emerges from bankruptcy protection.
Two of the Company’s utilities in Ohio, Orwell and NEO collect from their customers, through rates, an amount to provide an allowance for doubtful accounts. As accounts are identified as uncollectible, they are written off against this allowance for doubtful accounts with no income statement impact. In effect, all bad debt expense is funded by the customer base. The total amount collected from customers and the amounts written off are reviewed annually by the PUCO and the rate per Mcf is adjusted as necessary.
The Company’s bad debt expense for the year ended December 31, 2012 and 2011 was $1,020,739 and $125,851, respectively. Within these balances, $0 and $98,037 was due to related party bad debt for December 31, 2012 and 2011, respectively.
Natural Gas and Propane Inventory
Natural gas inventory is stated at the lower of weighted average cost or net realizable value except for Energy West Montana – Great Falls, which is stated at the rate approved by the MPSC, which includes transportation and storage costs.
Propane inventory is stated at the lower of cost or market value using the first-in, first-out method.
Recoverable/Refundable Costs of Gas Purchases
The Company accounts for purchased gas costs in accordance with procedures authorized by the utility commissions in the states in which it operates. Purchased gas costs that are different from those provided for in present rates, and approved by the respective commission, are accumulated and recovered or credited through future rate changes. The gas cost recoveries are monitored closely by the regulatory commissions in all of the states in which the Company operates and are subject to periodic audits or other review processes.
During the year ended December 31, 2010, the PUCO conducted audits of NEO and Orwell’s rates as filed from September 2007 through August 2009 and January 2008 through June 2010, respectively. The PUCO provided
F-11
GAS NATURAL INC. AND SUBSIDIARIES
NOTES TO CONSOLIDATED FINANCIAL STATEMENTS
the primary audit findings during the fourth quarter of 2010, taking the position that NEO had not included approximately $1,100,000 of costs and Orwell included an excess of approximately $1,050,000 of costs in the filings under audit. On October 26, 2011, the PUCO adopted and approved a Joint Stipulation that finalizes the adjustments for NEO and Orwell to approximately $1,100,000 and ($964,000), respectively. However, the Joint Stipulation modified the refund period for Orwell to one year as compared to two years as originally identified. The Company considered the modification to be material and sought rehearing. On December 22, 2011, the PUCO affirmed its Finding and Order requiring Orwell’s refund to be completed over twelve months. The collection and repayment of the under-recovery and over-recovery for NEO and Orwell began in February, 2012, respectively. These adjustments appeared on the accompanying consolidated balance sheet for 2012 and 2011 as part of “recoverable cost of gas purchases” and “over-recovered gas purchases.” The remaining balance in NEO’s recoverable cost of gas purchases for the audit adjustment is $707,002 and $1,100,000 at December 31, 2012 and 2011, respectively. The remaining balance in Orwell’s over-recovered gas purchases for the audit adjustment is $237,175 and $964,000 at December 31, 2012 and 2011, respectively.
During the year ended December 31, 2011, the PUCO conducted an audit of Brainard’s rates as filed from July 2009 through June 2011. The Staff of the Commission recommended a finding that Brainard collected excess gas costs of approximately $104,000.
The Company agreed that excess gas costs were collected, but only in the amount of approximately $48,000. An evidentiary hearing was convened on November 3, 2011, resumed on March 27, 2012 and concluded on April 12, 2012. On August 8, 2012 the PUCO issued its order requiring that Brainard refund approximately $104,000 with interest over twelve months. The Company filed an application for rehearing on September 26, 2012 which was denied by entry on rehearing issued on September 26, 2012. The Company initiated the refund commencing in October 2012. These adjustments appear on the accompanying consolidated balance sheet as part of “over-recovered gas purchases.” The remaining balance in the over-recovered gas purchases for the audit adjustment at December 31, 2012 was $99,479.
On January 23, 2012, the Commission directed the Commission Staff to examine the compliance of NEO and Orwell under the GCR mechanism. NEO’s audit covered the GCR mechanism from September 2009 through May 2012, and Orwell’s GCR mechanism covered July 2010 through June 2012. The PUCO issued a preliminary audit report. A hearing is scheduled for April 30, 2013. The audit report takes the position that NEO has a liability to their customers of $255,909 and Orwell has a liability to their customers of $251,081. We disagree with the audit results, and we are strongly contesting the examination. Therefore, since the filing was not a commission order, and there are uncertainties to the outcome of the hearing, no liability was recorded.
Property, Plant and Equipment
Property, plant and equipment are recorded at original cost when placed in service. Depreciation and amortization on assets are generally recorded on a straight-line basis over the estimated useful lives, as applicable, at various rates. These assets are depreciated and amortized over three to forty years.
EWR owns an interest in certain producing natural gas reserves on properties located in northern Montana. EWD also owns an interest in certain natural gas producing properties located in northern Montana. The Company is depleting these reserves using the units-of-production method. The production activities are being accounted for using the successful efforts method. The Company is not the operator of any of the natural gas producing wells on these properties and the Company is not regarded as having significant oil- and gas-producing activities as defined by ASC 932, Extractive Activities – Oil and Gas. Therefore, the disclosures defined in ASC 932 have been omitted.
F-12
GAS NATURAL INC. AND SUBSIDIARIES
NOTES TO CONSOLIDATED FINANCIAL STATEMENTS
Contributions in Aid of and Advances Received for Construction
Contributions in aid of construction are contributions received from customers for construction that are not refundable and are amortized over the life of the assets. Customer advances for construction includes advances received from customers for construction that are to be refunded wholly or in part.
Goodwill and Other Intangible Assets
Goodwill represents the excess of the purchase price over the fair value of identifiable net tangible and intangible assets acquired in a business combination. Goodwill is not amortized, rather, the goodwill is required to be tested for impairment annually, which is completed in the fourth quarter, or more frequently if events or changes in circumstances indicate that goodwill may be impaired.
The Company tests for goodwill impairment using a two step approach. A recoverability test at the reporting unit level must be performed during the first step. If the asset is not recoverable, the second step calculates the impairment loss, if any. During 2012 and 2011 the Company used only step one to test for goodwill impairment.
The goodwill amounts in the consolidated balance sheets at December 31, 2012 and 2011 relate to the acquisition of PGC on April 1, 2012, the acquisition of the Ohio and Pennsylvania subsidiaries on January 5, 2010 and the acquisition of Cut Bank Gas on November 2, 2009.
The schedule below describes the changes in carrying amount of goodwill for the years ended December 31:
| | | | | | | | |
| | | 2012 | | | 2011 | |
Balance, beginning of period | | $ | 14,607,952 | | | $ | 14,607,952 | |
Acquisition of Public Gas Company | | | 283,425 | | | | - | |
| | | | | | | | |
| | |
Balance, end of period | �� | $ | 14,891,377 | | | $ | 14,607,952 | |
| | | | | | | | |
When testing goodwill for impairment, portions of our identified reporting units are included in our natural gas operating segments. Goodwill is allocated to this segment based on the invested capital valuation approach. A weighted average of 40% is applied to an income approach, 40% to a market approach based on a public-traded company method, and 20% to a market approach based on a public company multiple of property, plant, and equipment method.
The schedule below represents goodwill allocated to each reporting unit as well as the excess of the fair value over the carrying value of goodwill as of December 31, 2012:
| | | | | | | | | | | | | | | | |
Reporting Unit | | Goodwill
($000s) | | | Fair Value
($000s) | | | Carrying Value
($000s) | | | % By Which Fair Value
Exceeds Carrying Value | |
Ohio Subsidiaries | | $ | 13,551 | | | $ | 52,770 | | | $ | 50,499 | | | | 4.30% | |
PGC | | $ | 283 | | | $ | 2,200 | | | $ | 1,447 | | | | 34.23% | |
Cut Bank | | $ | 1,057 | | | $ | 1,700 | | | $ | 675 | | | | 60.29% | |
There is a degree of uncertainty related to assumptions used to determine fair value. There are estimates and assumptions for organic growth, market equity risk, realized return on equity investments, market multiples, risk premium for size, weighted average cost of capital, capital structure, and tax rate. A critical assumption was made in PGC’s base rate of recovery. It is more likely than not that PGC’s rate will be accepted by the KPSC in our rate case, and the new rate was used which materially changed the rate of return. Weather can negatively impact our key assumptions and results.
F-13
GAS NATURAL INC. AND SUBSIDIARIES
NOTES TO CONSOLIDATED FINANCIAL STATEMENTS
The key assumptions made for each approach used in the impairment testing were (1) for the income approach method, the weighted average cost of capital was 6.9%, the tax rate was 34%, and the perpetuity growth rate of 2.4%, (2) for the market approach of public traded companies method, the market multiple average percentage used for net operating revenue was 2%, the market multiple average percentage used for gross profit was 4.9%, and the market multiple average percentage used for operating EBITDA was 8.7%; and (3) for the market approach of property, plant, and equipment method, the multiple average percentage used was 1.2%.
In calculating our growth rate for the income approach, we compared our growth in gross margin from 2008 to our projected 2013 gross margin, and adjusted the gross margin for average historical heat degree days over the same time period since 2008 was a very cold winter. This was a conservative approach, since 2012 was an exceptionally warm winter, and no adjustments were made for this outlier. 2008’s gross margin was decreased 4.47% to adjust for the average historical heat degree days. This adjustment resulted in an increase in gross margin from 2008 to 2013 of 3%. Therefore 3% was used as our assumption for growth in gross margin.
The Company’s impairment evaluations as of December 31, 2012 and 2011 did not indicate impairment of its goodwill, and therefore step two of the impairment testing process was not performed.
Regulatory Assets and Liabilities
The regulatory asset for property tax is recovered in rates over a ten-year period starting January 1, 2004. The income taxes earn a return equal to that of the Company’s rate base. The rate case costs do not earn a return. Regulatory assets will be recovered over a period of approximately three to twenty years. Regulatory liabilities will be refunded over a period of approximately five to twenty years.
Debt Issuance Costs
Debt issuance costs are fees and other direct incremental costs incurred by the Company in obtaining debt financing and are recognized as assets and are amortized as interest expense over the term of the related debt. The unamortized balance of debt issuance costs was $1,798,720 and $869,593 as of December 31, 2012 and 2011, respectively. Amortization expense was $275,858 and $144,739 for the years ended December 31, 2012 and 2011, respectively.
Investment in Unconsolidated Affiliate
EWR owns a 24.5% interest in Kykuit, a developer and operator of oil, gas and mineral leasehold estates located in Montana. We have invested a total of approximately $2.1 million in Kykuit and may invest additional funds in the future as Kykuit could provide a supply of natural gas in close proximity to our natural gas operations in Montana. However, our obligations to make additional investments in Kykuit are limited under our agreement with the other Kykuit investors. We are entitled to cease further investments in Kykuit if, in our reasonable discretion after the results of certain initial exploration activities are known. At December 31, 2012, we are obligated to invest no more than an additional $114,000 over the life of the venture. Other investors in Kykuit include our chairman and CEO, Richard M. Osborne, and John D. Oil and Gas Company, a publicly held gas exploration company, which is also the managing member of Kykuit. Additional investors include Thomas J. Smith, a director and our chief financial officer, and a director of John D. Oil and Gas Company, and Gregory J. Osborne, a director and employee and former president and director of John D. Oil and Gas Company.
The Company is accounting for the investment in Kykuit using the equity method. The total invested in Kykuit is approximately $2.1 million and $2.1 million, with a net investment after undistributed losses of approximately
F-14
GAS NATURAL INC. AND SUBSIDIARIES
NOTES TO CONSOLIDATED FINANCIAL STATEMENTS
$322,000 and $330,000 at December 31, 2012 and 2011, respectively. The loss on the equity investment in Kykuit for the years ended December 31, 2012 and 2011 include an impairment charge of approximately $2,000 and $790,000, respectively, due to the write-off of drilling costs related to dry holes.
Impairment of Long-Lived Assets
The Company evaluates its long-lived assets for impairment whenever events or changes in circumstances indicate that the carrying amount of such assets or intangibles may not be recoverable. Recoverability of assets to be held and used is measured by a comparison of the carrying amount of an asset to future undiscounted net cash flows expected to be generated by the asset. If such assets are considered to be impaired, the impairment to be recognized is measured by the amount by which the carrying amount of the assets exceeds the fair value of the assets. As of December 31, 2012 and 2011, management does not consider the value of any of its long-lived assets to be impaired, except for the items already disclosed.
Asset Retirement Obligations
The Company records the fair value of a liability for an asset retirement obligation (“ARO”) in the period in which it was incurred or acquired. The associated asset retirement costs are capitalized as part of the carrying amount of the long-lived asset. The increase in carrying value of a property associated with the capitalization of an asset retirement cost is included in “Property, plant and equipment, net” in the accompanying balance sheets. The Company amortizes the amount added to property, plant, and equipment, net. The accretion of the asset retirement liability is allocated to operating expense using a systematic and rational method. As of December 31, 2012 and 2011, the Company has recorded a net asset of $156,816 and $227,216, and a related liability of $1,850,379 and $1,689,081, respectively.
The Company, excluding Orwell and Brainard, has identified but not recognized ARO liabilities related to gas transmission and distribution assets resulting from easements over property not owned by the Company. These easements are generally perpetual and only require retirement action upon abandonment or cessation of use of the property for the specified purpose. The ARO liability is not estimable for such easements as the Company intends to utilize these properties indefinitely. In the event the Company decides to abandon or cease the use of a particular easement, an ARO liability would be recorded at that time.
As a result of regulatory action by the PUCO related to prior audits, Orwell and Brainard accrue an estimated liability for removing gas mains, meter and regulator station equipment and service lines at the end of their useful lives. The liability is equal to a percent of the asset cost according to the following table:
| | | | | | | | |
| | | Percent of Asset Cost | |
| | | Orwell | | | Brainard | |
Mains | | | 15% | | | | 20% | |
Meter/regulator stations | | | 10% | | | | 10% | |
Service lines | | | 75% | | | | 75% | |
The Company has no assets legally restricted for purposes of settling its asset retirement obligations. The schedule below is a reconciliation of the Company’s liability for the years ended December 31:
| | | | | | | | |
| | | 2012 | | | 2011 | |
Balance, beginning of period | | $ | 1,689,081 | | | $ | 1,546,867 | |
Liabilities incurred or acquired | | | - | | | | - | |
Accretion expense | | | 161,298 | | | | 142,214 | |
| | | | | | | | |
| | |
Balance, end of period | | $ | 1,850,379 | | | $ | 1,689,081 | |
| | | | | | | | |
F-15
GAS NATURAL INC. AND SUBSIDIARIES
NOTES TO CONSOLIDATED FINANCIAL STATEMENTS
Revenue Recognition
Revenues are recognized in the period that services are provided or products are delivered. The Company records gas distribution revenues for gas delivered to residential and commercial customers but not billed at the end of the accounting period. The Company periodically collects revenues subject to possible refunds pending final orders from regulatory agencies. When this occurs, appropriate liabilities for such revenues collected subject to refund are established.
Stock-Based Compensation
The Company accounts for stock-based compensation arrangements by recognizing compensation costs for all stock-based awards over the respective service period for employee services received in exchange for an award of equity or equity-based compensation. The compensation cost is based on the fair value of the award on the date it was granted.
Comprehensive Income
Comprehensive income includes net income and other comprehensive income (loss), which for the Company is primarily comprised of unrealized holding gains or losses on available-for-sale securities that are excluded from the statement of comprehensive income in computing net income and reported separately in shareholders’ equity. Comprehensive income and its components are as follows:
| | | | | | | | |
| | | Years Ended December 31, | |
| | | 2012 | | | 2011 | |
Net Income | | $ | 3,719,317 | | | $ | 5,369,517 | |
Other comprehensive income (loss): | | | | | | | | |
Change in unrealized gain/(loss) on available-for-sale securities,
net of tax | | | (14,616) | | | | 33,815 | |
| | | | | | | | |
| | |
Comprehensive Income | | $ | 3,704,701 | | | $ | 5,403,332 | |
| | | | | | | | |
Other comprehensive income (loss) for the years ended December 31, 2012 and 2011 is reported net of tax of $(8,913) and $20,490, respectively.
Earnings Per Share
Earnings per common share is computed by both the basic method, which uses the weighted average number of common shares outstanding, and the diluted method, which includes the dilutive common shares from stock options and other dilutive securities, as calculated using the treasury stock method.
| | | | | | | | |
| | | Years Ended December 31, | |
| | | 2012 | | | 2011 | |
Numerator: | | | | | | | | |
Net income | | $ | 3,719,317 | | | $ | 5,369,517 | |
| | | | | | | | |
| | |
Denominator: | | | | | | | | |
Basic weighted average common shares outstanding | | | 8,163,814 | | | | 8,151,935 | |
Dilutive effect of stock options | | | 5,865 | | | | 7,892 | |
| | | | | | | | |
| | |
Diluted weighted average common shares outstanding | | | 8,169,679 | | | | 8,159,827 | |
| | | | | | | | |
F-16
GAS NATURAL INC. AND SUBSIDIARIES
NOTES TO CONSOLIDATED FINANCIAL STATEMENTS
The Company excludes outstanding stock options with exercise prices that are greater than the average market price from the calculation of diluted earnings per share because their effect would be anti-dilutive. There were no instruments that were anti-dilutive for the years ended December 31, 2012 and 2011, respectively.
Income Taxes
The Company files its income tax returns on a consolidated basis. Rate-regulated operations record cumulative increases in deferred taxes as income taxes recoverable from customers. The Company uses the deferral method to account for investment tax credits as required by regulatory commissions. Deferred income taxes are determined using the asset and liability method, under which deferred tax assets and liabilities are measured based upon the temporary differences between the financial statement and income tax bases of assets and liabilities, using current tax rates.
Tax positions must meet a more-likely-than-not recognition threshold to be recognized. The Company has no unrecognized tax benefits that would have a material impact to the Company’s financial statements for any open tax years. No adjustments were recognized for uncertain tax positions for the years ended December 31, 2012 and 2011.
The Company recognizes interest and penalties related to unrecognized tax benefits in operating expense. As of December 31, 2012 and 2011, there were no unrecognized tax benefits nor interest or penalties accrued related to unrecognized tax benefits. For the years ended December 31, 2012 and 2011, the Company did not recognize interest or penalties.
The Company, or one or more of its subsidiaries, files income tax returns in the U.S. federal jurisdiction and various state jurisdictions. The tax years after 2008 for federal and state returns remain open to examination by the major taxing jurisdictions in which we operate.
Reclassifications
Certain reclassifications of prior year reported amounts have been made for comparative purposes. Such reclassifications are not considered material and had no effect on net income.
Recently Adopted Accounting Pronouncements
ASU No. 2011-04, “Amendments to Achieve Common Fair Value Measurements and Disclosure Requirements in US GAAP and IFRSs”
In May 2011, the FASB issued ASU 2011-04, which changes the wording used to describe many of the requirements in US GAAP for measuring fair value and for disclosing information about fair value measurements. This ASU was effective for interim and annual periods beginning after December 15, 2011, and early application was not permitted. The adoption of this ASU did not have a material impact on the accompanying financial statements.
ASU No. 2011-05, “Presentation of Comprehensive Income”
In June 2011, the FASB issued ASU 2011-05, which intended to improve the comparability, consistency, and transparency of financial reporting and to increase the prominence of items reported in other comprehensive income. To increase the prominence of items reported in other comprehensive income and to facilitate convergence of US GAAP and IFRS, the FASB eliminated the option to present components of other
F-17
GAS NATURAL INC. AND SUBSIDIARIES
NOTES TO CONSOLIDATED FINANCIAL STATEMENTS
comprehensive income as part of the statement of changes in stockholders’ equity. The ASU requires all non-owner changes in stockholders’ equity be presented either in a single continuous statement of comprehensive income or in two separate but consecutive statements. This ASU changes the presentation of other comprehensive income in the accompanying financial statements. However, this ASU does not change the calculation of the other comprehensive income. This ASU was effective for fiscal years, and interim periods within those years, beginning after December 15, 2011, and early adoption was permitted. The adoption of this guidance did not have a material impact on the accompanying financial statements.
ASU No. 2011-08, “Testing Goodwill for Impairment”
In September 2011, the FASB issued ASU 2011-08, which gives companies the option to first perform a qualitative assessment to determine whether it is more likely than not that the fair value of a reporting unit is less than its carrying amount before performing the two-step test mandated prior to this update. This ASU also provides companies with a revised list of examples of events and circumstances to consider, in their totality, to determine whether it is more likely than not that the fair value of a reporting unit is less than its carrying amount. If a company concludes that this is the case, it must perform the two-step test. Otherwise, a company may skip the two-step test. Companies are not required to perform the qualitative assessment and may instead proceed directly to the first step of the two-part test. This ASU was effective for fiscal years, and interim periods within those years, beginning after December 15, 2011; early adoption is permitted. The adoption of this guidance did not have a material impact on the accompanying financial statements, as we did not utilize the option to first perform a qualitative assessment to determine whether it is more likely than not that the fair value of a reporting unit is less than its carrying amount in testing goodwill for impairment.
ASU No. 2011-12, “Deferral of the Effective Date for Amendments to the Presentation of Reclassifications of Items Out of Accumulated Other Comprehensive Income in Accounting Standards Update No. 2011-05”
In December 2011, the FASB issued ASU 2011-12, which deferred the changes in ASU 2011-05 that relate to the presentation of reclassification adjustments out of accumulated other comprehensive income. This ASU is effective at the same time as the amendments in ASU 2011-05 so that entities will not be required to comply with the presentation requirements in ASU 2011-05 that this ASU is deferring. This adoption of this ASU does not have a material impact on the accompanying financial statements.
Recently Issued Accounting Pronouncements
ASU No. 2011-11, “Disclosures about Offsetting Assets and Liabilities”
In December 2011, the FASB issued ASU 2011-11, which requires entities to disclose information about offsetting and related arrangements to enable users of financial statements to understand the effect of those arrangements on an entity’s financial position. The amendments require enhanced disclosures by requiring improved information about financial instruments and derivative instruments that either offset in accordance with current literature or are subject to an enforceable master netting arrangement or similar agreement, irrespective of whether they are offset in accordance with current literature. This ASU is effective for fiscal years, and interim periods within those years, beginning on or after January 1, 2013; the disclosures are retrospectively applied for comparative periods. We are currently evaluating the impact on the accompanying financial statements. The Company does not expect to implement this ASU prior to the required date.
ASU No. 2012-02, “Testing Indefinite-Lived Intangible Assets for Impairment”
In July 2012, the FASB issued ASU 2012-02. The update simplifies the guidance for testing the decline in the realizable value (impairment) of indefinite-lived intangible assets other than goodwill. Examples of intangible assets subject to the guidance include indefinite-lived trademarks, licenses, and distribution rights. The standard
F-18
GAS NATURAL INC. AND SUBSIDIARIES
NOTES TO CONSOLIDATED FINANCIAL STATEMENTS
applies to all public, private, and not-for-profit organizations. The amendments allow an organization the option to first assess qualitative factors to determine whether it is necessary to perform the quantitative impairment test. An organization electing to perform a qualitative assessment is no longer required to calculate the fair value of an indefinite-lived intangible asset unless the organization determines, based on a qualitative assessment, that it is “more likely than not” that the asset is impaired. ASU 2012-02 is effective for annual and interim impairment tests performed for fiscal years beginning after September 15, 2012. Early adoption is permitted. We are currently evaluating the impact on the accompanying financial statements.
ASU No. 2013-01, “Clarifying the Scope of Disclosures about Offsetting Assets and Liabilities”
In January 2013, the FASB issued ASU 2013-01, which clarifies which instruments and transactions are subject to the offsetting disclosure requirements established by ASU 2011-11. The new ASU addresses preparer concerns that the scope of the disclosure requirements under ASU 2011-11 was overly broad and imposed unintended costs that were not commensurate with estimated benefits to financial statement users. In choosing to narrow the scope of the offsetting disclosures, the FASB determined that it could make them more operable and cost effective for preparers while still giving financial statement users sufficient information to analyze the most significant presentation differences between financial statements prepared in accordance with U.S. GAAP and those prepared under IFRSs. ASU 2013-01 becomes effective for fiscal years beginning on or after January 1, 2013. We are currently evaluating the impact on the accompanying financial statements.
ASU 2013-02, “Reporting of Amounts Reclassified Out of Accumulated Other Comprehensive Income”
In February 2013, the FASB issued ASU 2013-02 to amend the guidance in the FASB ASC Topic 220, entitled Comprehensive Income. The goal behind development of the ASU 2013-02 amendments is to improve the transparency of reporting reclassifications out of accumulated other comprehensive income. Other comprehensive income includes gains and losses that are initially excluded from net income for an accounting period. Those gains and losses are later reclassified out of accumulated other comprehensive income into net income when realized. The amendments to FASB ASC 220 do not change current requirements for reporting net income or other comprehensive income in the financial statements. Essentially, all of the information required to be displayed or disclosed in financial statements already are required to be disclosed in the financial statements. We are currently evaluating the impact on the accompanying financial statements.
Note 2 – Acquisitions
Acquisition of Spelman Pipeline
On April 8, 2011 the Company’s indirect subsidiary, Spelman Pipeline Holdings, LLC (“Spelman”), a subsidiary of Lightning Pipeline, completed the acquisition of dormant refined products pipeline assets from Marathon Petroleum Company LP. The cash purchase price for the assets was $3.34 million.
The acquired assets include pipelines and rights-of-way located in Ohio and Kentucky. In Ohio, the assets include more than 140 miles of pipeline spanning almost a third of the state from Marion to Youngstown. Other Ohio assets are located in metropolitan and south suburban Cleveland. The Kentucky assets include more than 60 miles of right-of-way to the south of Louisville.
Spelman reconditioned and converted the Ohio pipeline to transport natural gas to new markets where natural gas service was currently not available, as well as to connect to markets served by our Ohio utilities. The expenditures include reestablishment and clearing of rights-of-way, “pigging” and pressure test of the line, replacement of some existing pipe, connect to supply sources and establishment of interconnections to customers. The assets are cathodically protected and reside in a protective nitrogen bath.
F-19
GAS NATURAL INC. AND SUBSIDIARIES
NOTES TO CONSOLIDATED FINANCIAL STATEMENTS
Future plans include extending the lines to participate in the transportation of Utica and Marcellus Shale production. The Company does not currently have definitive plans for the Kentucky assets.
Spelman filed an application known as a “First Filing” to establish intrastate transportation rates with the PUCO. Should the commission find that the rates proposed by the Company are not unjust and unreasonable, it may approve the rates without a hearing. On October 12, 2011, the PUCO authorized Spelman to commence operations as an intrastate pipeline company and approved its proposed tariff including its proposed transportation rates and charges.
Acquisition of Independence Oil & LP Gas, Inc.
On August 1, 2011 the Company purchased certain assets and assumed certain liabilities of Independence Oil & LP Gas, Inc. for the original price of $1.6 million, of which $200,000 was held back for 90 days. Independence Oil & LP Gas, Inc. delivered liquid propane, heating oil, and kerosene to approximately 3,400 customers from its facilities in West Jefferson, North Carolina and Independence, Virginia. The Company created a new subsidiary named Independence Oil, LLC and is continuing to service the current customers with the intention to expand to other customers in each of the regions. The costs related to the transaction were $13,526 and were expensed during the year ended December 31, 2011.
In accordance with GAAP, the Company determined the purchase of the assets acquired and liabilities assumed to be an acquisition of a business. Therefore, the Company applied the acquisition method and recorded each of the assets acquired (cash, accounts receivable, inventory, and property, plant and equipment) and liabilities assumed (accounts payable) at fair value as of the acquisition date. The carrying values of cash, accounts receivable and accounts payable were deemed to be at fair value as of the acquisition date. The Company valued the fair value of inventory and property, plant and equipment by performing fair value research of the items acquired. This process resulted in the fair value of the assets acquired, reduced by the liabilities assumed, to be greater than the purchase price. The difference is a gain from a bargain purchase and is included as a separate line item in the accompanying statements of income. The Company completed the transaction as it provided the opportunity to strengthen its presence in North Carolina, while extending into Virginia, two markets with favorable competitive conditions targeted for growth.
The estimated fair value of the assets acquired and liabilities assumed is reflected in the following table at the date of acquisition.
| | | | |
Current assets | | $ | 429,576 | |
Property and equipment | | | 1,958,717 | |
| | | | |
| |
Total assets acquired | | | 2,388,293 | |
| | | | |
| |
Current liabilities | | | 57,777 | |
| | | | |
Total liabilities assumed | | | 57,777 | |
| | | | |
| |
Net assets acquired | | $ | 2,330,516 | |
| | | | |
The asset purchase agreement included a settlement date 90 days after the acquisition date, determined to be October 31, 2011 by both parties. As a result of this settlement, the Company paid $125,000 of the $200,000 that was held back at the acquisition date on November 1, 2011. The remaining $75,000 was held back to complete an environmental remediation project that was agreed upon at the time of closing. The environmental
F-20
GAS NATURAL INC. AND SUBSIDIARIES
NOTES TO CONSOLIDATED FINANCIAL STATEMENTS
remediation was completed in December 2011 and the $75,000 was paid for the remediation project and therefore no funds were remaining to provide to the seller. In addition, there was approximately $50,000 of net working capital adjustments made during this settlement. The effects of this settlement were recorded during December 2011 and are reflected in the accompanying consolidated financial statements.
Acquisition of Public Gas Company, Inc.
On April 1, 2012 the Company purchased 100% of the stock of PGC from Kentucky Energy Development, LLC for the original price of $1.6 million, of which $48,522 was held back. A portion of the $48,522 was to be settled 45 days after closing and the remainder was to be settled 180 days after closing. The Company paid $1,029 as final payment of the hold back. PGC is a regulated natural gas distribution company serving approximately 1,600 customers in the State of Kentucky in the counties of Breathitt, Jackson, Johnson, Lawrence, Lee, Magoffin, Morgan and Wolf. The costs related to the transaction were $51,187 and were expensed during the year-ended December 31, 2012. The Company completed the transaction as it provided the opportunity to expand its presence into Kentucky.
The Company applied the acquisition method to the business combination and valued each of the assets acquired (cash, accounts receivable, and property, plant and equipment) and liabilities assumed (accounts payable) at fair value as of the acquisition date. The carrying values of cash, accounts receivable and accounts payable were deemed to be at fair value as of the acquisition date. The Company determined the fair value of property, plant and equipment to be historical book value which is the rate base as PGC is a regulated natural gas distribution company and is required to report to the KPSC. The Company also recorded deferred taxes based on the timing difference related to depreciation. As a result of the purchase, $142,971 was allocated to goodwill. During 2012, this amount was adjusted to $283,425 resulting from adjustments to deferred income taxes and deferred gas cost existing at the time of acquisition. This is reported in the natural gas operations segment. The Company expects none of the goodwill to be deductible for tax purposes.
The estimated fair value of the assets acquired and liabilities assumed is reflected in the following table at the date of acquisition.
| | | | |
Current assets | | $ | 69,634 | |
Property and equipment | | | 1,577,592 | |
Goodwill | | | 283,425 | |
| | | | |
| |
Total assets acquired | | | 1,930,651 | |
| | | | |
| |
Current liabilities | | | 184,770 | |
Long-term liabilities | | | 194,403 | |
| | | | |
Total liabilities assumed | | | 379,173 | |
| | | | |
| |
Net assets acquired | | $ | 1,551,478 | |
| | | | |
Acquisition of Loring Pipeline lease and related property
On April 17, 2012, the Company entered into an agreement with USPF to place a bid at a public auction on certain assets that were being foreclosed upon by USPF (the “Agreement”). Those assets included buildings, equipment and various parcels of land as well as a leasehold interest in a pipeline and a pipeline corridor easement running from Searsport to Limestone, Maine. The assets were owned by Loring BioEnergy, LLC (“LBE”) and were being foreclosed upon by USPF due to LBE’s default on a loan that it had obtained from
F-21
GAS NATURAL INC. AND SUBSIDIARIES
NOTES TO CONSOLIDATED FINANCIAL STATEMENTS
USPF. On June 4, 2012 the Company attended the public foreclosure auction and was the successful bidder with a bid of $4,500,000. The transaction closed on September 25, 2012. At that time, the Company issued 210,951 shares of common stock valued at $2,250,003 in addition to transferring the $2,250,000 of cash it had placed into escrow prior to the auction, to USPF. The lease agreement calls for lease payments of $300,000 per year for the next ten years, closing costs of buyer and seller of $217,323, an annual service fee of $120,000 and a charge of $0.0125 per Mcf moved on the pipeline.
In accordance with GAAP, the assets acquired do not constitute a business and the Company has accounted for the transaction as a group of assets which included both fixed assets and leased fixed assets. The purchase price was allocated to the assets purchased based on the relative fair value of each asset (including the leased assets) to the total fair value of all the assets. Land, buildings, generators and equipment purchased totaled $605,352. Leased pipeline and leased pipeline easements acquired totaled $6,320,000. The Company has determined that the fixed asset lease is a capital lease because the present value of the lease payments, discounted at an appropriate discount rate, exceeded 90% of the fair market value of the assets. The lease obligation for the $300,000 per year was recorded at the present value of the minimum lease payments of $2,208,026.
Note 3 – Marketable Securities
Securities investments that the Company has the positive intent and ability to hold to maturity are classified as held-to-maturity securities and recorded at amortized cost. Securities investments bought expressly for the purpose of selling in the near term are classified as trading securities and are measured at fair value with unrealized gains and losses reported in earnings. Securities investments not classified as either held-to-maturity or trading securities are classified as available-for-sale securities. Available-for-sale securities are recorded at fair value in marketable securities in the accompanying balance sheets, with the change in fair value during the period excluded from earnings and recorded net of tax as a component of other comprehensive income. Realized gains and losses, and declines in value judged to be other than temporary, are recorded in the accompanying statement of comprehensive income. The Company did not hold any held-to-maturity or trading securities as of December 31, 2012 or 2011.
The following is a summary of available-for-sale securities at:
| | | | | | | | | | | | |
| | | December 31, 2012 | |
| | | Investment
at cost | | | Unrealized
Gains | | | Estimated
Fair Value | |
Common stock | | $ | 238,504 | | | $ | 105,842 | | | $ | 344,346 | |
| | | | | | | | | | | | |
| | | | | | | | | | | | |
| |
| | | December 31, 2011 | |
| | | Investment
at cost | | | Unrealized
Gains | | | Estimated
Fair Value | |
Common stock | | $ | 238,504 | | | $ | 129,371 | | | $ | 367,875 | |
| | | | | | | | | | | | |
Unrealized gains on available-for-sale securities of $65,789 and $80,405, respectively (net of $40,053 and $48,966 in taxes) was included in accumulated other comprehensive income in the accompanying balance sheets at December 31, 2012 and 2011, respectively.
There were no gross realized gains or losses for the years ended December 31, 2012 and 2011.
As of December 31, 2012 and December 31, 2011, the Company did not hold any securities in an unrealized loss position.
F-22
GAS NATURAL INC. AND SUBSIDIARIES
NOTES TO CONSOLIDATED FINANCIAL STATEMENTS
Note 4 – Fair Value Measurements
Fair value is defined as the price that would be received to sell an asset or paid to transfer a liability in an orderly transaction between market participants at the measurement date (i.e., an exit price). Measuring fair value requires the use of market data or assumptions that market participants would use in pricing the asset or liability, including assumptions about risk and the risks inherent in the inputs to the valuation technique. These inputs can be readily observable, corroborated by market data, or generally unobservable. Valuation techniques are required to maximize the use of observable inputs and minimize the use of unobservable inputs.
Valuation Hierarchy
A fair value hierarchy that prioritizes the inputs used to measure fair value, and requires fair value measurements to be categorized based on the observability of those inputs has been established by the applicable accounting guidance. The hierarchy gives the highest priority to unadjusted quoted prices in active markets for identical assets or liabilities (Level 1 inputs) and the lowest priority to unobservable inputs (Level 3 inputs).
The following tables represent the Company’s fair value hierarchy for its financial assets measured at fair value on a recurring basis as of:
| | | | | | | | | | | | | | | | |
| | | December 31, 2012 | |
| | | | |
| | | Level 1 | | | Level 2 | | | Level 3 | | | TOTAL | |
Available-for-sale securities | | $ | 344,346 | | | | - | | | | - | | | $ | 344,346 | |
| | | | | | | | | | | | | | | | |
| | | | | | | | | | | | | | | | |
| |
| | | December 31, 2011 | |
| | | | |
| | | Level 1 | | | Level 2 | | | Level 3 | | | TOTAL | |
Available-for-sale securities | | $ | 367,875 | | | | - | | | | - | | | $ | 367,875 | |
| | | | | | | | | | | | | | | | |
The fair value of financial instruments including cash and cash equivalents, notes and accounts receivable and notes and accounts payable are not materially different from their carrying amounts. The fair values of marketable securities are estimated based on closing share price on the quoted market price for those investments. Cost basis is determined by specific identification of securities sold. Under the fair value hierarchy, the fair value of cash and cash equivalents is classified as a Level 1 measurement and the fair value of notes payable are classified as Level 2 measurements.
Note 5 – Property, Plant and Equipment
Producing Natural Gas Properties
In order to provide a stable source of natural gas for a portion of its requirements, EWR and EWD own two natural gas production properties and three gathering systems located in north central Montana. The Company is depleting the cost of the gas properties using the units-of-production method. As of December 31, 2012 and 2011, management of the Company estimated the net gas reserves at 2.1 Bcf (unaudited) and $1,419,000 of net present value after applying a 10% discount (unaudited), considering reserve estimates provided by an independent reservoir engineer. The net book value of the gas properties totals $1,289,160 and $1,330,782 at December 31, 2012 and 2011, respectively.
The wells are depleted based upon production at approximately 10% per year as of December 31, 2012 and 2011. For the years ended December 31, 2012 and 2011, EWR’s portion of the daily gas production was 461 Mcf and 467 Mcf per day, or 15.5% and 17.0% of EWR’s volume requirements, respectively.
F-23
GAS NATURAL INC. AND SUBSIDIARIES
NOTES TO CONSOLIDATED FINANCIAL STATEMENTS
EWD owns working interests in a group of approximately 50 producing natural gas properties and a 75% ownership interest in a gathering system located in northern Montana. For the years ended December 31, 2012 and 2011, EWD’s portion of the daily gas production was 132 Mcf and 137 Mcf per day, or 4.4% and 5.0% of EWR’s volume requirements, respectively.
For the years ended December 31, 2012 and 2011, EWR and EWD’s combined portion of the estimated daily gas production from the reserves was 593 Mcf and 604 Mcf, or 19.9% and 22.0% of our volume requirements in our Montana market, respectively. The wells are operated by an independent third party operator who also has an ownership interest in the properties.
Note 6 – Credit Facilities and Long-Term Debt
Bank of America
On September 20, 2012, the Company’s subsidiary, Energy West, entered into an Amended and Restated Credit Agreement (the “Credit Agreement”), with the Bank of America, N.A. (“Bank of America”) which modifies the original credit agreement entered into on June 29, 2007, as amended from time to time. The Credit Agreement renewed the $30.0 million revolving credit facility available to Energy West and provides for a maturity date of April 1, 2017. In addition, Energy West entered into a $10.0 million term loan with Bank of America with a maturity date of April 1, 2017 (the “Term Loan”). Pursuant to the terms of the Credit Agreement, Energy West issued a second amended and substitute note to Bank of America in the amount of $30.0 million for the revolving credit facility and another note in the original principal amount of $10.0 million for the Term Loan.
The Credit Agreement includes an annual commitment fee ranging from 25 to 45 basis points of the unused portion of the Credit Agreement and interest on the amounts outstanding at the London Interbank Offered Rate (“LIBOR”) rate plus 175 to 225 basis points. The Term Loan has an interest rate of LIBOR plus 175 to 225 basis points with an interest rate swap provision that allows for the interest rate to be fixed in the future. The Term Loan will be amortized at a rate of $125,000 per quarter, with the first principal payment commencing on December 31, 2012. As of December 31, 2012, the Company had not exercised the interest rate swap provision for the fixed interest rate. The first principal payment was paid to Bank of America on January 3, 2013.
The Credit Agreement requires that Energy West and its subsidiaries maintain compliance with a number of financial covenants, including a limitation on investments in another entity by acquisition of any debt or equity securities or assets or by making loans or advances to such entity. In addition, Energy West must maintain a total debt to total capital ratio of not more than .55-to-1.00 (previously .65-to-1.00) and an interest coverage ratio of no less than 2.0-to-1.0. The credit facility restricted Energy West’s ability to create, incur or assume indebtedness except (i) indebtedness under the credit facility (ii) indebtedness incurred under certain capitalized leases including the capital lease related to the Loring pipeline, and purchase money obligations not to exceed $500,000, (iii) certain indebtedness of Energy West’s subsidiaries, (iv) certain subordinated indebtedness, (v) certain hedging obligations and (vi) other indebtedness not to exceed $1.0 million.
The Credit Agreement also restricts Energy West’s ability to pay dividends and make distributions, redemptions and repurchases of stock during any 60-month period to 80% of its net income over that period. In addition, no event of default may exist at the time such dividend, distribution, redemption or repurchase is made. Energy West is also prohibited from consummating a merger or consolidation or selling all or substantially all of its assets or stock except for (i) any merger consolidation or sale by or with certain of its subsidiaries, (ii) any such purchase or other acquisition by Energy West or certain of its subsidiaries and (iii) sales and dispositions of assets for at least fair market value so long as the net book value of all assets sold or otherwise disposed of in any fiscal year does not exceed 5% of the net book value of Energy West’s assets as of the last day of the preceding fiscal year.
F-24
GAS NATURAL INC. AND SUBSIDIARIES
NOTES TO CONSOLIDATED FINANCIAL STATEMENTS
For the year ended December 31, 2012 and 2011, the weighted average interest rate on the existing and renewed revolving credit facility was 3.33% and 1.72%, respectively, resulting in $500,062 and $262,514 of interest expense, respectively. The balance on the revolving credit facility was $23,860,000 and $23,160,000 at December 31, 2012 and 2011, respectively. The $23.9 million of borrowings as of December 31, 2012, leaves the remaining borrowing capacity on the line of credit at $6.1 million.
The balance outstanding on the Bank of America term loan at December 31, 2012 was $10,000,000. The weighted average interest rate for the year ended December 31, 2012 was 2.1363%, resulting in interest expense of $56,226.
Senior Unsecured Notes
On June 29, 2007, Energy West authorized the sale of $13,000,000 aggregate principal amount of its 6.16% Senior Unsecured Notes, due June 29, 2017 (the “Senior Unsecured Notes”). The proceeds of these notes were used to refinance existing notes.
Interest expense was $800,800 for the years ended December 31, 2012 and 2011, respectively.
Citizens Bank
Our Ohio subsidiaries had term loans with Citizens in the aggregate amount of $11.3 million. Each term note had a maturity date of July 1, 2013 and bore interest at an annual rate of 30-day LIBOR plus 400 basis points with an interest rate floor of 5.00% per annum. For the year ended December 31, 2011, the weighted average interest rate on the term loans was 5.00%, resulting in $156,022 of interest expense. The term loans were paid off on May 3, 2011.
Sun Life Assurance Company of Canada
On May 2, 2011, the Company and its Ohio subsidiaries, NEO, Orwell and Brainard (together “the Issuers”), issued $15.3 million of 5.38% Senior Secured Guaranteed Fixed Rate Notes due June 1, 2017 (“Fixed Rate Note”). Additionally, Great Plains issued $3.0 million of Senior Secured Guaranteed Floating Rate Notes due May 3, 2014 (“Floating Rate Note”). Both notes were placed with Sun Life.
The Fixed Rate Note, in the amount of $15.3 million, is a joint obligation of the Issuers, and is guaranteed by the Company, Lightning Pipeline and Great Plains (together with the Issuers, “the Fixed Rate Obligors”). This note received approval from the PUCO on March 30, 2011. The note is governed by a Note Purchase Agreement (“NPA”). Concurrent with the funding and closing of this transaction, which occurred on May 3, 2011, the Fixed Rate Obligors signed an amended NPA that is substantially the same as the NPA released on November 2, 2010. Prepayment of this note prior to maturity is subject to a 50 basis point make-whole premium.
The Floating Rate Note, in the amount of $3.0 million, is an obligation of Great Plains and is guaranteed by the Company (together, “the Floating Rate Obligors”). The note is priced at a fixed spread of 385 basis points over three month Libor. Pricing for this note will reset on a quarterly basis to the then current yield of three month Libor. The note is governed by a NPA. Concurrent with the funding of this transaction, which occurred on May 3, 2011, the Floating Rate Obligors signed an amended NPA that is substantially the same as the NPA released on November 2, 2010. Prepayment of this note prior to maturity is at par.
Each of the notes is governed by a note purchase agreement. Concurrent with the funding and closing of the notes, which occurred on May 3, 2011, the parties executed amended note purchase agreements that are substantially the same as the note purchase agreements executed on November 2, 2010.
F-25
GAS NATURAL INC. AND SUBSIDIARIES
NOTES TO CONSOLIDATED FINANCIAL STATEMENTS
The use of proceeds for both notes extinguished existing amortizing bank debt and other existing indebtedness, funded $3.4 million for the 2011 capital program for Orwell and NEO, established two debt service reserve accounts, and replenished the Company’s treasuries for the previously described repayment of maturing bank debt and transaction expenses. The capital program funds and debt service reserve accounts are in interest bearing accounts and included in restricted cash.
Sun Life restricted certain cash balances and required two main types of debt service reserve accounts to be created to cover approximately one year of interest payments. The balance in both debt service reserve accounts was $1,072,000 and $950,000 at December 31, 2012 and 2011, respectively, and is included in restricted cash. The debt service reserve accounts cannot be used for operating cash needs.
Payments for both notes prior to maturity are interest-only.
For the years ended December 31, 2012 and 2011, the weighted average interest rate on the Fixed Rate Note was 5.38% and 5.38% respectively resulting in $824,969 and $549,979 of interest expense. For the years ended December 31, 2012 and 2011, the weighted average interest rates on the Floating Rate Note were 4.31% and 4.16%, respectively, resulting in $129,200 and $83,075 of interest expense. For the year ended December 31, 2012, the weighted average interest rate on the Senior Note was 4.15% resulting in $23,576 of interest expense.
For the year ended December 31, 2011, the Company breached a financial covenant under the Fixed Rate Note and Floating Rate Note when the Obligors made restricted payments in the form of dividends to the holding company in excess of the amounts permissible. In addition, the Company did not timely notify Sun Life of certain newly-formed subsidiaries which were required to be obligors under the Fixed Rate Note and Floating Rate Note. The failure to timely notify Sun Life constituted a breach of the Fixed Rate Note and Floating Rate Note. The Company requested that Sun Life waive these breaches and amend the financial covenants.
On April 9, 2012, the Company entered into a waiver and amendment of the Fixed Rate Note and Floating Rate Note. Pursuant to the amendments, Sun Life waived its rights and remedies of the breaches of the covenants described above.
On October 24, 2012, Orwell, NEO, and Brainard issued a Senior Secured Guaranteed Note in the amount of $2.989 million. The Senior Note was placed with Sun Life, pursuant to a third amendment to the original Note Purchase Agreement dated as of November 1, 2010, by and among Orwell, NEO, and Brainard, and Great Plains Natural Gas Company, Lightning Pipeline Company, Inc., Gas Natural and Sun Life. The Senior Note will bear an interest rate of 4.15%, compounded semi-annually, and it matures on June 1, 2017.
The Senior Note is a joint obligation of the Ohio subsidiaries and is guaranteed by Gas Natural’s non-regulated Ohio and North Carolina subsidiaries. The Senior Note is subject to other customary loan covenants and default provisions. An event of default, if not cured, would require us to immediately pay the outstanding principal balance of the Senior Note as well as any and all interest and other payments due. An event of default would also entitle Sun Life to exercise certain rights with respect to the collateral that secures the indebtedness incurred under the Note.
The amendments also provide that any cash dividends, distributions, redemptions or repurchases of common stock may be made by the obligors to the holding company only if (i) the aggregate amount of all such dividends, distributions, redemptions and repurchases for the fiscal year do not exceed 70% of net income of the obligors for the four fiscal quarters then ending determined as of the end of each fiscal quarter for the four fiscal quarters then ending, and (ii) there exists no other event of default at the time the dividend, distribution, redemption or repurchase is made. The inability of the obligors to pay a dividend to the holding company may impact the
F-26
GAS NATURAL INC. AND SUBSIDIARIES
NOTES TO CONSOLIDATED FINANCIAL STATEMENTS
Company’s ability to pay a dividend to shareholders. In addition, the Company agreed to deliver an irrevocable standby letter of credit to Sun Life in the amount of $750,000 to be drawn upon by Sun Life if and when any event of default has occurred and is continuing. After discussion with Sun Life, the parties agreed to change the letter of credit requirement to depositing cash into a reserve account whereas Sun Life is the beneficiary. The terms allow the Company to withdraw that money if a letter of credit is received to replace the restricted cash.
The Fixed Rate Note and Floating Rate Note require, on a consolidated basis, an interest coverage ratio of at least 2.0 to 1.0, measured quarterly on a trailing four quarter basis. The notes generally define the interest coverage ratio as the ratio of EBITDA to gross interest expense. The note defines EBITDA as net income plus the sum of interest expense, any provision for federal, state, and local taxes, depreciation, and amortization determined on a consolidated basis in accordance with GAAP, but excluding any extraordinary non-operating income or loss and any gain or loss from non-operating transactions. The interest coverage ratio is measured with respect to the Obligors on a consolidated basis and also with respect to the Company and all of its subsidiaries, on a consolidated basis. The notes also require that the Company does not permit indebtedness to exceed 60% of capitalization at any time. Like the interest coverage ratio, the ratio of debt to capitalization is measured on a consolidated basis for the Obligors, and again on a consolidated basis with respect to the Company and all of its subsidiaries.
The Ohio subsidiaries and PGC are prohibited from creating, assuming or incurring additional indebtedness except for (i) obligations under certain financing agreements, (ii) indebtedness incurred under certain capitalized leases and purchase money obligations not to exceed $500,000 at any one time outstanding, (iii) indebtedness outstanding as of March 31, 2011, (iv) certain unsecured intercompany indebtedness and (v) certain other indebtedness permitted under the notes.
The notes prohibit us from selling or otherwise transferring assets except in the ordinary course of business and to the extent such sales or transfers, in the aggregate, over each rolling twelve month period, do not exceed 1% of our total assets. Generally, we may consummate a merger or consolidation if there is no event of default and the provisions of the notes are assumed by the surviving or continuing corporation. We are also generally limited in making acquisitions in excess of 10% of our total assets.
Yadkin Valley Bank
On February 13, 2012, Independence entered into a one year, $500,000 revolving credit facility with Yadkin Valley Bank with an interest rate based on the prime rate, with a floor of 4.5% per annum and a maximum of 16% per annum. For the year ended December 31, 2012, the weighted average interest rate on the facility was 4.5%, resulting in $11,350 of interest expense. The balance on the facility was $401,000 at December 31, 2012. The $401,000 of borrowings as of December 31, 2012, leaves the remaining borrowing capacity on the line of credit at $99,000.
The revolving credit facility expired February 13, 2013. The Company extended the $500,000 commercial line of credit agreement with Yadkin Valley Bank and Trust Company through May 13, 2013. The interest rate continues at 4.5% per annum, and the debt is secured by assets of Independence.
Independence shall promptly notify Lender in writing of all threatened and actual litigation, governmental proceeding, default, and other material occurrences. We shall maintain adequate insurance coverage. Independence shall conform to any document requests, pay all taxes required by local, state, and federal agencies, and agree to keep our existence in its current organizational form. We must comply with all laws affecting the environment. Independence must use the loan proceeds in its operations. We shall not draw, permit, or pay any more than is reasonable for services provided to us. Independence cannot incur debt, borrow money,
F-27
GAS NATURAL INC. AND SUBSIDIARIES
NOTES TO CONSOLIDATED FINANCIAL STATEMENTS
or guarantee any loan or other obligation. We cannot lend any money or sell our accounts receivable nor encumber or transfer any assets without lender’s permission. Independence cannot pay or declare a dividend or distribution on shares. Independence cannot borrow or make any loans, advances, or investments. Failure by Independence to perform or meet any term, covenant or condition under any obligation to Yadkin Valley Bank shall constitute an event of default.
Debt Covenants
The Company’s Bank of America Credit Facility and the Senior Unsecured Notes contain various covenants, which include, among others, limitations on total dividends and distributions made in the immediately preceding 60-month period to 80% of aggregate consolidated net income for such period, restrictions on certain indebtedness, limitations on asset sales, and maintenance of certain debt-to-capital and interest coverage ratios.
The Sun Life Senior Unsecured Notes contain similar covenants, and include, among others, limitations on total dividends and distributions made in the immediately preceding 60-month period to 100% of Energy West’s aggregate consolidated net income for such period, restrictions on certain indebtedness, limitations on asset sales, and maintenance of certain debt-to-capital and interest coverage ratios.
The Fixed Rate Note and the Floating Rate Note carry a 60% debt-to-capitalization financial covenant on a consolidated basis for Ohio and the Company, as well as, a 2.0x interest coverage test based on a trailing twelve-month basis. Additional covenants customary for asset sales and purchases, additional indebtedness, dividends, change of control and other matters are also included.
The Company is in compliance with the financial covenants under its debt agreements or has received waivers for any defaults.
The following table shows the future minimum payments on the credit facilities and long-term debt for the years ended December 31:
| | | | |
2013 | | $ | 633,498 | |
2014 | | | 3,502,190 | |
2015 | | | 500,000 | |
2016 | | | 500,000 | |
2017 | | | 39,198,552 | |
Thereafter | | | - | |
| | | | |
| |
Total | | $ | 44,334,240 | |
| | | | |
Note 7 – Stockholders’ Equity
The Company’s common stock trades on the NYSE Amex Equities (formerly known as the American Stock Exchange) under the symbol “EGAS.”
The Board of Directors approved a stock repurchase plan whereby the Company has the ability to buy back up to 448,500 shares of the Company’s common stock. There was no share repurchase activity during the years ended December 31, 2012 and 2011.
F-28
GAS NATURAL INC. AND SUBSIDIARIES
NOTES TO CONSOLIDATED FINANCIAL STATEMENTS
2002 Stock Option Plan
The Energy West Incorporated 2002 Stock Option Plan (the “Option Plan”) expired on October 4, 2012 and provided for the issuance of up to 300,000 options to purchase the Company’s common stock to be issued to certain key employees. As of December 31, 2012 and December 31, 2011, there were 35,000 and 35,000 options outstanding, respectively. Under the Option Plan, the option price may not be less than 100% of the common stock fair market value on the date of grant (in the event of incentive stock options, 110% of the fair market value if the employee owns more than 10% of the outstanding common stock). Pursuant to the Option Plan, the options vest over four to five years and are exercisable over a five to ten-year period from date of issuance.
The fair value of each option grant is estimated on the date of grant using the Black-Scholes option pricing model. No options were granted under this plan during 2012 or 2011.
2012 Incentive and Equity Award Plan
The 2012 Incentive and Equity Award Plan provides for the grant of options, restricted stock, performance award, other stock-based awards and cash awards to certain eligible employees. The number of shares authorized for issuance under the plan is 500,000. Under the plan, the option price may not be less than 100% of the fair market value on the date of grant and the options may be exercisable up to a ten year period after the date of grant (five years in the case of an incentive stock option granted to a holder of 10% of the Company’s shares of common stock). Under the plan, awards tied to performance goals will be subject to a one-year minimum performance measurement period. As of December 31, 2012, no options or awards had been granted under the plan.
2012 Non-Employee Director Stock Award Plan
The 2012 Non-Employee Director Stock Award Plan allows each non-employee director to receive his or her fees in shares of the Company’s common stock by providing written notice to the Company. Under the plan, the election to participate will remain in effect until it is revoked or modified in writing by the director. The number of shares authorized for issuance under the plan is 250,000. As of December 31, 2012, no shares had been issued under the plan.
A summary of the status of the stock option plans is as follows:
| | | | | | | | | | | | |
| | | Number of
Shares | | | Weighted
Average
Exercise Price | | | Aggregate
Intrinsic
Value | |
| | | |
Outstanding December 31, 2010 | | | 39,500 | | | $ | 8.40 | | | | | |
Granted | | | - | | | $ | - | | | | | |
Exercised | | | - | | | $ | - | | | | | |
Expired | | | (4,500) | | | $ | 6.35 | | | | | |
| | | | | | | | | | | | |
| | | |
Outstanding December 31, 2011 | | | 35,000 | | | $ | 8.66 | | | | | |
Granted | | | - | | | $ | - | | | | | |
Exercised | | | - | | | $ | - | | | | | |
Expired | | | - | | | $ | - | | | | | |
| | | | | | | | | | | | |
| | | |
Outstanding December 31, 2012 | | | 35,000 | | | $ | 8.66 | | | $ | 31,550 | |
| | | | | | | | | | | | |
| | | |
Exercisable December 31, 2012 | | | 32,500 | | | $ | 8.55 | | | $ | 31,550 | |
| | | | | | | | | | | | |
F-29
GAS NATURAL INC. AND SUBSIDIARIES
NOTES TO CONSOLIDATED FINANCIAL STATEMENTS
As of December 31, 2012 and 2011, there was $3,231 and $12,637 of total unrecognized compensation cost related to stock-based compensation, respectively. That cost is expected to be recognized over a period of two years.
The following information applies to options outstanding at December 31, 2012:
| | | | | | | | | | | | | | | | |
Grant Date | | Exercise
Price | | Number
Outstanding | | | Weighted
Average
Exercise
Price | | Weighted
Average
Remaining
Contractual
Life
(Years) | | Number
Exercisable | | | Weighted
Average
Exercise
Price |
| | | | | | |
12/1/2008 | | $7.10 | | | 10,000 | | | $7.10 | | 6.92 | | | 10,000 | | | $7.10 |
6/3/2009 | | $8.44 | | | 5,000 | | | $8.44 | | 2.42 | | | 5,000 | | | $8.44 |
12/1/2009 | | $8.85 | | | 10,000 | | | $8.85 | | 7.92 | | | 10,000 | | | $8.85 |
12/1/2010 | | $10.15 | | | 10,000 | | | $10.15 | | 8.92 | | | 7,500 | | | $10.15 |
| | | | | | | | | | | | | | | | |
| | | | | 35,000 | | | | | | | | 32,500 | | | |
| | | | | | | | | | | | | | | | |
During the years ended December 31, 2012 and 2011, the Company recorded $9,406 and $19,187, respectively ($5,832 and $11,896, respectively, net of related tax effects), of compensation expense for stock options granted after July 1, 2005, and for the unvested portion of previously granted stock options that remained outstanding as of July 1, 2005.
Note 8 – Employee Benefit Plans
The Company has a defined contribution plan (the “401k Plan”) which covers substantially all of its employees. The plan provides for an annual contribution of 3% of salaries, with a discretionary contribution of up to an additional 3%. The expense related to the 401k Plan for the years ended December 31, 2012 and 2011 was $362,160 and $400,588, respectively.
The Company makes matching contributions in the form of Company common stock equal to 10% of each participant’s elective deferrals in the 401k Plan. The Company contributed shares of common stock valued at $52,719 and $47,743 for the years ended December 31, 2012 and 2011, respectively. In addition, a portion of the 401k Plan consists of an Employee Stock Ownership Plan (“ESOP”) that covers most employees. The ESOP receives contributions of common stock from the Company each year as determined by the Board of Directors. The contribution is recorded based on the current market price of the Company’s common stock. The Company made no contributions for the years ended December 31, 2012 and 2011.
The Company has sponsored a defined postretirement health benefit plan (the “Retiree Health Plan”) providing health and life insurance benefits to eligible retirees. The Plan pays eligible retirees (post-65 years of age) up to $125 per month in lieu of contracting for health and life insurance benefits. The amount of this payment is fixed and will not increase with medical trends or inflation. In addition, the Retiree Health Plan allows retirees between the ages of 60 and 65 and their spouses to remain on the same medical plan as active employees by contributing 125% of the current COBRA rate to retain this coverage. The amounts paid in excess of the current COBRA rate is held in a VEBA trust account, and benefits for this plan are paid from assets held in the VEBA Trust account. The Company discontinued contributions in 2006 and is no longer required to fund the Retiree Health Plan. As of December 31, 2012 and 2011, the value of plan assets was $163,313 and $182,931, respectively. The assets remaining in the trust will be used to fund the plan until these assets are exhausted.
F-30
GAS NATURAL INC. AND SUBSIDIARIES
NOTES TO CONSOLIDATED FINANCIAL STATEMENTS
Note 9 – Income Taxes
Significant components of the deferred tax assets and liabilities are as follows:
| | | | | | | | | | | | | | | | |
| | | 2012 | | | 2011 | |
| | | Current | | | Long-term | | | Current | | | Long-term | |
Deferred tax assets: | | | | | | | | | | | | | | | | |
Allowance for doubtful accounts | | $ | 524,677 | | | $ | - | | | $ | 228,839 | | | $ | - | |
Contributions in aid of construction | | | - | | | | 742,152 | | | | - | | | | 659,362 | |
Other nondeductible accruals | | | 66,278 | | | | - | | | | 64,794 | | | | - | |
Recoverable purchase gas costs | | | 434,995 | | | | - | | | | 351,241 | | | | - | |
Net operating loss carryforwards | | | - | | | | 5,439,748 | | | | - | | | | 4,750,607 | |
Property tax | | | - | | | | 153,967 | | | | 89,391 | | | | 179,273 | |
Other | | | 709,778 | | | | 595,352 | | | | 651,659 | | | | 305,390 | |
| | | | | | | | | | | | | | | | |
| | | | |
Total deferred tax assets | | | 1,735,728 | | | | 6,931,219 | | | | 1,385,924 | | | | 5,894,632 | |
| | | | |
Deferred tax liabilities: | | | | | | | | | | | | | | | | |
Recoverable purchase gas costs | | | 867,075 | | | | - | | | | 275,560 | | | | - | |
Property, plant and equipment | | | - | | | | 6,962,154 | | | | - | | | | 3,361,427 | |
Unrealized gain on securities available for sale | | | 39,923 | | | | - | | | | 49,050 | | | | - | |
Amortization of intangibles | | | - | | | | 418,181 | | | | - | | | | 348,458 | |
Other | | | - | | | | 519,814 | | | | - | | | | 655,500 | |
| | | | | | | | | | | | | | | | |
| | | | |
Total deferred tax liabilities | | | 906,998 | | | | 7,900,149 | | | | 324,610 | | | | 4,365,385 | |
| | | | | | | | | | | | | | | | |
| | | | |
Net deferred tax asset (liability) before valuation allowance | | | 828,730 | | | | (968,930) | | | | 1,061,314 | | | | 1,529,247 | |
Less: valuation allowance | | | - | | | | (4,175,072) | | | | - | | | | (4,437,414) | |
| | | | | | | | | | | | | | | | |
Net deferred tax asset (liability) | | $ | 828,730 | | | $ | (5,144,002) | | | $ | 1,061,314 | | | $ | (2,908,167) | |
| | | | | | | | | | | | | | | | |
Income tax expense consists of the following:
| | | | | | | | |
| | | Years Ended December 31, | |
| | | 2012 | | | 2011 | |
Current income tax expense (benefit): | | | | | | | | |
Federal | | $ | (150,224) | | | $ | (767,304) | |
State | | | 245,483 | | | | 184,989 | |
| | | | | | | | |
| | |
Total current income tax expense (benefit) | | | 95,259 | | | | (582,315) | |
| | |
Deferred income tax expense: | | | | | | | | |
Federal | | | 2,030,525 | | | | 3,238,429 | |
State | | | 252,403 | | | | 506,943 | |
| | | | | | | | |
| | |
Total deferred income tax expense | | | 2,282,928 | | | | 3,745,372 | |
| | | | | | | | |
| | |
Total income taxes before credits | | | 2,378,187 | | | | 3,163,057 | |
Investment tax credit, net | | | (21,062) | | | | (21,062) | |
| | | | | | | | |
| | |
Total income tax expense | | $ | 2,357,125 | | | $ | 3,141,995 | |
| | | | | | | | |
F-31
GAS NATURAL INC. AND SUBSIDIARIES
NOTES TO CONSOLIDATED FINANCIAL STATEMENTS
Income tax position differs from the amount computed by applying the federal statutory rate to pre-tax income or loss as demonstrated in the table below:
| | | | | | | | |
| | | Years Ended December 31, | |
| | | 2012 | | | 2011 | |
Income tax from continuing operations: | | | | | | | | |
Tax expense at statutory rate of 34% | | $ | 2,065,991 | | | $ | 2,893,921 | |
State income tax, net of federal tax expense | | | 228,051 | | | | 295,101 | |
Amortization of deferred investment tax credits | | | (21,062) | | | | (21,062) | |
Decrease in valuation allowance | | | (262,343) | | | | (146,747) | |
Permanent differences | | | 140,211 | | | | 29,657 | |
Other | | | 206,277 | | | | 91,125 | |
| | | | | | | | |
| | |
Total income tax expense | | $ | 2,357,125 | | | $ | 3,141,995 | |
| | | | | | | | |
The Company has approximately $8.0 million federal net operating loss carryover as of December 31, 2012. The net operating losses begin to expire in 2024. Due to acquisitions, these net operating losses are subject to Section 382 of the Internal Revenue Code. The Company has placed a valuation allowance of $96,000 on the portion relating to its acquisition of Cut Bank Gas in 2009. The Company has approximately $63.9 million of state net operating loss carryover as of December 31, 2012. The Company has placed a state deferred tax asset valuation allowance of $2.4 million against the state net operating loss carryover. In addition, the Company has approximately $33.9 million of carryover tax basis as of December 31, 2012. The Company has placed a state deferred tax asset valuation allowance of $1.7 million on the carryover tax basis of the subsidiaries, since the carryover tax basis is subject to Section 382 of the Internal Revenue Code. Management has concluded that the realization of these state deferred tax assets do not meet the “more-likely-than-not” requirements of ASC 740.
In assessing the ability to realize the deferred tax assets, management considers whether it is more likely than not that some portion or all of the deferred tax assets will not be realized. The ultimate realization of deferred tax assets is dependent upon the generation of future taxable income during the periods in which those temporary differences become deductible. Management considers the scheduled reversal of deferred tax liabilities, projected future results of operations, and tax planning strategies in making this assessment.
The Company adopted the applicable provisions of ASC 740 to recognize, measure, and disclose uncertain tax positions in the financial statements. Under ASC 740, tax positions must meet a “more-likely-than-not” recognition threshold at the effective date to be recognized upon the adoption and in subsequent periods. During the year ended December 31, 2012, no adjustments were recognized for uncertain tax benefits.
The tax years after 2008 remain open to examination by the major taxing jurisdictions in which the Company operates, although no material changes to unrecognized tax positions are expected within the next twelve months.
During 2012, the Company filed Form 3115 with the Internal Revenue Service for an application for change in accounting method for customer recoveries in Ohio due to rate changes. Under the Company’s current method of accounting for customer recoveries in Ohio, income was recognized before the “all events test” for income had been satisfied. At the point at which we are recognizing such income, we do not have a fixed right to such income. In our application, we proposed to apply the “all events test” for income to customer recoveries, such that income will be recognized in connection with such item only when it has a fixed right to receive such income, and the amount can be determined with reasonable accuracy.
F-32
GAS NATURAL INC. AND SUBSIDIARIES
NOTES TO CONSOLIDATED FINANCIAL STATEMENTS
Note 10 – Related Party Transactions
The Company is party to certain agreements and transactions with Mr. Osborne, or companies owned or controlled by Mr. Osborne.
Notes Payable
The Company had two notes payable to Mr. Osborne. The first note was payable on demand and bore interest at a rate equal to the prime rate as published by Key Bank. On December 1, 2010, the Company repaid the first note in full, including all interest accrued to date. The second note had a maturity date of January 3, 2014 and bore interest at 6.0% annually. On May 3, 2011, the Company repaid the second note in full, including all interest accrued to date, using the Sun Life proceeds. As of December 31, 2012 and 2011, the second note had a balance of $0. Interest expense incurred related to both loans was $0 and $529, respectively, for the years ended December 31, 2012 and 2011.
Note Receivable
The Company has a note receivable from JDOG Marketing, a company controlled by Mr. Osborne, with a maturity date of December 31, 2016 and an annual interest rate of 7.0% relating to funds loaned to JDOG Marketing to finance the acquisition of a gas pipeline. The balance due from JDOG Marketing was $35,409 and $45,664 (of which, $10,998 and $10,256 is due within one year) as of December 31, 2012 and 2011, respectively. The Company has a corresponding agreement to lease the pipeline from JDOG Marketing through December 31, 2016. Lease expense resulting from this agreement was $13,200 and $13,200 for the years ended December 31, 2012 and 2011, respectively, which is included in the Natural Gas Purchased column below. There was $1,100 and $0 due at December 31, 2012 and 2011, respectively to JDOG Marketing related to these lease payments.
Accounts Receivable and Accounts Payable
The table below details amounts due from and due to related parties, including companies owned or controlled by Mr. Osborne, at December 31, 2012 and 2011, respectively:
| | | | | | | | | | | | | | | | |
| | | Accounts Receivable | | | Accounts Payable | |
| | | December 31, 2012 | | | December 31, 2011 | | | December 31, 2012 | | | December 31, 2011 | |
John D. Oil and Gas Marketing | | $ | 3,282 | | | $ | 3,282 | | | $ | 40,518 | | | $ | 126,051 | |
Cobra Pipeline | | | 21,698 | | | | 448 | | | | - | | | | 1,312 | |
Orwell Trumbell Pipeline | | | 90,385 | | | | 128,012 | | | | - | | | | 1,043 | |
Great Plains Exploration | | | 142,740 | | | | 133,928 | | | | 9 | | | | 9 | |
Big Oats Pipeline Supply | | | 769 | | | | 432 | | | | 11,270 | | | | 53,348 | |
Kykuit Resources | | | 98,037 | | | | 98,037 | | | | - | | | | - | |
Sleepy Hollow | | | 143,697 | | | | 138,611 | | | | - | | | | - | |
Other | | | 21,949 | | | | 16,334 | | | | - | | | | 10,000 | |
| | | | | | | | | | | | | | | | |
Total | | $ | 522,557 | | | $ | 519,084 | | | $ | 51,797 | | | $ | 191,763 | |
| | | | | | | | | | | | | | | | |
F-33
GAS NATURAL INC. AND SUBSIDIARIES
NOTES TO CONSOLIDATED FINANCIAL STATEMENTS
The table below details transactions with related parties, including companies owned or controlled by Mr. Osborne, for the year ended December 31, 2012:
| | | | | | | | | | | | | | | | | | | | |
| | | Year Ended December 31, 2012 | |
| | | Natural Gas
Purchases | | | Pipeline and
Construction
Purchases | | | Rent, Supplies,
Consulting, and
Other Purchases | | | Natural Gas
Sales | | | Management
and Other
Sales | |
| | | | | |
John D. Oil and Gas Marketing | | $ | 2,405,158 | | | $ | 9,870 | | | $ | 58,043 | | | $ | - | | | $ | 13,128 | |
Cobra Pipeline | | | 389,233 | | | | 5,390 | | | | 5,104 | | | | - | | | | 23,210 | |
Orwell Trumbell Pipeline | | | 526,785 | | | | 132 | | | | 19,547 | | | | 26,519 | | | | 4,785 | |
Great Plains Exploration | | | 506,503 | | | | - | | | | - | | | | 7,068 | | | | 10,643 | |
Big Oats Pipeline Supply | | | - | | | | 1,231,921 | | | | 256,607 | | | | 2,131 | | | | 7,068 | |
Sleepy Hollow | | | - | | | | - | | | | - | | | | - | | | | 5,113 | |
John D. Oil and Gas Company | | | 502,897 | | | | - | | | | - | | | | 575 | | | | - | |
OsAir | | | 248,588 | | | | - | | | | 196,451 | | | | 2,479 | | | | 306 | |
Other | | | 135,927 | | | | - | | | | 127,171 | | | | 28,777 | | | | 411 | |
| | | | | | | | | | | | | | | | | | | | |
Total | | $ | 4,715,091 | | | $ | 1,247,313 | | | $ | 662,923 | | | $ | 67,549 | | | $ | 64,664 | |
| | | | | | | | | | | | | | | | | | | | |
The table below details transactions with related parties, including companies owned or controlled by Mr. Osborne, for the year ended December 31, 2011:
| | | | | | | | | | | | | | | | | | | | |
| | | Year Ended December 31, 2011 | |
| | | Natural Gas
Purchases | | | Pipeline and
Construction
Purchases | | | Rent, Supplies,
Consulting, and
Other Purchases | | | Natural Gas
Sales | | | Management
and Other
Sales | |
John D. Oil and Gas Marketing | | $ | 3,907,583 | | | $ | 21,602 | | | $ | 53,046 | | | $ | - | | | $ | 13,128 | |
Cobra Pipeline | | | 314,589 | | | | 70,548 | | | | 6,928 | | | | - | | | | 7,798 | |
Orwell Trumbell Pipeline | | | 302,682 | | | | 129,597 | | | | 99,737 | | | | 2,283 | | | | 10,048 | |
Great Plains Exploration | | | 1,414,536 | | | | 528,339 | | | | 30,155 | | | | 4,188 | | | | 28,080 | |
Big Oats Pipeline Supply | | | - | | | | 1,178,380 | | | | 561,355 | | | | 3,452 | | | | 1,000 | |
Kykuit Resources | | | - | | | | - | | | | 39,600 | | | | - | | | | 883 | |
Sleepy Hollow | | | - | | | | - | | | | - | | | | - | | | | 37,970 | |
Other | | | 178,617 | | | | - | | | | 211,138 | | | | 59,516 | | | | 3,603 | |
| | | | | | | | | | | | | | | | | | | | |
Total | | $ | 6,118,007 | | | $ | 1,928,466 | | | $ | 1,001,959 | | | $ | 69,439 | | | $ | 102,510 | |
| | | | | | | | | | | | | | | | | | | | |
The Company also accrued a liability of $595,240 and $635,192, respectively, due to companies controlled by Mr. Osborne for natural gas used through December 31, 2012 and 2011 that has not yet been invoiced. The related expense is included in the gas purchased line item in the accompanying statements of comprehensive income. These amounts will be trued up to the actual invoices when received in future periods.
Mr. Osborne sold shares of common stock in which the Company incurred expenses of $274,213 and $106,595 for the years ended December 31, 2012 and December 31, 2011, respectively. These expenses are recorded in the accompanying income statement as stock sale expense.
On December 20, 2011, the Company consummated a real estate transaction with Black Bear, an Ohio limited liability company owned and controlled by Mr. Osborne, whereby Black Bear sold to the Company approximately 9.24 acres of real estate Black Bear owned in Violet Township, Fairfield County, Ohio for $600,000.
F-34
GAS NATURAL INC. AND SUBSIDIARIES
NOTES TO CONSOLIDATED FINANCIAL STATEMENTS
Note 11 – Segments of Operations
The following tables set forth summarized financial information for the Company’s natural gas, marketing and production, pipeline, propane, and corporate and other operations. The Company classifies its segments to provide investors with a view of the business through management’s eyes. The Company primarily separates its state regulated utility businesses from the non-regulated marketing and production and propane businesses and from the federally regulated pipeline business. The Company has regulated utility businesses in the states of Kentucky, Maine, Montana, North Carolina, Ohio, Pennsylvania, and Wyoming and these businesses are aggregated together to form the natural gas operations. Transactions between reportable segments are accounted for on the accrual basis, and eliminated prior to external financial reporting. Inter-company eliminations between segments consist primarily of gas sales from the marketing and production operations to the natural gas operations, inter-company accounts receivable, accounts payable, equity, and subsidiary investment:
| | | | | | | | | | | | | | | | | | | | | | | | |
Year Ended December 31,
2012 | | | | | | | | | | | | | | | | | | |
| | | Natural Gas
Operations | | | Marketing
and
Production | | | Pipeline
Operations | | | Propane
Operations | | | Corporate and
Other | | | Consolidated | |
| | | | | | |
OPERATING REVENUES | | $ | 81,630,788 | | | $ | 13,417,723 | | | $ | 401,933 | | | $ | 4,614,915 | | | $ | - | | | $ | 100,065,359 | |
Intersegment eliminations | | | (324,837) | | | | (5,924,362) | | | | - | | | | - | | | | - | | | | (6,249,199) | |
| | | | | | | | | | | | | | | | | | | | | | | | |
Total operating revenue | | | 81,305,951 | | | | 7,493,361 | | | | 401,933 | | | | 4,614,915 | | | | - | | | | 93,816,160 | |
| | | | | | |
COST OF SALES | | | 42,810,640 | | | | 11,877,518 | | | | - | | | | 3,346,591 | | | | - | | | | 58,034,749 | |
Intersegment eliminations | | | (324,837) | | | | (5,924,362) | | | | - | | | | - | | | | - | | | | (6,249,199) | |
| | | | | | | | | | | | | | | | | | | | | | | | |
Total cost of sales | | | 42,485,803 | | | | 5,953,156 | | | | - | | | | 3,346,591 | | | | - | | | | 51,785,550 | |
| | | | | | | | | | | | | | | | | | | | | | | | |
| | | | | | |
GROSS MARGIN | | $ | 38,820,148 | | | $ | 1,540,205 | | | $ | 401,933 | | | $ | 1,268,324 | | | $ | - | | | $ | 42,030,610 | |
| | | | | | |
OPERATING EXPENSES | | | | | | | | | | | | | | | | | | | | | | | | |
Distribution, general and administrative | | | 19,806,389 | | | | 449,665 | | | | 87,640 | | | | 1,550,684 | | | | 236,315 | | | | 22,130,693 | |
Maintenance | | | 1,176,189 | | | | 1,014 | | | | 13,835 | | | | 67,593 | | | | - | | | | 1,258,631 | |
Depreciation and amortization | | | 4,662,313 | | | | 268,202 | | | | 61,085 | | | | 300,590 | | | | 34,542 | | | | 5,326,732 | |
Accretion | | | 113,106 | | | | 48,192 | | | | - | | | | - | | | | - | | | | 161,298 | |
Taxes other than income | | | 3,366,238 | | | | 38,052 | | | | 35,497 | | | | 72,975 | | | | 39,110 | | | | 3,551,872 | |
| | | | | | | | | | | | | | | | | | | | | | | | |
Total operating expenses | | | 29,124,235 | | | | 805,125 | | | | 198,057 | | | | 1,991,842 | | | | 309,967 | | | | 32,429,226 | |
| | | | | | | | | | | | | | | | | | | | | | | | |
| | | | | | |
OPERATING INCOME (LOSS) | | $ | 9,695,913 | | | $ | 735,080 | | | $ | 203,876 | | | $ | (723,518) | | | $ | (309,967) | | | $ | 9,601,384 | |
| | | | | | |
OTHER INCOME (EXPENSE) | | | 418,822 | | | | (6,051) | | | | - | | | | 16,272 | | | | (1,230,650) | | | | (801,607) | |
INTEREST EXPENSE | | | (2,512,444) | | | | (133,440) | | | | (13,528) | | | | (23,142) | | | | (40,781) | | | | (2,723,335) | |
Intersegment eliminations | | | - | | | | - | | | | - | | | | - | | | | - | | | | - | |
| | | | | | | | | | | | | | | | | | | | | | | | |
INCOME (LOSS) FROM | | | | | | | | | | | | | | | | | | | | | | | | |
CONTINUING OPERATIONS | | $ | 7,602,291 | | | $ | 595,589 | | | $ | 190,348 | | | $ | (730,388) | | | $ | (1,581,398) | | | $ | 6,076,442 | |
| | | | | | |
INCOME TAX BENEFIT | | | | | | | | | | | | | | | | | | | | | | | | |
(EXPENSE) | | | (3,135,445) | | | | 4,542 | | | | (97,523) | | | | 382,483 | | | | 488,818 | | | | (2,357,125) | |
| | | | | | | | | | | | | | | | | | | | | | | | |
| | | | | | |
NET INCOME (LOSS) | | $ | 4,466,846 | | | $ | 600,131 | | | $ | 92,825 | | | $ | (347,905) | | | $ | (1,092,580) | | | $ | 3,719,317 | |
| | | | | | | | | | | | | | | | | | | | | | | | |
| | | | | | |
Capital expenditures | | $ | 16,131,643 | | | $ | 1,393,040 | | | $ | 23,141 | | | $ | 51,771 | | | $ | 856,359 | | | $ | 18,455,954 | |
| | | | | | |
As of December 31, 2012 | | | | | | | | | | | | | | | | | | | | | | | | |
Investment in unconsolidated affiliate | | $ | - | | | $ | 321,731 | | | $ | - | | | $ | - | | | $ | - | | | $ | 321,731 | |
Goodwill | | $ | 14,891,377 | | | $ | - | | | $ | - | | | $ | - | | | $ | - | | | $ | 14,891,377 | |
| | | | | | |
Total assets | | $ | 169,616,395 | | | $ | 8,786,247 | | | $ | 632,466 | | | $ | 3,556,432 | | | $ | 64,887,276 | | | $ | 247,478,816 | |
Intersegment eliminations | | | (46,338,335) | | | | (447,549) | | | | (16,073) | | | | (2,096,143) | | | | (24,117,257) | | | | (73,015,357) | |
| | | | | | | | | | | | | | | | | | | | | | | | |
Total assets | | $ | 123,278,060 | | | $ | 8,338,698 | | | $ | 616,393 | | | $ | 1,460,289 | | | $ | 40,770,019 | | | $ | 174,463,459 | |
| | | | | | | | | | | | | | | | | | | | | | | | |
F-35
GAS NATURAL INC. AND SUBSIDIARIES
NOTES TO CONSOLIDATED FINANCIAL STATEMENTS
| | | | | | | | | | | | | | | | | | | | | | | | |
| Year Ended December 31, 2011 | | | | | | | | | | | | | | | | | | |
| | | Natural Gas
Operations | | | Marketing
and
Production | | | Pipeline
Operations | | | Propane
Operations | | | Corporate and
Other | | | Consolidated | |
| | | | | | |
OPERATING REVENUES | | $ | 90,325,379 | | | $ | 13,461,470 | | | $ | 417,768 | | | $ | 3,014,971 | | | $ | - | | | $ | 107,219,588 | |
Intersegment eliminations | | | (330,763) | | | | (7,671,532) | | | | - | | | | - | | | | - | | | | (8,002,295) | |
| | | | | | | | | | | | | | | | | | | | | | | | |
Total operating revenue | | | 89,994,616 | | | | 5,789,938 | | | | 417,768 | | | | 3,014,971 | | | | - | | | | 99,217,293 | |
| | | | | | |
COST OF SALES | | | 53,348,689 | | | | 12,142,036 | | | | - | | | | 2,695,187 | | | | - | | | | 68,185,912 | |
Intersegment eliminations | | | (330,763) | | | | (7,671,532) | | | | - | | | | - | | | | - | | | | (8,002,295) | |
| | | | | | | | | | | | | | | | | | | | | | | | |
Total cost of sales | | | 53,017,926 | | | | 4,470,504 | | | | - | | | | 2,695,187 | | | | - | | | | 60,183,617 | |
| | | | | | | | | | | | | | | | | | | | | | | | |
| | | | | | |
GROSS MARGIN | | $ | 36,976,690 | | | $ | 1,319,434 | | | $ | 417,768 | | | $ | 319,784 | | | $ | - | | | $ | 39,033,676 | |
| | | | | | |
OPERATING EXPENSES | | | | | | | | | | | | | | | | | | | | | | | | |
Distribution, general and administrative | | | 18,297,497 | | | | 517,155 | | | | 67,237 | | | | 597,620 | | | | 130,545 | | | | 19,610,054 | |
Maintenance | | | 1,061,672 | | | | 648 | | | | 18,076 | | | | 42,052 | | | | - | | | | 1,122,448 | |
Depreciation and amortization | | | 4,016,981 | | | | 285,254 | | | | 60,195 | | | | 102,451 | | | | - | | | | 4,464,881 | |
Accretion | | | 96,536 | | | | 45,678 | | | | - | | | | - | | | | - | | | | 142,214 | |
Taxes other than income | | | 3,330,549 | | | | 24,997 | | | | 25,853 | | | | 44,061 | | | | 26,400 | | | | 3,451,860 | |
| | | | | | | | | | | | | | | | | | | | | | | | |
Total operating expenses | | | 26,803,235 | | | | 873,732 | | | | 171,361 | | | | 786,184 | | | | 156,945 | | | | 28,791,457 | |
| | | | | | | | | | | | | | | | | | | | | | | | |
| | | | | | |
OPERATING INCOME (LOSS) | | $ | 10,173,455 | | | $ | 445,702 | | | $ | 246,407 | | | $ | (466,400) | | | $ | (156,945) | | | $ | 10,242,219 | |
| | | | | | |
OTHER INCOME (EXPENSE) | | | 638,583 | | | | (877,465) | | | | - | | | | 1,004,929 | | | | (282,903) | | | | 483,144 | |
| | | | | | |
INTEREST EXPENSE | | | (2,106,130) | | | | (87,744) | | | | (16,811) | | | | - | | | | (3,166) | | | | (2,213,851) | |
Intersegment eliminations | | | 180,248 | | | | - | | | | - | | | | - | | | | (180,248) | | | | - | |
| | | | | | | | | | | | | | | | | | | | | | | | |
| | | | | | |
INCOME (LOSS) FROM | | | | | | | | | | | | | | | | | | | | | | | | |
CONTINUING OPERATIONS | | $ | 8,886,156 | | | $ | (519,507) | | | $ | 229,596 | | | $ | 538,529 | | | $ | (623,262) | | | $ | 8,511,512 | |
| | | | | | |
INCOME TAX BENEFIT | | | | | | | | | | | | | | | | | | | | | | | | |
(EXPENSE) | | | (3,072,056) | | | | 232,393 | | | | (67,167) | | | | (283,313) | | | | 48,148 | | | | (3,141,995) | |
| | | | | | | | | | | | | | | | | | | | | | | | |
| | | | | | |
NET INCOME (LOSS) | | $ | 5,814,100 | | | $ | (287,114) | | | $ | 162,429 | | | $ | 255,216 | | | $ | (575,114) | | | $ | 5,369,517 | |
| | | | | | | | | | | | | | | | | | | | | | | | |
Capital expenditures | | $ | 22,495,616 | | | $ | - | | | $ | 19,248 | | | $ | 582,889 | | | $ | 107,765 | | | $ | 23,205,518 | |
| | | | | | |
As of December 31, 2011 | | | | | | | | | | | | | | | | | | | | | | | | |
Investment in unconsolidated affiliate | | $ | - | | | $ | 330,351 | | | $ | - | | | $ | - | | | $ | - | | | $ | 330,351 | |
Goodwill | | $ | 14,607,952 | | | $ | - | | | $ | - | | | $ | - | | | $ | - | | | $ | 14,607,952 | |
| | | | | | |
Total assets | | $ | 142,040,028 | | | $ | 5,900,392 | | | $ | 872,341 | | | $ | 3,638,634 | | | $ | 68,057,539 | | | $ | 220,508,934 | |
Intersegment eliminations | | | (50,723,758) | | | | (1,567,600) | | | | (28,368) | | | | (2,125,742) | | | | (9,652,052) | | | | (64,097,520) | |
| | | | | | | | | | | | | | | | | | | | | | | | |
Total assets | | $ | 91,316,270 | | | $ | 4,332,792 | | | $ | 843,973 | | | $ | 1,512,892 | | | $ | 58,405,487 | | | $ | 156,411,414 | |
| | | | | | | | | | | | | | | | | | | | | | | | |
F-36
GAS NATURAL INC. AND SUBSIDIARIES
NOTES TO CONSOLIDATED FINANCIAL STATEMENTS
Note 12 – Commitments and Contingencies
Commitments
Operating Leases
The Company leases certain properties including land, office buildings, and other equipment under non-cancelable operating leases. The future minimum lease payments on these leases are as follows for the years ended December 31:
| | | | |
2013 | | $ | 268,490 | |
2014 | | | 235,283 | |
2015 | | | 201,167 | |
2016 | | | 113,854 | |
2017 | | | 111,363 | |
Thereafter | | | 647,243 | |
| | | | |
Total | | $ | 1,577,400 | |
| | | | |
Lease expense resulting from operating leases for the years ended December 31, 2012 and 2011, totaled $537,097 and $541,290, respectively. Our projected future lease obligations have decreased due to the construction of our facilities in North Carolina and Maine extinguishing our rent obligations, and the purchase of the Ohio office building as disclosed in subsequent events.
Capital Leases
During 2012, the Company entered into an agreement with USPF whereby it is leasing certain pipeline and pipeline easement assets with future lease payments of $300,000 per year for the next ten years. The first annual installment is due and payable within a 30 day period beginning on the first anniversary of the commencement date, and each subsequent annual installment is due and payable within the applicable 30 day period commencing on each subsequent anniversary, subject to the right of the Company to defer a portion of each annual installment if chosen.
The agreement calls for a $120,000 facility service fee to be paid by the Company each year within a 30 day period beginning on the first anniversary of the commencement date, as long as the leased assets remain in place on the property. Also included in the agreement is a throughput charge of $0.0125 per Mcf moved through the leased pipeline. There were no throughput charge payments made during 2012. There was no facility service fee paid in 2012.
The agreement contains an initial term of sixteen years, with the option to renew for two additional sixteen year terms.
F-37
GAS NATURAL INC. AND SUBSIDIARIES
NOTES TO CONSOLIDATED FINANCIAL STATEMENTS
The following is a schedule by years of future minimum lease payments under capital leases together with the present value of the minimum lease payments with interest as of December 31, 2012.
Future Minimum Lease Payments
| | | | | | | | | | | | |
| | | Imputed Interest | | | Lease Payment | | | Total Payment | |
2013 | | $ | 132,482 | | | $ | 167,518 | | | $ | 300,000 | |
2014 | | | 122,431 | | | | 177,569 | | | | 300,000 | |
2015 | | | 111,776 | | | | 188,224 | | | | 300,000 | |
2016 | | | 100,483 | | | | 199,517 | | | | 300,000 | |
2017 | | | 88,512 | | | | 211,488 | | | | 300,000 | |
Thereafter | | | 236,290 | | | | 1,263,710 | | | | 1,500,000 | |
| | | | | | | | | | | | |
Total | | $ | 791,974 | | | $ | 2,208,026 | | | $ | 3,000,000 | |
| | | | | | | | | | | | |
The cost basis and accumulated depreciation of assets recorded under capital leases, which are included in Property, Plant, and Equipment on the Consolidated Balance Sheet are as follows as of December 31, 2012 and 2011:
| | | | | | | | |
| | | December 31 | |
| | | 2012 | | | 2011 | |
Cost | | $ | 6,320,000 | | | $ | - | |
Accumulated depreciation | | | (100,317) | | | | - | |
| | | | | | | | |
Net book value | | $ | 6,219,683 | | | $ | - | |
Depreciation expense recorded in connection with assets recorded under capital leases was $100,317 and $0 for the years ended December 31, 2012 and 2011, respectively.
Long-term Contracts
The Company has a long-term contract with Northwestern Energy for pipeline and storage capacity which commits the Company to purchase certain blocks of pipeline capacity through 2018 at the interconnect with the TransCanada pipeline. The Company has a companion contract with TransCanada for pipeline capacity of equal quantities and terms. Based on current tariff prices as specified in the contracts, the future obligations under these agreements at December 31, 2012 are as follows:
| | | | | | | | |
| | | Northwestern
Energy | | | Trans-Canada | |
2013 | | $ | 1,517,892 | | | $ | 921,977 | |
2014 | | | 1,517,892 | | | | 921,977 | |
2015 | | | 1,434,680 | | | | 829,775 | |
2016 | | | 519,356 | | | | 368,768 | |
2017 | | | 519,356 | | | | 368,768 | |
Thereafter | | | 476,076 | | | | 338,036 | |
| | | | | | | | |
Total | | $ | 5,985,252 | | | $ | 3,749,301 | |
| | | | | | | | |
F-38
GAS NATURAL INC. AND SUBSIDIARIES
NOTES TO CONSOLIDATED FINANCIAL STATEMENTS
The Company’s operating unit, Bangor Gas entered into an agreement with Maritimes and Northeast Pipeline for the transportation and storage of natural gas. Future obligations due to Maritimes and Northeast Pipeline:
| | | | |
2013 | | $ | 575,622 | |
2014 | | | 575,622 | |
2015 | | | 357,042 | |
2016 | | | 357,042 | |
2017 | | | 357,042 | |
Thereafter | | | 714,084 | |
| | | | |
Total | | $ | 2,936,454 | |
| | | | |
The Company also guarantees the gas supply obligations of its subsidiaries for up to $4.1 million of amounts purchased.
The Company’s marketing and production segment has several contracts to sell natural gas to customers at fixed prices that range from a low of $2.66 per Dkt to a high of $7.20 per Dkt. One of these contracts has a remaining term of two years with an approximate annual volume commitment of 344,000 Dkt. The remaining contracts have terms of less than one year, with a total approximate volume commitment of 954,000 Dkt.
Environmental Contingency
Included as part of the acquisition of Independence, the Company identified a piece of property that encountered a diesel fuel spill and required environmental cleanup. This property is currently used as a storage facility for the diesel fuel and propane that is utilized in daily operations. We have completed a voluntary remediation of the soil contaminants at the property and plan to monitor the site for future contaminants.
Approximately $25,000 and $75,000 was voluntarily incurred to evaluate and remediate the site during 2012, and 2011, respectively. We expect on-going remediation costs for 2013 of approximately $25,000 based on testing of the site for 2013.
Legal Proceedings
From time to time, the Company is involved in lawsuits that have arisen in the ordinary course of business. The Company is contesting each of these lawsuits vigorously and believes it has defenses to the allegations that have been made.
On June 20, 2012, Gas Natural was named as a defendant in a lawsuit captioned RBS Citizens N.A., dba Charter One v. Richard M. Osborne, Gas Natural Inc. (f/k/a Energy, Inc.) and the Richard M. Osborne Trust, Case No. CV-12-784656, which was filed in the Cuyahoga County Court of Common Pleas in Ohio. In an effort to collect on judgments obtained against Richard M. Osborne, our chairman and chief executive officer of Gas Natural, the complaint seeks (1) an order requiring Gas Natural to pay over to RBS Citizens any distributions due to Mr. Osborne by virtue of his ownership in Gas Natural as well as any proceeds payable to him as part of the previously announced proposed acquisition of JDOG Marketing, (2) the imposition of a constructive trust on dividends or assets that Mr. Osborne might receive as part of the acquisition of JDOG Marketing and (3) an injunction preventing the acquisition of JDOG Marketing. We believe the claims concerning the JDOG Marketing transaction to be without merit and have filed a motion for summary judgment. The parties are currently in settlement discussions in an effort to resolve this matter, although there can be no guaranty that the parties will be able to reach a mutually acceptable resolution.
F-39
GAS NATURAL INC. AND SUBSIDIARIES
NOTES TO CONSOLIDATED FINANCIAL STATEMENTS
In 2010, Bangor Gas Company, the Company’s Maine utility, asserted a claim against H.Q. Energy Services (US), Inc. (HQ) for a breach of a firm gas transportation service agreement between the parties. HQ filed a counterclaim against the Company for reimbursement of certain transportation charges that HQ paid to a third party. The parties agreed to arbitration and on September 1, 2011, the arbitrators awarded HQ the sum of approximately $280,000 for past transportation charges that HQ paid to the Company. The arbitrators also ordered the Company to pay future transportation charges that will be incurred during the remaining term of the agreement while HQ was ordered to pay the Company for future fuel reimbursements for the remaining term of the agreement. On September 23, 2011, the arbitrators clarified their initial order to require HQ to reimburse the Company for the past transportation charges awarded by the arbitrators if the FERC determined that our payment of the transportation charges was not consistent with FERC policy. On November 10, 2011, the FERC’s Office of General Counsel issued a no-action letter indicating that the FERC staff could not assure the Company that the FERC would not recommend enforcement action if the Company made the payments to HQ required by the arbitration award. As a result, on November 30, 2011, the Company filed an action in the United States District Court, District of Maine against HQ seeking to vacate the arbitration award against the Company and confirm that portion of the award requiring HQ to return the transportation payments to the Company and obtain an award of past fuel reimbursements in addition to the prospective award made by the arbitrators. On March 1, 2012, the court issued an order confirming the arbitration award against the Company, rejecting the Company’s claim for past fuel costs, and denying the Company’s claim for reimbursement of transportation charges on the grounds that the FERC no-action letter was not a final, binding finding by the FERC of the consistency of the payments with FERC policy. On March 30, 2012, the Company filed an action with the United States Court of Appeals for the First Circuit appealing the district court’s decision in its entirety. The appeal has been briefed; oral arguments have been heard; and The parties are awaiting the Court’s decision.
Additionally, we also made a claim against HQ for personal property and real estate tax reimbursements which the Company claimed were due under the transportation contract with HQ. The parties participated in an arbitration hearing in connection with this matter on August 14 and 15, 2012, and on October 30, 2012, the arbitrators ruled that no reimbursements were due from HQ under the contract.
The Company is contesting each of these lawsuits vigorously and believes it has defenses to the allegations that have been made. .In our opinion, the outcome of these legal actions will not have a material adverse effect on our financial condition, cash flows or results of operations.
Note 13 – Financial Instruments and Risk Management
Management of Risks Related to Fixed Contracts
The Company and its subsidiaries are subject to certain risks related to changes in certain commodity prices and risks of counterparty performance. The Company has established policies and procedures to manage such risks. The Company has a Risk Management Committee comprised of Company officers and management to oversee the risk management program as defined in its risk management policy. The purpose of the risk management program is to minimize adverse impacts on earnings resulting from volatility of energy prices, counterparty credit risks, and other risks related to the energy commodity business.
In order to mitigate the risk of natural gas market price volatility related to firm commitments to purchase or sell natural gas, from time to time the Company and its subsidiaries have entered into fixed contracts. Such arrangements may be used to protect profit margins on future obligations to deliver gas at a fixed price, or to protect against adverse effects of potential market price declines on future obligations to purchase gas at fixed prices.
F-40
GAS NATURAL INC. AND SUBSIDIARIES
NOTES TO CONSOLIDATED FINANCIAL STATEMENTS
The Company accounts for these contracts in accordance with ASC 815, Derivatives and Hedging. In accordance with ASC 815, such contracts are reflected in the balance sheet as assets or liabilities and valued at “fair value,” determined as of the balance sheet date. Fair value accounting treatment is also referred to as “mark-to-market” accounting. Mark-to-market accounting results in disparities between reported earnings and realized cash flow. The changes in the derivative values are reported in the statement of comprehensive income as an increase or (decrease) in revenues without regard to whether any cash payments have been made between the parties to the contract. ASC 815 specifies that contracts for purchase or sale at fixed prices and volumes must be valued at fair value (under mark-to-market accounting) unless the contracts qualify for treatment as a “normal purchase or normal sale.”
For the years ended December 31, 2012 and 2011, all of the Company’s fixed contracts for purchase or sale at fixed prices and volumes qualified for treatment as a “normal purchase or normal sale.”
Note 14 – Subsequent Events
On August 15, 2012, we entered into an asset purchase agreement with JDOG Marketing and Richard M. Osborne, as trustee of the Osborne Trust. JDOG Marketing is engaged in the business of marketing natural gas. The purchase agreement provides for the acquisition of substantially all of the assets, rights, and properties of JDOG Marketing by Gas Natural. As consideration for the purchase of the assets, we will pay JDOG Marketing the sum of $2,875,000 at closing, paid by the issuance of 256,926 shares of our common stock at a price of $11.19 per share. In addition, the purchase agreement provides for contingent “earn-out” payments for a period of five years after the closing of the transaction if JDOG Marketing achieves an annual EBITDA target in the amount of $810,432, which is JDOG Marketing’s EBITDA for the year-ended December 31, 2011. If actual EBITDA for a certain year is less than target EBITDA, then no earn-out payment will be due and payable for that particular earn-out period. We obtained shareholder approval of the transaction on March 1, 2013. The consummation of the transaction is subject to the satisfaction or waiver of the receipt of regulatory approvals and the consent of certain of our lenders.
The Company declared a dividend of $0.045 per share on January 30, 2013 that is payable to shareholders of record on February 15, 2013. There were 8,389,752 shares outstanding on February 15, 2013 resulting in a total dividend of $377,539 which was paid to shareholders on February 28, 2013.
The Company declared a dividend of $0.045 per share on February 27, 2013 that is payable to shareholders of record on March 15, 2013. There were 8,389,752 shares outstanding on March 19, 2013 resulting in a total dividend of $377,539 which was paid to shareholders on March 29, 2013.
On March 5, 2013, we purchased the Matchworks Building in Mentor, Ohio from McKay Real Estate Corporation, Matchworks, LLC, and Nathan Properties, LLC (collectively, the “Sellers”). Our Ohio headquarters are located in the Matchworks Building and we had the opportunity to purchase the building because it had fallen into receivership. The purchase price for the building was $1.5 million plus payment of real estate taxes and certain costs to date related to the transaction totaling approximately $280,000. The closing The Sellers are entities owned or controlled by Richard M. Osborne, our chairman and chief executive officer. The acquisition of the Matchworks Building was approved by the independent members of our board of directors.
PGC sought permission to increase its rates with the KPSC in Case No. 2012-00431. The original filing, as amended, was for an increase of $313,838. Per the KPSC’s order dated March 27, 2013, the Commission granted an increase of $268,147. PGC’s total annual revenue requirements with the increase are $524,686.
F-41