EXHIBIT B
Exhibit A
Presentation to
The Special Committee of the Board of Directors
Bestway, Inc.
October 25, 2004
1201 Elm Street, Suite 3500
Dallas, Texas 75270
(214) 859-5800
Preface
This book has been prepared by Southwest Securities, Inc. (“SWS”) as part of a presentation being made in support of our opinion as to the fairness of the terms of the proposed transaction from a financial point of view. The material in this book and our analyses contained herein are confidential and are for the use of the Special Committee of the Board of Directors of Bestway, Inc. (“Bestway” or the “Company”) and its advisors only. Any publication or use of this material or the analyses contained herein without the express written consent of SWS is strictly prohibited.
Among the activities conducted in the course of our engagement as financial advisor, SWS received and reviewed business and financial information of the Company as developed by the Company and held discussions with the management of the Company regarding this information. In connection with the analysis contained herein, we have not independently verified any such information and have relied on all such information as being complete and accurate in all material respects. In addition, we have not obtained any independent appraisal of the assets of the Company.
Several analytical methodologies have been employed herein and no one method of analysis should be regarded as critical to the overall conclusion we have reached. Each analytical technique has inherent strengths and weaknesses, and the nature of the available information may further affect the value of particular techniques. The conclusions we have reached are based on all the analyses and factors presented herein taken as a whole and also on application of our own experience and judgment. Such conclusion may involve significant elements of subjective judgment or qualitative analysis. We therefore give no opinion as to the value or merit standing alone of any one or more parts of the material that follows. Our only opinion is the formal written opinion we have expressed as to the fairness from a financial point of view. The opinion, the analyses contained herein and all conclusions drawn from such analyses are necessarily based upon market, economic and other conditions that exist and can be evaluated as of the date of this book.
Table of Contents
Executive Summary 1
Historical Price and Volume Performance 2
Selected Comparable Public Companies 3
Merger and Acquisition Transactions 4
Discounted Cash Flow Analysis 5
Reverse Split Going Private Transaction Analysis 6
Summary Valuation Analysis 7
Rationale and Conclusions 8
Executive Summary
Executive Summary
The management of Bestway has proposed a reverse and forward stock split resulting in a going private transaction.
The Company plans to effect a reverse split of the Company’s common stock at a ratio of 1 for 100, followed immediately by a forward 100 for 1 split of the common stock, and to provide for payment in cash to those stockholders holding, prior to the reverse stock split, fewer than 100 shares of common stock.
As of October 2004, the Company estimates that 296 of the approximate 366 stockholders of record have less than 100 shares.
After the reverse and forward split, with fractional share repurchases, the Company estimates it will have approximately 70 stockholders.
Once the Company has fewer than 300 stockholders, it can terminate its public company status.
Stockholders owning less than 100 shares of common stock prior to the reverse split will receive cash in lieu of the fractional shares created as a result of the reverse split.
No commissions will be charged to stockholders who receive cash in lieu of fractional shares.
You have asked for our recommendation as to the appropriate cash payment amount per share for the fractional shares to be held by stockholders presently owning less than 100 shares of the Company’s common stock.
Executive Summary
Public |
| company costs are high and increasing: |
The costs related to the Sarbanes-Oxley Act, increased D&O insurance expenses, audit costs and the implementation of related corporate governance reforms have become prohibitive.
The costs associated with retaining public status, servicing stockholders and continuing public communication remain high.
The time demands on management and employees associated with public company status are significant:
Preparing public reports, filings, press releases and Regulation FD compliance.
Since the Company has relatively few executive personnel, these indirect costs can be substantial.
Investor relations and communication with stockholders takes management time.
Stockholders are unable to benefit fully from public company status due to limited liquidity and the Company’s micro-cap classification:
Stockholders are not able to move into or out of stock positions without materially impacting the market price.
The Company is not able to raise capital conventionally in public markets.
The Company is not an attractive investment for institutional investors.
The Company is not able to effectively use shares for acquisitions.
Executive Summary
Other |
| strategic alternatives have been examined by management and determined to be either unattractive or not viable: |
Maintain status quo – Continue to shoulder public company costs without the associated benefits.
M&A opportunities – Management and significant stockholders have determined not to pursue this alternative at this time.
A reverse split provides multiple benefits:
Reduces direct and indirect costs.
Saves management and employee time.
Stockholders can exit the investment at a premium to current prices or retain a position in a private company.
Small stockholders are able to sell without a commission.
Small stockholders can retain ownership by acquiring additional shares.
The cash demands on the Company to accomplish the reverse split are predictable.
Executive Summary - Overview of the Company
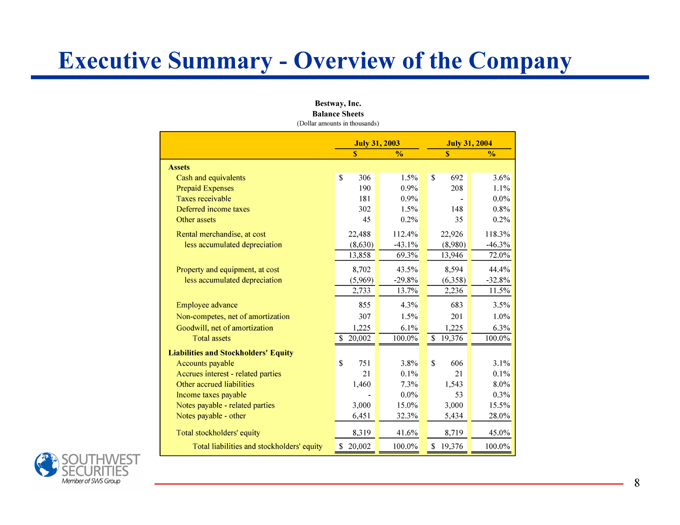
Bestway, Inc.
Balance Sheets
(Dollar amounts in thousands)
July 31, 2003 July 31, 2004
$ % $ %
Assets
Cash and equivalents $ 306 1.5% $ 692 3.6%
Prepaid Expenses 190 0.9% 208 1.1%
Taxes receivable 181 0.9% - 0.0%
Deferred income taxes 302 1.5% 148 0.8%
Other assets 45 0.2% 35 0.2%
Rental merchandise, at cost 22,488 112.4% 22,926 118.3%
less accumulated depreciation (8,630) -43.1% (8,980) -46.3%
13,858 69.3% 13,946 72.0%
Property and equipment, at cost 8,702 43.5% 8,594 44.4%
less accumulated depreciation (5,969) -29.8% (6,358) -32.8%
2,733 13.7% 2,236 11.5%
Employee advance 855 4.3% 683 3.5%
Non-competes, net of amortization 307 1.5% 201 1.0%
Goodwill, net of amortization 1,225 6.1% 1,225 6.3%
Total assets $ 20,002 100.0% $ 19,376 100.0%
Liabilities and Stockholders' Equity
Accounts payable $ 751 3.8% $ 606 3.1%
Accrues interest - related parties 21 0.1% 21 0.1%
Other accrued liabilities 1,460 7.3% 1,543 8.0%
Income taxes payable - 0.0% 53 0.3%
Notes payable - related parties 3,000 15.0% 3,000 15.5%
Notes payable - other 6,451 32.3% 5,434 28.0%
Total stockholders' equity 8,319 41.6% 8,719 45.0%
Total liabilities and stockholders' equity $ 20,002 100.0% $ 19,376 100.0%
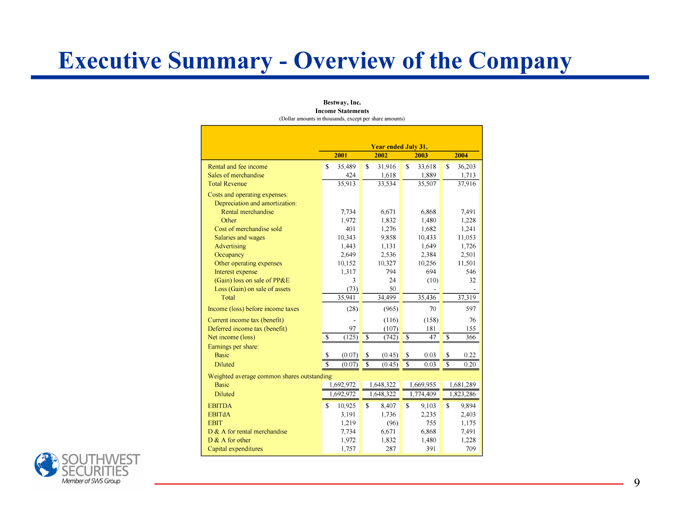
Executive Summary-Overview of the Company
Bestway, Inc.
Income Statements
(Dollar amounts in thousands, except per share amounts)
Year ended July 31,
2001 2002 2003 2004
Rental and fee income $ 35,489 $ 31,916 $ 33,618 $ 36,203
Sales of merchandise 424 1,618 1,889 1,713
Total Revenue 35,913 33,534 35,507 37,916
Costs and operating expenses:
Depreciation and amortization:
Rental merchandise 7,734 6,671 6,868 7,491
Other 1,972 1,832 1,480 1,228
Cost of merchandise sold 401 1,276 1,682 1,241
Salaries and wages 10,343 9,858 10,433 11,053
Advertising 1,443 1,131 1,649 1,726
Occupancy 2,649 2,536 2,384 2,501
Other operating expenses 10,152 10,327 10,256 11,501
Interest expense 1,317 794 694 546
(Gain) loss on sale of PP&E 3 24 (10) 32
Loss (Gain) on sale of assets (73) 50 - -
Total 35,941 34,499 35,436 37,319
Income (loss) before income taxes (28) (965) 70 597
Current income tax (benefit) - (116) (158) 76
Deferred income tax (benefit) 97 (107) 181 155
Net income (loss) $ (125) $ (742) $ 47 $ 366
Earnings per share:
Basic $ (0.07) $ (0.45) $ 0.03 $ 0.22
Diluted $ (0.07) $ (0.45) $ 0.03 $ 0.20
Weighted average common shares outstanding:
Basic 1,692,972 1,648,322 1,669,955 1,681,289
Diluted 1,692,972 1,648,322 1,774,409 1,823,286
EBITDA $ 10,925 $ 8,407 $ 9,103 $ 9,894
EBITdA 3,191 1,736 2,235 2,403
EBIT 1,219 (96) 755 1,175
D & A for rental merchandise 7,734 6,671 6,868 7,491
D & A for other 1,972 1,832 1,480 1,228
Capital expenditures 1,757 287 391 709
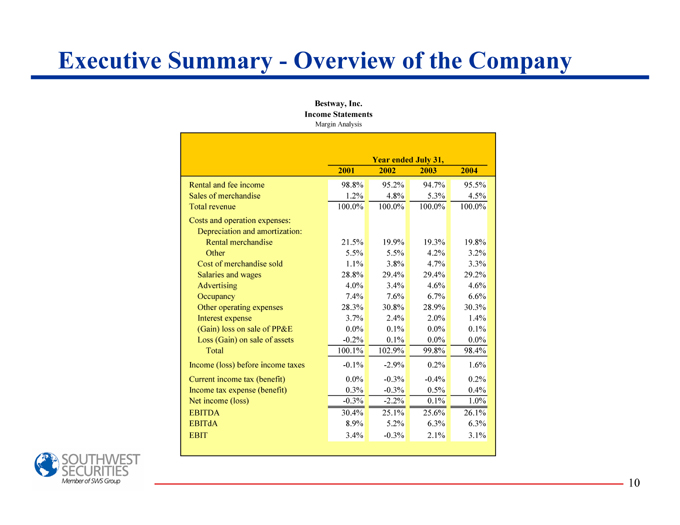
Executive Summary - Overview of the Company
Bestway, Inc.
Income Statements
Margin Analysis
Year ended July 31,
2001 2002 2003 2004
Rental and fee income 98.8% 95.2% 94.7% 95.5%
Sales of merchandise 1.2% 4.8% 5.3% 4.5%
Total revenue 100.0% 100.0% 100.0% 100.0%
Costs and operation expenses:
Depreciation and amortization:
Rental merchandise 21.5% 19.9% 19.3% 19.8%
Other 5.5% 5.5% 4.2% 3.2%
Cost of merchandise sold 1.1% 3.8% 4.7% 3.3%
Salaries and wages 28.8% 29.4% 29.4% 29.2%
Advertising 4.0% 3.4% 4.6% 4.6%
Occupancy 7.4% 7.6% 6.7% 6.6%
Other operating expenses 28.3% 30.8% 28.9% 30.3%
Interest expense 3.7% 2.4% 2.0% 1.4%
(Gain) loss on sale of PP&E 0.0% 0.1% 0.0% 0.1%
Loss (Gain) on sale of assets -0.2% 0.1% 0.0% 0.0%
Total 100.1% 102.9% 99.8% 98.4%
Income (loss) before income taxes -0.1% -2.9% 0.2% 1.6%
Current income tax (benefit) 0.0% -0.3% - -0.4% 0.2%
Income tax expense (benefit) 0.3% -0.3% 0.5% 0.4%
Net income (loss) -0.3% -2.2% 0.1% 1.0%
EBITDA 30.4% 25.1% 25.6% 26.1%
EBITdA 8.9% 5.2% 6.3% 6.3%
EBIT 3.4% -0.3% 2.1% 3.1%
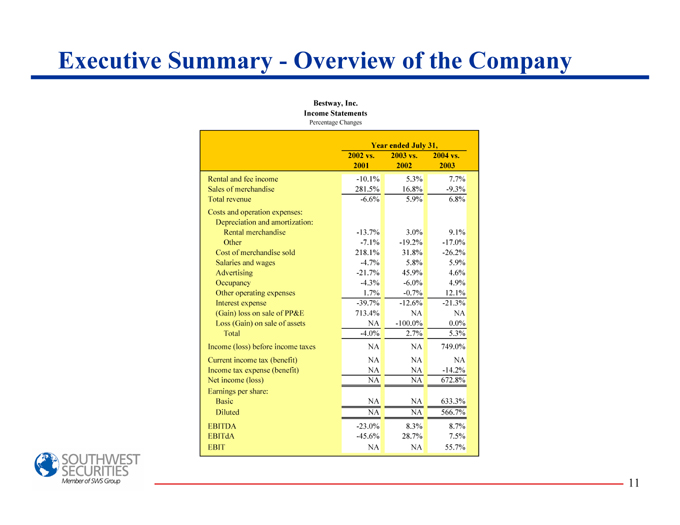
Executive Summary - Overview of the Company
Bestway, Inc.
Income Statements
Percentage Changes
Year ended July 31,
2002 vs. 2003 vs. 2004 vs.
2001 2002 2003
Rental and fee income -10.1% 5.3% 7.7%
Sales of merchandise 281.5% 16.8% -9.3%
Total revenue -6.6% 5.9% 6.8%
Costs and operation expenses:
Depreciation and amortization:
Rental merchandise -13.7% 3.0% 9.1%
Other -7.1% -19.2% -17.0%
Cost of merchandise sold 218.1% 31.8% -26.2%
Salaries and wages -4.7% 5.8% 5.9%
Advertising -21.7% 45.9% 4.6%
Occupancy -4.3% -6.0% 4.9%
Other operating expenses 1.7% -0.7% 12.1%
Interest expense -39.7% -12.6% - -21.3%
(Gain) loss on sale of PP&E 713.4% NA NA
Loss (Gain) on sale of assets NA -100.0% 0.0%
Total -4.0% 2.7% 5.3%
Income (loss) before income taxes NA NA 749.0%
Current income tax (benefit) NA NA NA
Income tax expense (benefit) NA NA -14.2%
Net income (loss) NA NA 672.8%
Earnings per share:
Basic NA NA 633.3%
Diluted NA NA 566.7%
EBITDA -23.0% 8.3% 8.7%
EBITdA -45.6% 28.7% 7.5%
EBIT NA NA 55.7%
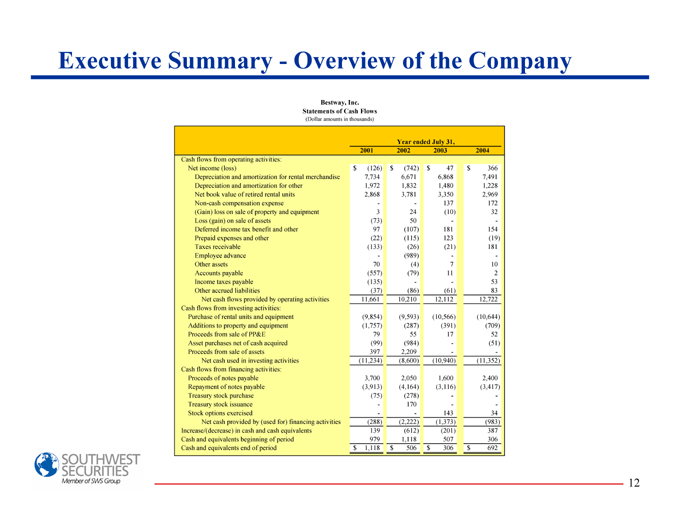
Executive Summary - Overview of the Company
Bestway, Inc.
Statements of Cash Flows
(Dollar amounts in thousands)
Year ended July 31,
2001 2002 2003 2004
Cash flows from operating activities:
Net income (loss) $ (126) $ (742) $ 47 $ 366
Depreciation and amortization for rental merchandise 7,734 6,671 6,868 7,491
Depreciation and amortization for other 1,972 1,832 1,480 1,228
Net book value of retired rental units 2,868 3,781 3,350 2,969
Non-cash compensation expense - - 137 172
(Gain) loss on sale of property and equipment 3 24 (10) 32
Loss (gain) on sale of assets (73) 50 - -
Deferred income tax benefit and other 97 (107) 181 154
Prepaid expenses and other (22) (115) 123 (19)
Taxes receivable (133) (26) (21) 181
Employee advance - (989) - -
Other assets 70 (4) 7 10
Accounts payable (557) (79) 11 2
Income taxes payable (135) - - 53
Other accrued liabilities (37) (86) (61) 83
Net cash flows provided by operating activities 11,661 10,210 12,112 12,722
Cash flows from investing activities:
Purchase of rental units and equipment (9,854) (9,593) (10,566) (10,644)
Additions to property and equipment (1,757) (287) (391) (709)
Proceeds from sale of PP&E 79 55 17 52
Asset purchases net of cash acquired (99) (984) - (51)
Proceeds from sale of assets 397 2,209 - -
Net cash used in investing activities (11,234) (8,600) (10,940) (11,352)
Cash flows from financing activities:
Proceeds of notes payable 3,700 2,050 1,600 2,400
Repayment of notes payable (3,913) (4,164) (3,116) (3,417)
Treasury stock purchase (75) (278) - -
Treasury stock issuance - 170 - -
Stock options exercised - - 143 34
Net cash provided by (used for) financing activities (288) (2,222) (1,373) (983)
Increase/(decrease) in cash and cash equivalents 139 (612) (201) 387
Cash and equivalents beginning of period 979 1,118 507 306
Cash and equivalents end of period $ 1,118 $ 506 $ 306 $ 692
Historical Price and Volume Performance
Historical Price and Volume Performance
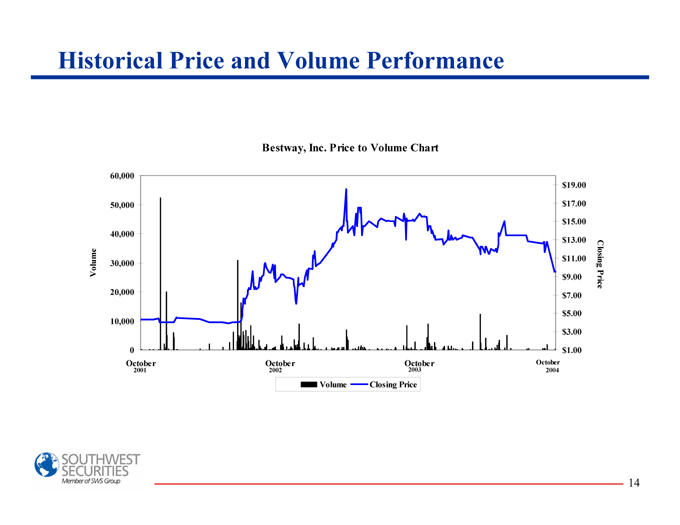
Bestway, Inc. Price to Volume Chart
Volume
0
10,000
20,000
30,000
40,000
50,000
60,000
October October October
October
2004 2003 2002 2001
Closing Price
$1.00
$3.00
$5.00
$7.00
$9.00
$11.00
$13.00
$15.00
$17.00
$19.00
Volume Closing Price
Historical Price and Volume Performance
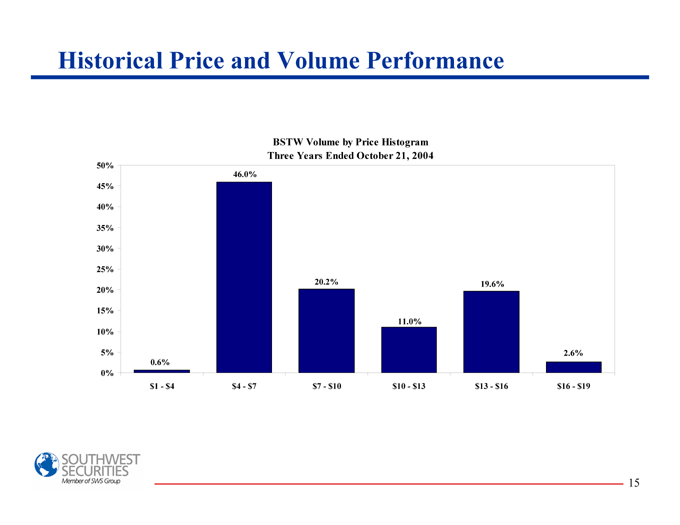
BSTW Volume by Price Histogram
Three Years Ended October 21, 2004
0%
5%
10%
15%
20%
25%
30%
35%
40%
45%
50%
0.6%
2.6%
20.2% 19.6%
11.0%
46.0%
$1 - $4 $4 - $7 $7 - $10 $10 - $13 $13 - $16 $16 - $19
Historical Price and Volume Performance
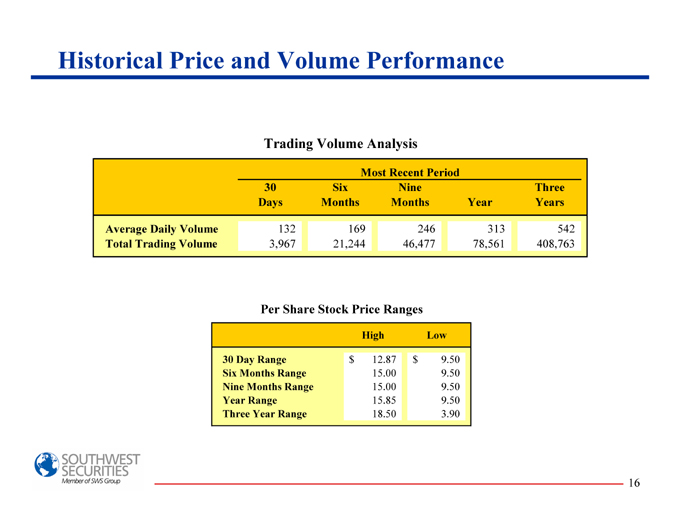
Trading Volume Analysis
Most Recent Period
30 Six Nine Three
Days Months Months Year Years
Average Daily Volume 132 169 246 313 542
Total Trading Volume 3,967 21,244 46,477 78,561 408,763
Per Share Stock Price Ranges
High Low
30 Day Range $ 12.87 $ 9.50
Six Months Range 15.00 9.50
Nine Months Range 15.00 9.50
Year Range 15.85 9.50
Three Year Range 18.50 3.90

Selected Comparable Public Companies
Selected Comparable Public Companies
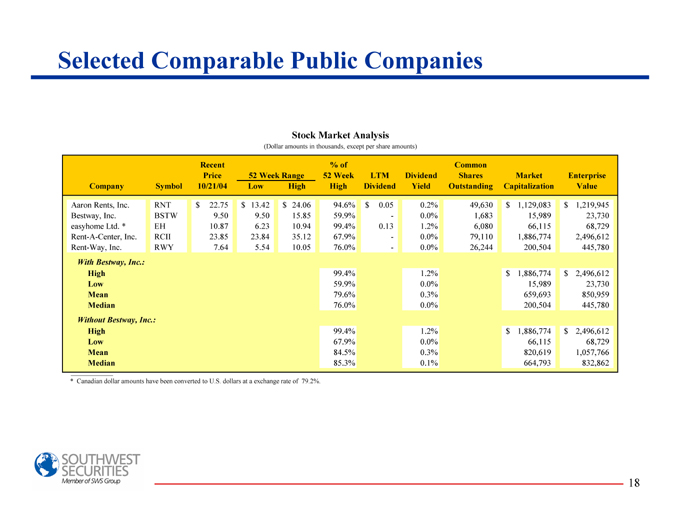
Stock Market Analysis
(Dollar amounts in thousands, except per share amounts)
Recent % of Common
Price 52 Week Range 52 Week LTM Dividend Shares Market Enterprise
Company Symbol 10/21/04 Low High High Dividend Yield Outstanding Capitalization Value
Aaron Rents, Inc. RNT $ 22.75 $ 13.42 $ 24.06 94.6% $ 0.05 0.2% 49,630 $ 1,129,083 $ 1,219,945
Bestway, Inc. BSTW 9.50 9.50 15.85 59.9% - 0.0% 1,683 15,989 23,730
easyhome Ltd. * EH 10.87 6.23 10.94 99.4% 0.13 1.2% 6,080 66,115 68,729
Rent-A-Center, Inc. RCII 23.85 23.84 35.12 67.9% - 0.0% 79,110 1,886,774 2,496,612
Rent-Way, Inc. RWY 7.64 5.54 10.05 76.0% - 0.0% 26,244 200,504 445,780
With Bestway, Inc.:
High 99.4% 1.2% $ 1,886,774 $ 2,496,612
Low 59.9% 0.0% 15,989 23,730
Mean 79.6% 0.3% 659,693 850,959
Median 76.0% 0.0% 200,504 445,780
Without Bestway, Inc.:
High 99.4% 1.2% $ 1,886,774 $ 2,496,612
Low 67.9% 0.0% 66,115 68,729
Mean 84.5% 0.3% 820,619 1,057,766
Median 85.3% 0.1% 664,793 832,862
* Canadian dollar amounts have been converted to U.S. dollars at a exchange rate of 79.2%.
Selected Comparable Public Companies
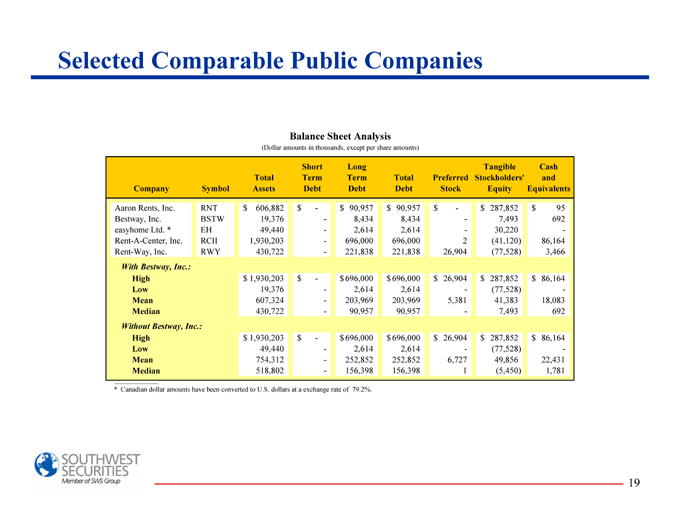
Balance Sheet Analysis
(Dollar amounts in thousands, except per share amounts)
Short Long Tangible Cash
Total Term Term Total Preferred Stockholders' and
Company Symbol Assets Debt Debt Debt Stock Equity Equivalents
Aaron Rents, Inc. RNT $ 606,882 $ - $ 90,957 $ 90,957 $ - $ 287,852 $ 95
Bestway, Inc. BSTW 19,376 - 8,434 8,434 - 7,493 692
easyhome Ltd. * EH 49,440 - 2,614 2,614 - 30,220 -
Rent-A-Center, Inc. RCII 1,930,203 - 696,000 696,000 2 (41,120) 86,164
Rent-Way, Inc. RWY 430,722 - 221,838 221,838 26,904 (77,528) 3,466
With Bestway, Inc.:
High $ 1,930,203 $ - $ 696,000 $ 696,000 $ 26,904 $ 287,852 $ 86,164
Low 19,376 - 2,614 2,614 - (77,528) -
Mean 607,324 - 203,969 203,969 5,381 41,383 18,083
Median 430,722 - 90,957 90,957 - 7,493 692
Without Bestway, Inc.:
High $ 1,930,203 $ - $ 696,000 $ 696,000 $ 26,904 $ 287,852 $ 86,164
Low 49,440 - 2,614 2,614 - (77,528) -
Mean 754,312 - 252,852 252,852 6,727 49,856 22,431
Median 518,802 - 156,398 156,398 1 (5,450) 1,781
* Canadian dollar amounts have been converted to U.S. dollars at a exchange rate of 79.2%.
Selected Comparable Public Companies
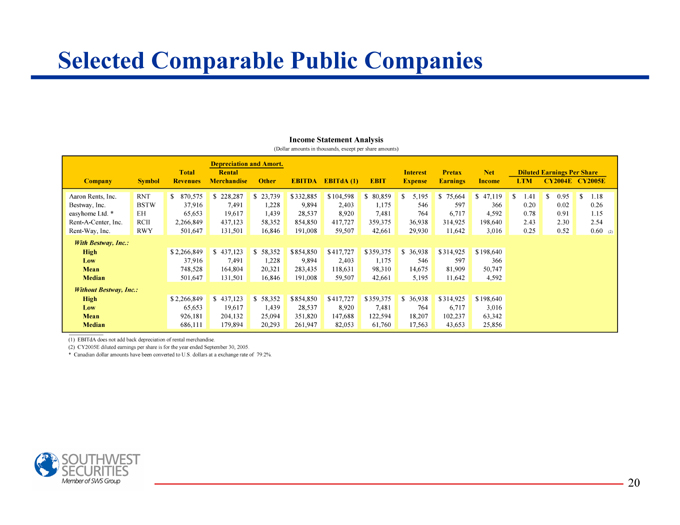
Income Statement Analysis
(Dollar amounts in thousands, except per share amounts)
Depreciation and Amort.
Total Rental Interest Pretax Net Diluted Earnings Per Share
Company Symbol Revenues Merchandise Other EBITDA EBITdA (1) EBIT Expense Earnings Income LTM CY2004E CY2005E
Aaron Rents, Inc. RNT $ 870,575 $ 228,287 $ 23,739 $ 332,885 $ 104,598 $ 80,859 $ 5,195 $ 75,664 $ 47,119 $ 1.41 $ 0.95 $ 1.18
Bestway, Inc. BSTW 37,916 7,491 1,228 9,894 2,403 1,175 546 597 366 0.20 0.02 0.26
easyhome Ltd. * EH 65,653 19,617 1,439 28,537 8,920 7,481 764 6,717 4,592 0.78 0.91 1.15
Rent-A-Center, Inc. RCII 2,266,849 437,123 58,352 854,850 417,727 359,375 36,938 314,925 198,640 2.43 2.30 2.54
Rent-Way, Inc. RWY 501,647 131,501 16,846 191,008 59,507 42,661 29,930 11,642 3,016 0.25 0.52 0.60 (2)
With Bestway, Inc.:
High $ 2,266,849 $ 437,123 $ 58,352 $ 854,850 $ 417,727 $ 359,375 $ 36,938 $ 314,925 $ 198,640
Low 37,916 7,491 1,228 9,894 2,403 1,175 546 597 366
Mean 748,528 164,804 20,321 283,435 118,631 98,310 14,675 81,909 50,747
Median 501,647 131,501 16,846 191,008 59,507 42,661 5,195 11,642 4,592
Without Bestway, Inc.:
High $ 2,266,849 $ 437,123 $ 58,352 $ 854,850 $ 417,727 $ 359,375 $ 36,938 $ 314,925 $ 198,640
Low 65,653 19,617 1,439 28,537 8,920 7,481 764 6,717 3,016
Mean 926,181 204,132 25,094 351,820 147,688 122,594 18,207 102,237 63,342
Median 686,111 179,894 20,293 261,947 82,053 61,760 17,563 43,653 25,856
(1) EBITdA does not add back depreciation of rental merchandise.
(2) CY2005E diluted earnings per share is for the year ended September 30, 2005.
* Canadian dollar amounts have been converted to U.S. dollars at a exchange rate of 79.2%.
Selected Comparable Public Companies
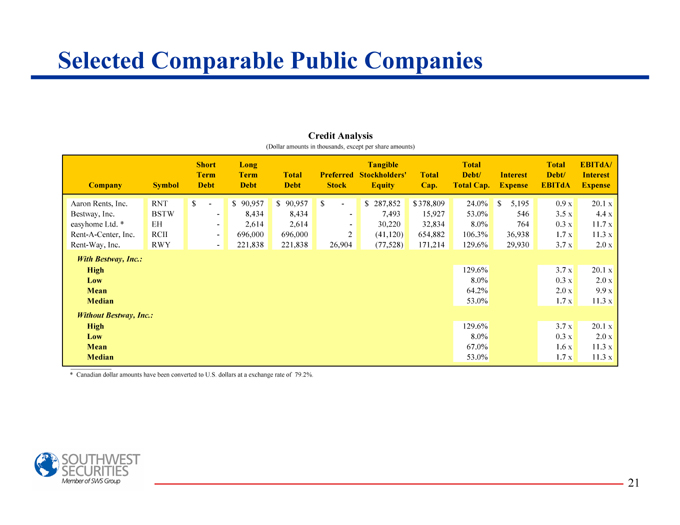
Credit Analysis
(Dollar amounts in thousands, except per share amounts)
Short Long Tangible Total Total EBITdA/
Term Term Total Preferred Stockholders’ Total Debt/ Interest Debt/ Interest
Company Symbol Debt Debt Debt Stock Equity Cap. Total Cap. Expense EBITdA Expense
Aaron Rents, Inc. RNT -$ $ 90,957 $ 90,957 -$ $ 287,852 $ 378,809 24.0% $ 5,195 0.9 x 20.1 x
Bestway, Inc. BSTW - 8,434 8,434 - 7,493 15,927 53.0% 546 3.5 x 4.4 x
easyhome Ltd. * EH - 2,614 2,614 - 30,220 32,834 8.0% 764 0.3 x 11.7 x
Rent-A-Center, Inc. RCII - 696,000 696,000 2 (41,120) 654,882 106.3% 36,938 1.7 x 11.3 x
Rent-Way, Inc. RWY - 221,838 221,838 26,904 (77,528) 171,214 129.6% 29,930 3.7 x 2.0 x
With Bestway, Inc.:
High 129.6% 3.7 x 20.1 x
Low 8.0% 0.3 x 2.0 x
Mean 64.2% 2.0 x 9.9 x
Median 53.0% 1.7 x 11.3 x
Without Bestway, Inc.:
High 129.6% 3.7 x 20.1 x
Low 8.0% 0.3 x 2.0 x
Mean 67.0% 1.6 x 11.3 x
Median 53.0% 1.7 x 11.3 x
* Canadian dollar amounts have been converted to U.S. dollars at a exchange rate of 79.2%.

Selected Comparable Public Companies
Store Analysis
(Dollar amounts in thousands, except per share amounts)
Current Stores (1) Average Stores (2) Per Current Store (3) Per Average Owned Store
Owned Franchise Total Owned Franchise Total Total Net Rental Total Total
Company Symbol Stores Stores Stores Stores Stores Stores Assets Merchandise Debt Revenue EBITdA EBIT
Aaron Rents, Inc. RNT 620 324 944 562 287 848 $ 643 $ 409 96$ $ 1,550 186 $ $ 144
Bestway, Inc. BSTW 69 - 69 69 - 69 281 202 122 550 35 17
easyhome Ltd. * EH 135 - 135 133 - 133 366 207 19 495 67 56
Rent-A-Center, Inc. RCII 2,846 319 3,165 2,707 320 3,027 610 233 220 838 154 133
Rent-Way, Inc. RWY 754 - 754 754 - 754 571 219 294 666 79 57
With Bestway, Inc.:
High 2,846 324 3,165 2,707 320 3,027 $ 643 $ 409 294$ $ 1,550 186 $ $ 144
Low 69 - 69 69 - 69 281 202 19 495 35 17
Mean 885 129 1,013 845 121 966 494 254 150 820 104 81
Median 620 - 754 562 - 754 571 219 122 666 79 57
Without Bestway, Inc.:
High 2,846 324 3,165 2,707 320 3,027 $ 643 $ 409 294$ $ 1,550 186 $ $ 144
Low 135 - 135 133 - 133 366 207 19 495 67 56
Mean 1,089 161 1,250 1,039 152 1,190 548 267 157 887 122 97
Median 687 160 849 658 143 801 591 226 158 752 117 95
(1) As of the most recent reported period.
(2) Based on the average of the most recent reported period and the same reported period one year ago.
(3) Based on total current stores including owned and franchised stores.
* Canadian dollar amounts have been converted to U.S. dollars at a exchange rate of 79.2%.
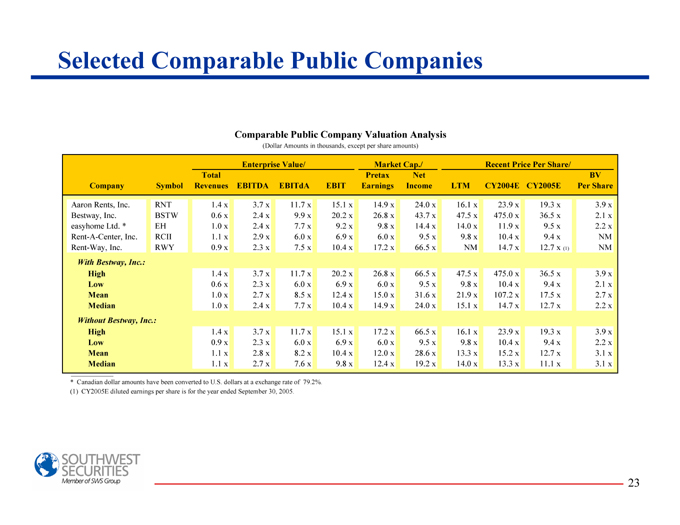
Selected Comparable Public Companies
Comparable Public Company Valuation Analysis
(Dollar Amounts in thousands, except per share amounts)
Enterprise Value/ Market Cap./ Recent Price Per Share/
Total Pretax Net BV
Company Symbol Revenues EBITDA EBITdA EBIT Earnings Income LTM CY2004E CY2005E Per Share
Aaron Rents, Inc. RNT 1.4 x 3.7 x 11.7 x 15.1 x 14.9 x 24.0 x 16.1 x 23.9 x 19.3 x 3.9 x
Bestway, Inc. BSTW 0.6 x 2.4 x 9.9 x 20.2 x 26.8 x 43.7 x 47.5 x 475.0 x 36.5 x 2.1 x
easyhome Ltd. * EH 1.0 x 2.4 x 7.7 x 9.2 x 9.8 x 14.4 x 14.0 x 11.9 x 9.5 x 2.2 x
Rent-A-Center, Inc. RCII 1.1 x 2.9 x 6.0 x 6.9 x 6.0 x 9.5 x 9.8 x 10.4 x 9.4 x NM
Rent-Way, Inc. RWY 0.9 x 2.3 x 7.5 x 10.4 x 17.2 x 66.5 x NM 14.7 x 12.7 x (1) NM
With Bestway, Inc.:
High 1.4 x 3.7 x 11.7 x 20.2 x 26.8 x 66.5 x 47.5 x 475.0 x 36.5 x 3.9 x
Low 0.6 x 2.3 x 6.0 x 6.9 x 6.0 x 9.5 x 9.8 x 10.4 x 9.4 x 2.1 x
Mean 1.0 x 2.7 x 8.5 x 12.4 x 15.0 x 31.6 x 21.9 x 107.2 x 17.5 x 2.7 x
Median 1.0 x 2.4 x 7.7 x 10.4 x 14.9 x 24.0 x 15.1 x 14.7 x 12.7 x 2.2 x
Without Bestway, Inc.:
High 1.4 x 3.7 x 11.7 x 15.1 x 17.2 x 66.5 x 16.1 x 23.9 x 19.3 x 3.9 x
Low 0.9 x 2.3 x 6.0 x 6.9 x 6.0 x 9.5 x 9.8 x 10.4 x 9.4 x 2.2 x
Mean 1.1 x 2.8 x 8.2 x 10.4 x 12.0 x 28.6 x 13.3 x 15.2 x 12.7 x 3.1 x
Median 1.1 x 2.7 x 7.6 x 9.8 x 12.4 x 19.2 x 14.0 x 13.3 x 11.1 x 3.1 x
* Canadian dollar amounts have been converted to U.S. dollars at a exchange rate of 79.2%.
(1) CY2005E diluted earnings per share is for the year ended September 30, 2005.
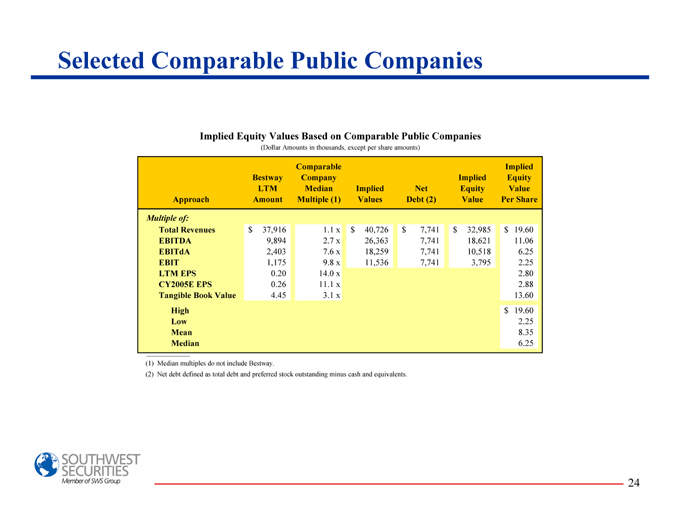
Selected Comparable Public Companies
Implied Equity Values Based on Comparable Public Companies
(Dollar Amounts in thousands, except per share amounts)
Comparable Implied
Bestway Company Implied Equity
LTM Median Implied Net Equity Value
Approach Amount Multiple (1) Values Debt (2) Value Per Share
Multiple of:
Total Revenues $ 37,916 1.1 x $ 40,726 $ 7,741 $ 32,985 $ 19.60
EBITDA 9,894 2.7 x 26,363 7,741 18,621 11.06
EBITdA 2,403 7.6 x 18,259 7,741 10,518 6.25
EBIT 1,175 9.8 x 11,536 7,741 3,795 2.25
LTM EPS 0.20 14.0 x 2.80
CY2005E EPS 0.26 11.1 x 2.88
Tangible Book Value 4.45 3.1 x 13.60
High $ 19.60
Low 2.25
Mean 8.35
Median 6.25
(1) Median multiples do not include Bestway.
(2) Net debt defined as total debt and preferred stock outstanding minus cash and equivalents.
Merger and Acquisition Transactions
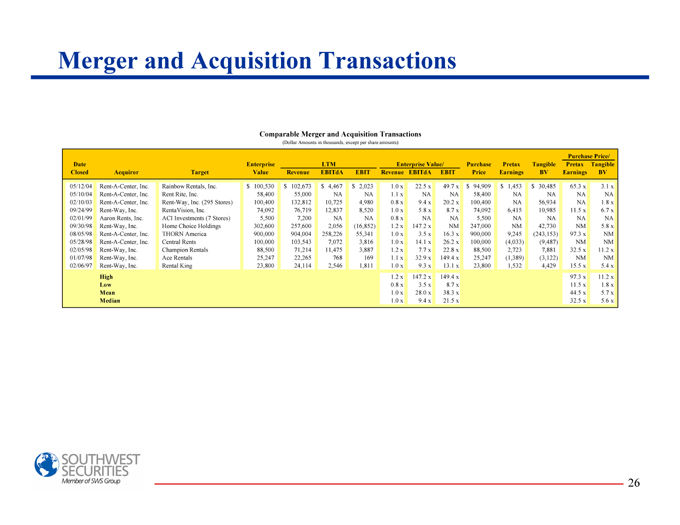
Merger and Acquisition Transactions
Comparable Merger and Acquisition Transactions
(Dollar Amounts in thousands, except per share amounts)
Purchase Price/
Date Closed Acquiror Target Enterprise Value LTM Enterprise Value/ Purchase Price Pretax Earnings Tangible BV Pretax Tangible Earnings BV
Revenue EBITdA EBIT Revenue EBITdA EBIT
05/12/04 Rent-A-Center, Inc. Rainbow Rentals, Inc. $ 100,530 $ 102,673 4,467$ 2,023 $ 1.0 x 22.5 x 49.7 x $ 94,909 $ 1,453 30,485$ 65.3 x 3.1 x
05/10/04 Rent-A-Center, Inc. Rent Rite, Inc. 58,400 55,000 NA NA 1.1 x NA NA 58,400 NA NA NA NA
02/10/03 Rent-A-Center, Inc. Rent-Way, Inc. (295 Stores) 100,400 132,812 10,725 4,980 0.8 x 9.4 x 20.2 x 100,400 NA 56,934 NA 1.8 x
09/24/99 Rent-Way, Inc. RentaVision, Inc. 74,092 76,719 12,837 8,520 1.0 x 5.8 x 8.7 x 74,092 6,415 10,985 11.5 x 6.7 x
02/01/99 Aaron Rents, Inc. ACI Investments (7 Stores) 5,500 7,200 NA NA 0.8 x NA NA 5,500 NA NA NA NA
09/30/98 Rent-Way, Inc. Home Choice Holdings 302,600 257,600 2,056 (16,852) 1.2 x 147.2 x NM 247,000 NM 42,730 NM 5.8 x
08/05/98 Rent-A-Center, Inc. THORN America 900,000 904,004 258,226 55,341 1.0 x 3.5 x 16.3 x 900,000 9,245 (243,153) 97.3 x NM
05/28/98 Rent-A-Center, Inc. Central Rents 100,000 103,543 7,072 3,816 1.0 x 14.1 x 26.2 x 100,000 (4,033) (9,487) NM NM
02/05/98 Rent-Way, Inc. Champion Rentals 88,500 71,214 11,475 3,887 1.2 x 7.7 x 22.8 x 88,500 2,723 7,881 32.5 x 11.2 x
01/07/98 Rent-Way, Inc. Ace Rentals 25,247 22,265 768 169 1.1 x 32.9 x 149.4 x 25,247 (1,389) (3,122) NM NM
02/06/97 Rent-Way, Inc. Rental King 23,800 24,114 2,546 1,811 1.0 x 9.3 x 13.1 x 23,800 1,532 4,429 15.5 x 5.4 x
High 1.2 x 147.2 x 149.4 x 97.3 x 11.2 x
Low 0.8 x 3.5 x 8.7 x 11.5 x 1.8 x
Mean 1.0 x 28.0 x 38.3 x 44.5 x 5.7 x
Median 1.0 x 9.4 x 21.5 x 32.5 x 5.6 x
Merger and Acquisition Transactions
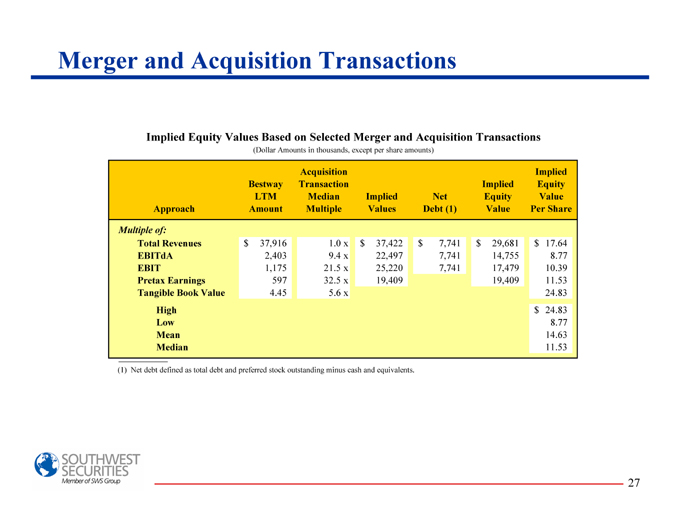
Implied Equity Values Based on Selected Merger and Acquisition Transactions
(Dollar Amounts in thousands, except per share amounts)
Acquisition Implied
Bestway Transaction Implied Equity
LTM Median Implied Net Equity Value
Approach Amount Multiple Values Debt (1) Value Per Share
Multiple of:
Total Revenues $ 37,916 1.0 x 37,422$ $ 7,741 29,681 $ $ 17.64
EBITdA 2,403 9.4 x 22,497 7,741 14,755 8.77
EBIT 1,175 21.5 x 25,220 7,741 17,479 10.39
Pretax Earnings 597 32.5 x 19,409 19,409 11.53
Tangible Book Value 4.45 5.6 x 24.83
High $ 24.83
Low 8.77
Mean 14.63
Median 11.53
(1) Net debt defined as total debt and preferred stock outstanding minus cash and equivalents.

Discounted Cash Flow Analysis
Discounted Cash Flow Analysis
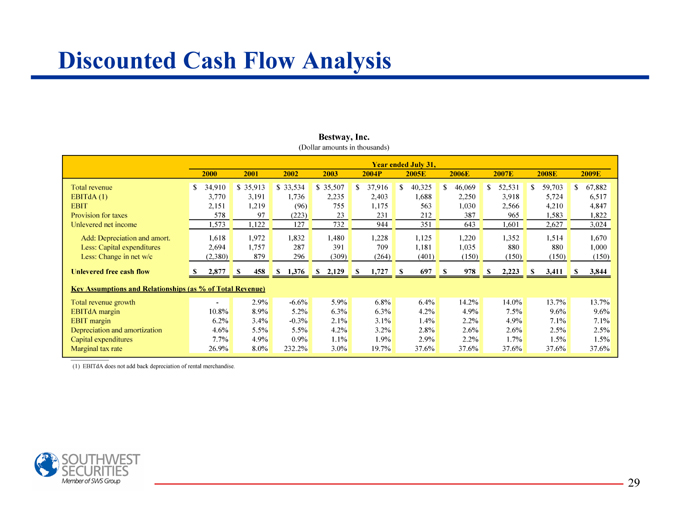
Bestway, Inc.
(Dollar amounts in thousands)
Year ended July 31,
2000 2001 2002 2003 2004P 2005E 2006E 2007E 2008E 2009E
Total revenue $ 34,910 $ 35,913 $ 33,534 $ 35,507 $ 37,916 $ 40,325 $ 46,069 $ 52,531 $ 59,703 $ 67,882
EBITdA (1) 3,770 3,191 1,736 2,235 2,403 1,688 2,250 3,918 5,724 6,517
EBIT 2,151 1,219 (96) 755 1,175 563 1,030 2,566 4,210 4,847
Provision for taxes 578 97 (223) 23 231 212 387 965 1,583 1,822
Unlevered net income 1,573 1,122 127 732 944 351 643 1,601 2,627 3,024
Add: Depreciation and amort. 1,618 1,972 1,832 1,480 1,228 1,125 1,220 1,352 1,514 1,670
Less: Capital expenditures 2,694 1,757 287 391 709 1,181 1,035 880 880 1,000
Less: Change in net w/c (2,380) 879 296 (309) (264) (401) (150) (150) (150) (150)
Unlevered free cash flow $ 2,877 $ 458 $ 1,376 $ 2,129 $ 1,727 $ 697 $ 978 $ 2,223 $ 3,411 $ 3,844
Key Assumptions and Relationships (as % of Total Revenue)
Total revenue growth - 2.9% -6.6% 5.9% 6.8% 6.4% 14.2% 14.0% 13.7% 13.7%
EBITdA margin 10.8% 8.9% 5.2% 6.3% 6.3% 4.2% 4.9% 7.5% 9.6% 9.6%
EBIT margin 6.2% 3.4% -0.3% 2.1% 3.1% 1.4% 2.2% 4.9% 7.1% 7.1%
Depreciation and amortization 4.6% 5.5% 5.5% 4.2% 3.2% 2.8% 2.6% 2.6% 2.5% 2.5%
Capital expenditures 7.7% 4.9% 0.9% 1.1% 1.9% 2.9% 2.2% 1.7% 1.5% 1.5%
Marginal tax rate 26.9% 8.0% 232.2% 3.0% 19.7% 37.6% 37.6% 37.6% 37.6% 37.6%
(1) EBITdA does not add back depreciation of rental merchandise.
Discounted Cash Flow Analysis
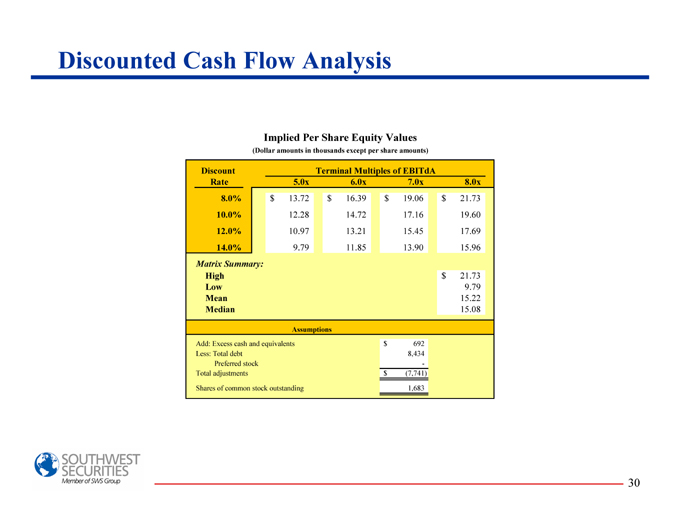
Implied Per Share Equity Values
(Dollar amounts in thousands except per share amounts)
Discount Terminal Multiples of EBITdA
Rate 5.0x 6.0x 7.0x 8.0x
8.0% $ 13.72 $ 16.39 $ 19.06 $ 21.73
10.0% 12.28 14.72 17.16 19.60
12.0% 10.97 13.21 15.45 17.69
14.0% 9.79 11.85 13.90 15.96
Matrix Summary:
High $ 21.73
Low 9.79
Mean 15.22
Median 15.08
Assumptions
Add: Excess cash and equivalents $ 692
Less: Total debt 8,434
Preferred stock -
Total adjustments $ (7,741)
Shares of common stock outstanding 1,683
Reverse Split Going Private Transaction Analysis
Reverse Split Going Private Transaction Analysis
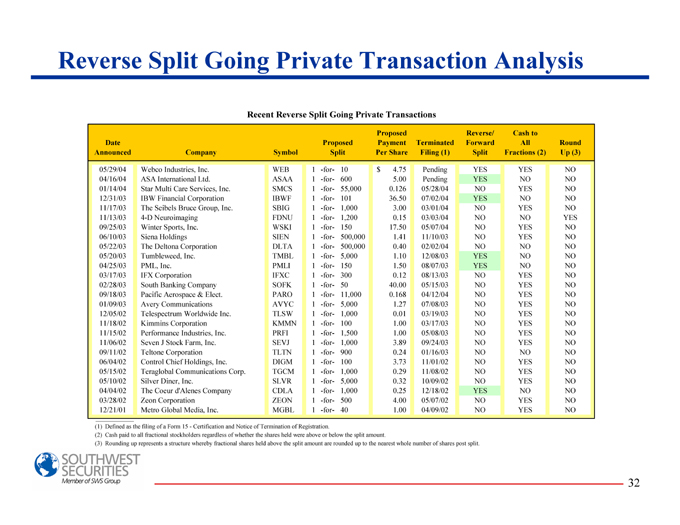
Recent Reverse Split Going Private Transactions
Proposed Reverse/ Cash to
Date Proposed Payment Terminated Forward All Round
Announced Company Symbol Split Per Share Filing (1) Split Fractions (2) Up (3)
05/29/04 Webco Industries, Inc. WEB 1 -for- 10 $ 4.75 Pending YES YES NO
04/16/04 ASA International Ltd. ASAA 1 -for- 600 5.00 Pending YES NO NO
01/14/04 Star Multi Care Services, Inc. SMCS 1 -for- 55,000 0.126 05/28/04 NO YES NO
12/31/03 IBW Financial Corporation IBWF 1 -for- 101 36.50 07/02/04 YES NO NO
11/17/03 The Seibels Bruce Group, Inc. SBIG 1 -for- 1,000 3.00 03/01/04 NO YES NO
11/13/03 4-D Neuroimaging FDNU 1 -for- 1,200 0.15 03/03/04 NO NO YES
09/25/03 Winter Sports, Inc. WSKI 1 -for- 150 17.50 05/07/04 NO YES NO
06/10/03 Siena Holdings SIEN 1 -for- 500,000 1.41 11/10/03 NO YES NO
05/22/03 The Deltona Corporation DLTA 1 -for- 500,000 0.40 02/02/04 NO NO NO
05/20/03 Tumbleweed, Inc. TMBL 1 -for- 5,000 1.10 12/08/03 YES NO NO
04/25/03 PML, Inc. PMLI 1 -for- 150 1.50 08/07/03 YES NO NO
03/17/03 IFX Corporation IFXC 1 -for- 300 0.12 08/13/03 NO YES NO
02/28/03 South Banking Company SOFK 1 -for- 50 40.00 05/15/03 NO YES NO
09/18/03 Pacific Aerospace & Elect. PARO 1 -for- 11,000 0.168 04/12/04 NO YES NO
01/09/03 Avery Communications AVYC 1 -for- 5,000 1.27 07/08/03 NO YES NO
12/05/02 Telespectrum Worldwide Inc. TLSW 1 -for- 1,000 0.01 03/19/03 NO YES NO
11/18/02 Kimmins Corporation KMMN 1 -for- 100 1.00 03/17/03 NO YES NO
11/15/02 Performance Industries, Inc. PRFI 1 -for- 1,500 1.00 05/08/03 NO YES NO
11/06/02 Seven J Stock Farm, Inc. SEVJ 1 -for- 1,000 3.89 09/24/03 NO YES NO
09/11/02 Teltone Corporation TLTN 1 -for- 900 0.24 01/16/03 NO NO NO
06/04/02 Control Chief Holdings, Inc. DIGM 1 -for- 100 3.73 11/01/02 NO YES NO
05/15/02 Teraglobal Communications Corp. TGCM 1 -for- 1,000 0.29 11/08/02 NO YES NO
05/10/02 Silver Diner, Inc. SLVR 1 -for- 5,000 0.32 10/09/02 NO YES NO
04/04/02 The Coeur d'Alenes Company CDLA 1 -for- 1,000 0.25 12/18/02 YES NO NO
03/28/02 Zeon Corporation ZEON 1 -for- 500 4.00 05/07/02 NO YES NO
12/21/01 Metro Global Media, Inc. MGBL 1 -for- 40 1.00 04/09/02 NO YES NO
(1) Defined as the filing of a Form 15 - Certification and Notice of Termination of Registration.
(2) Cash paid to all fractional stockholders regardless of whether the shares held were above or below the split amount.
(3) Rounding up represents a structure whereby fractional shares held above the split amount are rounded up to the nearest whole number of shares post split.
Reverse Split Going Private Transaction Analysis
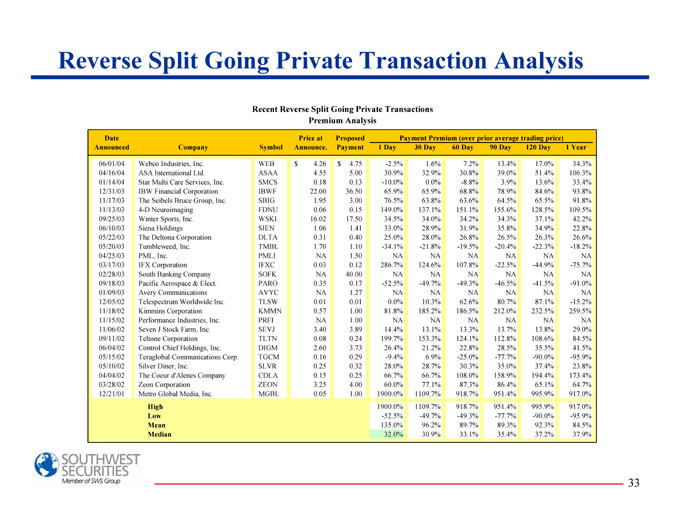
Recent Reverse Split Going Private Transactions
Premium Analysis
Date Price at Proposed Payment Premium (over prior average trading price)
Announced Company Symbol Announce. Payment 1 Day 30 Day 60 Day 90 Day 120 Day 1 Year
06/01/04 Webco Industries, Inc. WEB $ 4.26 $ 4.75 -2.5% 1.6% 7.2% 13.4% 17.0% 34.3%
04/16/04 ASA International Ltd. ASAA 4.55 5.00 30.9% 32.9% 30.8% 39.0% 51.4% 106.3%
01/14/04 Star Multi Care Services, Inc. SMCS 0.18 0.13 -10.0% 0.0% -8.8% 3.9% 13.6% 33.4%
12/31/03 IBW Financial Corporation IBWF 22.00 36.50 65.9% 65.9% 68.8% 78.9% 84.6% 93.8%
11/17/03 The Seibels Bruce Group, Inc. SBIG 1.95 3.00 76.5% 63.8% 63.6% 64.5% 65.5% 91.8%
11/13/03 4-D Neuroimaging FDNU 0.06 0.15 149.0% 137.1% 151.1% 155.6% 128.5% 109.5%
09/25/03 Winter Sports, Inc. WSKI 16.02 17.50 34.5% 34.0% 34.2% 34.3% 37.1% 42.2%
06/10/03 Siena Holdings SIEN 1.06 1.41 33.0% 28.9% 31.9% 35.8% 34.9% 22.8%
05/22/03 The Deltona Corporation DLTA 0.31 0.40 25.0% 28.0% 26.8% 26.5% 26.3% 26.6%
05/20/03 Tumbleweed, Inc. TMBL 1.70 1.10 -34.1% -21.8% -19.5% -20.4% -22.3% -18.2%
04/25/03 PML, Inc. PMLI NA 1.50 NA NA NA NA NA NA
03/17/03 IFX Corporation IFXC 0.03 0.12 286.7% 124.6% 107.8% -22.5% -44.9% -75.7%
02/28/03 South Banking Company SOFK NA 40.00 NA NA NA NA NA NA
09/18/03 Pacific Aerospace & Elect. PARO 0.35 0.17 -52.5% -49.7% -49.3% -46.5% -41.5% -91.0%
01/09/03 Avery Communications AVYC NA 1.27 NA NA NA NA NA NA
12/05/02 Telespectrum Worldwide Inc. TLSW 0.01 0.01 0.0% 10.3% 62.6% 80.7% 87.1% -15.2%
11/18/02 Kimmins Corporation KMMN 0.57 1.00 81.8% 185.2% 186.5% 212.0% 232.5% 259.5%
11/15/02 Performance Industries, Inc. PRFI NA 1.00 NA NA NA NA NA NA
11/06/02 Seven J Stock Farm, Inc. SEVJ 3.40 3.89 14.4% 13.1% 13.3% 13.7% 13.8% 29.0%
09/11/02 Teltone Corporation TLTN 0.08 0.24 199.7% 153.3% 124.1% 112.8% 108.6% 84.5%
06/04/02 Control Chief Holdings, Inc. DIGM 2.60 3.73 26.4% 21.2% 22.8% 28.5% 35.5% 41.5%
05/15/02 Teraglobal Communications Corp. TGCM 0.16 0.29 -9.4% 6.9% -25.0% -77.7% -90.0% -95.9%
05/10/02 Silver Diner, Inc. SLVR 0.25 0.32 28.0% 28.7% 30.3% 35.0% 37.4% 23.8%
04/04/02 The Coeur d’Alenes Company CDLA 0.15 0.25 66.7% 66.7% 108.0% 158.9% 194.4% 173.4%
03/28/02 Zeon Corporation ZEON 3.25 4.00 60.0% 77.1% 87.3% 86.4% 65.1% 64.7%
12/21/01 Metro Global Media, Inc. MGBL 0.05 1.00 1900.0% 1109.7% 918.7% 951.4% 995.9% 917.0%
High 1900.0% 1109.7% 918.7% 951.4% 995.9% 917.0%
Low -52.5% -49.7% -49.3% -77.7% -90.0% -95.9%
Mean 135.0% 96.2% 89.7% 89.3% 92.3% 84.5%
Median 32.0% 30.9% 33.1% 35.4% 37.2% 37.9%

Reverse Split Going Private Transaction Analysis
Implied Equity Values Based on Comparable Reverse Split Going Private Transactions
High Low Mean Median
Recent Bestway Price Per Share $ 9.50 $ 9.50 $ 9.50 $ 9.50
Median Payment Premiums 37.9% 30.9% 34.4% 34.2%
Implied Equity Value Per Share $ 13.10 $ 12.43 $ 12.77 $ 12.75
Summary Valuation Analysis
Summary Valuation Analysis
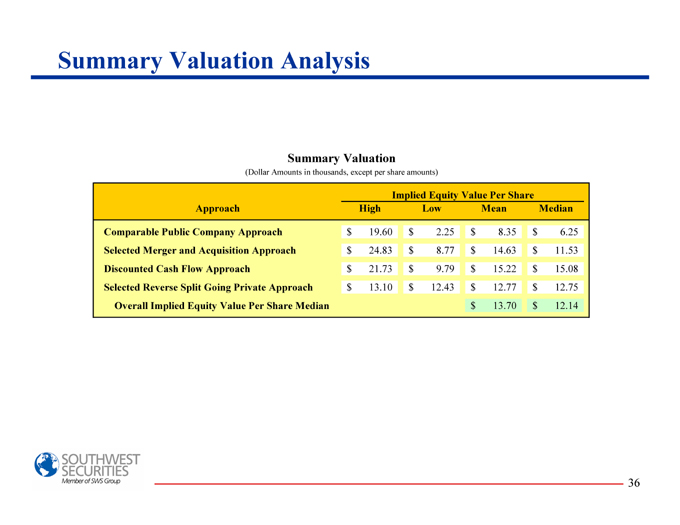
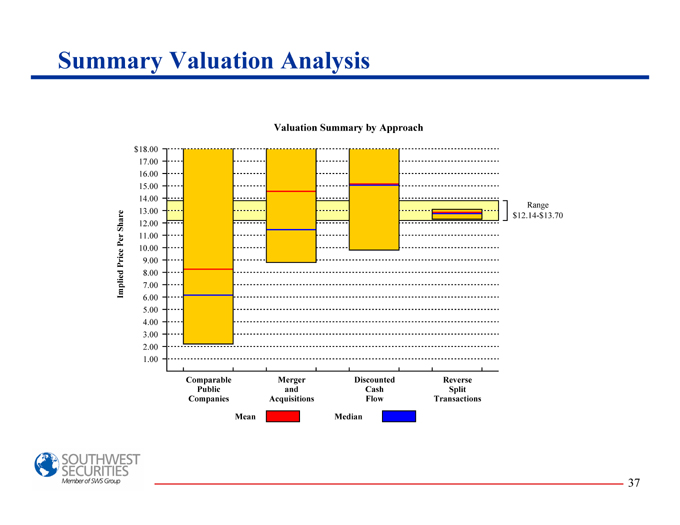
Summary Valuation
(Dollar Amounts in thousands, except per share amounts)
Implied Equity Value Per Share
Approach High Low Mean Median
Comparable Public Company Approach $ 19.60 $ 2.25 $ 8.35 $ 6.25
Selected Merger and Acquisition Approach $ 24.83 $ 8.77 $ 14.63 $ 11.53
Discounted Cash Flow Approach $ 21.73 $ 9.79 $ 15.22 $ 15.08
Selected Reverse Split Going Private Approach $ 13.10 $ 12.43 $ 12.77 $ 12.75
Overall Implied Equity Value Per Share Median $ 13.70 $ 12.14
Summary Valuation Analysis
Valuation Summary by Approach
$ 18.00 17.00 16.00 15.00 14.00
Range 13.00 $12.14-$13.70 12.00 11.00 10.00 9.00 8.00 7.00 6.00 5.00 4.00 3.00 2.00 1.00
Comparable Merger Discounted Reverse Public and Cash Split Companies Acquisitions Flow Transactions
Mean Median

Rationale and Conclusions
Rationale and Conclusions
The primary purpose of the reverse and forward stock split by Bestway is to facilitate a “going private transaction.” The result will allow the Company to terminate the registration of its common stock under Section 12(g) of the Securities Exchange Act of 1934, as amended (the “Exchange Act”).
This will enable Bestway to save money being spent because on its status as a SEC reporting company, which management and the Board of Directors believe provides a limited benefit to a small company like Bestway.
The reverse stock split will decrease the total number of Bestway’s common stockholders of record from approximately 366 to approximately 70. By reducing the number of stockholders below 300, Bestway will be eligible to file a Form 15 with the SEC and terminate its registration and reporting obligations under the Exchange Act.
The Company’s small public float and minimal trading volume have limited the ability of stockholders to sell their shares without also reducing the trading price, as well as the ability to use stock as acquisition currency or to successfully attract and retain employees.
Rationale and Conclusions
We would recommend a fractional share price of approximately $12.14 to $13.70 per share (on a pre-split basis) resulting in cash expenditures for fractional shares after the reverse stock split of approximately $97,120 to $109,600 in total (assuming approximately 8,000 shares pre-split are cashed out). This represents a premium range of 27.8% to 44.2% over the closing price on October 21, 2004, a discount range of -23.4% to -13.6% over the 52-week high of $15.85 and a premium range of 27.8% to 44.2% over the 52-week low of $9.50.
Additionally, the Company estimates that professional fees and other expenses related to the transaction, will total approximately $150,000. The Company does not expect that the payment to stockholders receiving cash in the reverse stock split or the payment of expenses will have any material adverse effect on our capital, liquidity, operations or cash flow, however, there will be less capital available to for operations.
The Company anticipates annual saving of approximately $730,500 (which includes a one time cost savings of $250,000) resulting in future annual savings of approximately $480,500 in direct costs and an indeterminable amount in indirect savings resulting from the reduction in the time that must be devoted by our employees to preparing public reports and filings and responding to stockholder inquiries.
Rationale and Conclusions
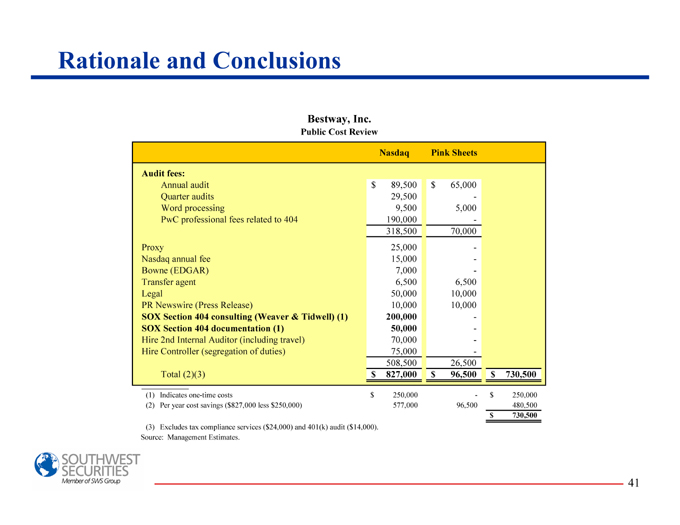
Bestway, Inc.
Public Cost Review
Nasdaq Pink Sheets
Audit fees:
Annual audit $ 89,500 $ 65,000
Quarter audits 29,500 -
Word processing 9,500 5,000
PwC professional fees related to 404 190,000 -
318,500 70,000
Proxy 25,000 -
Nasdaq annual fee 15,000 -
Bowne (EDGAR) 7,000 -
Transfer agent 6,500 6,500
Legal 50,000 10,000
PR Newswire (Press Release) 10,000 10,000
SOX Section 404 consulting (Weaver & Tidwell) (1) 200,000 -
SOX Section 404 documentation (1) 50,000 -
Hire 2nd Internal Auditor (including travel) 70,000 -
Hire Controller (segregation of duties) 75,000 -
508,500 26,500
Total (2)(3) $ 827,000 $ 96,500 $ 730,500
(1) Indicates one-time costs $ 250,000 - $ 250,000
(2) Per year cost savings ($827,000 less $ 250,000) 577,000 96,500 480,500
$ 730,500
(3) Excludes tax compliance services ($24,000) and 401(k) audit ($14,000).
Source: Management Estimates.

Exhibits
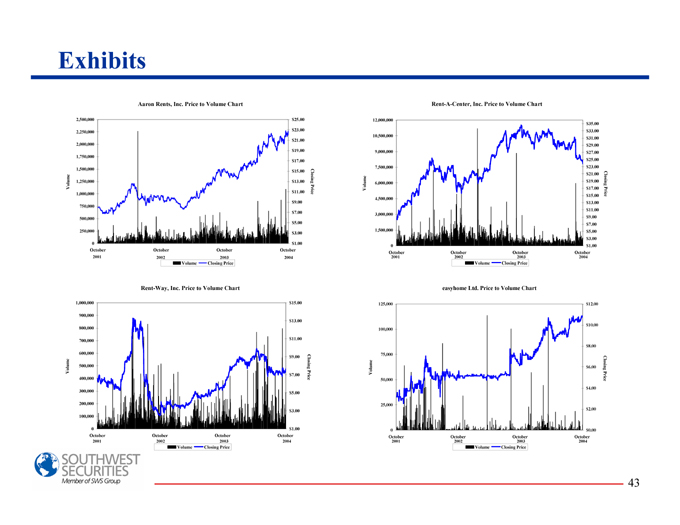
Exhibits
Aaron Rents, Inc. Price to Volume Chart
Rent-A-Center, Inc. Price to Volume Chart
2,500,000
$25.00
2,250,000
$23.00
$21.00
2,000,000
$19.00
1,750,000
$17.00
1,500,000
$15.00
1,250,000
$13.00
$11.00
1,000,000
$ 9.00
750,000
$ 7.00
500,000
$ 5.00
250,000
$ 3.00
$ 1.00
October October October October
2001 2002 2003 2004
Volume Closing Price
Rent-A-Center, Inc. Price to Volume Chart
12,000,000
$ 35.00
$ 33.00
10,500,000
$ 31.00
$ 29.00
9,000,000 $ 27.00
$ 25.00
7,500,000 $ 23.00
$ 21.00 Closing
Volume
6,000,000 $ 19.00
$ 17.00
$ 15.00 Price
4,500,000
$ 13.00
$ 11.00
3,000,000
$ 9.00
$ 7.00
1,500,000 $ 5.00
$ 3.00
0 $ 1.00
October October October October
2001 2002 2003 2004
Volume Closing Price
Rent-Way, Inc. Price to Volume Chart
1,000,000 $ 15.00
900,000
$ 13.00
800,000
700,000 $ 11.00
600,000
$ 9.00 Closing
Volume
500,000
$ 7.00
400,000 Price
300,000 $ 5.00
200,000
$ 3.00
100,000
0 $ 1.00
October October October October
2001 2002 2003 2004
Volume Closing Price
easyhome Ltd. Price to Volume Chart
125,000 $ 12.00
$ 10.00
100,000
$ 8.00
75,000
Closing
Volume
$ 6.00
50,000 Price
$ 4.00
25,000
$ 2.00
0 $ 0.00
October October October October
2001 2002 2003 2004
Volume Closing Price