UNITED STATES
SECURITIES AND EXCHANGE COMMISSION
Washington, D.C. 20549
FORM N-CSR
Certified Shareholder Report of
Registered Management Investment Companies
Investment Company Act File Number: 811-00862
The Growth Fund of America
(Exact Name of Registrant as Specified in Charter)
6455 Irvine Center Drive
Irvine, California 92618
(Address of Principal Executive Offices)
Registrant's telephone number, including area code: (213) 486-9200
Date of fiscal year end: August 31
Date of reporting period: February 28, 2017
Michael W. Stockton
The Growth Fund of America
333 South Hope Street
Los Angeles, California 90071
(Name and Address of Agent for Service)
ITEM 1 – Reports to Stockholders
![]()
 | The Growth Fund
Semi-annual report | ||
The Growth Fund of America seeks to provide you with growth of capital.
This fund is one of more than 40 offered by one of the nation’s largest mutual fund families, American Funds, from Capital Group. For more than 85 years, Capital has invested with a long-term focus based on thorough research and attention to risk.
Fund results shown in this report, unless otherwise indicated, are for Class A shares at net asset value. If a sales charge (maximum 5.75%) had been deducted, the results would have been lower. Results are for past periods and are not predictive of results for future periods. Current and future results may be lower or higher than those shown. Share prices and returns will vary, so investors may lose money. Investing for short periods makes losses more likely. Investments are not FDIC-insured, nor are they deposits of or guaranteed by a bank or any other entity, so they may lose value. For current information and month-end results, visit americanfunds.com.
Here are the average annual total returns on a $1,000 investment with all distributions reinvested for periods ended March 31, 2017 (the most recent calendar quarter-end):
| Class A shares | 1 year | 5 years | 10 years | |||
| Reflecting 5.75% maximum sales charge | 13.41% | 12.36% | 6.99% |
For other share class results, visit americanfunds.com and americanfundsretirement.com.
The total annual fund operating expense ratio was 0.66% for Class A shares as of the prospectus dated January 1, 2017.
Investment results assume all distributions are reinvested and reflect applicable fees and expenses. When applicable, investment results reflect fee waivers, without which results would have been lower. Visit americanfunds.com for more information.
Investing outside the United States involves risks, such as currency fluctuations, periods of illiquidity and price volatility, as more fully described in the prospectus. These risks may be heightened in connection with investments in developing countries. Refer to the fund prospectus and the Risk Factors section of this report for more information on these and other risks associated with investing in the fund.
 |
Fellow investors:
A post-election stock market surge and continued economic growth buoyed The Growth Fund of America in the first half of its fiscal year. For the six months ended February 28, 2017, the fund posted a total return of 10.24%. This surpassed the 10.01% gain recorded by the Standard & Poor’s 500 Composite Index, a market-capitalization-weighted index based on the results of 500 widely held common stocks and the fund’s primary benchmark.
Results at a glance
Total returns for periods ended February 28, 2017, with all distributions reinvested
| Cumulative total returns | Average annual total returns | |||||||||||||||||||
| 6 months | 1 year | 5 years | 10 years | Lifetime1 | ||||||||||||||||
| The Growth Fund of America (Class A shares) | 10.24 | % | 26.81 | % | 14.01 | % | 7.66 | % | 13.53 | % | ||||||||||
| Standard & Poor’s 500 Composite Index2 | 10.01 | 24.98 | 14.01 | 7.62 | 10.97 | |||||||||||||||
| Lipper Large-Cap Growth Funds Index3 | 7.67 | 20.61 | 12.05 | 7.59 | — | 4 | ||||||||||||||
| Lipper Growth Funds Index3 | 9.77 | 25.00 | 12.96 | 6.93 | 9.89 | |||||||||||||||
| Lipper Large-Cap Core Funds Index3 | 10.06 | 25.18 | 12.80 | 6.82 | — | 4 | ||||||||||||||
| Lipper Capital Appreciation Funds Index3 | 10.19 | 24.03 | 11.79 | 7.37 | 10.77 | |||||||||||||||
| 1 | Since Capital Research and Management Company began managing the fund on December 1, 1973. |
| 2 | The market index is unmanaged and, therefore, has no expenses. Investors cannot invest directly in an index. S&P source: S&P Dow Jones Indices LLC. |
| 3 | Lipper indexes track the largest mutual funds (no more than 30), represented by one share class per fund, in the corresponding Lipper category. Lipper source: Thomson Reuters Lipper. |
| 4 | This Lipper index was not in existence when Capital Research and Management Company began managing this fund. |
| The Growth Fund of America | 1 |
Likewise the fund outpaced its various Lipper peer group measures — indexes designed to reflect broad styles of mutual funds. We are gratified with these returns, but more so with regard to our long-term results. We have always believed in the importance of investing for the long term. As such, we encourage you to assess your own investments with the same perspective.
Investment analysis
The fund’s fiscal year began two months prior to the U.S. presidential election. At that time, investors had been in a period where they favored income-generating equities, generally a more conservative investment. After President Trump’s electoral victory, market sentiment quickly shifted toward more growth-oriented stocks. Between Election Day and February 28, the S&P 500 rose 11.22%.
We believe this is partly attributable to the general agenda put forth by the new administration, which has called for lower taxes and fewer regulations — both considered helpful to economic activity and corporate earnings.
The economy continued to grow, with gross domestic product increasing 2.1% in the fourth quarter of 2016. On March 15 the Federal Reserve raised interest rates for just the third time since the depths of the financial crisis. The Fed has indicated that additional increases are likely. This is consistent with the move we have already seen in 10-year U.S. Treasury bonds, where the interest rate rose from about 1.8% immediately prior to the election to roughly 2.4% as of this writing. While we have observed some concerns about the impact of higher rates, we believe stocks can do well in an environment of rising rates if the reason for the rise is primarily due to better economic activity.
With this backdrop in mind, each of the fund’s 10 largest holdings recorded positive returns for the period. Top holding Amazon gained 9.9%. Netflix, the fund’s sixth-largest holding, soared 45.8%.
A number of stocks in the energy sector weighed on returns, with Southwestern Energy and Chesapeake Energy declining 46.0% and 14.2%, respectively. In the opposite direction, financials and industrials were favorably affected by the change in market sentiment after the election. Among financials, Goldman Sachs climbed 46.4%, while industrials giant Boeing rose 39.2%.
| 2 | The Growth Fund of America |
The road ahead
Looking ahead, we see several factors having an impact over the short to medium term. The overall health of the economy is one, including the potential for lower taxes and fewer regulations. We believe that if the Trump administration can deliver on its rhetoric in these areas, that will lead to a positive outlook.
Of course there are always things to keep an eye on. We remain concerned about the White House’s potential position on trade. In an increasingly global economy, many large U.S. companies rely on revenue from overseas, and any action that may lead to trade disputes could be detrimental to equities and lead to broader geopolitical tensions. Likewise, in the early days of this administration we’ve seen frequent policy shifts and battles in the media over a variety of topics which create an inherent uncertainty that’s difficult to define. This may settle down with time.
With that said, we continue to find attractive opportunities in individual equities both domestically and overseas. While the market in general may be at above-average valuation levels, our bottom-up research allows us to look at a company’s future prospects and make an informed decision as to attractiveness. That comprehensive research has been a hallmark of the fund’s success for decades.
We thank you for investing in The Growth Fund of America and look forward to reporting to you again in six months’ time.
Cordially,
 |  | |
| Donald D. O’Neal | Michael T. Kerr | |
| Vice Chairman of the Board | President |
April 7, 2017
For current information about the fund, visit americanfunds.com.
| The Growth Fund of America | 3 |
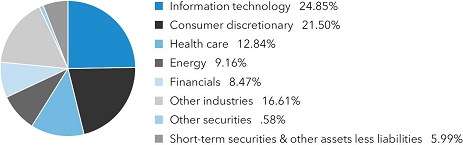
| Summary investment portfolio February 28, 2017 | unaudited |
| Industry sector diversification | Percent of net assets |
| Largest equity holdings | Percent of net assets | |||
| Amazon | 6.14 | % | ||
| Alphabet | 3.30 | |||
| Broadcom | 2.95 | |||
| UnitedHealth Group | 2.25 | |||
| Microsoft | 2.18 | |||
| Netflix | 2.16 | |||
| Home Depot | 2.04 | |||
| 1.76 | ||||
| American International Group | 1.49 | |||
| Berkshire Hathaway | 1.44 | |||
| Common stocks 93.43% | Shares | Value (000) | ||||||
| Information technology 24.85% | ||||||||
| Alphabet Inc., Class C1 | 3,481,722 | $ | 2,866,189 | |||||
| Alphabet Inc., Class A1 | 2,661,770 | 2,249,009 | ||||||
| Broadcom Ltd.2 | 21,703,411 | 4,577,900 | ||||||
| Microsoft Corp. | 52,830,700 | 3,380,108 | ||||||
| Facebook, Inc., Class A1 | 20,079,000 | 2,721,508 | ||||||
| Oracle Corp. | 49,881,000 | 2,124,432 | ||||||
| ASML Holding NV (New York registered) | 8,303,941 | 1,010,506 | ||||||
| ASML Holding NV | 6,609,442 | 801,384 | ||||||
| Apple Inc. | 12,731,700 | 1,744,116 | ||||||
| Visa Inc., Class A | 16,436,000 | 1,445,382 | ||||||
| Samsung Electronics Co., Ltd. | 800,204 | 1,360,152 | ||||||
| Alibaba Group Holding Ltd. (ADR)1 | 10,675,100 | 1,098,468 | ||||||
| Taiwan Semiconductor Manufacturing Co., Ltd.3 | 177,560,000 | 1,092,640 | ||||||
| MasterCard Inc., Class A | 7,844,800 | 866,537 | ||||||
| Other securities | 11,205,293 | |||||||
| 38,543,624 | ||||||||
| Consumer discretionary 21.50% | ||||||||
| Amazon.com, Inc.1 | 11,262,436 | 9,517,209 | ||||||
| Netflix, Inc.1,2 | 23,581,761 | 3,351,676 | ||||||
| Home Depot, Inc. | 21,796,200 | 3,158,487 | ||||||
| Priceline Group Inc.1 | 1,176,209 | 2,027,937 | ||||||
| 4 | The Growth Fund of America |
| Shares | Value (000) | |||||||
| Comcast Corp., Class A | 48,014,000 | $ | 1,796,684 | |||||
| Charter Communications, Inc., Class A1 | 4,365,200 | 1,410,222 | ||||||
| Starbucks Corp. | 17,799,200 | 1,012,241 | ||||||
| Twenty-First Century Fox, Inc., Class A | 31,263,200 | 935,395 | ||||||
| Ulta Beauty, Inc.1 | 3,095,000 | 846,266 | ||||||
| Viacom Inc., Class B | 18,198,351 | 790,718 | ||||||
| Other securities | 8,491,483 | |||||||
| 33,338,318 | ||||||||
| Health care 12.84% | ||||||||
| UnitedHealth Group Inc. | 21,091,405 | 3,488,097 | ||||||
| Amgen Inc. | 8,429,131 | 1,487,994 | ||||||
| Illumina, Inc.1,2 | 8,839,457 | 1,479,725 | ||||||
| Thermo Fisher Scientific Inc. | 7,503,000 | 1,183,073 | ||||||
| Stryker Corp. | 8,573,716 | 1,102,237 | ||||||
| AbbVie Inc. | 16,112,657 | 996,407 | ||||||
| Express Scripts Holding Co.1 | 12,313,800 | 869,970 | ||||||
| Boston Scientific Corp.1 | 35,053,000 | 860,551 | ||||||
| Regeneron Pharmaceuticals, Inc.1 | 2,285,000 | 853,447 | ||||||
| Humana Inc. | 3,967,000 | 838,029 | ||||||
| Gilead Sciences, Inc. | 11,500,467 | 810,553 | ||||||
| Other securities | 5,950,285 | |||||||
| 19,920,368 | ||||||||
| Energy 9.16% | ||||||||
| EOG Resources, Inc. | 21,701,908 | 2,104,868 | ||||||
| Schlumberger Ltd. | 21,683,484 | 1,742,484 | ||||||
| Halliburton Co. | 30,968,800 | 1,655,592 | ||||||
| Pioneer Natural Resources Co. | 7,268,000 | 1,351,630 | ||||||
| Concho Resources Inc.1,2 | 9,780,484 | 1,295,425 | ||||||
| Canadian Natural Resources, Ltd. | 35,308,612 | 1,012,577 | ||||||
| Noble Energy, Inc.2 | 25,967,053 | 945,460 | ||||||
| Other securities | 4,103,931 | |||||||
| 14,211,967 | ||||||||
| Financials 8.47% | ||||||||
| American International Group, Inc. | 36,193,567 | 2,313,493 | ||||||
| Berkshire Hathaway Inc., Class A1 | �� | 4,923 | 1,265,703 | |||||
| Berkshire Hathaway Inc., Class B1 | 5,613,508 | 962,268 | ||||||
| Goldman Sachs Group, Inc. | 6,608,735 | 1,639,363 | ||||||
| JPMorgan Chase & Co. | 9,738,000 | 882,458 | ||||||
| Other securities | 6,073,161 | |||||||
| 13,136,446 | ||||||||
| Consumer staples 5.03% | ||||||||
| Philip Morris International Inc. | 17,538,367 | 1,917,821 | ||||||
| Costco Wholesale Corp. | 6,976,100 | 1,236,025 | ||||||
| Kroger Co. | 36,347,341 | 1,155,846 | ||||||
| Other securities | 3,485,714 | |||||||
| 7,795,406 | ||||||||
| The Growth Fund of America | 5 |
| Common stocks (continued) | Shares | Value (000) | ||||||
| Industrials 4.64% | ||||||||
| Union Pacific Corp. | 8,367,982 | $ | 903,240 | |||||
| CSX Corp. | 18,323,700 | 889,799 | ||||||
| Other securities | 5,409,919 | |||||||
| 7,202,958 | ||||||||
| Materials 2.52% | ||||||||
| E.I. du Pont de Nemours and Co. | 10,017,500 | 786,774 | ||||||
| Other securities | 3,128,020 | |||||||
| 3,914,794 | ||||||||
| Other 1.32% | ||||||||
| Other securities | 2,045,605 | |||||||
| Miscellaneous 3.10% | ||||||||
| Other common stocks in initial period of acquisition | 4,799,383 | |||||||
| Total common stocks (cost: $82,710,159,000) | 144,908,869 | |||||||
| Preferred securities 0.23% | ||||||||
| Financials 0.05% | ||||||||
| Other securities | 76,753 | |||||||
| Miscellaneous 0.18% | ||||||||
| Other preferred securities in initial period of acquisition | 274,499 | |||||||
| Total preferred securities (cost: $320,315,000) | 351,252 | |||||||
| Rights & warrants 0.11% | ||||||||
| Other 0.11% | ||||||||
| Other securities | 170,720 | |||||||
| Miscellaneous 0.00% | ||||||||
| Other rights & warrants in initial period of acquisition | 211 | |||||||
| Total rights & warrants (cost: $116,066,000) | 170,931 | |||||||
| Convertible stocks 0.09% | ||||||||
| Consumer discretionary 0.09% | ||||||||
| Other securities | 140,699 | |||||||
| Total convertible stocks (cost: $114,350,000) | 140,699 | |||||||
| Bonds, notes & other debt instruments 0.15% | Principal amount (000) | |||||||
| Other bonds & notes 0.15% | ||||||||
| Other securities | 240,687 | |||||||
| Total bonds, notes & other debt instruments (cost: $249,436,000) | 240,687 | |||||||
| 6 | The Growth Fund of America |
| Short-term securities 6.17% | Principal amount (000) | Value (000) | ||||||
| Apple Inc. 0.82%–0.88% due 5/2/2017–5/17/20174 | $ | 270,000 | $ | 269,591 | ||||
| Federal Home Loan Bank 0.48%–0.64% due 3/1/2017–8/4/2017 | 4,927,850 | 4,922,786 | ||||||
| Microsoft Corp. 0.80%–0.85% due 3/28/2017–4/18/20174 | 100,000 | 99,929 | ||||||
| U.S. Treasury Bills 0.47%–0.61% due 3/2/2017–8/3/2017 | 1,339,000 | 1,337,675 | ||||||
| Other securities | 2,936,680 | |||||||
| Total short-term securities (cost: $9,566,369,000) | 9,566,661 | |||||||
| Total investment securities 100.18% (cost: $93,076,695,000) | 155,379,099 | |||||||
| Other assets less liabilities (0.18)% | (283,505 | ) | ||||||
| Net assets 100.00% | $ | 155,095,594 | ||||||
This summary investment portfolio is designed to streamline the report and help investors better focus on the fund’s principal holdings. See the inside back cover for details on how to obtain a complete schedule of portfolio holdings.
As permitted by U.S. Securities and Exchange Commission regulations, “Miscellaneous” securities include holdings in their first year of acquisition that have not previously been publicly disclosed.
“Other securities” includes all issues that are not disclosed separately in the summary investment portfolio. “Other securities” also includes loan participations and assignments, which may be subject to legal or contractual restrictions on resale. The total value of all such loans was $100,177,000, which represented .06% of the net assets of the fund. Some securities in “Other securities” (with aggregate value of $337,682,000, an aggregate cost of $376,029,000, and which represented .22% of the net assets of the fund) were acquired from 7/7/2000 to 10/20/2016 through private placement transactions exempt from registration under the Securities Act of 1933, which may subject them to legal or contractual restrictions on resale.
Forward currency contracts
The fund has entered into forward currency contracts as shown in the following table. The average month-end notional amount of open forward currency contracts while held was $180,035,000.
| Unrealized | ||||||||||||||||
| appreciation | ||||||||||||||||
| Contract amount | (depreciation) | |||||||||||||||
| Receive | Deliver | at 2/28/2017 | ||||||||||||||
| Settlement date | Counterparty | (000) | (000) | (000) | ||||||||||||
| Sales: | ||||||||||||||||
| Euros | 3/10/2017 | Barclays Bank PLC | $ | 67,218 | € | 62,800 | $661 | |||||||||
| Euros | 3/22/2017 | JPMorgan Chase | $ | 96,642 | € | 91,150 | (25 | ) | ||||||||
| $636 | ||||||||||||||||
| The Growth Fund of America | 7 |
Investments in affiliates
A company is an affiliate of the fund under the Investment Company Act of 1940 if the fund’s holdings in that company represent 5% or more of the outstanding voting shares. The value of the fund’s affiliated-company holdings is either shown in the summary investment portfolio or included in the value of “Other securities” under the respective industry sectors. Further details on such holdings and related transactions during the six months ended February 28, 2017, appear below.
| Beginning shares | Additions | Reductions | Ending shares | Dividend income (000) | Value of affiliates at 2/28/2017 (000) | |||||||||||||||||||
| Broadcom Ltd. | 22,178,905 | 938,506 | 1,414,000 | 21,703,411 | $ | 32,491 | $ | 4,577,900 | ||||||||||||||||
| Netflix, Inc.1 | 23,034,761 | 547,000 | — | 23,581,761 | — | 3,351,676 | ||||||||||||||||||
| Illumina, Inc.1 | 8,315,957 | 745,500 | 222,000 | 8,839,457 | — | 1,479,725 | ||||||||||||||||||
| Concho Resources Inc.1 | 9,516,984 | 263,500 | — | 9,780,484 | — | 1,295,425 | ||||||||||||||||||
| Noble Energy, Inc. | 26,435,185 | 478,468 | 946,600 | 25,967,053 | 5,288 | 945,460 | ||||||||||||||||||
| Juniper Networks, Inc. | 19,827,923 | 7,795,000 | — | 27,622,923 | 5,445 | 773,442 | ||||||||||||||||||
| MGM Resorts International1 | 30,253,344 | 374,000 | 1,398,169 | 29,229,175 | — | 768,435 | ||||||||||||||||||
| Flex Ltd.1 | 27,812,000 | — | 968,992 | 26,843,008 | — | 442,641 | ||||||||||||||||||
| First Quantum Minerals Ltd. | 33,050,000 | 2,736,886 | 1,300,000 | 34,486,886 | — | 358,838 | ||||||||||||||||||
| Panera Bread Co., Class A1 | 1,164,040 | 240,000 | — | 1,404,040 | — | 324,052 | ||||||||||||||||||
| AutoNation, Inc.1 | 6,000,000 | — | — | 6,000,000 | — | 275,400 | ||||||||||||||||||
| ServiceMaster Global Holdings, Inc.1,5 | 6,635,000 | 140,000 | — | 6,775,000 | — | 269,848 | ||||||||||||||||||
| Sturm, Ruger & Co., Inc. | 145,232 | 799,768 | — | 945,000 | 67 | 47,108 | ||||||||||||||||||
| Akamai Technologies, Inc.1,6 | 8,750,000 | 3,735,389 | 3,950,000 | 8,535,389 | — | — | ||||||||||||||||||
| bluebird bio, Inc.1,6 | 1,897,076 | 873,396 | 730,506 | 2,039,966 | — | — | ||||||||||||||||||
| BorgWarner Inc.6 | 11,207,259 | — | 600,000 | 10,607,259 | 3,054 | — | ||||||||||||||||||
| Kroger Co.6 | 48,872,341 | 1,865,000 | 14,390,000 | 36,347,341 | 8,597 | — | ||||||||||||||||||
| Oshkosh Corp.6 | 3,685,600 | — | 3,062,617 | 622,983 | 262 | — | ||||||||||||||||||
| Weatherford International PLC1,6 | 69,950,382 | 12,750,000 | 34,122,765 | 48,577,617 | — | — | ||||||||||||||||||
| $ | 55,204 | $ | 14,909,950 | |||||||||||||||||||||
| 8 | The Growth Fund of America |
The following footnotes apply to either the individual securities noted or one or more of the securities aggregated and listed as a single line item.
| 1 | Security did not produce income during the last 12 months. |
| 2 | Represents an affiliated company as defined under the Investment Company Act of 1940. |
| 3 | Valued under fair value procedures adopted by authority of the board of trustees. The total value of all such securities, including those in “Other securities,” was $1,803,028,000, which represented 1.16% of the net assets of the fund. This amount includes $1,092,640,000 related to certain securities trading outside the U.S. whose values were adjusted as a result of significant market movements following the close of local trading. |
| 4 | Acquired in a transaction exempt from registration under Section 4(2) of the Securities Act of 1933. May be resold in the U.S. in transactions exempt from registration, normally to qualified institutional buyers. The total value of all such securities, including those in “Other securities,” was $2,373,653,000, which represented 1.53% of the net assets of the fund. |
| 5 | This security was an unaffiliated issuer in its initial period of acquisition at 8/31/2016; it was not publicly disclosed. |
| 6 | Unaffiliated issuer at 2/28/2017. |
Key to abbreviation and symbol
ADR = American Depositary Receipts
€ = Euros
See Notes to Financial Statements
| The Growth Fund of America | 9 |
Financial statements
| Statement of assets and liabilities | unaudited |
| at February 28, 2017 | (dollars in thousands) |
| Assets: | ||||||||
| Investment securities, at value: | ||||||||
| Unaffiliated issuers (cost: $85,161,655) | $ | 140,469,149 | ||||||
| Affiliated issuers (cost: $7,915,040) | 14,909,950 | $ | 155,379,099 | |||||
| Cash | 15,562 | |||||||
| Unrealized appreciation on open forward currency contracts | 661 | |||||||
| Receivables for: | ||||||||
| Sales of investments | 162,138 | |||||||
| Sales of fund’s shares | 209,443 | |||||||
| Dividends and interest | 154,045 | |||||||
| Other | 556 | 526,182 | ||||||
| 155,921,504 | ||||||||
| Liabilities: | ||||||||
| Unrealized depreciation on open forward currency contracts | 25 | |||||||
| Payables for: | ||||||||
| Purchases of investments | 468,978 | |||||||
| Repurchases of fund’s shares | 261,004 | |||||||
| Investment advisory services | 32,145 | |||||||
| Services provided by related parties | 53,111 | |||||||
| Trustees’ deferred compensation | 5,204 | |||||||
| Other | 5,443 | 825,885 | ||||||
| Net assets at February 28, 2017 | $ | 155,095,594 | ||||||
| Net assets consist of: | ||||||||
| Capital paid in on shares of beneficial interest | $ | 88,742,585 | ||||||
| Distributions in excess of net investment income | (16,215 | ) | ||||||
| Undistributed net realized gain | 4,065,903 | |||||||
| Net unrealized appreciation | 62,303,321 | |||||||
| Net assets at February 28, 2017 | $ | 155,095,594 | ||||||
| See Notes to Financial Statements |
| 10 | The Growth Fund of America |
(dollars and shares in thousands, except per-share amounts)
Shares of beneficial interest issued and outstanding (no stated par value) —
unlimited shares authorized (3,467,332 total shares outstanding)
| Net assets | Shares outstanding | Net asset value per share | ||||||||||
| Class A | $ | 78,283,025 | 1,739,858 | $ | 44.99 | |||||||
| Class B | 50,591 | 1,188 | 42.57 | |||||||||
| Class C | 4,874,169 | 116,009 | 42.02 | |||||||||
| Class F-1 | 8,796,150 | 196,764 | 44.70 | |||||||||
| Class F-2 | 15,023,101 | 334,522 | 44.91 | |||||||||
| Class F-3 | 13,770 | 306 | 45.01 | |||||||||
| Class 529-A | 6,813,436 | 152,862 | 44.57 | |||||||||
| Class 529-B | 8,266 | 196 | 42.29 | |||||||||
| Class 529-C | 1,565,151 | 37,124 | 42.16 | |||||||||
| Class 529-E | 291,762 | 6,609 | 44.15 | |||||||||
| Class 529-F-1 | 265,175 | 5,962 | 44.48 | |||||||||
| Class R-1 | 428,137 | 10,048 | 42.61 | |||||||||
| Class R-2 | 2,169,950 | 50,447 | 43.01 | |||||||||
| Class R-2E | 71,788 | 1,618 | 44.36 | |||||||||
| Class R-3 | 6,473,055 | 146,463 | 44.20 | |||||||||
| Class R-4 | 8,018,303 | 179,735 | 44.61 | |||||||||
| Class R-5E | 29,172 | 652 | 44.72 | |||||||||
| Class R-5 | 3,620,990 | 80,531 | 44.96 | |||||||||
| Class R-6 | 18,299,603 | 406,438 | 45.02 | |||||||||
| See Notes to Financial Statements | ||||||||||||
| The Growth Fund of America | 11 |
| Statement of operations | unaudited |
| for the six months ended February 28, 2017 | (dollars in thousands) |
| Investment income: | ||||||||
| Income: | ||||||||
| Dividends (net of non-U.S. taxes of $9,780; also includes $55,204 from affiliates) | $ | 823,883 | ||||||
| Interest | 28,796 | $ | 852,679 | |||||
| Fees and expenses*: | ||||||||
| Investment advisory services | 200,130 | |||||||
| Distribution services | 173,330 | |||||||
| Transfer agent services | 77,874 | |||||||
| Administrative services | 21,651 | |||||||
| Reports to shareholders | 2,904 | |||||||
| Registration statement and prospectus | 961 | |||||||
| Trustees’ compensation | 585 | |||||||
| Auditing and legal | 96 | |||||||
| Custodian | 1,174 | |||||||
| Other | 3,087 | 481,792 | ||||||
| Net investment income | 370,887 | |||||||
| Net realized gain and unrealized appreciation: | ||||||||
| Net realized gain (loss) on: | ||||||||
| Investments (includes $370,530 net loss from affiliates) | 5,083,671 | |||||||
| Forward currency contracts | 9,553 | |||||||
| Currency transactions | (703 | ) | 5,092,521 | |||||
| Net unrealized appreciation on: | ||||||||
| Investments (net of non-U.S. taxes of $275) | 9,054,944 | |||||||
| Forward currency contracts | 161 | |||||||
| Currency translations | 1,113 | 9,056,218 | ||||||
| Net realized gain and unrealized appreciation | 14,148,739 | |||||||
| Net increase in net assets resulting from operations | $ | 14,519,626 |
| * | Additional information related to class-specific fees and expenses is included in the Notes to Financial Statements. |
See Notes to Financial Statements
| 12 | The Growth Fund of America |
Statements of changes in net assets
(dollars in thousands)
| Six months ended February 28, 2017* | Year ended August 31, 2016 | |||||||
| Operations: | ||||||||
| Net investment income | $ | 370,887 | $ | 773,600 | ||||
| Net realized gain | 5,092,521 | 8,307,433 | ||||||
| Net unrealized appreciation | 9,056,218 | 3,580,112 | ||||||
| Net increase in net assets resulting from operations | 14,519,626 | 12,661,145 | ||||||
| Dividends and distributions paid to shareholders: | ||||||||
| Dividends from net investment income | (832,859 | ) | (859,355 | ) | ||||
| Distributions from net realized gain on investments | (8,329,164 | ) | (10,963,179 | ) | ||||
| Total dividends and distributions paid to shareholders | (9,162,023 | ) | (11,822,534 | ) | ||||
| Net capital share transactions | 4,123,199 | 3,977,050 | ||||||
| Total increase in net assets | 9,480,802 | 4,815,661 | ||||||
| Net assets: | ||||||||
| Beginning of period | 145,614,792 | 140,799,131 | ||||||
| End of period (including distributions in excess of and undistributed net investment income: $(16,215) and $445,757, respectively) | $ | 155,095,594 | $ | 145,614,792 | ||||
*Unaudited.
See Notes to Financial Statements
| The Growth Fund of America | 13 |
| Notes to financial statements | unaudited |
1. Organization
The Growth Fund of America (the “fund”) is registered under the Investment Company Act of 1940 as an open-end, diversified management investment company. The fund seeks to provide growth of capital.
The fund has 19 share classes consisting of six retail share classes (Classes A, B and C, as well as three F share classes, F-1, F-2 and F-3), five 529 college savings plan share classes (Classes 529-A, 529-B, 529-C, 529-E and 529-F-1) and eight retirement plan share classes (Classes R-1, R-2, R-2E, R-3, R-4, R-5E, R-5 and R-6). The 529 college savings plan share classes can be used to save for college education. The retirement plan share classes are generally offered only through eligible employer-sponsored retirement plans. The fund’s share classes are described further in the following table:
| Share class | Initial sales charge | Contingent deferred sales charge upon redemption | Conversion feature | |||
| Classes A and 529-A | Up to 5.75% | None (except 1% for certain redemptions within one year of purchase without an initial sales charge) | None | |||
| Classes B and 529-B* | None | Declines from 5% to 0% for redemptions within six years of purchase | Classes B and 529-B convert to Classes A and 529-A, respectively, after eight years | |||
| Class C | None | 1% for redemptions within one year of purchase | Class C converts to Class F-1 after 10 years | |||
| Class 529-C | None | 1% for redemptions within one year of purchase | None | |||
| Class 529-E | None | None | None | |||
| Classes F-1, F-2, F-3 and 529-F-1 | None | None | None | |||
| Classes R-1, R-2, R-2E, R-3, R-4, R-5E, R-5 and R-6 | None | None | None |
* Class B and 529-B shares of the fund are not available for purchase.
On January 27, 2017, the fund made an additional retail share class (Class F-3) available for sale pursuant to an amendment to its registration statement filed with the U.S. Securities and Exchange Commission. Refer to the fund’s prospectus for more details.
Holders of all share classes have equal pro rata rights to the assets, dividends and liquidation proceeds of the fund. Each share class has identical voting rights, except for the exclusive right to vote on matters affecting only its class. Share classes have different fees and expenses (“class-specific fees and expenses”), primarily due to different arrangements for distribution, transfer agent and administrative services. Differences in class-specific fees and expenses will result in differences in net investment income and, therefore, the payment of different per-share dividends by each share class.
| 14 | The Growth Fund of America |
2. Significant accounting policies
The fund is an investment company that applies the accounting and reporting guidance issued in Topic 946 by the U.S. Financial Accounting Standards Board. The fund’s financial statements have been prepared to comply with U.S. generally accepted accounting principles (“U.S. GAAP”). These principles require the fund’s investment adviser to make estimates and assumptions that affect reported amounts and disclosures. Actual results could differ from those estimates. Subsequent events, if any, have been evaluated through the date of issuance in the preparation of the financial statements. The fund follows the significant accounting policies described in this section, as well as the valuation policies described in the next section on valuation.
Security transactions and related investment income — Security transactions are recorded by the fund as of the date the trades are executed with brokers. Realized gains and losses from security transactions are determined based on the specific identified cost of the securities. In the event a security is purchased with a delayed payment date, the fund will segregate liquid assets sufficient to meet its payment obligations. Dividend income is recognized on the ex-dividend date and interest income is recognized on an accrual basis. Market discounts, premiums and original issue discounts on fixed-income securities are amortized daily over the expected life of the security.
Class allocations — Income, fees and expenses (other than class-specific fees and expenses) and realized and unrealized gains and losses are allocated daily among the various share classes based on their relative net assets. Class-specific fees and expenses, such as distribution, transfer agent and administrative services, are charged directly to the respective share class.
Dividends and distributions to shareholders — Dividends and distributions to shareholders are recorded on the ex-dividend date.
Currency translation — Assets and liabilities, including investment securities, denominated in currencies other than U.S. dollars are translated into U.S. dollars at the exchange rates supplied by one or more pricing vendors on the valuation date. Purchases and sales of investment securities and income and expenses are translated into U.S. dollars at the exchange rates on the dates of such transactions. The effects of changes in exchange rates on investment securities are included with the net realized gain or loss and net unrealized appreciation or depreciation on investments in the fund’s statement of operations. The realized gain or loss and unrealized appreciation or depreciation resulting from all other transactions denominated in currencies other than U.S. dollars are disclosed separately.
| The Growth Fund of America | 15 |
3. Valuation
Capital Research and Management Company (“CRMC”), the fund’s investment adviser, values the fund’s investments at fair value as defined by U.S. GAAP. The net asset value of each share class of the fund is generally determined as of approximately 4:00 p.m. New York time each day the New York Stock Exchange is open.
Methods and inputs — The fund’s investment adviser uses the following methods and inputs to establish the fair value of the fund’s assets and liabilities. Use of particular methods and inputs may vary over time based on availability and relevance as market and economic conditions evolve.
Equity securities are generally valued at the official closing price of, or the last reported sale price on, the exchange or market on which such securities are traded, as of the close of business on the day the securities are being valued or, lacking any sales, at the last available bid price. Prices for each security are taken from the principal exchange or market on which the security trades.
Fixed-income securities, including short-term securities, are generally valued at prices obtained from one or more pricing vendors. Vendors value such securities based on one or more of the inputs described in the following table. The table provides examples of inputs that are commonly relevant for valuing particular classes of fixed-income securities in which the fund is authorized to invest. However, these classifications are not exclusive, and any of the inputs may be used to value any other class of fixed-income security.
| Fixed-income class | Examples of standard inputs |
| All | Benchmark yields, transactions, bids, offers, quotations from dealers and trading systems, new issues, spreads and other relationships observed in the markets among comparable securities; and proprietary pricing models such as yield measures calculated using factors such as cash flows, financial or collateral performance and other reference data (collectively referred to as “standard inputs”) |
| Corporate bonds & notes; convertible securities | Standard inputs and underlying equity of the issuer |
| Bonds & notes of governments & government agencies | Standard inputs and interest rate volatilities |
When the fund’s investment adviser deems it appropriate to do so (such as when vendor prices are unavailable or deemed to be not representative), fixed-income securities will be valued in good faith at the mean quoted bid and ask prices that are reasonably and timely available (or bid prices, if ask prices are not available) or at prices for securities of comparable maturity, quality and type.
Securities with both fixed-income and equity characteristics, or equity securities traded principally among fixed-income dealers, are generally valued in the manner described for either equity or fixed-income securities, depending on which method is deemed most
| 16 | The Growth Fund of America |
appropriate by the fund’s investment adviser. Forward currency contracts are valued at the mean of representative quoted bid and ask prices, generally based on prices supplied by one or more pricing vendors.
Securities and other assets for which representative market quotations are not readily available or are considered unreliable by the fund’s investment adviser are fair valued as determined in good faith under fair valuation guidelines adopted by authority of the fund’s board of trustees as further described. The investment adviser follows fair valuation guidelines, consistent with U.S. Securities and Exchange Commission rules and guidance, to consider relevant principles and factors when making fair value determinations. The investment adviser considers relevant indications of value that are reasonably and timely available to it in determining the fair value to be assigned to a particular security, such as the type and cost of the security; contractual or legal restrictions on resale of the security; relevant financial or business developments of the issuer; actively traded similar or related securities; conversion or exchange rights on the security; related corporate actions; significant events occurring after the close of trading in the security; and changes in overall market conditions. In addition, the closing prices of equity securities that trade in markets outside U.S. time zones may be adjusted to reflect significant events that occur after the close of local trading but before the net asset value of each share class of the fund is determined. Fair valuations and valuations of investments that are not actively trading involve judgment and may differ materially from valuations that would have been used had greater market activity occurred.
Processes and structure — The fund’s board of trustees has delegated authority to the fund’s investment adviser to make fair value determinations, subject to board oversight. The investment adviser has established a Joint Fair Valuation Committee (the “Fair Valuation Committee”) to administer, implement and oversee the fair valuation process, and to make fair value decisions. The Fair Valuation Committee regularly reviews its own fair value decisions, as well as decisions made under its standing instructions to the investment adviser’s valuation teams. The Fair Valuation Committee reviews changes in fair value measurements from period to period and may, as deemed appropriate, update the fair valuation guidelines to better reflect the results of back testing and address new or evolving issues. The Fair Valuation Committee reports any changes to the fair valuation guidelines to the board of trustees with supplemental information to support the changes. The fund’s board and audit committee also regularly review reports that describe fair value determinations and methods.
The fund’s investment adviser has also established a Fixed-Income Pricing Review Group to administer and oversee the fixed-income valuation process, including the use of fixed-income pricing vendors. This group regularly reviews pricing vendor information and market data. Pricing decisions, processes and controls over security valuation are also subject to additional internal reviews, including an annual control self-evaluation program facilitated by the investment adviser’s compliance group.
| The Growth Fund of America | 17 |
Classifications — The fund’s investment adviser classifies the fund’s assets and liabilities into three levels based on the inputs used to value the assets or liabilities. Level 1 values are based on quoted prices in active markets for identical securities. Level 2 values are based on significant observable market inputs, such as quoted prices for similar securities and quoted prices in inactive markets. Certain securities trading outside the U.S. may transfer between Level 1 and Level 2 due to valuation adjustments resulting from significant market movements following the close of local trading. Level 3 values are based on significant unobservable inputs that reflect the investment adviser’s determination of assumptions that market participants might reasonably use in valuing the securities. The valuation levels are not necessarily an indication of the risk or liquidity associated with the underlying investment. For example, U.S. government securities are reflected as Level 2 because the inputs used to determine fair value may not always be quoted prices in an active market. The following tables present the fund’s valuation levels as of February 28, 2017 (dollars in thousands):
| Investment securities | ||||||||||||||||
| Level 1 | Level 2 | Level 3 | Total | |||||||||||||
| Assets: | ||||||||||||||||
| Common stocks: | ||||||||||||||||
| Information technology | $ | 37,327,536 | $ | 1,092,640 | $ | 123,448 | $ | 38,543,624 | ||||||||
| Consumer discretionary | 33,338,318 | — | — | 33,338,318 | ||||||||||||
| Health care | 19,892,932 | — | 27,436 | 19,920,368 | ||||||||||||
| Energy | 14,102,064 | 109,903 | — | 14,211,967 | ||||||||||||
| Financials | 12,827,544 | 308,902 | — | 13,136,446 | ||||||||||||
| Consumer staples | 7,795,406 | — | — | 7,795,406 | ||||||||||||
| Industrials | 7,202,958 | — | — | 7,202,958 | ||||||||||||
| Materials | 3,914,794 | — | — | 3,914,794 | ||||||||||||
| Other | 2,045,605 | — | — | 2,045,605 | ||||||||||||
| Miscellaneous | 4,799,383 | — | — | 4,799,383 | ||||||||||||
| Preferred securities | 351,252 | — | — | 351,252 | ||||||||||||
| Rights & warrants | 170,931 | — | — | 170,931 | ||||||||||||
| Convertible stocks | — | — | 140,699 | 140,699 | ||||||||||||
| Bonds, notes & other debt instruments | — | 240,687 | — | 240,687 | ||||||||||||
| Short-term securities | — | 9,566,661 | — | 9,566,661 | ||||||||||||
| Total | $ | 143,768,723 | $ | 11,318,793 | $ | 291,583 | $ | 155,379,099 | ||||||||
| Other investments* | ||||||||||||||||
| Level 1 | Level 2 | Level 3 | Total | |||||||||||||
| Assets: | ||||||||||||||||
| Unrealized appreciation on open forward currency contracts | $ | — | $ | 661 | $ | — | $ | 661 | ||||||||
| Liabilities: | ||||||||||||||||
| Unrealized depreciation on open forward currency contracts | — | (25 | ) | — | (25 | ) | ||||||||||
| Total | $ | — | $ | 636 | $ | — | $ | 636 | ||||||||
*Forward currency contracts are not included in the investment portfolio.
| 18 | The Growth Fund of America |
4. Risk factors
Investing in the fund may involve certain risks including, but not limited to, those described below.
Market conditions — The prices of, and the income generated by, the common stocks and other securities held by the fund may decline — sometimes rapidly or unpredictably — due to various factors, including events or conditions affecting the general economy or particular industries; overall market changes; local, regional or global political, social or economic instability; governmental or governmental agency responses to economic conditions; and currency exchange rate, interest rate and commodity price fluctuations.
Issuer risks — The prices of, and the income generated by, securities held by the fund may decline in response to various factors directly related to the issuers of such securities, including reduced demand for an issuer’s goods or services, poor management performance and strategic initiatives such as mergers, acquisitions or dispositions and the market response to any such initiatives.
Investing in growth-oriented stocks — Growth-oriented common stocks and other equity-type securities (such as preferred stocks, convertible preferred stocks and convertible bonds) may involve larger price swings and greater potential for loss than other types of investments.
Investing outside the U.S. — Securities of issuers domiciled outside the U.S., or with significant operations or revenues outside the U.S., may lose value because of adverse political, social, economic or market developments (including social instability, regional conflicts, terrorism and war) in the countries or regions in which the issuers operate or generate revenue. These securities may also lose value due to changes in foreign currency exchange rates against the U.S. dollar and/or currencies of other countries. Issuers of these securities may be more susceptible to actions of foreign governments, such as the imposition of price controls or punitive taxes, that could adversely impact the value of these securities. Securities markets in certain countries may be more volatile and/or less liquid than those in the U.S. Investments outside the U.S. may also be subject to different accounting practices and different regulatory, legal and reporting standards and practices, and may be more difficult to value, than those in the U.S. In addition, the value of investments outside the U.S. may be reduced by foreign taxes, including foreign withholding taxes on interest and dividends. Further, there may be increased risks of delayed settlement of securities purchased or sold by the fund. The risks of investing outside the U.S. may be heightened in connection with investments in emerging markets.
Management — The investment adviser to the fund actively manages the fund’s investments. Consequently, the fund is subject to the risk that the methods and analyses employed by the investment adviser in this process may not produce the desired results. This could cause the fund to lose value or its investment results to lag relevant benchmarks or other funds with similar objectives.
| The Growth Fund of America | 19 |
5. Certain investment techniques
Loan transactions — The fund has entered into loan transactions in which the fund acquires a loan either through an agent, by assignment from another holder, or as a participation interest in another holder’s portion of a loan. The loan is often administered by a financial institution that acts as agent for the holders of the loan, and the fund may be required to receive approval from the agent and/or borrower prior to the sale of the investment. The loan’s interest rate and maturity date may change based on the terms of the loan, including potential early payments of principal.
Forward currency contracts — The fund has entered into forward currency contracts, which represent agreements to exchange currencies on specific future dates at predetermined rates. The fund’s investment adviser uses forward currency contracts to manage the fund’s exposure to changes in exchange rates. Upon entering into these contracts, risks may arise from the potential inability of counterparties to meet the terms of their contracts and from possible movements in exchange rates.
On a daily basis, the fund’s investment adviser values forward currency contracts based on the applicable exchange rates and records unrealized appreciation or depreciation for open forward currency contracts in the fund’s statement of assets and liabilities. Realized gains or losses are recorded at the time the forward currency contract is closed or offset by another contract with the same broker for the same settlement date and currency.
The following tables present the financial statement impacts resulting from the fund’s use of forward currency contracts as of, or for the six months ended, February 28, 2017 (dollars in thousands):
| Assets | Liabilities | |||||||||||||
| Contract | Risk type | Location on statement of assets and liabilities | Value | Location on statement of assets and liabilities | Value | |||||||||
| Forward currency | Currency | Unrealized appreciation on open forward currency contracts | $ | 661 | Unrealized depreciation on open forward currency contracts | $ | 25 | |||||||
| Net realized gain | Net unrealized appreciation | |||||||||||||
| Contract | Risk type | Location on statement of operations | Value | Location on statement of operations | Value | |||||||||
| Forward currency | Currency | Net realized gain on forward currency contracts | $ | 9,553 | Net unrealized appreciation on forward currency contracts | $ | 161 | |||||||
Collateral — The fund participates in a collateral program due to its use of forward currency contracts. The program calls for the fund to either receive or pledge collateral based on the net gain or loss on unsettled forward currency contracts by counterparty. The purpose of the collateral is to cover potential losses that could occur in the event that either party cannot meet its contractual obligations.
| 20 | The Growth Fund of America |
Rights of offset — The fund has entered into enforceable master netting agreements with certain counterparties for forward currency contracts, where on any date amounts payable by each party to the other (in the same currency with respect to the same transaction) may be closed or offset by each party’s payment obligation. If an early termination date occurs under these agreements following an event of default or termination event, all obligations of each party to its counterparty are settled net through a single payment in a single currency (“close-out netting”). For financial reporting purposes, the fund does not offset financial assets and financial liabilities that are subject to these master netting arrangements in the statement of assets and liabilities.
The following table presents the fund’s forward currency contracts by counterparty that are subject to master netting agreements but that are not offset in the fund’s statement of assets and liabilities. The net amount column shows the impact of offsetting on the fund’s statement of assets and liabilities as of February 28, 2017, if close-out netting was exercised (dollars in thousands):
| Gross amounts not offset in the | ||||||||||||||||||||
| Gross amounts | statement of assets and liabilities and | |||||||||||||||||||
| recognized in the | subject to a master netting agreement | |||||||||||||||||||
| statement of assets | Available | Non-cash | Cash | Net | ||||||||||||||||
| Counterparty | and liabilities | to offset | collateral* | collateral | amount | |||||||||||||||
| Assets: | ||||||||||||||||||||
| Barclays Bank PLC | $ | 661 | $ | — | $ | (661 | ) | $ | — | $ | — | |||||||||
| Liabilities: | ||||||||||||||||||||
| JPMorgan Chase | $ | 25 | $ | — | $ | — | $ | — | $ | 25 | ||||||||||
*Non-cash collateral is shown on a settlement basis.
6. Taxation and distributions
Federal income taxation — The fund complies with the requirements under Subchapter M of the Internal Revenue Code applicable to mutual funds and intends to distribute substantially all of its net taxable income and net capital gains each year. The fund is not subject to income taxes to the extent such distributions are made. Therefore, no federal income tax provision is required.
As of and during the period ended February 28, 2017, the fund did not have a liability for any unrecognized tax benefits. The fund recognizes interest and penalties, if any, related to unrecognized tax benefits as income tax expense in the statement of operations. During the period, the fund did not incur any interest or penalties.
The fund is not subject to examination by U.S. federal tax authorities for tax years before 2012, by state tax authorities for tax years before 2011 and by tax authorities outside the U.S. for tax years before 2009.
Non-U.S. taxation — Dividend and interest income are recorded net of non-U.S. taxes paid. The fund may file withholding tax reclaims in certain jurisdictions to recover a portion of amounts previously withheld. As a result of rulings from European courts, the
| The Growth Fund of America | 21 |
fund filed for additional reclaims related to prior years. These reclaims are recorded when the amount is known and there are no significant uncertainties on collectability. Gains realized by the fund on the sale of securities in certain countries are subject to non-U.S. taxes. The fund records an estimated deferred tax liability based on unrealized gains to provide for potential non-U.S. taxes payable upon the sale of these securities.
Distributions — Distributions paid to shareholders are based on net investment income and net realized gains determined on a tax basis, which may differ from net investment income and net realized gains for financial reporting purposes. These differences are due primarily to different treatment for items such as currency gains and losses; short-term capital gains and losses; capital losses related to sales of certain securities within 30 days of purchase; unrealized appreciation of certain investments in securities outside the U.S.; cost of investments sold and income on certain investments. The fiscal year in which amounts are distributed may differ from the year in which the net investment income and net realized gains are recorded by the fund for financial reporting purposes.
The components of distributable earnings on a tax basis are reported as of the fund’s most recent year-end. As of August 31, 2016, the components of distributable earnings on a tax basis were as follows (dollars in thousands):
| Undistributed ordinary income | $ | 549,946 | ||
| Undistributed long-term capital gains | 7,396,796 |
As of February 28, 2017, the tax basis unrealized appreciation (depreciation) and cost of investment securities were as follows (dollars in thousands):
| Gross unrealized appreciation on investment securities | $ | 63,851,030 | ||
| Gross unrealized depreciation on investment securities | (1,706,004 | ) | ||
| Net unrealized appreciation on investment securities | 62,145,026 | |||
| Cost of investment securities | 93,234,073 |
| 22 | The Growth Fund of America |
The tax character of distributions paid to shareholders was as follows (dollars in thousands):
| Six months ended February 28, 2017 | Year ended August 31, 2016 | |||||||||||||||||||||||
| Total | Total | |||||||||||||||||||||||
| dividends and | dividends and | |||||||||||||||||||||||
| Ordinary | Long-term | distributions | Ordinary | Long-term | distributions | |||||||||||||||||||
| Share class | income | capital gains | paid | income | capital gains | paid | ||||||||||||||||||
| Class A | $ | 417,499 | $ | 4,216,644 | $ | 4,634,143 | $ | 450,948 | $ | 5,611,765 | $ | 6,062,713 | ||||||||||||
| Class B | — | 5,716 | 5,716 | — | 32,520 | 32,520 | ||||||||||||||||||
| Class C | — | 288,378 | 288,378 | 1 | 437,938 | 437,939 | ||||||||||||||||||
| Class F-1 | 43,578 | 482,570 | 526,148 | 47,315 | 648,267 | 695,582 | ||||||||||||||||||
| Class F-2 | 104,629 | 750,183 | 854,812 | 92,798 | 849,837 | 942,635 | ||||||||||||||||||
| Class F-31 | — | — | — | |||||||||||||||||||||
| Class 529-A | 31,754 | 363,317 | 395,071 | 32,055 | 461,533 | 493,588 | ||||||||||||||||||
| Class 529-B | — | 1,160 | 1,160 | — | 6,207 | 6,207 | ||||||||||||||||||
| Class 529-C | — | 89,388 | 89,388 | (42 | ) | 117,221 | 117,179 | |||||||||||||||||
| Class 529-E | 761 | 15,850 | 16,611 | 788 | 20,684 | 21,472 | ||||||||||||||||||
| Class 529-F-1 | 1,750 | 13,817 | 15,567 | 1,630 | 16,544 | 18,174 | ||||||||||||||||||
| Class R-1 | — | 25,190 | 25,190 | — | 37,260 | 37,260 | ||||||||||||||||||
| Class R-2 | — | 124,369 | 124,369 | — | 176,138 | 176,138 | ||||||||||||||||||
| Class R-2E | 170 | 2,473 | 2,643 | 34 | 284 | 318 | ||||||||||||||||||
| Class R-3 | 15,059 | 367,017 | 382,076 | 17,637 | 545,696 | 563,333 | ||||||||||||||||||
| Class R-4 | 42,379 | 436,297 | 478,676 | 41,069 | 546,348 | 587,417 | ||||||||||||||||||
| Class R-5E2 | 151 | 941 | 1,092 | — | 3 | 1 | 1 | |||||||||||||||||
| Class R-5 | 27,991 | 196,269 | 224,260 | 43,844 | 379,661 | 423,505 | ||||||||||||||||||
| Class R-6 | 147,138 | 949,585 | 1,096,723 | 131,278 | 1,075,275 | 1,206,553 | ||||||||||||||||||
| Total | $ | 832,859 | $ | 8,329,164 | $ | 9,162,023 | $ | 859,355 | $ | 10,963,179 | $ | 11,822,534 | ||||||||||||
| 1 | Class F-3 shares were offered beginning January 27, 2017. |
| 2 | Class R-5E shares were offered beginning November 20, 2015. |
| 3 | Amount less than one thousand. |
7. Fees and transactions with related parties
CRMC, the fund’s investment adviser, is the parent company of American Funds Distributors,® Inc. (“AFD”), the principal underwriter of the fund’s shares, and American Funds Service Company® (“AFS”), the fund’s transfer agent. CRMC, AFD and AFS are considered related parties to the fund.
Investment advisory services — The fund has an investment advisory and service agreement with CRMC that provides for monthly fees accrued daily. These fees are based on a series of decreasing annual rates beginning with 0.500% on the first $1 billion of daily net assets and decreasing to 0.233% on such assets in excess of $210 billion. For the six months ended February 28, 2017, the investment advisory services fee was $200,130,000, which was equivalent to an annualized rate of 0.273% of average daily net assets.
| The Growth Fund of America | 23 |
Class-specific fees and expenses — Expenses that are specific to individual share classes are accrued directly to the respective share class. The principal class-specific fees and expenses are further described below:
Distribution services — The fund has plans of distribution for all share classes, except Class F-2, F-3, R-5E, R-5 and R-6 shares. Under the plans, the board of trustees approves certain categories of expenses that are used to finance activities primarily intended to sell fund shares and service existing accounts. The plans provide for payments, based on an annualized percentage of average daily net assets, ranging from 0.25% to 1.00% as noted in this section. In some cases, the board of trustees has limited the amounts that may be paid to less than the maximum allowed by the plans. All share classes with a plan may use up to 0.25% of average daily net assets to pay service fees, or to compensate AFD for paying service fees, to firms that have entered into agreements with AFD to provide certain shareholder services. The remaining amounts available to be paid under each plan are paid to dealers to compensate them for their sales activities.
For Class A and 529-A shares, distribution-related expenses include the reimbursement of dealer and wholesaler commissions paid by AFD for certain shares sold without a sales charge. These share classes reimburse AFD for amounts billed within the prior 15 months but only to the extent that the overall annual expense limit of 0.25% is not exceeded. As of February 28, 2017, there were no unreimbursed expenses subject to reimbursement for Class A or 529-A shares.
| Share class | Currently approved limits | Plan limits | |||||||
| Class A | 0.25 | % | 0.25 | % | |||||
| Class 529-A | 0.25 | 0.50 | |||||||
| Classes B and 529-B | 1.00 | 1.00 | |||||||
| Classes C, 529-C and R-1 | 1.00 | 1.00 | |||||||
| Class R-2 | 0.75 | 1.00 | |||||||
| Class R-2E | 0.60 | 0.85 | |||||||
| Classes 529-E and R-3 | 0.50 | 0.75 | |||||||
| Classes F-1, 529-F-1 and R-4 | 0.25 | 0.50 | |||||||
Transfer agent services — The fund has a shareholder services agreement with AFS under which the fund compensates AFS for providing transfer agent services to each of the fund’s share classes. These services include recordkeeping, shareholder communications and transaction processing. In addition, the fund reimburses AFS for amounts paid to third parties for performing transfer agent services on behalf of fund shareholders.
Administrative services — The fund has an administrative services agreement with CRMC under which the fund compensates CRMC for providing administrative services to Class A, C, F, 529 and R shares. These services include, but are not limited to, coordinating, monitoring, assisting and overseeing third parties that provide
| 24 | The Growth Fund of America |
services to fund shareholders. Under the agreement, Class A shares pay an annual fee of 0.01% and Class C, F, 529 and R shares pay an annual fee of 0.05% of their respective average daily net assets.
529 plan services — Each 529 share class is subject to service fees to compensate the Virginia College Savings Plan (“Virginia529”) for its oversight and administration of the 529 college savings plan. The quarterly fee is based on a series of decreasing annual rates beginning with 0.10% on the first $20 billion of the net assets invested in the Class 529 shares of the American Funds and decreasing to 0.03% on such assets in excess of $100 billion. The fee for any given calendar quarter is accrued and calculated on the basis of the average net assets of Class 529 shares of the American Funds for the last month of the prior calendar quarter. The fee is included in other expenses in the fund’s statement of operations. Virginia529 is not considered a related party to the fund.
For the six months ended February 28, 2017, class-specific expenses under the agreements were as follows (dollars in thousands):
| Distribution | Transfer agent | Administrative | 529 plan | ||||||||||||
| Share class | services | services | services | services | |||||||||||
| Class A | $87,622 | $44,933 | $3,734 | Not applicable | |||||||||||
| Class B | 582 | 93 | Not applicable | Not applicable | |||||||||||
| Class C | 23,995 | 2,915 | 1,206 | Not applicable | |||||||||||
| Class F-1 | 10,587 | 5,281 | 2,118 | Not applicable | |||||||||||
| Class F-2 | Not applicable | 6,693 | 3,261 | Not applicable | |||||||||||
| Class F-3* | Not applicable | — | † | — | † | Not applicable | |||||||||
| Class 529-A | 6,947 | 3,167 | 1,589 | $2,204 | |||||||||||
| Class 529-B | 117 | 19 | 6 | 8 | |||||||||||
| Class 529-C | 7,311 | 776 | 370 | 514 | |||||||||||
| Class 529-E | 680 | 84 | 69 | 95 | |||||||||||
| Class 529-F-1 | — | 119 | 60 | 83 | |||||||||||
| Class R-1 | 2,111 | 242 | 106 | Not applicable | |||||||||||
| Class R-2 | 7,839 | 3,772 | 527 | Not applicable | |||||||||||
| Class R-2E | 141 | 44 | 12 | Not applicable | |||||||||||
| Class R-3 | 15,794 | 4,882 | 1,589 | Not applicable | |||||||||||
| Class R-4 | 9,604 | 3,931 | 1,923 | Not applicable | |||||||||||
| Class R-5E | Not applicable | 5 | 3 | Not applicable | |||||||||||
| Class R-5 | Not applicable | 883 | 868 | Not applicable | |||||||||||
| Class R-6 | Not applicable | 35 | 4,210 | Not applicable | |||||||||||
| Total class-specific expenses | $173,330 | $77,874 | $21,651 | $2,904 | |||||||||||
| * | Class F-3 shares were offered beginning January 27, 2017. | |
| † | Amount less than one thousand. |
Trustees’ deferred compensation — Trustees who are unaffiliated with CRMC may elect to defer the cash payment of part or all of their compensation. These deferred amounts, which remain as liabilities of the fund, are treated as if invested in shares of the fund or other American Funds. These amounts represent general, unsecured liabilities of the fund and vary according to the total returns of the selected funds. Trustees’ compensation of
| The Growth Fund of America | 25 |
$585,000 in the fund’s statement of operations reflects $259,000 in current fees (either paid in cash or deferred) and a net increase of $326,000 in the value of the deferred amounts.
Affiliated officers and trustees — Officers and certain trustees of the fund are or may be considered to be affiliated with CRMC, AFD and AFS. No affiliated officers or trustees received any compensation directly from the fund.
Security transactions with related funds — The fund may purchase from, or sell securities to, other funds managed by CRMC (or funds managed by certain affiliates of CRMC) under procedures adopted by the fund’s board of trustees. The funds involved in such transactions are considered related by virtue of having a common investment adviser (or affiliated investment advisers), common trustees and/or common officers. When such transactions occur, each transaction is executed at the current market price of the security and no brokerage commissions or fees are paid in accordance with Rule 17a-7 of the 1940 Act.
8. Capital share transactions
Capital share transactions in the fund were as follows (dollars and shares in thousands):
| Sales1 | Reinvestments of dividends and distributions | Repurchases1 | Net increase (decrease) | |||||||||||||||||||||||||||||
| Share class | Amount | Shares | Amount | Shares | Amount | Shares | Amount | Shares | ||||||||||||||||||||||||
| Six months ended February 28, 2017 | ||||||||||||||||||||||||||||||||
| Class A | $ | 2,647,515 | 60,250 | $ | 4,560,110 | 106,969 | $ | (6,531,440 | ) | (149,020 | ) | $ | 676,185 | 18,199 | ||||||||||||||||||
| Class B | 397 | 10 | 5,673 | 140 | (155,349 | ) | (3,722 | ) | (149,279 | ) | (3,572 | ) | ||||||||||||||||||||
| Class C | 291,973 | 7,109 | 283,425 | 7,109 | (875,435 | ) | (21,310 | ) | (300,037 | ) | (7,092 | ) | ||||||||||||||||||||
| Class F-1 | 659,214 | 15,070 | 514,201 | 12,139 | (1,179,562 | ) | (27,049 | ) | (6,147 | ) | 160 | |||||||||||||||||||||
| Class F-2 | 3,357,277 | 76,500 | 819,206 | 19,262 | (1,736,596 | ) | (39,719 | ) | 2,439,887 | 56,043 | ||||||||||||||||||||||
| Class F-32 | 13,661 | 306 | — | — | (10 | ) | — | 3 | 13,651 | 306 | ||||||||||||||||||||||
| Class 529-A | 331,271 | 7,615 | 394,994 | 9,353 | (378,146 | ) | (8,703 | ) | 348,119 | 8,265 | ||||||||||||||||||||||
| Class 529-B | 160 | 4 | 1,160 | 29 | (33,956 | ) | (818 | ) | (32,636 | ) | (785 | ) | ||||||||||||||||||||
| Class 529-C | 69,101 | 1,679 | 89,319 | 2,232 | (113,462 | ) | (2,756 | ) | 44,958 | 1,155 | ||||||||||||||||||||||
| Class 529-E | 13,280 | 309 | 16,611 | 397 | (20,320 | ) | (473 | ) | 9,571 | 233 | ||||||||||||||||||||||
| Class 529-F-1 | 29,763 | 682 | 15,562 | 370 | (20,094 | ) | (463 | ) | 25,231 | 589 | ||||||||||||||||||||||
| Class R-1 | 18,974 | 455 | 25,164 | 623 | (68,269 | ) | (1,645 | ) | (24,131 | ) | (567 | ) | ||||||||||||||||||||
| Class R-2 | 208,687 | 4,970 | 124,234 | 3,044 | (374,436 | ) | (8,933 | ) | (41,515 | ) | (919 | ) | ||||||||||||||||||||
| Class R-2E | 35,123 | 821 | 2,643 | 63 | (2,907 | ) | (67 | ) | 34,859 | 817 | ||||||||||||||||||||||
| Class R-3 | 472,867 | 10,967 | 380,953 | 9,092 | (1,117,364 | ) | (26,051 | ) | (263,544 | ) | (5,992 | ) | ||||||||||||||||||||
| Class R-4 | 616,234 | 14,194 | 478,458 | 11,319 | (1,117,711 | ) | (25,740 | ) | (23,019 | ) | (227 | ) | ||||||||||||||||||||
| Class R-5E | 28,458 | 637 | 1,092 | 26 | (496 | ) | (11 | ) | 29,054 | 652 | ||||||||||||||||||||||
| Class R-5 | 315,507 | 7,179 | 223,575 | 5,251 | (590,745 | ) | (13,544 | ) | (51,663 | ) | (1,114 | ) | ||||||||||||||||||||
| Class R-6 | 1,837,213 | 41,918 | 1,095,526 | 25,699 | (1,539,084 | ) | (35,265 | ) | 1,393,655 | 32,352 | ||||||||||||||||||||||
| Total net increase (decrease) | $ | 10,946,675 | 250,675 | $ | 9,031,906 | 213,117 | $ | (15,855,382 | ) | (365,289 | ) | $ | 4,123,199 | 98,503 | ||||||||||||||||||
| 26 | The Growth Fund of America |
| Sales1 | Reinvestments of dividends and distributions | Repurchases1 | Net increase (decrease) | |||||||||||||||||||||||||||||
| Share class | Amount | Shares | Amount | Shares | Amount | Shares | Amount | Shares | ||||||||||||||||||||||||
| Year ended August 31, 2016 | ||||||||||||||||||||||||||||||||
| Class A | $ | 4,924,929 | 118,808 | $ | 5,967,182 | 145,116 | $ | (8,823,043 | ) | (212,227 | ) | $ | 2,069,068 | 51,697 | ||||||||||||||||||
| Class B | 2,900 | 73 | 32,239 | 823 | (311,833 | ) | (7,948 | ) | (276,694 | ) | (7,052 | ) | ||||||||||||||||||||
| Class C | 613,767 | 15,737 | 429,366 | 11,095 | (1,477,000 | ) | (38,034 | ) | (433,867 | ) | (11,202 | ) | ||||||||||||||||||||
| Class F-1 | 1,280,513 | 31,126 | 681,004 | 16,662 | (1,787,811 | ) | (43,329 | ) | 173,706 | 4,459 | ||||||||||||||||||||||
| Class F-2 | 2,744,672 | 66,007 | 900,960 | 21,959 | (2,359,964 | ) | (57,176 | ) | 1,285,668 | 30,790 | ||||||||||||||||||||||
| Class 529-A | 545,610 | 13,265 | 493,503 | 12,105 | (703,145 | ) | (16,965 | ) | 335,968 | 8,405 | ||||||||||||||||||||||
| Class 529-B | 869 | 22 | 6,205 | 159 | (58,490 | ) | (1,491 | ) | (51,416 | ) | (1,310 | ) | ||||||||||||||||||||
| Class 529-C | 134,779 | 3,439 | 117,144 | 3,016 | (204,040 | ) | (5,183 | ) | 47,883 | 1,272 | ||||||||||||||||||||||
| Class 529-E | 24,266 | 593 | 21,469 | 531 | (34,866 | ) | (849 | ) | 10,869 | 275 | ||||||||||||||||||||||
| Class 529-F-1 | 40,707 | 985 | 18,175 | 447 | (40,465 | ) | (973 | ) | 18,417 | 459 | ||||||||||||||||||||||
| Class R-1 | 39,701 | 1,000 | 37,230 | 950 | (121,308 | ) | (3,036 | ) | (44,377 | ) | (1,086 | ) | ||||||||||||||||||||
| Class R-2 | 382,669 | 9,637 | 175,984 | 4,451 | (666,231 | ) | (16,699 | ) | (107,578 | ) | (2,611 | ) | ||||||||||||||||||||
| Class R-2E | 34,224 | 848 | 317 | 8 | (2,323 | ) | (57 | ) | 32,218 | 799 | ||||||||||||||||||||||
| Class R-3 | 855,016 | 20,987 | 561,836 | 13,890 | (2,131,593 | ) | (52,228 | ) | (714,741 | ) | (17,351 | ) | ||||||||||||||||||||
| Class R-4 | 1,965,510 | 47,586 | 587,103 | 14,390 | (1,995,615 | ) | (48,313 | ) | 556,998 | 13,663 | ||||||||||||||||||||||
| Class R-5E4 | 10 | — | 3 | — | — | — | — | 10 | — | 3 | ||||||||||||||||||||||
| Class R-5 | 621,642 | 15,092 | 422,476 | 10,289 | (2,420,640 | ) | (58,716 | ) | (1,376,522 | ) | (33,335 | ) | ||||||||||||||||||||
| Class R-6 | 3,563,488 | 86,963 | 1,204,830 | 29,300 | (2,316,878 | ) | (55,403 | ) | 2,451,440 | 60,860 | ||||||||||||||||||||||
| Total net increase (decrease) | $ | 17,775,272 | 432,168 | $ | 11,657,023 | 285,191 | $ | (25,455,245 | ) | (618,627 | ) | $ | 3,977,050 | 98,732 | ||||||||||||||||||
| 1 | Includes exchanges between share classes of the fund. |
| 2 | Class F-3 shares were offered beginning January 27, 2017. |
| 3 | Amount less than one thousand. |
| 4 | Class R-5E shares were offered beginning November 20, 2015. |
9. Investment transactions
The fund made purchases and sales of investment securities, excluding short-term securities and U.S. government obligations, if any, of $17,757,908,000 and $21,208,173,000, respectively, during the six months ended February 28, 2017.
| The Growth Fund of America | 27 |
Financial highlights
| Income from investment operations1 | ||||||||||||||||
| Net asset value, beginning of period | Net investment income (loss) | Net gains on securities (both realized and unrealized) | Total from investment operations | |||||||||||||
| Class A: | ||||||||||||||||
| Six months ended 2/28/20173,4 | $ | 43.47 | $ | .11 | $ | 4.19 | $ | 4.30 | ||||||||
| Year ended 8/31/2016 | 43.31 | .24 | 3.58 | 3.82 | ||||||||||||
| Year ended 8/31/2015 | 46.70 | .23 | .61 | .84 | ||||||||||||
| Year ended 8/31/2014 | 39.93 | .17 | 9.49 | 9.66 | ||||||||||||
| Year ended 8/31/2013 | 32.80 | .22 | 7.19 | 7.41 | ||||||||||||
| Year ended 8/31/2012 | 29.23 | .20 | 3.59 | 3.79 | ||||||||||||
| Class B: | ||||||||||||||||
| Six months ended 2/28/20173,4 | 41.20 | (.05 | ) | 3.95 | 3.90 | |||||||||||
| Year ended 8/31/2016 | 41.26 | (.09 | ) | 3.42 | 3.33 | |||||||||||
| Year ended 8/31/2015 | 44.84 | (.11 | ) | .59 | .48 | |||||||||||
| Year ended 8/31/2014 | 38.60 | (.15 | ) | 9.14 | 8.99 | |||||||||||
| Year ended 8/31/2013 | 31.69 | (.05 | ) | 6.96 | 6.91 | |||||||||||
| Year ended 8/31/2012 | 28.23 | (.03 | ) | 3.49 | 3.46 | |||||||||||
| Class C: | ||||||||||||||||
| Six months ended 2/28/20173,4 | 40.69 | (.06 | ) | 3.92 | 3.86 | |||||||||||
| Year ended 8/31/2016 | 40.80 | (.09 | ) | 3.37 | 3.28 | |||||||||||
| Year ended 8/31/2015 | 44.41 | (.12 | ) | .57 | .45 | |||||||||||
| Year ended 8/31/2014 | 38.27 | (.17 | ) | 9.06 | 8.89 | |||||||||||
| Year ended 8/31/2013 | 31.44 | (.07 | ) | 6.91 | 6.84 | |||||||||||
| Year ended 8/31/2012 | 28.02 | (.04 | ) | 3.46 | 3.42 | |||||||||||
| Class F-1: | ||||||||||||||||
| Six months ended 2/28/20173,4 | 43.20 | .10 | 4.16 | 4.26 | ||||||||||||
| Year ended 8/31/2016 | 43.05 | .22 | 3.57 | 3.79 | ||||||||||||
| Year ended 8/31/2015 | 46.40 | .20 | .61 | .81 | ||||||||||||
| Year ended 8/31/2014 | 39.69 | .15 | 9.43 | 9.58 | ||||||||||||
| Year ended 8/31/2013 | 32.61 | .21 | 7.15 | 7.36 | ||||||||||||
| Year ended 8/31/2012 | 29.04 | .21 | 3.58 | 3.79 | ||||||||||||
| Class F-2: | ||||||||||||||||
| Six months ended 2/28/20173,4 | 43.45 | .16 | 4.18 | 4.34 | ||||||||||||
| Year ended 8/31/2016 | 43.29 | .33 | 3.59 | 3.92 | ||||||||||||
| Year ended 8/31/2015 | 46.71 | .33 | .60 | .93 | ||||||||||||
| Year ended 8/31/2014 | 39.95 | .27 | 9.48 | 9.75 | ||||||||||||
| Year ended 8/31/2013 | 32.83 | .32 | 7.19 | 7.51 | ||||||||||||
| Year ended 8/31/2012 | 29.25 | .28 | 3.60 | 3.88 | ||||||||||||
| Class F-3: | ||||||||||||||||
| Period from 1/27/2017 to 2/28/20173,4,7 | 44.36 | .04 | .61 | .65 | ||||||||||||
| 28 | The Growth Fund of America |
| Dividends and distributions | ||||||||||||||||||||||||||||||
| Dividends (from net investment income) | Distributions (from capital gains) | Total dividends and distributions | Net asset value, end of period | Total return2 | Net assets, end of period (in millions) | Ratio of expenses to average net assets | Ratio of net income (loss) to average net assets | |||||||||||||||||||||||
| $ | (.25 | ) | $ | (2.53 | ) | $ | (2.78 | ) | $ | 44.99 | 10.24 | %5 | $ | 78,283 | .65 | %6 | .52 | %6 | ||||||||||||
| (.27 | ) | (3.39 | ) | (3.66 | ) | 43.47 | 9.31 | 74,847 | .66 | .57 | ||||||||||||||||||||
| (.17 | ) | (4.06 | ) | (4.23 | ) | 43.31 | 2.12 | 72,321 | .65 | .51 | ||||||||||||||||||||
| (.14 | ) | (2.75 | ) | (2.89 | ) | 46.70 | 25.00 | 73,975 | .66 | .39 | ||||||||||||||||||||
| (.28 | ) | — | (.28 | ) | 39.93 | 22.74 | 62,602 | .70 | .60 | |||||||||||||||||||||
| (.22 | ) | — | (.22 | ) | 32.80 | 13.07 | 55,441 | .71 | .66 | |||||||||||||||||||||
| — | (2.53 | ) | (2.53 | ) | 42.57 | 9.80 | 5 | 51 | 1.42 | 6 | (.24 | )6 | ||||||||||||||||||
| — | (3.39 | ) | (3.39 | ) | 41.20 | 8.50 | 196 | 1.42 | (.22 | ) | ||||||||||||||||||||
| — | (4.06 | ) | (4.06 | ) | 41.26 | 1.36 | 487 | 1.40 | (.25 | ) | ||||||||||||||||||||
| — | (2.75 | ) | (2.75 | ) | 44.84 | 24.05 | 873 | 1.41 | (.37 | ) | ||||||||||||||||||||
| — | — | — | 38.60 | 21.81 | 1,168 | 1.46 | (.14 | ) | ||||||||||||||||||||||
| — | — | — | 31.69 | 12.26 | 1,503 | 1.46 | (.10 | ) | ||||||||||||||||||||||
| — | (2.53 | ) | (2.53 | ) | 42.02 | 9.82 | 5 | 4,874 | 1.45 | 6 | (.28 | )6 | ||||||||||||||||||
| — | (3.39 | ) | (3.39 | ) | 40.69 | 8.47 | 5,009 | 1.46 | (.23 | ) | ||||||||||||||||||||
| — | (4.06 | ) | (4.06 | ) | 40.80 | 1.29 | 5,480 | 1.45 | (.29 | ) | ||||||||||||||||||||
| — | (2.75 | ) | (2.75 | ) | 44.41 | 23.99 | 6,232 | 1.45 | (.41 | ) | ||||||||||||||||||||
| (.01 | ) | — | (.01 | ) | 38.27 | 21.76 | 5,986 | 1.50 | (.20 | ) | ||||||||||||||||||||
| — | — | — | 31.44 | 12.21 | 5,741 | 1.49 | (.13 | ) | ||||||||||||||||||||||
| (.23 | ) | (2.53 | ) | (2.76 | ) | 44.70 | 10.21 | 5 | 8,796 | .71 | 6 | .46 | 6 | |||||||||||||||||
| (.25 | ) | (3.39 | ) | (3.64 | ) | 43.20 | 9.28 | 8,494 | .71 | .52 | ||||||||||||||||||||
| (.10 | ) | (4.06 | ) | (4.16 | ) | 43.05 | 2.07 | 8,273 | .70 | .46 | ||||||||||||||||||||
| (.12 | ) | (2.75 | ) | (2.87 | ) | 46.40 | 24.93 | 10,569 | .69 | .36 | ||||||||||||||||||||
| (.28 | ) | — | (.28 | ) | 39.69 | 22.71 | 11,180 | .71 | .59 | |||||||||||||||||||||
| (.22 | ) | — | (.22 | ) | 32.61 | 13.15 | 11,323 | .68 | .69 | |||||||||||||||||||||
| (.35 | ) | (2.53 | ) | (2.88 | ) | 44.91 | 10.37 | 5 | 15,023 | .43 | 6 | .73 | 6 | |||||||||||||||||
| (.37 | ) | (3.39 | ) | (3.76 | ) | 43.45 | 9.57 | 12,100 | .44 | .79 | ||||||||||||||||||||
| (.29 | ) | (4.06 | ) | (4.35 | ) | 43.29 | 2.35 | 10,723 | .43 | .73 | ||||||||||||||||||||
| (.24 | ) | (2.75 | ) | (2.99 | ) | 46.71 | 25.27 | 8,637 | .43 | .62 | ||||||||||||||||||||
| (.39 | ) | — | (.39 | ) | 39.95 | 23.05 | 4,358 | .44 | .86 | |||||||||||||||||||||
| (.30 | ) | — | (.30 | ) | 32.83 | 13.42 | 2,855 | .44 | .93 | |||||||||||||||||||||
| — | — | — | 45.01 | 1.47 | 5 | 14 | .03 | 5 | .11 | 5 | ||||||||||||||||||||
See page 35 for footnotes.
| The Growth Fund of America | 29 |
Financial highlights (continued)
| Income from investment operations1 | ||||||||||||||||
| Net asset value, beginning of period | Net investment income (loss) | Net gains on securities (both realized and unrealized) | Total from investment operations | |||||||||||||
| Class 529-A: | ||||||||||||||||
| Six months ended 2/28/20173,4 | $ | 43.08 | $ | .10 | $ | 4.14 | $ | 4.24 | ||||||||
| Year ended 8/31/2016 | 42.95 | .20 | 3.56 | 3.76 | ||||||||||||
| Year ended 8/31/2015 | 46.35 | .19 | .61 | .80 | ||||||||||||
| Year ended 8/31/2014 | 39.66 | .13 | 9.42 | 9.55 | ||||||||||||
| Year ended 8/31/2013 | 32.59 | .19 | 7.15 | 7.34 | ||||||||||||
| Year ended 8/31/2012 | 29.06 | .18 | 3.57 | 3.75 | ||||||||||||
| Class 529-B: | ||||||||||||||||
| Six months ended 2/28/20173,4 | 40.95 | (.07 | ) | 3.94 | 3.87 | |||||||||||
| Year ended 8/31/2016 | 41.08 | (.13 | ) | 3.39 | 3.26 | |||||||||||
| Year ended 8/31/2015 | 44.71 | (.16 | ) | .59 | .43 | |||||||||||
| Year ended 8/31/2014 | 38.54 | (.20 | ) | 9.12 | 8.92 | |||||||||||
| Year ended 8/31/2013 | 31.67 | (.09 | ) | 6.96 | 6.87 | |||||||||||
| Year ended 8/31/2012 | 28.25 | (.06 | ) | 3.48 | 3.42 | |||||||||||
| Class 529-C: | ||||||||||||||||
| Six months ended 2/28/20173,4 | 40.83 | (.07 | ) | 3.93 | 3.86 | |||||||||||
| Year ended 8/31/2016 | 40.96 | (.11 | ) | 3.37 | 3.26 | |||||||||||
| Year ended 8/31/2015 | 44.58 | (.15 | ) | .59 | .44 | |||||||||||
| Year ended 8/31/2014 | 38.43 | (.20 | ) | 9.10 | 8.90 | |||||||||||
| Year ended 8/31/2013 | 31.60 | (.09 | ) | 6.94 | 6.85 | |||||||||||
| Year ended 8/31/2012 | 28.18 | (.06 | ) | 3.48 | 3.42 | |||||||||||
| Class 529-E: | ||||||||||||||||
| Six months ended 2/28/20173,4 | 42.65 | .04 | 4.11 | 4.15 | ||||||||||||
| Year ended 8/31/2016 | 42.54 | .10 | 3.53 | 3.63 | ||||||||||||
| Year ended 8/31/2015 | 45.94 | .08 | .60 | .68 | ||||||||||||
| Year ended 8/31/2014 | 39.34 | .03 | 9.33 | 9.36 | ||||||||||||
| Year ended 8/31/2013 | 32.33 | .10 | 7.10 | 7.20 | ||||||||||||
| Year ended 8/31/2012 | 28.82 | .10 | 3.54 | 3.64 | ||||||||||||
| Class 529-F-1: | ||||||||||||||||
| Six months ended 2/28/20173,4 | 43.04 | .14 | 4.15 | 4.29 | ||||||||||||
| Year ended 8/31/2016 | 42.92 | .29 | 3.55 | 3.84 | ||||||||||||
| Year ended 8/31/2015 | 46.33 | .29 | .59 | .88 | ||||||||||||
| Year ended 8/31/2014 | 39.64 | .23 | 9.41 | 9.64 | ||||||||||||
| Year ended 8/31/2013 | 32.57 | .27 | 7.14 | 7.41 | ||||||||||||
| Year ended 8/31/2012 | 29.04 | .25 | 3.56 | 3.81 | ||||||||||||
| Class R-1: | ||||||||||||||||
| Six months ended 2/28/20173,4 | 41.23 | (.06 | ) | 3.97 | 3.91 | |||||||||||
| Year ended 8/31/2016 | 41.29 | (.08 | ) | 3.41 | 3.33 | |||||||||||
| Year ended 8/31/2015 | 44.88 | (.11 | ) | .58 | .47 | |||||||||||
| Year ended 8/31/2014 | 38.64 | (.16 | ) | 9.15 | 8.99 | |||||||||||
| Year ended 8/31/2013 | 31.72 | (.05 | ) | 6.98 | 6.93 | |||||||||||
| Year ended 8/31/2012 | 28.26 | (.02 | ) | 3.48 | 3.46 | |||||||||||
| 30 | The Growth Fund of America |
| Dividends and distributions | ||||||||||||||||||||||||||||||
| Dividends (from net investment income) | Distributions (from capital gains) | Total dividends and distributions | Net asset value, end of period | Total return2 | Net assets, end of period (in millions) | Ratio of expenses to average net assets | Ratio of net income (loss) to average net assets | |||||||||||||||||||||||
| $ | (.22 | ) | $ | (2.53 | ) | $ | (2.75 | ) | $ | 44.57 | 10.20 | %5 | $ | 6,814 | .72 | %6 | .44 | %6 | ||||||||||||
| (.24 | ) | (3.39 | ) | (3.63 | ) | 43.08 | 9.23 | 6,229 | .74 | .48 | ||||||||||||||||||||
| (.14 | ) | (4.06 | ) | (4.20 | ) | 42.95 | 2.04 | 5,849 | .73 | .43 | ||||||||||||||||||||
| (.11 | ) | (2.75 | ) | (2.86 | ) | 46.35 | 24.89 | 5,799 | .74 | .31 | ||||||||||||||||||||
| (.27 | ) | — | (.27 | ) | 39.66 | 22.65 | 4,663 | .77 | .52 | |||||||||||||||||||||
| (.22 | ) | — | (.22 | ) | 32.59 | 13.00 | 3,822 | .77 | .60 | |||||||||||||||||||||
| — | (2.53 | ) | (2.53 | ) | 42.29 | 9.78 | 5 | 8 | 1.53 | 6 | (.33 | )6 | ||||||||||||||||||
| — | (3.39 | ) | (3.39 | ) | 40.95 | 8.36 | 40 | 1.54 | (.33 | ) | ||||||||||||||||||||
| — | (4.06 | ) | (4.06 | ) | 41.08 | 1.24 | 94 | 1.52 | (.37 | ) | ||||||||||||||||||||
| — | (2.75 | ) | (2.75 | ) | 44.71 | 23.90 | 159 | 1.53 | (.49 | ) | ||||||||||||||||||||
| — | — | — | 38.54 | 21.69 | 195 | 1.56 | (.25 | ) | ||||||||||||||||||||||
| — | — | — | 31.67 | 12.11 | 237 | 1.57 | (.21 | ) | ||||||||||||||||||||||
| — | (2.53 | ) | (2.53 | ) | 42.16 | 9.78 | 5 | 1,565 | 1.49 | 6 | (.33 | )6 | ||||||||||||||||||
| — | (3.39 | ) | (3.39 | ) | 40.83 | 8.39 | 1,469 | 1.52 | (.29 | ) | ||||||||||||||||||||
| — | (4.06 | ) | (4.06 | ) | 40.96 | 1.27 | 1,421 | 1.51 | (.35 | ) | ||||||||||||||||||||
| — | (2.75 | ) | (2.75 | ) | 44.58 | 23.91 | 1,440 | 1.52 | (.47 | ) | ||||||||||||||||||||
| (.02 | ) | — | (.02 | ) | 38.43 | 21.69 | 1,188 | 1.56 | (.26 | ) | ||||||||||||||||||||
| — | — | — | 31.60 | 12.14 | 1,008 | 1.56 | (.19 | ) | ||||||||||||||||||||||
| (.12 | ) | (2.53 | ) | (2.65 | ) | 44.15 | 10.07 | 5 | 292 | .96 | 6 | .21 | 6 | |||||||||||||||||
| (.13 | ) | (3.39 | ) | (3.52 | ) | 42.65 | 8.99 | 272 | .98 | .25 | ||||||||||||||||||||
| (.02 | ) | (4.06 | ) | (4.08 | ) | 42.54 | 1.79 | 260 | .98 | .18 | ||||||||||||||||||||
| (.01 | ) | (2.75 | ) | (2.76 | ) | 45.94 | 24.57 | 263 | .99 | .06 | ||||||||||||||||||||
| (.19 | ) | — | (.19 | ) | 39.34 | 22.36 | 217 | 1.02 | .28 | |||||||||||||||||||||
| (.13 | ) | — | (.13 | ) | 32.33 | 12.71 | 182 | 1.03 | .35 | |||||||||||||||||||||
| (.32 | ) | (2.53 | ) | (2.85 | ) | 44.48 | 10.33 | 5 | 265 | .50 | 6 | .66 | 6 | |||||||||||||||||
| (.33 | ) | (3.39 | ) | (3.72 | ) | 43.04 | 9.46 | 231 | .52 | .70 | ||||||||||||||||||||
| (.23 | ) | (4.06 | ) | (4.29 | ) | 42.92 | 2.26 | 211 | .51 | .65 | ||||||||||||||||||||
| (.20 | ) | (2.75 | ) | (2.95 | ) | 46.33 | 25.16 | 200 | .52 | .53 | ||||||||||||||||||||
| (.34 | ) | — | (.34 | ) | 39.64 | 22.92 | 157 | .56 | .74 | |||||||||||||||||||||
| (.28 | ) | — | (.28 | ) | 32.57 | 13.27 | 125 | .56 | .81 | |||||||||||||||||||||
| — | (2.53 | ) | (2.53 | ) | 42.61 | 9.81 | 5 | 428 | 1.44 | 6 | (.28 | )6 | ||||||||||||||||||
| — | (3.39 | ) | (3.39 | ) | 41.23 | 8.49 | 438 | 1.43 | (.20 | ) | ||||||||||||||||||||
| — | (4.06 | ) | (4.06 | ) | 41.29 | 1.33 | 483 | 1.42 | (.27 | ) | ||||||||||||||||||||
| — | (2.75 | ) | (2.75 | ) | 44.88 | 24.02 | 542 | 1.43 | (.38 | ) | ||||||||||||||||||||
| (.01 | ) | — | (.01 | ) | 38.64 | 21.86 | 483 | 1.44 | (.13 | ) | ||||||||||||||||||||
| — | — | — | 31.72 | 12.24 | 497 | 1.44 | (.07 | ) | ||||||||||||||||||||||
See page 35 for footnotes.
| The Growth Fund of America | 31 |
Financial highlights (continued)
| Income from investment operations1 | ||||||||||||||||
| Net asset value, beginning of period | Net investment income (loss) | Net gains on securities (both realized and unrealized) | Total from investment operations | |||||||||||||
| Class R-2: | ||||||||||||||||
| Six months ended 2/28/20173,4 | $ | 41.60 | $ | (.06 | ) | $ | 4.00 | $ | 3.94 | |||||||
| Year ended 8/31/2016 | 41.62 | (.07 | ) | 3.44 | 3.37 | |||||||||||
| Year ended 8/31/2015 | 45.17 | (.08 | ) | .59 | .51 | |||||||||||
| Year ended 8/31/2014 | 38.85 | (.14 | ) | 9.21 | 9.07 | |||||||||||
| Year ended 8/31/2013 | 31.91 | (.02 | ) | 7.01 | 6.99 | |||||||||||
| Year ended 8/31/2012 | 28.42 | (.01 | ) | 3.50 | 3.49 | |||||||||||
| Class R-2E: | ||||||||||||||||
| Six months ended 2/28/20173,4 | 42.92 | — | 8 | 4.14 | 4.14 | |||||||||||
| Year ended 8/31/2016 | 43.09 | .07 | 3.55 | 3.62 | ||||||||||||
| Year ended 8/31/2015 | 46.70 | .10 | .65 | .75 | ||||||||||||
| Period from 8/29/2014 to 8/31/20143,11 | 46.70 | — | — | — | ||||||||||||
| Class R-3: | ||||||||||||||||
| Six months ended 2/28/20173,4 | 42.68 | .04 | 4.11 | 4.15 | ||||||||||||
| Year ended 8/31/2016 | 42.55 | .10 | 3.53 | 3.63 | ||||||||||||
| Year ended 8/31/2015 | 45.94 | .08 | .60 | .68 | ||||||||||||
| Year ended 8/31/2014 | 39.33 | .03 | 9.34 | 9.37 | ||||||||||||
| Year ended 8/31/2013 | 32.29 | .12 | 7.08 | 7.20 | ||||||||||||
| Year ended 8/31/2012 | 28.74 | .11 | 3.55 | 3.66 | ||||||||||||
| Class R-4: | ||||||||||||||||
| Six months ended 2/28/20173,4 | 43.13 | .10 | 4.16 | 4.26 | ||||||||||||
| Year ended 8/31/2016 | 42.99 | .22 | 3.56 | 3.78 | ||||||||||||
| Year ended 8/31/2015 | 46.38 | .22 | .60 | .82 | ||||||||||||
| Year ended 8/31/2014 | 39.68 | .16 | 9.42 | 9.58 | ||||||||||||
| Year ended 8/31/2013 | 32.56 | .23 | 7.14 | 7.37 | ||||||||||||
| Year ended 8/31/2012 | 28.99 | .20 | 3.57 | 3.77 | ||||||||||||
| Class R-5E: | ||||||||||||||||
| Six months ended 2/28/20173,4 | 43.34 | .13 | 4.19 | 4.32 | ||||||||||||
| Period from 11/20/2015 to 8/31/20163,12 | 45.73 | .22 | 1.21 | 1.43 | ||||||||||||
| Class R-5: | ||||||||||||||||
| Six months ended 2/28/20173,4 | 43.50 | .17 | 4.18 | 4.35 | ||||||||||||
| Year ended 8/31/2016 | 43.33 | .35 | 3.60 | 3.95 | ||||||||||||
| Year ended 8/31/2015 | 46.73 | .35 | .60 | .95 | ||||||||||||
| Year ended 8/31/2014 | 39.96 | .29 | 9.49 | 9.78 | ||||||||||||
| Year ended 8/31/2013 | 32.82 | .34 | 7.18 | 7.52 | ||||||||||||
| Year ended 8/31/2012 | 29.24 | .29 | 3.60 | 3.89 | ||||||||||||
| 32 | The Growth Fund of America |
| Dividends and distributions | ||||||||||||||||||||||||||||||
| Dividends (from net investment income) | Distributions (from capital gains) | Total dividends and distributions | Net asset value, end of period | Total return2 | Net assets, end of period (in millions) | Ratio of expenses to average net assets | Ratio of net income (loss) to average net assets | |||||||||||||||||||||||
| $ | — | $ | (2.53 | ) | $ | (2.53 | ) | $ | 43.01 | 9.80 | %5 | $ | 2,170 | 1.43 | %6 | (.27 | )%6 | |||||||||||||
| — | (3.39 | ) | (3.39 | ) | 41.60 | 8.53 | 2,137 | 1.40 | (.18 | ) | ||||||||||||||||||||
| — | (4.06 | ) | (4.06 | ) | 41.62 | 1.42 | 2,246 | 1.35 | (.19 | ) | ||||||||||||||||||||
| — | (2.75 | ) | (2.75 | ) | 45.17 | 24.10 | 2,496 | 1.38 | (.33 | ) | ||||||||||||||||||||
| (.05 | ) | — | (.05 | ) | 38.85 | 21.92 | 2,277 | 1.37 | (.07 | ) | ||||||||||||||||||||
| — | — | — | 31.91 | 12.28 | 2,182 | 1.41 | (.04 | ) | ||||||||||||||||||||||
| (.17 | ) | (2.53 | ) | (2.70 | ) | 44.36 | 10.00 | 5 | 72 | 1.12 | 6 | .02 | 6 | |||||||||||||||||
| (.40 | ) | (3.39 | ) | (3.79 | ) | 42.92 | 8.89 | 34 | 1.11 | .17 | ||||||||||||||||||||
| (.30 | ) | (4.06 | ) | (4.36 | ) | 43.09 | 1.92 | 9 | — | 10 | .96 | 9 | .22 | 9 | ||||||||||||||||
| — | — | — | 46.70 | — | — | 10 | — | — | ||||||||||||||||||||||
| (.10 | ) | (2.53 | ) | (2.63 | ) | 44.20 | 10.07 | 5 | 6,473 | .98 | 6 | .18 | 6 | |||||||||||||||||
| (.11 | ) | (3.39 | ) | (3.50 | ) | 42.68 | 8.99 | 6,507 | .98 | .24 | ||||||||||||||||||||
| (.01 | ) | (4.06 | ) | (4.07 | ) | 42.55 | 1.79 | 7,226 | .97 | .19 | ||||||||||||||||||||
| (.01 | ) | (2.75 | ) | (2.76 | ) | 45.94 | 24.60 | 8,325 | .98 | .07 | ||||||||||||||||||||
| (.16 | ) | — | (.16 | ) | 39.33 | 22.38 | 7,769 | .98 | .33 | |||||||||||||||||||||
| (.11 | ) | — | (.11 | ) | 32.29 | 12.78 | 7,916 | .98 | .38 | |||||||||||||||||||||
| (.25 | ) | (2.53 | ) | (2.78 | ) | 44.61 | 10.22 | 5 | 8,018 | .68 | 6 | .48 | 6 | |||||||||||||||||
| (.25 | ) | (3.39 | ) | (3.64 | ) | 43.13 | 9.29 | 7,762 | .68 | .54 | ||||||||||||||||||||
| (.15 | ) | (4.06 | ) | (4.21 | ) | 42.99 | 2.11 | 7,149 | .67 | .48 | ||||||||||||||||||||
| (.13 | ) | (2.75 | ) | (2.88 | ) | 46.38 | 24.97 | 7,835 | .68 | .37 | ||||||||||||||||||||
| (.25 | ) | — | (.25 | ) | 39.68 | 22.77 | 7,169 | .68 | .63 | |||||||||||||||||||||
| (.20 | ) | — | (.20 | ) | 32.56 | 13.10 | 8,093 | .69 | .66 | |||||||||||||||||||||
| (.41 | ) | (2.53 | ) | (2.94 | ) | 44.72 | 10.33 | 5 | 29 | .43 | 6 | .62 | 6 | |||||||||||||||||
| (.43 | ) | (3.39 | ) | (3.82 | ) | 43.34 | 3.60 | 5 | — | 10 | .56 | 6 | .70 | 6 | ||||||||||||||||
| (.36 | ) | (2.53 | ) | (2.89 | ) | 44.96 | 10.38 | 5 | 3,621 | .38 | 6 | .78 | 6 | |||||||||||||||||
| (.39 | ) | (3.39 | ) | (3.78 | ) | 43.50 | 9.64 | 3,551 | .39 | .84 | ||||||||||||||||||||
| (.29 | ) | (4.06 | ) | (4.35 | ) | 43.33 | 2.40 | 4,982 | .38 | .78 | ||||||||||||||||||||
| (.26 | ) | (2.75 | ) | (3.01 | ) | 46.73 | 25.33 | 5,450 | .38 | .67 | ||||||||||||||||||||
| (.38 | ) | — | (.38 | ) | 39.96 | 23.11 | 5,273 | .39 | .92 | |||||||||||||||||||||
| (.31 | ) | — | (.31 | ) | 32.82 | 13.48 | 6,312 | .39 | .97 | |||||||||||||||||||||
See page 35 for footnotes.
| The Growth Fund of America | 33 |
Financial highlights (continued)
| Income from investment operations1 | ||||||||||||||||
| Net asset value, beginning of period | Net investment income (loss) | Net gains on securities (both realized and unrealized) | Total from investment operations | |||||||||||||
| Class R-6: | ||||||||||||||||
| Six months ended 2/28/20173,4 | $ | 43.57 | $ | .18 | $ | 4.19 | $ | 4.37 | ||||||||
| Year ended 8/31/2016 | 43.40 | .37 | 3.60 | 3.97 | ||||||||||||
| Year ended 8/31/2015 | 46.80 | .37 | .61 | .98 | ||||||||||||
| Year ended 8/31/2014 | 40.02 | .31 | 9.50 | 9.81 | ||||||||||||
| Year ended 8/31/2013 | 32.87 | .35 | 7.21 | 7.56 | ||||||||||||
| Year ended 8/31/2012 | 29.30 | .31 | 3.60 | 3.91 | ||||||||||||
| Six months ended February 28, | Year ended August 31 | |||||||||||
| 20173,4,5 | 2016 | 2015 | 2014 | 2013 | 2012 | |||||||
| Portfolio turnover rate for all share classes | 13% | 31% | 29% | 26% | 27% | 18% | ||||||
See Notes to Financial Statements
| 34 | The Growth Fund of America |
| Dividends and distributions | ||||||||||||||||||||||||||||||
| Dividends (from net investment income) | Distributions (from capital gains) | Total dividends and distributions | Net asset value, end of period | Total return2 | Net assets, end of period (in millions) | Ratio of expenses to average net assets | Ratio of net income (loss) to average net assets | |||||||||||||||||||||||
| $ | (.39 | ) | $ | (2.53 | ) | $ | (2.92 | ) | $ | 45.02 | 10.41 | %5 | $ | 18,300 | .33 | %6 | .83 | %6 | ||||||||||||
| (.41 | ) | (3.39 | ) | (3.80 | ) | 43.57 | 9.68 | 16,299 | .33 | .89 | ||||||||||||||||||||
| (.32 | ) | (4.06 | ) | (4.38 | ) | 43.40 | 2.45 | 13,594 | .33 | .83 | ||||||||||||||||||||
| (.28 | ) | (2.75 | ) | (3.03 | ) | 46.80 | 25.39 | 12,407 | .33 | .72 | ||||||||||||||||||||
| (.41 | ) | — | (.41 | ) | 40.02 | 23.19 | 8,806 | .34 | .96 | |||||||||||||||||||||
| (.34 | ) | — | (.34 | ) | 32.87 | 13.52 | 7,537 | .34 | 1.02 | |||||||||||||||||||||
| 1 | Based on average shares outstanding. |
| 2 | Total returns exclude any applicable sales charges, including contingent deferred sales charges. |
| 3 | Based on operations for the period shown and, accordingly, is not representative of a full year. |
| 4 | Unaudited. |
| 5 | Not annualized. |
| 6 | Annualized. |
| 7 | Class F-3 shares were offered beginning January 27, 2017. |
| 8 | Amount less than $.01. |
| 9 | All or a significant portion of assets in this class consisted of seed capital invested by CRMC and/or its affiliates. Fees for distribution services are not charged or accrued on these seed capital assets. If such fees were paid by the fund on seed capital assets, fund expenses would have been higher and net income and total return would have been lower. |
| 10 | Amount less than $1 million. |
| 11 | Class R-2E shares were offered beginning August 29, 2014. |
| 12 | Class R-5E shares were offered beginning November 20, 2015. |
| The Growth Fund of America | 35 |
| Expense example | unaudited |
As a fund shareholder, you incur two types of costs: (1) transaction costs, such as initial sales charges on purchase payments and contingent deferred sales charges on redemptions (loads), and (2) ongoing costs, including management fees, distribution and service (12b-1) fees, and other expenses. This example is intended to help you understand your ongoing costs (in dollars) of investing in the fund so you can compare these costs with the ongoing costs of investing in other mutual funds. The example is based on an investment of $1,000 invested at the beginning of the period and held for the entire six-month period (September 1, 2016, through February 28, 2017).
Actual expenses:
The first line of each share class in the table on the following page provides information about actual account values and actual expenses. You may use the information in this line, together with the amount you invested, to estimate the expenses that you paid over the period. Simply divide your account value by $1,000 (for example, an $8,600 account value divided by $1,000 = 8.6), then multiply the result by the number in the first line under the heading titled “Expenses paid during period” to estimate the expenses you paid on your account during this period.
Hypothetical example for comparison purposes:
The second line of each share class in the table on the following page provides information about hypothetical account values and hypothetical expenses based on the actual expense ratio for the share class and an assumed rate of return of 5.00% per year before expenses, which is not the actual return of the share class. The hypothetical account values and expenses may not be used to estimate the actual ending account balance or expenses you paid for the period. You may use this information to compare the ongoing costs of investing in the fund and other funds. To do so, compare this 5.00% hypothetical example with the 5.00% hypothetical examples that appear in the shareholder reports of the other funds.
Notes:
Retirement plan participants may be subject to certain fees charged by the plan sponsor, and Class F-1, F-2, F-3 and 529-F-1 shareholders may be subject to fees charged by financial intermediaries, typically ranging from 0.75% to 1.50% of assets annually depending on services offered. You can estimate the impact of these fees by adding the amount of the fees to the total estimated expenses you paid on your account during the period as calculated above. In addition, your ending account value would be lower by the amount of these fees.
Note that the expenses shown in the table on the following page are meant to highlight your ongoing costs only and do not reflect any transactional costs, such as sales charges (loads). Therefore, the second line of each share class in the table is useful in comparing ongoing costs only and will not help you determine the relative total costs of owning different funds. In addition, if these transactional costs were included, your costs would have been higher.
| 36 | The Growth Fund of America |
| Beginning account value 9/1/2016 | Ending account value 2/28/2017 | Expenses paid during period* | Annualized expense ratio | ||||||||||
| Class A - actual return | $ | 1,000.00 | $ | 1,102.43 | $ | 3.39 | .65 | % | |||||
| Class A - assumed 5% return | 1,000.00 | 1,021.57 | 3.26 | .65 | |||||||||
| Class B - actual return | 1,000.00 | 1,097.97 | 7.39 | 1.42 | |||||||||
| Class B - assumed 5% return | 1,000.00 | 1,017.75 | 7.10 | 1.42 | |||||||||
| Class C - actual return | 1,000.00 | 1,098.19 | 7.54 | 1.45 | |||||||||
| Class C - assumed 5% return | 1,000.00 | 1,017.60 | 7.25 | 1.45 | |||||||||
| Class F-1 - actual return | 1,000.00 | 1,102.08 | 3.70 | .71 | |||||||||
| Class F-1 - assumed 5% return | 1,000.00 | 1,021.27 | 3.56 | .71 | |||||||||
| Class F-2 - actual return | 1,000.00 | 1,103.66 | 2.24 | .43 | |||||||||
| Class F-2 - assumed 5% return | 1,000.00 | 1,022.66 | 2.16 | .43 | |||||||||
| Class F-3 - actual return† | 1,000.00 | 1,014.66 | .32 | .36 | |||||||||
| Class F-3 - assumed 5% return† | 1,000.00 | 1,023.01 | 1.81 | .36 | |||||||||
| Class 529-A - actual return | 1,000.00 | 1,101.99 | 3.75 | .72 | |||||||||
| Class 529-A - assumed 5% return | 1,000.00 | 1,021.22 | 3.61 | .72 | |||||||||
| Class 529-B - actual return | 1,000.00 | 1,097.81 | 7.96 | 1.53 | |||||||||
| Class 529-B - assumed 5% return | 1,000.00 | 1,017.21 | 7.65 | 1.53 | |||||||||
| Class 529-C - actual return | 1,000.00 | 1,097.85 | 7.75 | 1.49 | |||||||||
| Class 529-C - assumed 5% return | 1,000.00 | 1,017.41 | 7.45 | 1.49 | |||||||||
| Class 529-E - actual return | 1,000.00 | 1,100.75 | 5.00 | .96 | |||||||||
| Class 529-E - assumed 5% return | 1,000.00 | 1,020.03 | 4.81 | .96 | |||||||||
| Class 529-F-1 - actual return | 1,000.00 | 1,103.33 | 2.61 | .50 | |||||||||
| Class 529-F-1 - assumed 5% return | 1,000.00 | 1,022.32 | 2.51 | .50 | |||||||||
| Class R-1 - actual return | 1,000.00 | 1,098.10 | 7.49 | 1.44 | |||||||||
| Class R-1 - assumed 5% return | 1,000.00 | 1,017.65 | 7.20 | 1.44 | |||||||||
| Class R-2 - actual return | 1,000.00 | 1,097.96 | 7.44 | 1.43 | |||||||||
| Class R-2 - assumed 5% return | 1,000.00 | 1,017.70 | 7.15 | 1.43 | |||||||||
| Class R-2E - actual return | 1,000.00 | 1,099.95 | 5.83 | 1.12 | |||||||||
| Class R-2E - assumed 5% return | 1,000.00 | 1,019.24 | 5.61 | 1.12 | |||||||||
| Class R-3 - actual return | 1,000.00 | 1,100.67 | 5.10 | .98 | |||||||||
| Class R-3 - assumed 5% return | 1,000.00 | 1,019.93 | 4.91 | .98 | |||||||||
| Class R-4 - actual return | 1,000.00 | 1,102.22 | 3.54 | .68 | |||||||||
| Class R-4 - assumed 5% return | 1,000.00 | 1,021.42 | 3.41 | .68 | |||||||||
| Class R-5E - actual return | 1,000.00 | 1,103.33 | 2.24 | .43 | |||||||||
| Class R-5E - assumed 5% return | 1,000.00 | 1,022.66 | 2.16 | .43 | |||||||||
| Class R-5 - actual return | 1,000.00 | 1,103.77 | 1.98 | .38 | |||||||||
| Class R-5 - assumed 5% return | 1,000.00 | 1,022.91 | 1.91 | .38 | |||||||||
| Class R-6 - actual return | 1,000.00 | 1,104.12 | 1.72 | .33 | |||||||||
| Class R-6 - assumed 5% return | 1,000.00 | 1,023.16 | 1.66 | .33 | |||||||||
| * | The “expenses paid during period” are equal to the “annualized expense ratio,” multiplied by the average account value over the period, multiplied by the number of days in the period, and divided by 365 (to reflect the one-half year period). |
| † | The period for the “annualized expense ratio” and “actual return” line is based on the number of days since the initial sale of the share class on January 27, 2017. The “assumed 5% return” line is based on 181 days. |
| The Growth Fund of America | 37 |
This page was intentionally left blank.
| 38 | The Growth Fund of America |
This page was intentionally left blank.
| The Growth Fund of America | 39 |
This page was intentionally left blank.
| 40 | The Growth Fund of America |
This page was intentionally left blank.
| The Growth Fund of America | 41 |
This page was intentionally left blank.
| 42 | The Growth Fund of America |
This page was intentionally left blank.
| The Growth Fund of America | 43 |
Office of the fund
6455 Irvine Center Drive
Irvine, CA 92618-4518
Investment adviser
Capital Research and Management Company
333 South Hope Street
Los Angeles, CA 90071-1406
6455 Irvine Center Drive
Irvine, CA 92618-4518
Transfer agent for shareholder accounts
American Funds Service Company
(Write to the address near you.)
P.O. Box 6007
Indianapolis, IN 46206-6007
P.O. Box 2280
Norfolk, VA 23501-2280
Custodian of assets
State Street Bank and Trust Company
One Lincoln Street
Boston, MA 02111
Counsel
Dechert LLP
One Bush Street, Suite 1600
San Francisco, CA 94104-4446
Independent registered public accounting firm
Deloitte & Touche LLP
695 Town Center Drive
Suite 1200
Costa Mesa, CA 92626-7188
Principal underwriter
American Funds Distributors, Inc.
333 South Hope Street
Los Angeles, CA 90071-1406
| 44 | The Growth Fund of America |
Investors should carefully consider investment objectives, risks, charges and expenses. This and other important information is contained in the fund prospectus and summary prospectus, which can be obtained from your financial professional and should be read carefully before investing. You may also call American Funds Service Company (AFS) at (800) 421-4225 or visit the American Funds website at americanfunds.com.
“American Funds Proxy Voting Procedures and Principles” — which describes how we vote proxies relating to portfolio securities — is available on the American Funds website or upon request by calling AFS. The fund files its proxy voting record with the U.S. Securities and Exchange Commission (SEC) for the 12 months ended June 30 by August 31. The proxy voting record is available free of charge on the SEC website at sec.gov and on the American Funds website.
A complete February 28, 2017, portfolio of The Growth Fund of America’s investments is available free of charge by calling AFS or visiting the SEC website (where it is part of Form N-CSR).
The Growth Fund of America files a complete list of its portfolio holdings with the SEC for the first and third quarters of each fiscal year on Form N-Q. This filing is available free of charge on the SEC website. You may also review or, for a fee, copy this filing at the SEC’s Public Reference Room in Washington, D.C. Additional information regarding the operation of the Public Reference Room may be obtained by calling the SEC’s Office of Investor Education and Advocacy at (800) SEC-0330. Additionally, the list of portfolio holdings is available by calling AFS.
This report is for the information of shareholders of The Growth Fund of America, but it also may be used as sales literature when preceded or accompanied by the current prospectus or summary prospectus, which gives details about charges, expenses, investment objectives and operating policies of the fund. If used as sales material after June 30, 2017, this report must be accompanied by an American Funds statistical update for the most recently completed calendar quarter.
The Standard & Poor’s 500 Composite Index (“Index”) is a product of S&P Dow Jones Indices LLC and/or its affiliates and has been licensed for use by Capital Group. Copyright © 2017 S&P Dow Jones Indices LLC, a division of S&P Global, and/or its affiliates. All rights reserved. Redistribution or reproduction in whole or in part are prohibited without written permission of S&P Dow Jones Indices LLC.
| American Funds from Capital Group | |
| The Capital AdvantageSM | |
| Since 1931, American Funds, part of Capital Group, has helped investors pursue long-term investment success. Our consistent approach — in combination with The Capital SystemSM — has resulted in a superior long-term track record. | |
| Aligned with investor success | |
| We base our decisions on a long-term perspective, which we believe aligns our goals with the interests of our clients. Our portfolio managers average 27 years of investment experience, including 21 years at our company, reflecting a career commitment to our long-term approach.1 | |
| The Capital SystemSM | |
| The Capital System combines individual accountability with teamwork. Funds using The Capital System are divided into portions that are managed independently by investment professionals with diverse backgrounds, ages and investment approaches. An extensive global research effort is the backbone of our system. | |
| American Funds’ superior long-term track record | |
| Equity funds have beaten their Lipper peer indexes in 93% of 10-year periods and 98% of 20-year periods. Fixed income funds have beaten their Lipper indexes in 80% of 10-year periods and 80% of 20-year periods.2 Fund management fees have been among the lowest in the industry.3 |
| 1 | Portfolio manager experience as of December 31, 2016. | |
| 2 | Based on Class F-2 share results for rolling periods through December 31, 2016. Periods covered are the shorter of the fund’s lifetime or since the comparable Lipper index inception date (except Capital Income Builder and SMALLCAP World Fund, for which the Lipper average was used). Expenses differ for each share class, so results will vary. Class F-2 shares were first offered on August 1, 2008. Class F-2 share results prior to the date of first sale are hypothetical based on Class A share results without a sales charge, adjusted for typical estimated expenses. Results for certain funds with an inception date after August 1, 2008, also include hypothetical returns because those funds’ Class F-2 shares sold after the funds’ date of first offering. Please see americanfunds.com for more information on specific expense adjustments and the actual dates of first sale. | |
| 3 | On average, our management fees were in the lowest quintile 73% of the time, based on the 20-year period ended December 31, 2016, versus comparable Lipper categories, excluding funds of funds. |

ITEM 2 – Code of Ethics
Not applicable for filing of semi-annual reports to shareholders.
ITEM 3 – Audit Committee Financial Expert
Not applicable for filing of semi-annual reports to shareholders.
ITEM 4 – Principal Accountant Fees and Services
Not applicable for filing of semi-annual reports to shareholders.
ITEM 5 – Audit Committee of Listed Registrants
Not applicable to this Registrant, insofar as the Registrant is not a listed issuer as defined in Rule 10A-3 under the Securities Exchange Act of 1934.
ITEM 6 – Schedule of Investments

| Common stocks 93.43% Information technology 24.85% | Shares | Value (000) |
| Alphabet Inc., Class C1 | 3,481,722 | $2,866,189 |
| Alphabet Inc., Class A1 | 2,661,770 | 2,249,009 |
| Broadcom Ltd.2 | 21,703,411 | 4,577,900 |
| Microsoft Corp. | 52,830,700 | 3,380,108 |
| Facebook, Inc., Class A1 | 20,079,000 | 2,721,508 |
| Oracle Corp. | 49,881,000 | 2,124,432 |
| ASML Holding NV (New York registered) | 8,303,941 | 1,010,506 |
| ASML Holding NV | 6,609,442 | 801,384 |
| Apple Inc. | 12,731,700 | 1,744,116 |
| Samsung Electronics Co., Ltd. | 800,204 | 1,360,152 |
| Samsung Electronics Co., Ltd., nonvoting preferred | 68,250 | 90,296 |
| Visa Inc., Class A | 16,436,000 | 1,445,382 |
| Taiwan Semiconductor Manufacturing Co., Ltd.3 | 177,560,000 | 1,092,640 |
| Taiwan Semiconductor Manufacturing Co., Ltd. (ADR) | 8,743,800 | 275,167 |
| Alibaba Group Holding Ltd. (ADR)1 | 10,675,100 | 1,098,468 |
| MasterCard Inc., Class A | 7,844,800 | 866,537 |
| Juniper Networks, Inc.2 | 27,622,923 | 773,442 |
| Intuit Inc. | 5,810,000 | 728,806 |
| Intel Corp. | 18,599,000 | 673,284 |
| Skyworks Solutions, Inc. | 7,012,000 | 664,808 |
| Texas Instruments Inc. | 8,136,239 | 623,399 |
| salesforce.com, inc.1 | 7,175,000 | 583,686 |
| Akamai Technologies, Inc.1 | 8,535,389 | 534,315 |
| Accenture PLC, Class A | 3,650,000 | 447,125 |
| Flex Ltd.1,2 | 26,843,008 | 442,641 |
| Vantiv, Inc., Class A1 | 6,444,000 | 421,309 |
| TE Connectivity Ltd. | 5,618,000 | 418,372 |
| Arista Networks, Inc.1 | 3,510,462 | 417,710 |
| Applied Materials, Inc. | 11,450,000 | 414,719 |
| Nintendo Co., Ltd. | 1,805,200 | 377,606 |
| Qorvo, Inc.1 | 5,336,243 | 352,726 |
| Hexagon AB, Class B | 8,541,102 | 344,990 |
| Amphenol Corp., Class A | 4,517,279 | 312,641 |
| Fiserv, Inc.1 | 2,475,000 | 285,615 |
| Xilinx, Inc. | 4,750,000 | 279,395 |
| Murata Manufacturing Co., Ltd. | 1,936,300 | 278,350 |
| Adobe Systems Inc.1 | 2,000,000 | 236,680 |
| First Solar, Inc.1 | 5,100,000 | 184,569 |
| Sabre Corp. | 8,318,245 | 182,253 |
| Jack Henry & Associates, Inc. | 1,850,000 | 173,474 |
| Cloudera, Inc.1,3,4 | 5,402,537 | 123,448 |
| VeriSign, Inc.1 | 1,445,000 | 119,169 |
| FLIR Systems, Inc. | 2,700,000 | 99,117 |
| First Data Corp., Class A1 | 5,448,227 | 87,716 |
| Motorola Solutions, Inc. | 919,000 | 72,573 |
| Finisar Corp.1 | 2,068,000 | 69,237 |
| Automatic Data Processing, Inc. | 631,666 | 64,821 |
| Common stocks Information technology (continued) | Shares | Value (000) |
| Viavi Solutions Inc.1 | 4,496,600 | $45,056 |
| Dolby Laboratories, Inc., Class A | 138,630 | 6,778 |
| 38,543,624 | ||
| Consumer discretionary 21.50% | ||
| Amazon.com, Inc.1 | 11,262,436 | 9,517,209 |
| Netflix, Inc.1,2 | 23,581,761 | 3,351,676 |
| Home Depot, Inc. | 21,796,200 | 3,158,487 |
| Priceline Group Inc.1 | 1,176,209 | 2,027,937 |
| Comcast Corp., Class A | 48,014,000 | 1,796,684 |
| Charter Communications, Inc., Class A1 | 4,365,200 | 1,410,222 |
| Starbucks Corp. | 17,799,200 | 1,012,241 |
| Twenty-First Century Fox, Inc., Class A | 31,263,200 | 935,395 |
| Ulta Beauty, Inc.1 | 3,095,000 | 846,266 |
| Viacom Inc., Class B | 18,198,351 | 790,718 |
| MGM Resorts International1,2 | 29,229,175 | 768,435 |
| Time Warner Inc. | 7,810,000 | 767,020 |
| NIKE, Inc., Class B | 13,114,800 | 749,642 |
| CBS Corp., Class B | 9,060,000 | 597,235 |
| Marriott International, Inc., Class A | 5,859,476 | 509,716 |
| Liberty Global PLC, Class C, nonvoting1 | 11,476,520 | 402,711 |
| Liberty Global PLC, Class A1 | 2,894,280 | 103,326 |
| BorgWarner Inc. | 10,607,259 | 447,520 |
| lululemon athletica inc.1 | 6,535,000 | 426,474 |
| Aramark | 11,438,000 | 408,794 |
| Panera Bread Co., Class A1,2 | 1,404,040 | 324,052 |
| Sony Corp. | 9,400,000 | 291,007 |
| AutoNation, Inc.1,2 | 6,000,000 | 275,400 |
| ServiceMaster Global Holdings, Inc.1,2 | 6,775,000 | 269,848 |
| Altice NV, Class A1 | 12,021,000 | 253,491 |
| Domino’s Pizza, Inc. | 1,162,000 | 220,559 |
| Walt Disney Co. | 1,915,000 | 210,822 |
| Naspers Ltd., Class N | 1,274,000 | 203,730 |
| Kering SA | 800,000 | 194,718 |
| Tesla, Inc.1 | 580,100 | 145,019 |
| Cable One, Inc. | 206,499 | 129,149 |
| D.R. Horton, Inc. | 4,000,000 | 128,000 |
| Wyndham Worldwide Corp. | 1,514,700 | 126,084 |
| Newell Brands Inc. | 1,951,650 | 95,689 |
| Hermès International | 214,000 | 93,383 |
| Luxottica Group SpA | 1,630,000 | 85,927 |
| Graham Holdings Co., Class B | 156,943 | 84,475 |
| Publicis Groupe SA | 1,027,031 | 69,232 |
| Toll Brothers, Inc.1 | 1,700,000 | 58,038 |
| Sturm, Ruger & Co., Inc.2 | 945,000 | 47,108 |
| Lennar Corp., Class A | 100,000 | 4,879 |
| 33,338,318 | ||
| Health care 12.84% | ||
| UnitedHealth Group Inc. | 21,091,405 | 3,488,097 |
| Amgen Inc. | 8,429,131 | 1,487,994 |
| Illumina, Inc.1,2 | 8,839,457 | 1,479,725 |
| Thermo Fisher Scientific Inc. | 7,503,000 | 1,183,073 |
| Stryker Corp. | 8,573,716 | 1,102,237 |
| AbbVie Inc. | 16,112,657 | 996,407 |
| Common stocks Health care (continued) | Shares | Value (000) |
| Express Scripts Holding Co.1 | 12,313,800 | $869,970 |
| Boston Scientific Corp.1 | 35,053,000 | 860,551 |
| Regeneron Pharmaceuticals, Inc.1 | 2,285,000 | 853,447 |
| Humana Inc. | 3,967,000 | 838,029 |
| Gilead Sciences, Inc. | 11,500,467 | 810,553 |
| BioMarin Pharmaceutical Inc.1 | 7,493,515 | 703,866 |
| Vertex Pharmaceuticals Inc.1 | 7,293,000 | 660,892 |
| Aetna Inc. | 5,001,000 | 643,929 |
| McKesson Corp. | 3,537,900 | 531,145 |
| Incyte Corp.1 | 3,882,000 | 516,694 |
| Teva Pharmaceutical Industries Ltd. (ADR) | 12,196,000 | 427,104 |
| Medtronic PLC | 5,105,000 | 413,046 |
| bluebird bio, Inc.1 | 2,039,966 | 178,803 |
| Ultragenyx Pharmaceutical Inc.1 | 2,042,049 | 173,738 |
| Abbott Laboratories | 3,799,304 | 171,273 |
| WellCare Health Plans, Inc.1 | 1,200,000 | 169,440 |
| Kite Pharma, Inc.1 | 2,065,100 | 146,147 |
| Mettler-Toledo International Inc.1 | 300,000 | 142,866 |
| Centene Corp.1 | 1,976,398 | 139,336 |
| Grifols, SA, Class B, preferred nonvoting, non-registered shares | 7,740,000 | 134,640 |
| ResMed Inc. | 1,780,000 | 128,213 |
| Perrigo Co. PLC | 1,500,000 | 112,155 |
| athenahealth, Inc.1 | 900,000 | 106,137 |
| PerkinElmer, Inc. | 1,935,000 | 104,993 |
| Intercept Pharmaceuticals, Inc.1 | 812,700 | 103,692 |
| Danaher Corp. | 1,200,000 | 102,660 |
| ACADIA Pharmaceuticals Inc.1 | 1,260,000 | 48,019 |
| Endo International PLC1 | 2,548,134 | 34,782 |
| Acerta Pharma BV1,3,4 | 273,779,325 | 27,436 |
| Juno Therapeutics, Inc.1 | 1,110,000 | 26,684 |
| Edwards Lifesciences Corp.1 | 27,600 | 2,595 |
| 19,920,368 | ||
| Energy 9.16% | ||
| EOG Resources, Inc. | 21,701,908 | 2,104,868 |
| Schlumberger Ltd. | 21,683,484 | 1,742,484 |
| Halliburton Co. | 30,968,800 | 1,655,592 |
| Pioneer Natural Resources Co. | 7,268,000 | 1,351,630 |
| Concho Resources Inc.1,2 | 9,780,484 | 1,295,425 |
| Canadian Natural Resources, Ltd. | 35,308,612 | 1,012,577 |
| Noble Energy, Inc.2 | 25,967,053 | 945,460 |
| Apache Corp. | 10,645,900 | 559,868 |
| Suncor Energy Inc. | 14,345,520 | 446,610 |
| Cimarex Energy Co. | 2,726,400 | 342,763 |
| Seven Generations Energy Ltd., Class A1 | 16,466,834 | 305,111 |
| Weatherford International PLC1 | 48,577,617 | 274,949 |
| Enbridge Inc. (CAD denominated) | 6,053,984 | 254,794 |
| Chevron Corp. | 2,200,000 | 247,500 |
| Plains GP Holdings, LP, Class A | 6,118,063 | 201,101 |
| Tourmaline Oil Corp.1 | 6,671,000 | 147,664 |
| Tourmaline Oil Corp.1,3,4,5 | 2,136,000 | 46,099 |
| Southwestern Energy Co.1 | 22,843,889 | 171,558 |
| Centennial Resource Development, Inc., Class A1,5 | 4,285,000 | 80,601 |
| Centennial Resource Development, Inc., Class A1,3,5 | 3,478,967 | 63,804 |
| Centennial Resource Development, Inc., Class A1 | 445,700 | 8,384 |
| Common stocks Energy (continued) | Shares | Value (000) |
| Range Resources Corp. | 5,500,000 | $151,910 |
| Royal Dutch Shell PLC, Class B | 2,535,910 | 68,393 |
| Royal Dutch Shell PLC, Class B (ADR) | 928,800 | 51,084 |
| Royal Dutch Shell PLC, Class A (ADR) | 114,007 | 5,916 |
| Royal Dutch Shell PLC, Class A | 147,245 | 3,799 |
| Murphy Oil Corp. | 4,474,500 | 126,584 |
| Golar LNG Ltd. | 4,343,190 | 118,612 |
| CONSOL Energy Inc.1 | 6,235,000 | 97,079 |
| Hess Corp. | 1,350,696 | 69,480 |
| TOTAL SA | 1,280,410 | 63,822 |
| Cabot Oil & Gas Corp. | 2,750,000 | 60,225 |
| BP PLC | 7,818,642 | 44,002 |
| BP PLC (ADR) | 289,669 | 9,826 |
| Baker Hughes Inc. | 784,202 | 47,272 |
| Kinder Morgan, Inc. | 1,281,660 | 27,312 |
| Denbury Resources Inc.1 | 2,600,000 | 7,046 |
| Chesapeake Energy Corp.1 | 140,000 | 763 |
| 14,211,967 | ||
| Financials 8.47% | ||
| American International Group, Inc. | 36,193,567 | 2,313,493 |
| Berkshire Hathaway Inc., Class A1 | 4,923 | 1,265,703 |
| Berkshire Hathaway Inc., Class B1 | 5,613,508 | 962,268 |
| Goldman Sachs Group, Inc. | 6,608,735 | 1,639,363 |
| JPMorgan Chase & Co. | 9,738,000 | 882,458 |
| Capital One Financial Corp. | 7,507,000 | 704,607 |
| CIT Group Inc. | 10,103,000 | 433,419 |
| Chubb Ltd. | 3,086,100 | 426,406 |
| HDFC Bank Ltd.3 | 14,293,408 | 308,902 |
| HDFC Bank Ltd. (ADR) | 1,612,000 | 115,564 |
| CME Group Inc., Class A | 3,407,000 | 413,814 |
| Legal & General Group PLC | 111,984,892 | 345,029 |
| AIA Group Ltd. | 52,400,000 | 331,090 |
| First Republic Bank | 3,478,200 | 326,360 |
| Charles Schwab Corp. | 7,692,000 | 310,834 |
| KKR & Co. LP | 16,635,660 | 299,941 |
| Onex Corp. | 4,200,000 | 295,568 |
| Signature Bank1 | 1,666,970 | 262,564 |
| Credit Suisse Group AG | 13,914,000 | 209,884 |
| Progressive Corp. | 4,925,000 | 192,961 |
| Wells Fargo & Co. | 3,311,100 | 191,646 |
| Bank of America Corp. | 6,897,000 | 170,218 |
| BlackRock, Inc. | 342,000 | 132,511 |
| Citigroup Inc. | 1,841,000 | 110,110 |
| Royal Bank of Canada | 1,500,000 | 108,959 |
| UBS Group AG | 6,765,666 | 104,212 |
| Bank of Ireland1 | 420,200,000 | 100,161 |
| Leucadia National Corp. | 3,453,292 | 91,927 |
| Financial Engines, Inc. | 1,952,000 | 86,474 |
| 13,136,446 | ||
| Consumer staples 5.03% | ||
| Philip Morris International Inc. | 17,538,367 | 1,917,821 |
| Costco Wholesale Corp. | 6,976,100 | 1,236,025 |
| Kroger Co. | 36,347,341 | 1,155,846 |
| Common stocks Consumer staples (continued) | Shares | Value (000) |
| Kraft Heinz Co. | 5,500,000 | $503,305 |
| Coca-Cola Co. | 9,920,000 | 416,243 |
| Constellation Brands, Inc., Class A | 2,335,000 | 370,821 |
| Kerry Group PLC, Class A | 4,465,824 | 343,004 |
| Herbalife Ltd.1 | 4,638,000 | 262,001 |
| Walgreens Boots Alliance, Inc. | 2,950,000 | 254,821 |
| Mead Johnson Nutrition Co. | 2,664,700 | 233,934 |
| Associated British Foods PLC | 5,990,700 | 194,685 |
| Glanbia PLC | 9,720,457 | 190,304 |
| Pinnacle Foods Inc. | 3,225,000 | 184,244 |
| Nestlé SA | 2,387,600 | 176,512 |
| Pernod Ricard SA | 1,325,000 | 151,460 |
| Coca-Cola European Partners PLC | 3,136,700 | 108,812 |
| Avon Products, Inc.1 | 21,720,000 | 95,568 |
| 7,795,406 | ||
| Industrials 4.64% | ||
| Union Pacific Corp. | 8,367,982 | 903,240 |
| CSX Corp. | 18,323,700 | 889,799 |
| TransDigm Group Inc. | 2,360,000 | 599,912 |
| Boeing Co. | 2,530,774 | 456,121 |
| Rockwell Collins, Inc. | 4,645,000 | 444,016 |
| General Dynamics Corp. | 2,314,000 | 439,220 |
| Ryanair Holdings PLC (ADR)1 | 4,924,758 | 402,599 |
| Delta Air Lines, Inc. | 6,749,000 | 336,978 |
| Lockheed Martin Corp. | 1,192,000 | 317,763 |
| Nielsen Holdings PLC | 6,509,500 | 288,762 |
| Johnson Controls International PLC | 5,612,500 | 235,388 |
| MTU Aero Engines AG | 1,819,559 | 230,931 |
| United Continental Holdings, Inc.1 | 3,002,944 | 222,488 |
| Old Dominion Freight Line, Inc.1 | 2,418,123 | 221,887 |
| Roper Technologies, Inc. | 1,010,000 | 211,292 |
| J.B. Hunt Transport Services, Inc. | 1,748,612 | 171,661 |
| Caterpillar Inc. | 1,690,000 | 163,355 |
| Fortive Corp. | 2,357,424 | 135,906 |
| IDEX Corp. | 1,400,000 | 129,066 |
| United Technologies Corp. | 775,000 | 87,226 |
| Meggitt PLC | 14,486,455 | 84,575 |
| Northrop Grumman Corp. | 315,000 | 77,833 |
| Raytheon Co. | 370,000 | 57,036 |
| Cummins Inc. | 322,000 | 47,814 |
| Oshkosh Corp. | 622,983 | 42,294 |
| Sensata Technologies Holding NV1 | 141,200 | 5,796 |
| 7,202,958 | ||
| Materials 2.52% | ||
| E.I. du Pont de Nemours and Co. | 10,017,500 | 786,774 |
| Freeport-McMoRan Inc.1 | 44,996,731 | 602,956 |
| Vale SA, Class A, preferred nominative | 31,255,000 | 316,568 |
| Vale SA, Class A, preferred nominative (ADR) | 12,447,583 | 122,609 |
| First Quantum Minerals Ltd.2 | 34,486,886 | 358,838 |
| Celanese Corp., Series A | 3,300,000 | 294,261 |
| Syngenta AG | 624,000 | 268,711 |
| Rio Tinto PLC | 4,682,000 | 191,544 |
| Albemarle Corp. | 1,880,719 | 190,912 |
| Common stocks Materials (continued) | Shares | Value (000) |
| BHP Billiton PLC | 11,474,000 | $184,732 |
| HeidelbergCement AG | 1,960,000 | 183,161 |
| Nitto Denko Corp. | 1,999,925 | 168,404 |
| Praxair, Inc. | 1,353,161 | 160,634 |
| Monsanto Co. | 744,000 | 84,690 |
| 3,914,794 | ||
| Real estate 0.78% | ||
| American Tower Corp. REIT | 4,999,155 | 573,853 |
| Iron Mountain Inc. REIT | 5,000,000 | 181,750 |
| Crown Castle International Corp. REIT | 1,795,000 | 167,886 |
| Howard Hughes Corp.1 | 1,391,165 | 161,890 |
| Equinix, Inc. REIT | 308,139 | 115,882 |
| Weyerhaeuser Co. REIT1 | 422,321 | 14,241 |
| 1,215,502 | ||
| Telecommunication services 0.54% | ||
| T-Mobile US, Inc.1 | 8,230,205 | 514,635 |
| Zayo Group Holdings, Inc.1 | 10,008,512 | 315,468 |
| 830,103 | ||
| Miscellaneous 3.10% | ||
| Other common stocks in initial period of acquisition | 4,799,383 | |
| Total common stocks (cost: $82,710,159,000) | 144,908,869 | |
| Preferred securities 0.23% Financials 0.05% | ||
| Fannie Mae, Series O, 7.00% noncumulative1 | 5,582,074 | 76,753 |
| Miscellaneous 0.18% | ||
| Other preferred securities in initial period of acquisition | 274,499 | |
| Total preferred securities (cost: $320,315,000) | 351,252 | |
| Rights & warrants 0.11% Financials 0.11% | ||
| JP Morgan Chase & Co., warrants, expire 20181 | 3,390,000 | 166,449 |
| Citigroup Inc., Class A, warrants, expire 20191 | 25,500,000 | 4,271 |
| 170,720 | ||
| Telecommunication services 0.00% | ||
| Broadview Networks Holdings, Inc., Series A1, warrants, expire 20201,3,4 | 4,414 | — |
| Broadview Networks Holdings, Inc., Series A2, warrants, expire 20201,3,4 | 1,672 | — |
| — | ||
| Miscellaneous 0.00% | ||
| Other rights & warrants in initial period of acquisition | 211 | |
| Total rights & warrants (cost: $116,066,000) | 170,931 |
| Convertible stocks 0.09% Consumer discretionary 0.09% | Shares | Value (000) |
| Uber Technologies, Inc., Series F, convertible preferred3,4 | 2,884,815 | $140,699 |
| Total convertible stocks (cost: $114,350,000) | 140,699 | |
| Bonds, notes & other debt instruments 0.15% U.S. Treasury bonds & notes 0.09% U.S. Treasury 0.09% | Principal amount (000) | |
| U.S. Treasury 1.625% 2026 | $ 149,700 | 140,510 |
| Total U.S. Treasury bonds & notes | 140,510 | |
| Corporate bonds & notes 0.06% Consumer staples 0.06% | ||
| Herbalife Ltd., Term Loan, 6.25% 20236,7,8 | 100,000 | 100,177 |
| Total corporate bonds, notes & loans | 100,177 | |
| Total bonds, notes & other debt instruments (cost: $249,436,000) | 240,687 | |
| Short-term securities 6.17% | ||
| Apple Inc. 0.82%–0.88% due 5/2/2017–5/17/20175 | 270,000 | 269,591 |
| Army and Air Force Exchange Service 0.68% due 3/7/20175 | 37,000 | 36,995 |
| Bank of New York Mellon Corp. 0.90% due 4/10/2017 | 74,600 | 74,540 |
| CAFCO, LLC 0.70%–1.17% due 3/30/2017–8/4/20175 | 75,000 | 74,849 |
| Chariot Funding, LLC 0.70%–0.90% due 3/9/2017–4/17/20175 | 150,000 | 149,924 |
| Chevron Corp. 0.70%–0.88% due 3/2/2017–5/26/20175 | 234,500 | 234,179 |
| Ciesco LLC 0.80%–1.06% due 3/13/2017–3/22/20175 | 123,000 | 122,950 |
| Cisco Systems, Inc. 0.65% due 3/29/20175 | 35,000 | 34,982 |
| Coca-Cola Co. 0.76%–1.02% due 3/17/2017–8/15/20175 | 265,000 | 264,537 |
| ExxonMobil Corp. 0.70%–0.74% due 4/3/2017–5/2/2017 | 160,000 | 159,850 |
| Fannie Mae 0.53% due 5/1/2017 | 70,000 | 69,938 |
| Federal Farm Credit Banks 0.54%–0.61% due 3/13/2017–7/12/2017 | 240,000 | 239,651 |
| Federal Home Loan Bank 0.48%–0.64% due 3/1/2017–8/4/2017 | 4,927,850 | 4,922,786 |
| GE Capital Treasury Services (U.S.) LLC 0.86%–0.87% due 6/5/2017–6/8/2017 | 100,000 | 99,771 |
| General Electric Co. 0.57%–0.78% due 3/1/2017–3/29/2017 | 107,950 | 107,903 |
| Hershey Co. 0.62% due 3/23/20175 | 25,000 | 24,990 |
| John Deere Canada ULC 0.68% due 3/16/20175 | 30,723 | 30,714 |
| John Deere Financial Inc. 0.69% due 3/3/20175 | 37,000 | 36,998 |
| JPMorgan Chase & Co. 1.03%–1.15% due 3/13/2017–7/7/2017 | 143,500 | 143,541 |
| Jupiter Securitization Co., LLC 0.73% due 3/3/20175 | 50,000 | 49,997 |
| Microsoft Corp. 0.80%–0.85% due 3/28/2017–4/18/20175 | 100,000 | 99,929 |
| National Rural Utilities Cooperative Finance Corp. 0.76% due 3/13/2017 | 40,000 | 39,990 |
| PepsiCo Inc. 0.65% due 3/24/2017–4/17/20175 | 100,000 | 99,933 |
| Pfizer Inc. 0.84%–1.02% due 5/15/2017–7/17/20175 | 102,150 | 101,893 |
| Private Export Funding Corp. 0.83%–0.90% due 3/13/2017–5/2/20175 | 100,000 | 99,948 |
| Procter & Gamble Co. 0.60%–0.62% due 3/10/2017–3/20/20175 | 75,000 | 74,979 |
| Qualcomm Inc. 0.74%–0.80% due 4/19/2017–5/17/20175 | 138,400 | 138,221 |
| U.S. Treasury Bills 0.47%–0.61% due 3/2/2017–8/3/2017 | 1,339,000 | 1,337,675 |
| United Parcel Service Inc. 0.63% due 4/3/20175 | 50,000 | 49,969 |
| USAA Capital Corp. 0.60% due 3/9/2017 | 50,000 | 49,992 |
| Wal-Mart Stores, Inc. 0.60% due 3/20/20175 | 30,000 | 29,990 |
| Short-term securities | Principal amount (000) | Value (000) |
| Walt Disney Co. 0.80% due 4/7/2017–4/13/20175 | $157,700 | $157,581 |
| Wells Fargo Bank, N.A. 1.09%–1.17% due 5/16/2017–8/1/2017 | 137,800 | 137,875 |
| Total short-term securities (cost: $9,566,369,000) | 9,566,661 | |
| Total investment securities 100.18% (cost: $93,076,695,000) | 155,379,099 | |
| Other assets less liabilities (0.18)% | (283,505) | |
| Net assets 100.00% | $155,095,594 |
| Settlement date | Counterparty | Contract amount | Unrealized appreciation (depreciation) at 2/28/2017 (000) | ||
| Receive (000) | Deliver (000) | ||||
| Sales: | |||||
| Euros | 3/10/2017 | Barclays Bank PLC | $67,218 | €62,800 | $661 |
| Euros | 3/22/2017 | JPMorgan Chase | $96,642 | €91,150 | (25) |
| $636 | |||||
| 1 | Security did not produce income during the last 12 months. |
| 2 | Represents an affiliated company as defined under the Investment Company Act of 1940. |
| 3 | Valued under fair value procedures adopted by authority of the board of trustees. The total value of all such securities was $1,803,028,000, which represented 1.16% of the net assets of the fund. This amount includes $1,092,640,000 related to certain securities trading outside the U.S. whose values were adjusted as a result of significant market movements following the close of local trading. |
| 4 | Acquired through a private placement transaction exempt from registration under the Securities Act of 1933. May be subject to legal or contractual restrictions on resale. Further details on these holdings appear below. |
| 5 | Acquired in a transaction exempt from registration under Section 4(2) of the Securities Act of 1933. May be resold in the U.S. in transactions exempt from registration, normally to qualified institutional buyers. The total value of all such securities was $2,373,653,000, which represented 1.53% of the net assets of the fund. |
| 6 | Loan participations and assignments; may be subject to legal or contractual restrictions on resale. The total value of all such loans was $100,177,000, which represented .06% of the net assets of the fund. |
| 7 | Principal payments may be made periodically. Therefore, the effective maturity date may be earlier than the stated maturity date. |
| 8 | Coupon rate may change periodically. |
| Private placement securities | Acquisition date(s) | Cost (000) | Value (000) | Percent of net assets |
| Uber Technologies, Inc., Series F, convertible preferred | 5/22/2015 | $114,350 | $140,699 | .09% |
| Cloudera, Inc. | 6/29/2015-8/27/2015 | 174,989 | 123,448 | .08 |
| Tourmaline Oil Corp. | 10/20/2016 | 56,138 | 46,099 | .03 |
| Acerta Pharma BV | 5/7/2015 | 15,750 | 27,436 | .02 |
| Broadview Networks Holdings, Inc., Series A1, warrants, expire 2020 | 7/7/2000-3/6/2002 | 11,176 | — | .00 |
| Broadview Networks Holdings, Inc., Series A2, warrants, expire 2020 | 7/7/2000-3/6/2002 | 3,626 | — | .00 |
| Total private placement securities | $376,029 | $337,682 | .22% |
| Key to abbreviations and symbol |
| ADR = American Depositary Receipts |
| CAD = Canadian dollars |
| € = Euros |
| MFGEFPX-005-0417O-S54128 | The Growth Fund of America — Page 9 of 9 |
ITEM 7 – Disclosure of Proxy Voting Policies and Procedures for Closed-End Management Investment Companies
Not applicable to this Registrant, insofar as the Registrant is not a closed-end management investment company.
ITEM 8 – Portfolio Managers of Closed-End Management Investment Companies
Not applicable to this Registrant, insofar as the Registrant is not a closed-end management investment company.
ITEM 9 – Purchases of Equity Securities by Closed-End Management Investment Company and Affiliated Purchasers
Not applicable to this Registrant, insofar as the Registrant is not a closed-end management investment company.
ITEM 10 – Submission of Matters to a Vote of Security Holders
There have been no material changes to the procedures by which shareholders may recommend nominees to the Registrant’s board of trustees since the Registrant last submitted a proxy statement to its shareholders. The procedures are as follows. The Registrant has a nominating and governance committee comprised solely of persons who are not considered ‘‘interested persons’’ of the Registrant within the meaning of the Investment Company Act of 1940, as amended. The committee periodically reviews such issues as the board’s composition, responsibilities, committees, compensation and other relevant issues, and recommends any appropriate changes to the full board of trustees. While the committee normally is able to identify from its own resources an ample number of qualified candidates, it will consider shareholder suggestions of persons to be considered as nominees to fill future vacancies on the board. Such suggestions must be sent in writing to the nominating and governance committee of the Registrant, c/o the Registrant’s Secretary, and must be accompanied by complete biographical and occupational data on the prospective nominee, along with a written consent of the prospective nominee for consideration of his or her name by the nominating and governance committee.
ITEM 11 – Controls and Procedures
| (a) | The Registrant’s Principal Executive Officer and Principal Financial Officer have concluded, based on their evaluation of the Registrant’s disclosure controls and procedures (as such term is defined in Rule 30a-3 under the Investment Company Act of 1940), that such controls and procedures are adequate and reasonably designed to achieve the purposes described in paragraph (c) of such rule. |
| (b) | There were no changes in the Registrant’s internal controls over financial reporting (as defined in Rule 30a-3(d) under the Investment Company Act of 1940) that occurred during the Registrant’s second fiscal quarter of the period covered by this report that has materially affected, or is reasonably likely to materially affect, the Registrant’s internal control over financial reporting. |
ITEM 12 – Exhibits
| (a)(1) | Not applicable for filing of semi-annual reports to shareholders. |
| (a)(2) | The certifications required by Rule 30a-2 of the Investment Company Act of 1940 and Sections 302 and 906 of the Sarbanes-Oxley Act of 2002 are attached as exhibits hereto. |
SIGNATURES
Pursuant to the requirements of the Securities Exchange Act of 1934 and the Investment Company Act of 1940, the Registrant has duly caused this report to be signed on its behalf by the undersigned, thereunto duly authorized.
| THE GROWTH FUND OF AMERICA | |
| By /s/ Paul F. Roye | |
Paul F. Roye, Executive Vice President and Principal Executive Officer | |
| Date: April 28, 2017 |
Pursuant to the requirements of the Securities Exchange Act of 1934 and the Investment Company Act of 1940, this report has been signed below by the following persons on behalf of the Registrant and in the capacities and on the dates indicated.
| By /s/ Paul F. Roye |
Paul F. Roye, Executive Vice President and Principal Executive Officer |
| Date: April 28, 2017 |
| By /s/ Brian D. Bullard |
Brian D. Bullard, Treasurer and Principal Financial Officer |
| Date: April 28, 2017 |