UNITED STATES
SECURITIES AND EXCHANGE COMMISSION
Washington, D.C. 20549
FORM N-CSR
Certified Shareholder Report of
Registered Management Investment Companies
Investment Company Act File Number: 811-00862
The Growth Fund of America
(Exact Name of Registrant as Specified in Charter)
6455 Irvine Center Drive
Irvine, California 92618
(Address of Principal Executive Offices)
Registrant's telephone number, including area code: (949) 975-5000
Date of fiscal year end: August 31
Date of reporting period: August 31, 2022
Hong T. Le
The Growth Fund of America
6455 Irvine Center Drive
Irvine, California 92618
(Name and Address of Agent for Service)
ITEM 1 – Reports to Stockholders
The Growth Fund of America® Annual report
for the year ended
August 31, 2022 |  |

We believe in
discovering long-term
growth opportunities
around the world on
behalf of our investors
The Growth Fund of America seeks to provide you with growth of capital.
This fund is one of more than 40 offered by Capital Group, home of American Funds, one of the nation’s largest mutual fund families. For over 90 years, Capital Group has invested with a long-term focus based on thorough research and attention to risk.
Fund results shown in this report, unless otherwise indicated, are for Class F-2 shares. Class A share results are shown at net asset value unless otherwise indicated. If a sales charge (maximum 5.75%) had been deducted from Class A shares, the results would have been lower. Results are for past periods and are not predictive of results for future periods. Current and future results may be lower or higher than those shown. Prices and returns will vary, so investors may lose money. Investing for short periods makes losses more likely. For current information and month-end results, visit capitalgroup.com.
Here are the average annual total returns on a $1,000 investment for periods ended September 30, 2022 (the most recent calendar quarter-end):
| | | 1 year | | 5 years | | 10 years |
| | | | | | | |
| Class F-2 shares | | | –27.66 | % | | | 8.42 | % | | | 11.82 | % |
| Class A shares (reflecting 5.75% maximum sales charge) | | | –31.96 | | | | 6.93 | | | | 10.92 | |
For other share class results, visit capitalgroup.com and americanfundsretirement.com.
The total annual fund operating expense ratios are 0.40% for Class F-2 shares and 0.60% for Class A shares as of the prospectus dated November 1, 2022 (unaudited).
Investment results assume all distributions are reinvested and reflect applicable fees and expenses. When applicable, investment results reflect fee waivers and/or expense reimbursements, without which results would have been lower. Visit capitalgroup.com for more information.
Investing outside the United States involves risks, such as currency fluctuations, periods of illiquidity and price volatility, as more fully described in the prospectus. These risks may be heightened in connection with investments in developing countries. Refer to the fund prospectus and the Risk Factors section of this report for more information on these and other risks associated with investing in the fund.
Investments are not FDIC-insured, nor are they deposits of or guaranteed by a bank or any other entity, so they may lose value.
Contents
Fellow investors
The past year, ending August 31, 2022, was not easy on U.S. equities and presented a tough macroeconomic environment overall. Rate hikes from the Federal Reserve — including the largest rate increase since 1994 — and an economy continuing to emerge from the pandemic were significant factors. While some might feel nervous about these conditions, The Growth Fund of America’s investment team is energized by them. These periods can showcase the advantages of the fund’s flexibility, multiple manager perspectives and long-term horizon. The fund’s managers see the current volatility as a positive because of the prospects it offers.
That said, it has been a particularly rough period for growth stocks. The fund was down 23.62% overall over the 12-month period. By comparison, the unmanaged S&P 500 Index, a broad-based representation of the U.S. equity market and the fund’s primary benchmark, was down 11.23%.
While the one-year results are negative, it’s important to acknowledge that over time, The Growth Fund of America has been steadfast. As the table below shows, over five- and 10-year periods, the fund has returned 10.75% and 13.19%, respectively.
Investment results analysis
The year was marked by volatility as the Federal Reserve raised the federal funds rate at a quick pace, leading to a broad-based rise in interest rates. Against this backdrop, growth stocks struggled. The Growth Fund of America’s results were dampened by several of its investments in
Results at a glance
For periods ended August 31, 2022, with all distributions reinvested
| | | Cumulative
total returns | | Average annual total returns |
| | | 1 year | | 5 years | | 10 years | | Lifetime1 |
| | | | | | | | | |
| The Growth Fund of America (Class F-2 shares)2 | | | –23.62 | % | | | 10.75 | % | | | 13.19 | % | | | 13.50 | % |
| The Growth Fund of America (Class A shares) | | | –23.78 | | | | 10.52 | | | | 12.94 | | | | 13.26 | |
| S&P 500 Index3 | | | –11.23 | | | | 11.82 | | | | 13.08 | | | | 11.06 | |
| 1 | Since Capital Research and Management Company (CRMC) began managing the fund on December 1, 1973. |
| 2 | Class F-2 shares were first offered on August 1, 2008. Class F-2 share results prior to the date of first sale are hypothetical based on the results of the original share class of the fund without a sales charge, adjusted for typical estimated expenses. Refer to capitalgroup.com for more information on specific expense adjustments and the actual dates of first sale. |
| 3 | Source: S&P Dow Jones Indices LLC. The market index is unmanaged and, therefore, has no expenses. Investors cannot invest directly in an index. |
| The Growth Fund of America | 1 |
information technology, communication services and consumer discretionary sectors. Many of these stocks supported high valuations, including price-to-earnings multiples, that were ratcheted down by investors in the face of rising interest rates.
Among the fund’s prominent contributors was Tesla, which rose 12.4%. The company, which has a leading position in the growing electric vehicle market, delivered strong revenue and profit growth.
Health care delivered solid returns. Last year, this sector was a detractor for the fund, but by taking a long-term view, innovation in the industry propelled many stocks higher. UnitedHealth Group, another top-10 holding by weight, returned 24.8%. The company is well positioned to improve the quality and reduce the cost of U.S. health care, especially the transition to value-based care. Other contributors in health care included services provider Centene and biotech company Vertex Pharmaceuticals. Their stocks returned 42.5% and 40.7%, respectively.
The communication services sector is home of many of the new media companies. Two of the most prominent ones — Netflix and Meta Platforms (formerly Facebook) — were among the top detractors for the fund. Netflix continues to grapple with attracting new subscribers while cutting down on sharing of accounts among its viewers. The stock lost 60.7% of its value over a 12-month period. Meta, rebranded from Facebook in October 2021, is seeking new areas of growth, especially in the metaverse. The company hopes to tap into a growing market for its VR technology. Despite rebranding and its VR announcement, its stock fell by 57.1%. Part of this was attributable to a loss in advertising revenue due to Apple’s privacy policy changes.
Shopify is another growth stock that was a top detractor. It fell 79.2%. Inflation and rising interest rates may be partially to blame, along with other factors such as investor sentiment shifting away from high-growth companies and a post-COVID drop in e-commerce sales generally.
Due to the uncertain macroeconomic environment, cash was the fund’s largest holding. As of August 31, 2022, nearly 7% of the fund’s portfolio was held in cash and cash equivalents. This helped hedge against potential losses during volatile times over the past year. This amount is never predetermined, but rather reflects the aggregate amount of cash each manager feels is appropriate for their particular portfolio. Cash offers the overall fund a degree of resiliency against market volatility and provides each manager the means to take advantage of investment opportunities when they arise, without the friction of selling something first.
The road ahead
Everything moves in cycles, and the markets are no different. The overall uncertain economic environment and challenges of inflation are very real concerns. Rising inflation — and therefore the need for higher rates to achieve balance — is impacting the economy more broadly. Meanwhile, the Federal Reserve is striving to engineer a soft landing.
As that plays out, the fund’s managers are confident that what made The Growth Fund of America deliver positive long-term results for investors in the past will also help guide it into the future.
| 2 | The Growth Fund of America |
Over the last 12 months we have seen the fund’s flexible mandate in action. By focusing on capital appreciation and selecting companies best suited for this challenging economic environment, the fund’s managers believe it is well positioned.
As we are experiencing continuing volatility, the playbook for investing is changing. The last few years brought a tremendous amount of change. Amid rapid innovation, business models are being disrupted or questioned across many industries. This creates new opportunities for investors like us, and we are devoting our time and energy in identifying companies where management can navigate the current uncertainty to emerge winners on the other side.
Taking a wider lens and looking over the past 10 years, investors’ focus was on top-line growth rather than profits. However, that point of view is fading. A movement toward broad-based evaluation of fundamentals, including profit, is coming to the fore. This is a positive development for the fund.
Capital Group is a research-driven organization, and this economic setting gives the fund’s management team the opportunity to look at each company with a fresh set of eyes, separating the wheat from the chaff.
We believe that our time-tested, long-term investment approach, based on thorough research and robust debate with an eye on valuation, will continue to deliver positive results for our investors.
The Growth Fund of America’s investment professionals continue to seek out investments with the potential to provide long-term growth of capital. We remain committed to our process, which centers on deep fundamental research, a disciplined approach to valuation and a long-term horizon.
As always, we appreciate your support for The Growth Fund of America and look forward to reporting to you once again in six months.
Cordially,

Christopher D. Buchbinder
Co-President

Donald D. O’Neal
Co-President

Anne-Marie Peterson
Co-President
October 10, 2022
For current information about the fund, visit capitalgroup.com.
| The Growth Fund of America | 3 |
The value of a long-term perspective

Fund results shown are for Class F-2 shares and Class A shares. Class A share results reflect deduction of the maximum sales charge of 5.75% on the $10,000 investment1; thus, the net amount invested was $9,425.2 Results are for past periods and are not predictive of results for future periods. Current and future results may be lower or higher than those shown. Prices and returns will vary, so investors may lose money. Investing for short periods makes losses more likely. For current information and month-end results, visit capitalgroup.com.
Class F-2 shares were first offered on August 1, 2008. Class F-2 share results prior to the date of first sale are hypothetical based on the results of the original share class of the fund without a sales charge, adjusted for typical estimated expenses. Refer to capitalgroup.com for more information on specific expense adjustments and the actual dates of first sale.
The results shown are before taxes on fund distributions and sale of fund shares.
| 1 | As outlined in the prospectus, the sales charge is reduced for accounts (and aggregated investments) of $25,000 or more and is eliminated for purchases of $1 million or more. There is no sales charge on dividends or capital gain distributions that are reinvested in additional shares. |
| 2 | The maximum initial sales charge was 8.5% prior to July 1, 1988. |
| 3 | The S&P 500 is unmanaged and, therefore, has no expenses. Investors cannot invest directly in an index. S&P 500 source: S&P Dow Jones Indices LLC. |
| 4 | For the period December 1, 1973 (when Capital Research and Management Company became the fund’s investment adviser), through August 31, 1974. |
| 4 | The Growth Fund of America |
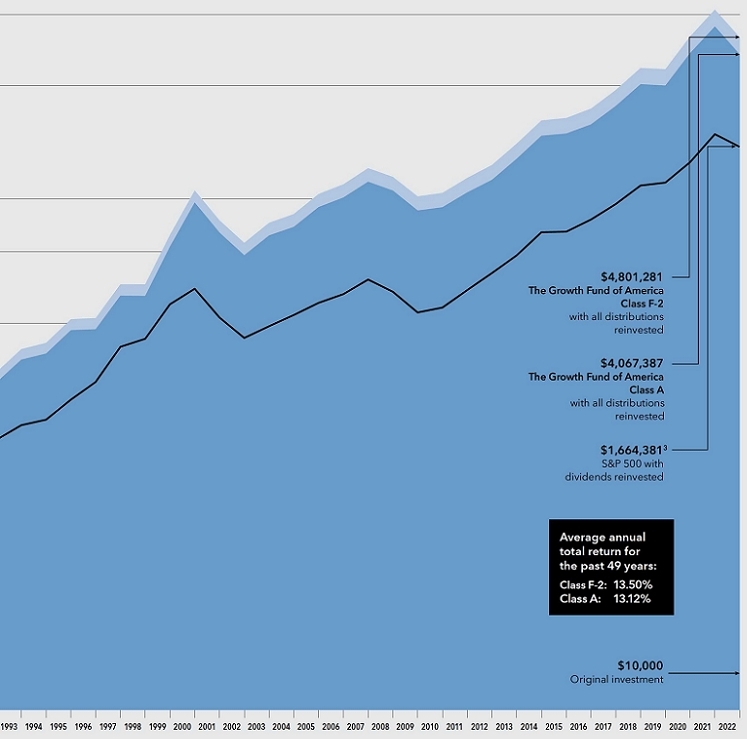
How a hypothetical $10,000 investment has grown
This chart shows how a hypothetical $10,000 investment in Class F-2 and Class A shares of The Growth Fund of America grew from December 1, 1973, to August 31, 2022. As shown below, the investment grew to $4,801,281 or $4,067,387, respectively, with all distributions reinvested.
| The Growth Fund of America | 5 |
Investment portfolio August 31, 2022
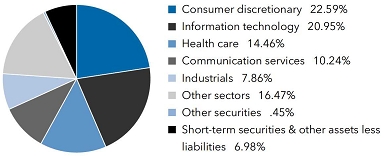
| Sector diversification | Percent of net assets |
| Largest equity holdings | | Percent of
net assets |
| Tesla | | | 6.79 | % |
| Microsoft | | | 6.02 | |
| Alphabet | | | 4.62 | |
| Amazon.com | | | 4.58 | |
| UnitedHealth Group | | | 3.64 | |
| Meta Platforms | | | 2.63 | |
| Broadcom | | | 1.93 | |
| ASML | | | 1.34 | |
| Thermo Fisher Scientific | | | 1.31 | |
| Netflix | | | 1.27 | |
| Common stocks 92.57% | | Shares | | | Value
(000) | |
| Consumer discretionary 22.59% | | | | | | |
| Tesla, Inc.1 | | | 52,504,113 | | | $ | 14,470,659 | |
| Amazon.com, Inc.1 | | | 77,007,340 | | | | 9,762,220 | |
| Airbnb, Inc., Class A1 | | | 16,060,982 | | | | 1,816,818 | |
| Home Depot, Inc. | | | 5,532,022 | | | | 1,595,546 | |
| Chipotle Mexican Grill, Inc.1 | | | 789,475 | | | | 1,260,634 | |
| General Motors Company | | | 32,434,128 | | | | 1,239,308 | |
| D.R. Horton, Inc. | | | 15,460,785 | | | | 1,100,035 | |
| Dollar General Corp. | | | 4,256,552 | | | | 1,010,590 | |
| MercadoLibre, Inc.1 | | | 1,171,258 | | | | 1,001,847 | |
| LVMH Moët Hennessy-Louis Vuitton SE2 | | | 1,431,795 | | | | 926,079 | |
| Hilton Worldwide Holdings, Inc. | | | 6,805,377 | | | | 866,733 | |
| NVR, Inc.1,3 | | | 181,427 | | | | 751,119 | |
| Caesars Entertainment, Inc.1,3 | | | 16,961,378 | | | | 731,375 | |
| NIKE, Inc., Class B | | | 6,117,406 | | | | 651,198 | |
| Flutter Entertainment PLC1,2 | | | 5,094,708 | | | | 639,706 | |
| Rivian Automotive, Inc., Class A1 | | | 19,533,076 | | | | 638,927 | |
| Booking Holdings, Inc.1 | | | 319,332 | | | | 599,006 | |
| Darden Restaurants, Inc. | | | 4,486,017 | | | | 554,965 | |
| Mattel, Inc.1,3 | | | 23,191,666 | | | | 513,000 | |
| Dollar Tree Stores, Inc.1 | | | 3,661,171 | | | | 496,748 | |
| Floor & Decor Holdings, Inc., Class A1,3 | | | 5,628,011 | | | | 457,895 | |
| Coupang, Inc., Class A1 | | | 27,022,599 | | | | 456,682 | |
| Las Vegas Sands Corp.1 | | | 11,999,361 | | | | 451,536 | |
| Aptiv PLC1 | | | 4,765,276 | | | | 445,220 | |
| Polaris, Inc.3 | | | 3,860,916 | | | | 437,326 | |
| Burlington Stores, Inc.1 | | | 2,984,881 | | | | 418,450 | |
| Hermès International2 | | | 322,418 | | | | 413,363 | |
| Royal Caribbean Cruises, Ltd.1 | | | 8,910,811 | | | | 364,007 | |
| CarMax, Inc.1 | | | 3,567,981 | | | | 315,552 | |
| Evolution AB2 | | | 3,736,946 | | | | 299,376 | |
| Starbucks Corp. | | | 3,524,476 | | | | 296,303 | |
| Lennar Corp., Class A | | | 3,633,186 | | | | 281,390 | |
| Etsy, Inc.1 | | | 2,648,379 | | | | 279,695 | |
| Moncler SpA2 | | | 6,070,435 | | | | 271,753 | |
| DoorDash, Inc., Class A1 | | | 4,254,062 | | | | 254,818 | |
| Wayfair, Inc., Class A1,4 | | | 4,523,996 | | | | 238,460 | |
| Vail Resorts, Inc. | | | 872,979 | | | | 196,141 | |
| Xpeng, Inc., Class A (ADR)1 | | | 8,489,458 | | | | 157,225 | |
| Carvana Co., Class A1,4 | | | 4,241,811 | | | | 139,937 | |
| Galaxy Entertainment Group, Ltd.2 | | | 23,307,000 | | | | 130,453 | |
| Adient PLC1 | | | 3,440,780 | | | | 114,234 | |
| adidas AG2 | | | 759,570 | | | | 113,158 | |
| Aramark | | | 3,160,431 | | | | 112,859 | |
| lululemon athletica, Inc.1 | | | 345,195 | | | | 103,545 | |
| Kering SA2 | | | 199,506 | | | | 100,309 | |
| Target Corp. | | | 538,000 | | | | 86,263 | |
| Norwegian Cruise Line Holdings, Ltd.1,4 | | | 6,242,804 | | | | 81,656 | |
| Entain PLC2 | | | 5,476,110 | | | | 80,726 | |
| 6 | The Growth Fund of America |
| Common stocks (continued) | | Shares | | | Value
(000) | |
| Consumer discretionary (continued) | | | | | | |
| Cie. Financière Richemont SA, Class A2 | | | 694,768 | | | $ | 77,583 | |
| YETI Holdings, Inc.1 | | | 1,987,000 | | | | 73,300 | |
| Toll Brothers, Inc. | | | 1,304,776 | | | | 57,136 | |
| LGI Homes, Inc.1 | | | 562,094 | | | | 53,348 | |
| YUM! Brands, Inc. | | | 478,695 | | | | 53,250 | |
| Domino’s Pizza, Inc. | | | 140,644 | | | | 52,300 | |
| TopBuild Corp.1 | | | 105,457 | | | | 19,379 | |
| Helen of Troy, Ltd.1 | | | 139,767 | | | | 17,279 | |
| | | | | | | | 48,128,420 | |
| | | | | | | | | |
| Information technology 20.95% | | | | | | | | |
| Microsoft Corp. | | | 49,084,726 | | | | 12,834,183 | |
| Broadcom, Inc. | | | 8,236,143 | | | | 4,110,741 | |
| ASML Holding NV2 | | | 3,468,140 | | | | 1,681,733 | |
| ASML Holding NV (New York registered) (ADR) | | | 2,409,666 | | | | 1,180,592 | |
| Mastercard, Inc., Class A | | | 8,310,368 | | | | 2,695,634 | |
| Taiwan Semiconductor Manufacturing Company, Ltd.2 | | | 98,046,000 | | | | 1,603,568 | |
| Taiwan Semiconductor Manufacturing Company, Ltd. (ADR) | | | 5,710,325 | | | | 475,956 | |
| Apple, Inc. | | | 10,405,837 | | | | 1,636,006 | |
| MongoDB, Inc., Class A1,3 | | | 4,962,632 | | | | 1,602,235 | |
| ServiceNow, Inc.1 | | | 3,347,744 | | | | 1,454,996 | |
| Micron Technology, Inc. | | | 21,147,496 | | | | 1,195,468 | |
| Applied Materials, Inc. | | | 12,536,137 | | | | 1,179,274 | |
| Motorola Solutions, Inc. | | | 4,469,807 | | | | 1,087,996 | |
| Visa, Inc., Class A | | | 4,150,352 | | | | 824,716 | |
| EPAM Systems, Inc.1 | | | 1,816,530 | | | | 774,750 | |
| Wolfspeed, Inc.1 | | | 5,867,261 | | | | 665,758 | |
| Bill.com Holdings, Inc.1 | | | 3,768,928 | | | | 610,114 | |
| Snowflake, Inc., Class A1 | | | 2,968,454 | | | | 537,142 | |
| NVIDIA Corp. | | | 2,997,940 | | | | 452,509 | |
| Block, Inc., Class A1 | | | 6,390,466 | | | | 440,367 | |
| Synopsys, Inc. (USA)1 | | | 1,243,000 | | | | 430,103 | |
| Datadog, Inc., Class A1 | | | 3,930,696 | | | | 412,527 | |
| Fiserv, Inc.1 | | | 3,736,091 | | | | 378,055 | |
| Affirm Holdings, Inc., Class A1,4 | | | 14,924,678 | | | | 349,685 | |
| Cloudflare, Inc., Class A1 | | | 5,410,900 | | | | 338,560 | |
| Trimble, Inc.1 | | | 4,971,995 | | | | 314,479 | |
| Atlassian Corp. PLC, Class A1 | | | 1,260,860 | | | | 312,265 | |
| Shopify, Inc., Class A, subordinate voting shares1 | | | 9,762,315 | | | | 308,977 | |
| Tyler Technologies, Inc.1 | | | 738,680 | | | | 274,427 | |
| PayPal Holdings, Inc.1 | | | 2,653,597 | | | | 247,952 | |
| Autodesk, Inc.1 | | | 1,150,910 | | | | 232,185 | |
| Nice, Ltd. (ADR)1 | | | 1,011,444 | | | | 215,812 | |
| DocuSign, Inc.1 | | | 3,431,150 | | | | 199,762 | |
| Lam Research Corp. | | | 417,148 | | | | 182,673 | |
| CrowdStrike Holdings, Inc., Class A1 | | | 982,400 | | | | 179,396 | |
| Keyence Corp.2 | | | 452,600 | | | | 170,370 | |
| CDW Corp. | | | 962,800 | | | | 164,350 | |
| Zscaler, Inc.1 | | | 1,004,736 | | | | 159,994 | |
| Adobe, Inc.1 | | | 426,073 | | | | 159,113 | |
| MicroStrategy, Inc., Class A1,4 | | | 684,181 | | | | 158,429 | |
| Arista Networks, Inc.1 | | | 1,251,296 | | | | 150,005 | |
| Alteryx, Inc., Class A1 | | | 2,093,300 | | | | 130,454 | |
| Smartsheet, Inc., Class A1 | | | 3,793,200 | | | | 126,200 | |
| SentinelOne, Inc., Class A1 | | | 4,520,809 | | | | 123,463 | |
| HashiCorp, Inc., Class A1,4 | | | 3,358,531 | | | | 118,724 | |
| Advanced Micro Devices, Inc.1 | | | 1,296,000 | | | | 109,992 | |
| Ciena Corp.1 | | | 2,025,000 | | | | 102,748 | |
| TE Connectivity, Ltd. | | | 812,936 | | | | 102,601 | |
| MKS Instruments, Inc. | | | 1,024,333 | | | | 102,034 | |
| Paycom Software, Inc.1 | | | 267,983 | | | | 94,116 | |
| Genpact, Ltd. | | | 1,950,000 | | | | 91,611 | |
| Enphase Energy, Inc.1 | | | 317,540 | | | | 90,956 | |
| VeriSign, Inc.1 | | | 418,788 | | | | 76,312 | |
| Nuvei Corp., subordinate voting shares1 | | | 2,487,605 | | | | 76,124 | |
| Concentrix Corp. | | | 591,040 | | | | 74,341 | |
| Accenture PLC, Class A | | | 255,805 | | | | 73,789 | |
| Ceridian HCM Holding, Inc.1 | | | 1,232,327 | | | | 73,496 | |
| The Growth Fund of America | 7 |
| Common stocks (continued) | | Shares | | | Value
(000) | |
| Information technology (continued) | | | | | | |
| Kulicke and Soffa Industries, Inc. | | | 1,525,495 | | | $ | 64,132 | |
| TELUS International (Cda), Inc., subordinate voting shares1 | | | 2,199,620 | | | | 62,689 | |
| GoDaddy, Inc., Class A1 | | | 787,924 | | | | 59,740 | |
| Samsung Electronics Co., Ltd.2 | | | 1,305,500 | | | | 57,832 | |
| Marqeta, Inc., Class A1 | | | 7,268,518 | | | | 56,622 | |
| QUALCOMM, Inc. | | | 386,285 | | | | 51,094 | |
| Globant SA1 | | | 234,134 | | | | 49,348 | |
| Zebra Technologies Corp., Class A1 | | | 158,102 | | | | 47,690 | |
| Qorvo, Inc.1 | | | 522,442 | | | | 46,905 | |
| Cognizant Technology Solutions Corp., Class A | | | 549,373 | | | | 34,704 | |
| Stripe, Inc., Class B1,2,5,6 | | | 1,123,404 | | | | 32,287 | |
| Amadeus IT Group SA, Class A, non-registered shares1,2 | | | 527,300 | | | | 27,821 | |
| Gitlab, Inc., Class A1 | | | 450,071 | | | | 26,946 | |
| Toast, Inc., Class A1 | | | 1,329,916 | | | | 25,175 | |
| Elastic NV, non-registered shares1 | | | 196,665 | | | | 16,502 | |
| CCC Intelligent Solutions Holdings, Inc.1 | | | 1,480,590 | | | | 14,154 | |
| Guidewire Software, Inc.1 | | | 164,593 | | | | 11,803 | |
| Paylocity Holding Corp.1 | | | 8,999 | | | | 2,169 | |
| | | | | | | | 44,637,431 | |
| | | | | | | | | |
| Health care 14.46% | | | | | | | | |
| UnitedHealth Group, Inc. | | | 14,917,357 | | | | 7,747,031 | |
| Thermo Fisher Scientific, Inc. | | | 5,126,422 | | | | 2,795,541 | |
| Eli Lilly and Company | | | 5,608,844 | | | | 1,689,552 | |
| Regeneron Pharmaceuticals, Inc.1 | | | 2,614,646 | | | | 1,519,266 | |
| Abbott Laboratories | | | 14,089,299 | | | | 1,446,267 | |
| Vertex Pharmaceuticals, Inc.1 | | | 4,458,027 | | | | 1,256,094 | |
| Alnylam Pharmaceuticals, Inc.1,3 | | | 6,069,173 | | | | 1,254,316 | |
| Centene Corp.1 | | | 11,838,985 | | | | 1,062,431 | |
| Seagen, Inc.1 | | | 6,831,825 | | | | 1,054,082 | |
| CVS Health Corp. | | | 7,939,345 | | | | 779,247 | |
| Zoetis, Inc., Class A | | | 4,649,484 | | | | 727,784 | |
| Stryker Corp. | | | 3,353,147 | | | | 688,066 | |
| Humana, Inc. | | | 1,215,305 | | | | 585,510 | |
| NovoCure, Ltd.1,3 | | | 6,954,553 | | | | 571,177 | |
| Edwards Lifesciences Corp.1 | | | 6,157,031 | | | | 554,749 | |
| Teva Pharmaceutical Industries, Ltd. (ADR)1,3 | | | 58,790,246 | | | | 531,464 | |
| Insulet Corp.1 | | | 1,983,163 | | | | 506,639 | |
| Molina Healthcare, Inc.1 | | | 1,496,383 | | | | 504,835 | |
| Intuitive Surgical, Inc.1 | | | 2,168,309 | | | | 446,108 | |
| Danaher Corp. | | | 1,552,079 | | | | 418,922 | |
| AbbVie, Inc. | | | 3,077,386 | | | | 413,785 | |
| ResMed, Inc. | | | 1,792,708 | | | | 394,252 | |
| PerkinElmer, Inc. | | | 2,790,741 | | | | 376,917 | |
| Catalent, Inc.1 | | | 3,544,924 | | | | 311,953 | |
| Novo Nordisk A/S, Class B2 | | | 2,910,555 | | | | 310,927 | |
| DexCom, Inc.1 | | | 3,351,087 | | | | 275,493 | |
| Oak Street Health, Inc.1 | | | 8,231,885 | | | | 215,675 | |
| Karuna Therapeutics, Inc.1 | | | 817,056 | | | | 208,398 | |
| Horizon Therapeutics PLC1 | | | 3,296,253 | | | | 195,171 | |
| AstraZeneca PLC2 | | | 1,554,353 | | | | 192,349 | |
| Mettler-Toledo International, Inc.1 | | | 151,928 | | | | 184,207 | |
| QIAGEN NV1 | | | 3,634,300 | | | | 165,106 | |
| Pfizer, Inc. | | | 3,625,000 | | | | 163,959 | |
| Biohaven Pharmaceutical Holding Co., Ltd.1 | | | 1,055,751 | | | | 157,676 | |
| Moderna, Inc.1 | | | 1,121,999 | | | | 148,407 | |
| Guardant Health, Inc.1 | | | 2,943,323 | | | | 147,343 | |
| Zimmer Biomet Holdings, Inc. | | | 1,000,000 | | | | 106,320 | |
| Verily Life Sciences, LLC1,2,5,6 | | | 673,374 | | | | 101,444 | |
| Elevance Health, Inc. | | | 188,220 | | | | 91,307 | |
| Inari Medical, Inc.1 | | | 1,205,423 | | | | 83,596 | |
| Exact Sciences Corp.1 | | | 1,713,000 | | | | 60,897 | |
| Fate Therapeutics, Inc.1 | | | 2,176,300 | | | | 56,888 | |
| Ascendis Pharma A/S (ADR)1 | | | 632,152 | | | | 56,622 | |
| BeiGene, Ltd. (ADR)1 | | | 306,306 | | | | 52,580 | |
| CRISPR Therapeutics AG1,4 | | | 801,620 | | | | 52,177 | |
| Galapagos NV1,2 | | | 729,729 | | | | 36,606 | |
| Acerta Pharma BV1,2,5,6 | | | 273,779,325 | | | | 26,119 | |
| 8 | The Growth Fund of America |
| Common stocks (continued) | | Shares | | | Value
(000) | |
| Health care (continued) | | | | | | |
| R1 RCM, Inc.1 | | | 1,122,848 | | | $ | 24,534 | |
| Vir Biotechnology, Inc.1 | | | 1,032,788 | | | | 24,529 | |
| Ultragenyx Pharmaceutical, Inc.1 | | | 506,334 | | | | 24,147 | |
| | | | | | | | 30,798,465 | |
| | | | | | | | | |
| Communication services 10.24% | | | | | | | | |
| Alphabet, Inc., Class C1 | | | 52,615,251 | | | | 5,742,955 | |
| Alphabet, Inc., Class A1 | | | 37,864,620 | | | | 4,097,709 | |
| Meta Platforms, Inc., Class A1 | | | 34,399,411 | | | | 5,604,697 | |
| Netflix, Inc.1 | | | 12,094,364 | | | | 2,703,816 | |
| Charter Communications, Inc., Class A1 | | | 2,312,104 | | | | 954,043 | |
| Comcast Corp., Class A | | | 16,517,067 | | | | 597,753 | |
| ZoomInfo Technologies, Inc.1 | | | 9,927,863 | | | | 450,924 | |
| Activision Blizzard, Inc. | | | 5,300,761 | | | | 416,057 | |
| T-Mobile US, Inc.1 | | | 2,200,562 | | | | 316,793 | |
| Frontier Communications Parent, Inc.1 | | | 8,003,234 | | | | 206,163 | |
| Iridium Communications, Inc.1 | | | 3,950,036 | | | | 175,342 | |
| Snap, Inc., Class A, nonvoting shares1 | | | 12,307,576 | | | | 133,906 | |
| Take-Two Interactive Software, Inc.1 | | | 1,020,000 | | | | 125,011 | |
| ROBLOX Corp., Class A1 | | | 2,152,000 | | | | 84,165 | |
| Electronic Arts, Inc. | | | 580,215 | | | | 73,612 | |
| Epic Games, Inc.1,2,5,6 | | | 84,249 | | | | 61,853 | |
| Pinterest, Inc., Class A1 | | | 1,906,054 | | | | 43,916 | |
| Tencent Holdings, Ltd.2 | | | 812,600 | | | | 33,656 | |
| Yandex NV, Class A1,2,5 | | | 9,341,235 | | | | — | 7 |
| | | | | | | | 21,822,371 | |
| | | | | | | | | |
| Industrials 7.86% | | | | | | | | |
| Carrier Global Corp.3 | | | 53,745,966 | | | | 2,102,542 | |
| General Electric Co. | | | 22,577,660 | | | | 1,658,103 | |
| Old Dominion Freight Line, Inc.3 | | | 5,598,236 | | | | 1,519,417 | |
| TransDigm Group, Inc. | | | 2,362,638 | | | | 1,418,504 | |
| Caterpillar, Inc. | | | 6,569,823 | | | | 1,213,512 | |
| CSX Corp. | | | 29,604,570 | | | | 936,985 | |
| Airbus SE, non-registered shares2 | | | 6,833,814 | | | | 670,522 | |
| Raytheon Technologies Corp. | | | 6,741,008 | | | | 605,005 | |
| HEICO Corp. | | | 2,972,824 | | | | 452,761 | |
| HEICO Corp., Class A | | | 304,964 | | | | 37,383 | |
| United Rentals, Inc.1 | | | 1,613,990 | | | | 471,350 | |
| Jacobs Solutions, Inc. | | | 3,699,106 | | | | 460,835 | |
| Chart Industries, Inc.1,3 | | | 2,168,344 | | | | 420,355 | |
| Uber Technologies, Inc.1 | | | 12,156,402 | | | | 349,618 | |
| Ryanair Holdings PLC (ADR)1 | | | 4,431,787 | | | | 322,235 | |
| Ryanair Holdings PLC1,2 | | | 315,525 | | | | 3,907 | |
| Canadian Pacific Railway, Ltd. | | | 4,332,000 | | | | 324,294 | |
| Safran SA2 | | | 2,984,930 | | | | 304,063 | |
| Robert Half International, Inc. | | | 3,779,700 | | | | 290,924 | |
| Delta Air Lines, Inc.1 | | | 8,848,133 | | | | 274,912 | |
| Axon Enterprise, Inc.1 | | | 1,950,000 | | | | 227,526 | |
| Boeing Company1 | | | 1,188,208 | | | | 190,410 | |
| Dun & Bradstreet Holdings, Inc. | | | 12,776,472 | | | | 182,065 | |
| Advanced Drainage Systems, Inc. | | | 1,254,333 | | | | 170,213 | |
| Honeywell International, Inc. | | | 864,498 | | | | 163,693 | |
| United Airlines Holdings, Inc.1 | | | 4,665,542 | | | | 163,341 | |
| Rockwell Automation | | | 670,996 | | | | 158,986 | |
| Union Pacific Corp. | | | 704,955 | | | | 158,269 | |
| L3Harris Technologies, Inc. | | | 656,608 | | | | 149,831 | |
| Armstrong World Industries, Inc. | | | 1,558,203 | | | | 130,874 | |
| ABB, Ltd.2 | | | 4,705,230 | | | | 129,737 | |
| ASSA ABLOY AB, Class B2 | | | 6,300,000 | | | | 127,718 | |
| Otis Worldwide Corp. | | | 1,757,966 | | | | 126,960 | |
| Waste Connections, Inc. | | | 911,965 | | | | 126,927 | |
| AMETEK, Inc. | | | 931,574 | | | | 111,938 | |
| Trane Technologies PLC | | | 668,000 | | | | 102,919 | |
| Harmonic Drive Systems, Inc.2 | | | 2,769,283 | | | | 100,946 | |
| Cummins, Inc. | | | 398,748 | | | | 85,878 | |
| Simpson Manufacturing Co., Inc. | | | 687,212 | | | | 63,663 | |
| Copart, Inc.1 | | | 497,669 | | | | 59,546 | |
| The Growth Fund of America | 9 |
| Common stocks (continued) | | Shares | | | Value
(000) | |
| Industrials (continued) | | | | | | |
| Northrop Grumman Corp. | | | 112,568 | | | $ | 53,806 | |
| Regal Rexnord Corp. | | | 315,000 | | | | 43,341 | |
| Saia, Inc.1 | | | 191,602 | | | | 39,629 | |
| ManpowerGroup, Inc. | | | 357,376 | | | | 26,203 | |
| TFI International, Inc. | | | 70,000 | | | | 6,985 | |
| | | | | | | | 16,738,631 | |
| | | | | | | | | |
| Financials 6.45% | | | | | | | | |
| SVB Financial Group1 | | | 2,356,881 | | | | 958,119 | |
| Wells Fargo & Company | | | 18,895,286 | | | | 825,913 | |
| Morgan Stanley | | | 8,776,622 | | | | 747,944 | |
| KKR & Co., Inc. | | | 14,731,472 | | | | 744,823 | |
| S&P Global, Inc. | | | 2,045,967 | | | | 720,549 | |
| Berkshire Hathaway, Inc., Class B1 | | | 2,400,000 | | | | 673,920 | |
| JPMorgan Chase & Co. | | | 5,572,306 | | | | 633,738 | |
| CME Group, Inc., Class A | | | 2,964,463 | | | | 579,879 | |
| First Republic Bank | | | 3,669,353 | | | | 557,118 | |
| MSCI, Inc. | | | 1,131,039 | | | | 508,108 | |
| Marsh & McLennan Companies, Inc. | | | 2,681,798 | | | | 432,762 | |
| Progressive Corp. | | | 3,253,958 | | | | 399,098 | |
| Apollo Asset Management, Inc. | | | 6,721,590 | | | | 373,586 | |
| Bank of America Corp. | | | 10,545,099 | | | | 354,421 | |
| BlackRock, Inc. | | | 475,179 | | | | 316,655 | |
| PNC Financial Services Group, Inc. | | | 1,923,245 | | | | 303,873 | |
| Western Alliance Bancorporation | | | 3,590,608 | | | | 275,471 | |
| Discover Financial Services | | | 2,642,000 | | | | 265,495 | |
| American International Group, Inc. | | | 5,073,868 | | | | 262,573 | |
| Arch Capital Group, Ltd.1 | | | 5,728,660 | | | | 261,914 | |
| Signature Bank | | | 1,426,035 | | | | 248,643 | |
| Chubb, Ltd. | | | 1,288,411 | | | | 243,574 | |
| Tradeweb Markets, Inc., Class A | | | 3,370,939 | | | | 234,584 | |
| Blue Owl Capital, Inc., Class A | | | 20,803,700 | | | | 230,921 | |
| Carlyle Group, Inc. | | | 6,758,771 | | | | 219,863 | |
| Essent Group, Ltd.3 | | | 5,470,155 | | | | 218,751 | |
| LPL Financial Holdings, Inc. | | | 918,817 | | | | 203,362 | |
| Capital One Financial Corp. | | | 1,909,662 | | | | 202,080 | |
| HDFC Bank, Ltd.2 | | | 6,041,967 | | | | 111,691 | |
| HDFC Bank, Ltd. (ADR) | | | 1,367,630 | | | | 83,494 | |
| AIA Group, Ltd.2 | | | 19,583,688 | | | | 188,859 | |
| East West Bancorp, Inc. | | | 2,280,899 | | | | 164,612 | |
| Goldman Sachs Group, Inc. | | | 429,439 | | | | 142,861 | |
| T. Rowe Price Group, Inc. | | | 1,159,000 | | | | 139,080 | |
| Intercontinental Exchange, Inc. | | | 1,361,960 | | | | 137,354 | |
| Blackstone, Inc., nonvoting shares | | | 1,314,464 | | | | 123,481 | |
| Ares Management Corp., Class A | | | 1,611,803 | | | | 119,499 | |
| Trupanion, Inc.1 | | | 1,549,269 | | | | 109,347 | |
| Ryan Specialty Holdings, Inc., Class A1 | | | 2,506,440 | | | | 106,173 | |
| Focus Financial Partners, Inc., Class A1 | | | 2,178,000 | | | | 85,269 | |
| Charles Schwab Corp. | | | 1,025,000 | | | | 72,724 | |
| Nu Holdings, Ltd., Class A1 | | | 14,764,705 | | | | 72,347 | |
| Cullen/Frost Bankers, Inc. | | | 518,700 | | | | 67,410 | |
| Fifth Third Bancorp | | | 461,858 | | | | 15,772 | |
| | | | | | | | 13,737,710 | |
| | | | | | | | | |
| Energy 4.62% | | | | | | | | |
| Cenovus Energy, Inc. (CAD denominated) | | | 75,694,022 | | | | 1,420,109 | |
| Cenovus Energy, Inc. | | | 10,250,000 | | | | 192,290 | |
| EOG Resources, Inc. | | | 12,356,049 | | | | 1,498,789 | |
| Canadian Natural Resources, Ltd. (CAD denominated) | | | 20,242,923 | | | | 1,109,750 | |
| Pioneer Natural Resources Company | | | 4,370,836 | | | | 1,106,783 | |
| Halliburton Company | | | 25,265,824 | | | | 761,259 | |
| ConocoPhillips | | | 5,805,244 | | | | 635,384 | |
| Baker Hughes Co., Class A | | | 21,858,308 | | | | 552,141 | |
| Chevron Corp. | | | 2,570,600 | | | | 406,309 | |
| Cheniere Energy, Inc. | | | 2,431,500 | | | | 389,478 | |
| Chesapeake Energy Corp. | | | 3,338,000 | | | | 335,436 | |
| Tourmaline Oil Corp. | | | 4,255,696 | | | | 251,612 | |
| Coterra Energy, Inc. | | | 8,111,178 | | | | 250,717 | |
| 10 | The Growth Fund of America |
| Common stocks (continued) | | Shares | | | Value
(000) | |
| Energy (continued) | | | | | | |
| New Fortress Energy, Inc., Class A | | | 4,363,130 | | | $ | 250,226 | |
| Hess Corp. | | | 1,907,000 | | | | 230,327 | |
| Diamondback Energy, Inc. | | | 1,367,700 | | | | 182,287 | |
| Weatherford International1,3 | | | 4,557,509 | | | | 128,248 | |
| Suncor Energy, Inc.4 | | | 2,579,994 | | | | 83,469 | |
| ONEOK, Inc. | | | 682,754 | | | | 41,805 | |
| Equitrans Midstream Corp. | | | 1,090,194 | | | | 10,106 | |
| | | | | | | | 9,836,525 | |
| | | | | | | | | |
| Consumer staples 2.28% | | | | | | | | |
| Philip Morris International, Inc. | | | 11,791,456 | | | | 1,125,966 | |
| Costco Wholesale Corp. | | | 1,436,550 | | | | 750,023 | |
| Constellation Brands, Inc., Class A | | | 2,467,965 | | | | 607,243 | |
| British American Tobacco PLC2 | | | 11,575,334 | | | | 463,664 | |
| Archer Daniels Midland Company | | | 4,366,126 | | | | 383,739 | |
| Altria Group, Inc. | | | 6,207,015 | | | | 280,060 | |
| Estée Lauder Companies, Inc., Class A | | | 958,044 | | | | 243,707 | |
| Monster Beverage Corp.1 | | | 2,435,914 | | | | 216,382 | |
| Reckitt Benckiser Group PLC2 | | | 2,179,011 | | | | 167,935 | |
| Seven & i Holdings Co., Ltd.2,4 | | | 3,418,800 | | | | 135,500 | |
| Molson Coors Beverage Company, Class B, restricted voting shares | | | 2,577,170 | | | | 133,162 | |
| Kerry Group PLC, Class A2 | | | 1,123,456 | | | | 115,824 | |
| Fever-Tree Drinks PLC2,3 | | | 7,443,100 | | | | 78,906 | |
| Celsius Holdings, Inc.1 | | | 626,076 | | | | 64,793 | |
| Performance Food Group Co.1 | | | 1,274,599 | | | | 63,704 | |
| Kroger Co. | | | 478,816 | | | | 22,954 | |
| JUUL Labs, Inc., Class A1,2,5,6 | | | 433,213 | | | | 3,925 | |
| | | | | | | | 4,857,487 | |
| | | | | | | | | |
| Materials 2.16% | | | | | | | | |
| Linde PLC | | | 3,031,360 | | | | 857,451 | |
| Vale SA, ordinary nominative shares (ADR) | | | 47,463,592 | | | | 589,498 | |
| Vale SA, ordinary nominative shares | | | 8,776,865 | | | | 108,816 | |
| Freeport-McMoRan, Inc. | | | 23,136,503 | | | | 684,841 | |
| Nutrien, Ltd. (CAD denominated) | | | 6,581,442 | | | | 604,199 | |
| Sherwin-Williams Company | | | 2,559,038 | | | | 593,953 | |
| Shin-Etsu Chemical Co., Ltd.2 | | | 2,290,600 | | | | 266,233 | |
| Albemarle Corp. | | | 747,719 | | | | 200,359 | |
| ATI, Inc.1 | | | 5,974,249 | | | | 178,809 | |
| Steel Dynamics, Inc. | | | 2,004,300 | | | | 161,787 | |
| Mosaic Co. | | | 2,200,000 | | | | 118,514 | |
| Summit Materials, Inc., Class A1 | | | 3,775,193 | | | | 107,291 | |
| Glencore PLC2 | | | 17,718,900 | | | | 96,944 | |
| Packaging Corporation of America | | | 173,571 | | | | 23,765 | |
| | | | | | | | 4,592,460 | |
| | | | | | | | | |
| Utilities 0.80% | | | | | | | | |
| PG&E Corp.1 | | | 87,273,377 | | | | 1,076,081 | |
| AES Corp. | | | 9,544,599 | | | | 242,910 | |
| NextEra Energy, Inc. | | | 1,970,817 | | | | 167,638 | |
| CenterPoint Energy, Inc. | | | 4,412,770 | | | | 139,134 | |
| Edison International | | | 671,400 | | | | 45,501 | |
| Exelon Corp. | | | 896,592 | | | | 39,369 | |
| | | | | | | | 1,710,633 | |
| | | | | | | | | |
| Real estate 0.16% | | | | | | | | |
| Equinix, Inc. REIT | | | 273,161 | | | | 179,568 | |
| SBA Communications Corp. REIT | | | 319,646 | | | | 103,965 | |
| American Tower Corp. REIT | | | 241,010 | | | | 61,228 | |
| | | | | | | | 344,761 | |
| | | | | | | | | |
| Total common stocks (cost: $106,750,895,000) | | | | | | | 197,204,894 | |
| The Growth Fund of America | 11 |
| Preferred securities 0.41% | | Shares | | | Value
(000) | |
| Financials 0.21% | | | | | | | | |
| Fannie Mae, Series S, 8.25% noncumulative preferred shares1 | | | 62,266,695 | | | $ | 198,631 | |
| Fannie Mae, Series T, 8.25% noncumulative preferred shares1 | | | 6,954,484 | | | | 20,237 | |
| Fannie Mae, Series O, 7.00% noncumulative preferred shares1 | | | 1,739,366 | | | | 8,262 | |
| Fannie Mae, Series R, 7.625% noncumulative preferred shares1 | | | 837,675 | | | | 2,178 | |
| Fannie Mae, Series P, 4.50% noncumulative preferred shares1 | | | 190,000 | | | | 474 | |
| Federal Home Loan Mortgage Corp., Series Z, 8.375% noncumulative preferred shares1,4 | | | 71,493,658 | | | | 218,056 | |
| Federal Home Loan Mortgage Corp., Series X, 6.02% noncumulative preferred shares1 | | | 239,000 | | | | 645 | |
| Federal Home Loan Mortgage Corp., Series V, 5.57% preferred shares1 | | | 212,500 | | | | 468 | |
| | | | | | | | 448,951 | |
| | | | | | | | | |
| Consumer discretionary 0.10% | | | | | | | | |
| Waymo, LLC, Series A-2, 8.00% noncumulative preferred shares1,2,5,6 | | | 1,164,589 | | | | 106,818 | |
| Waymo, LLC, Series B-2, preferred shares1,2,5,6 | | | 163,537 | | | | 15,000 | |
| GM Cruise Holdings, LLC, Series F, preferred shares1,2,5,6 | | | 5,205,500 | | | | 95,990 | |
| | | | | | | | 217,808 | |
| | | | | | | | | |
| Information technology 0.08% | | | | | | | | |
| Chime Financial, Inc., Series G, preferred shares1,2,5,6 | | | 1,433,730 | | | | 59,801 | |
| Samsung Electronics Co., Ltd., nonvoting preferred shares2 | | | 1,366,500 | | | | 55,397 | |
| Tipalti Solutions, Ltd., Series F, preferred shares1,2,5,6 | | | 3,800,381 | | | | 31,049 | |
| PsiQuantum Corp., Series D, preferred shares1,2,5,6 | | | 613,889 | | | | 16,587 | |
| Stripe, Inc., Series H, 6.00% noncumulative preferred shares1,2,5,6 | | | 376,444 | | | | 10,819 | |
| | | | | | | | 173,653 | |
| | | | | | | | | |
| Industrials 0.02% | | | | | | | | |
| ABL Space Systems Co., Series B2, preferred shares1,2,5,6 | | | 576,000 | | | | 33,293 | |
| | | | | | | | | |
| Total preferred securities (cost: $1,331,912,000) | | | | | | | 873,705 | |
| | | | | | | | | |
| Rights & warrants 0.01% | | | | | | | | |
| Energy 0.01% | | | | | | | | |
| Cenovus Energy, Inc., warrants, expire 20261 | | | 1,057,325 | | | | 14,636 | |
| | | | | | | | | |
| Total rights & warrants (cost: $3,563,000) | | | | | | | 14,636 | |
| | | | | | | | | |
| Convertible stocks 0.02% | | | | | | | | |
| Financials 0.02% | | | | | | | | |
| KKR & Co., Inc., Series C, convertible preferred shares, 6.00% 2023 | | | 625,300 | | | | 38,919 | |
| | | | | | | | | |
| Total convertible stocks (cost: $38,562,000) | | | | | | | 38,919 | |
| | | | | | | | | |
| Convertible bonds & notes 0.01% | | Principal amount
(000) | | | | |
| Consumer discretionary 0.01% | | | | | | | | |
| Royal Caribbean Cruises, Ltd., convertible notes, 4.25% 2023 | | USD | 15,707 | | | | 15,513 | |
| | | | | | | | | |
| Industrials 0.00% | | | | | | | | |
| Einride AB, convertible notes, 7.00% 20232,5,6 | | | 8,500 | | | | 9,562 | |
| | | | | | | | | |
| Total convertible bonds & notes (cost: $24,096,000) | | | | | | | 25,075 | |
| | | | | | | | | |
| Short-term securities 7.22% | | | Shares | | | | | |
| Money market investments 6.96% | | | | | | | | |
| Capital Group Central Cash Fund 2.26%3,8 | | | 148,333,764 | | | | 14,830,410 | |
| | | | | | | | | |
| | | | | | | | | |
| Money market investments purchased with collateral from securities on loan 0.26% | | | | | | | | |
| Capital Group Central Cash Fund 2.26%3,8,9 | | | 2,314,701 | | | | 231,424 | |
| BlackRock Liquidity Funds – FedFund, Institutional Shares 2.02%8,9 | | | 64,797,356 | | | | 64,798 | |
| Invesco Short-Term Investments Trust – Government & Agency Portfolio, Institutional Class 2.22%8,9 | | | 64,797,356 | | | | 64,797 | |
| 12 | The Growth Fund of America |
| Short-term securities (continued) | | Shares | | | Value
(000) | |
| Money market investments purchased with collateral from securities on loan (continued) | | | | | | | | |
| Morgan Stanley Institutional Liquidity Funds – Government Portfolio, Institutional Class 2.11%8,9 | | | 64,797,356 | | | $ | 64,797 | |
| State Street Institutional U.S. Government Money Market Fund, Institutional Class 2.22%8,9 | | | 64,797,356 | | | | 64,797 | |
| Goldman Sachs Financial Square Government Fund, Institutional Shares 2.17%8,9 | | | 57,832,073 | | | | 57,832 | |
| | | | | | | | 548,445 | |
| | | | | | | | | |
| Total short-term securities (cost: $15,379,836,000) | | | | | | | 15,378,855 | |
| Total investment securities 100.24% (cost: $123,528,864,000) | | | | | | | 213,536,084 | |
| Other assets less liabilities (0.24)% | | | | | | | (508,039 | ) |
| | | | | | | | | |
| Net assets 100.00% | | | | | | $ | 213,028,045 | |
Investments in affiliates3
| | | | | | | | | | | | | | | Net | | | | | | | |
| | | Value of | | | | | | | | | Net | | | unrealized | | | Value of | | | Dividend | |
| | | affiliates at | | | | | | | | | realized | | | (depreciation) | | | affiliates at | | | or interest | |
| | | 9/1/2021 | | | Additions | | | Reductions | | | (loss) gain | | | appreciation | | | 8/31/2022 | | | income | |
| | | (000) | | | (000) | | | (000) | | | (000) | | | (000) | | | (000) | | | (000) | |
| Common stocks 5.31% | | | | | | | | | | | | | | | | | | | | | | | | | | | | |
| Consumer discretionary 1.36% | | | | | | | | | | | | | | | | | | | | | | | | | | | | |
| NVR, Inc.1 | | $ | 939,843 | | | $ | 107,759 | | | $ | 98,681 | | | $ | (9,101 | ) | | $ | (188,701 | ) | | $ | 751,119 | | | $ | — | |
| Caesars Entertainment, Inc.1 | | | 1,672,612 | | | | 246,899 | | | | 120,623 | | | | (157,195 | ) | | | (910,318 | ) | | | 731,375 | | | | — | |
| Mattel, Inc.1 | | | 417,243 | | | | 78,439 | | | | 28 | | | | 15 | | | | 17,331 | | | | 513,000 | | | | — | |
| Floor & Decor Holdings, Inc., Class A1 | | | 309,889 | | | | 232,258 | | | | 20 | | | | 14 | | | | (84,246 | ) | | | 457,895 | | | | — | |
| Polaris, Inc. | | | — | | | | 431,032 | | | | 14 | | | | (1 | ) | | | 6,309 | | | | 437,326 | | | | 7,312 | |
| Burlington Stores, Inc.1,10 | | | 1,109,393 | | | | 175,662 | | | | 431,819 | | | | 47,216 | | | | (482,002 | ) | | | — | | | | — | |
| Royal Caribbean Cruises, Ltd.1,10 | | | 1,926,185 | | | | 36,135 | | | | 722,014 | | | | (347,821 | ) | | | (528,478 | ) | | | — | | | | — | |
| | | | | | | | | | | | | | | | | | | | | | | | 2,890,715 | | | | | |
| Information technology 0.75% | | | | | | | | | | | | | | | | | | | | | | | | | | | | |
| MongoDB, Inc., Class A1 | | | 1,944,651 | | | | 109,437 | | | | 145,662 | | | | 44,593 | | | | (350,784 | ) | | | 1,602,235 | | | | — | |
| Health care 1.10% | | | | | | | | | | | | | | | | | | | | | | | | | | | | |
| Alnylam Pharmaceuticals, Inc.1 | | | 36,170 | | | | 901,186 | | | | 2 | | | | 1 | | | | 316,961 | | | | 1,254,316 | | | | — | |
| NovoCure, Ltd.1 | | | 1,266,535 | | | | 115,408 | | | | 266,623 | | | | (368,351 | ) | | | (175,792 | ) | | | 571,177 | | | | — | |
| Teva Pharmaceutical Industries, Ltd. (ADR)1 | | | 395,479 | | | | 565,700 | | | | 304,845 | | | | (299,183 | ) | | | 174,313 | | | | 531,464 | | | | — | |
| Allakos, Inc.11 | | | 316,956 | | | | — | | | | 54,875 | | | | (125,322 | ) | | | (136,759 | ) | | | — | | | | — | |
| Allogene Therapeutics, Inc.11 | | | 173,924 | | | | — | | | | 95,136 | | | | (113,362 | ) | | | 34,574 | | | | — | | | | — | |
| Biohaven Pharmaceutical Holding Co., Ltd.1,10 | | | 759,587 | | | | 93,907 | | | | 741,889 | | | | 359,914 | | | | (313,843 | ) | | | — | | | | — | |
| Quince Therapeutics, Inc.11,12 | | | 233,632 | | | | 14,610 | | | | 14,290 | | | | (122,895 | ) | | | (111,057 | ) | | | — | | | | — | |
| Guardant Health, Inc.1,10 | | | 266,200 | | | | 533,889 | | | | 314,172 | | | | (156,413 | ) | | | (182,161 | ) | | | — | | | | — | |
| Insulet Corp.1,10 | | | 1,041,405 | | | | 91,807 | | | | 448,912 | | | | 36,337 | | | | (213,998 | ) | | | — | | | | — | |
| Oak Street Health, Inc.1,10 | | | 526,713 | | | | 266,183 | | | | 228,898 | | | | (372,985 | ) | | | 24,662 | | | | — | | | | — | |
| Twist Bioscience Corp.11 | | | 285,727 | | | | 15,031 | | | | 89,544 | | | | (180,587 | ) | | | (30,627 | ) | | | — | | | | — | |
| | | | | | | | | | | | | | | | | | | | | | | | 2,356,957 | | | | | |
| Communication services 0.00% | | | | | | | | | | | | | | | | | | | | | | | | | | | | |
| Netflix, Inc.1,10 | | | 13,792,670 | | | | 653,775 | | | | 5,971,723 | | | | 2,935,212 | | | | (8,706,118 | ) | | | — | | | | — | |
| Industrials 1.90% | | | | | | | | | | | | | | | | | | | | | | | | | | | | |
| Carrier Global Corp. | | | 2,689,777 | | | | 344,482 | | | | 2,117 | | | | 128 | | | | (929,728 | ) | | | 2,102,542 | | | | 29,203 | |
| Old Dominion Freight Line, Inc. | | | 1,167,513 | | | | 585,309 | | | | 182,137 | | | | 101,396 | | | | (152,664 | ) | | | 1,519,417 | | | | 3,188 | |
| Chart Industries, Inc.1 | | | 214,182 | | | | 173,603 | | | | 15 | | | | 2 | | | | 32,583 | | | | 420,355 | | | | — | |
| Dun & Bradstreet Holdings, Inc.10 | | | 432,904 | | | | — | | | | 189,543 | | | | (68,386 | ) | | | 7,090 | | | | — | | | | 639 | |
| Harmonic Drive Systems, Inc.2,10 | | | 284,744 | | | | 9,563 | | | | 69,137 | | | | (126,746 | ) | | | 2,522 | | | | — | | | | 926 | |
| | | | | | | | | | | | | | | | | | | | | | | | 4,042,314 | | | | | |
| The Growth Fund of America | 13 |
Investments in affiliates3 (continued)
| | | | | | | | | | | | | | | Net | | | | | | | |
| | | Value of | | | | | | | | | Net | | | unrealized | | | Value of | | | Dividend | |
| | | affiliates at | | | | | | | | | realized | | | (depreciation) | | | affiliates at | | | or interest | |
| | | 9/1/2021 | | | Additions | | | Reductions | | | (loss) gain | | | appreciation | | | 8/31/2022 | | | income | |
| | | (000) | | | (000) | | | (000) | | | (000) | | | (000) | | | (000) | | | (000) | |
| Financials 0.10% | | | | | | | | | | | | | | | | | | | | | | | | | | | | |
| Essent Group, Ltd. | | $ | 233,250 | | | $ | 60,605 | | | $ | 40,509 | | | $ | (9,119 | ) | | $ | (25,476 | ) | | $ | 218,751 | | | $ | 4,284 | |
| Energy 0.06% | | | | | | | | | | | | | | | | | | | | | | | | | | | | |
| Weatherford International1 | | | 68,075 | | | | 4,949 | | | | 8 | | | | 2 | | | | 55,230 | | | | 128,248 | | | | — | |
| Cenovus Energy, Inc. (CAD denominated)10 | | | 1,077,536 | | | | 157,140 | | | | 955,717 | | | | 422,220 | | | | 718,930 | | | | — | | | | 14,706 | |
| | | | | | | | | | | | | | | | | | | | | | | | 128,248 | | | | | |
| Consumer staples 0.04% | | | | | | | | | | | | | | | | | | | | | | | | | | | | |
| Fever-Tree Drinks PLC2 | | | 54,704 | | | | 110,601 | | | | 5 | | | | 1 | | | | (86,395 | ) | | | 78,906 | | | | 1,847 | |
| Herbalife Nutrition, Ltd.11 | | | 466,788 | | | | — | | | | 389,931 | | | | 16,976 | | | | (93,833 | ) | | | — | | | | — | |
| | | | | | | | | | | | | | | | | | | | | | | | 78,906 | | | | | |
| Total common stocks | | | | | | | | | | | | | | | | | | | | | | | 11,318,126 | | | | | |
| | | | | | | | | | | | | | | | | | | | | | | | | | | | | |
| Rights & warrants 0.00% | | | | | | | | | | | | | | | | | | | | | | | | | | | | |
| Energy 0.00% | | | | | | | | | | | | | | | | | | | | | | | | | | | | |
| Cenovus Energy, Inc., warrants, expire 20261,10 | | | 4,836 | | | | — | | | | — | 7 | | | — | 7 | | | 9,800 | | | | — | | | | — | |
| Convertible bonds & notes 0.00% | | | | | | | | | �� | | | | | | | | | | | | | | | | | | | |
| Consumer discretionary 0.00% | | | | | | | | | | | | | | | | | | | | | | | | | | | | |
| Royal Caribbean Cruises, Ltd., convertible notes, 4.25% 202310 | | | 21,225 | | | | — | | | | 1 | | | | — | 7 | | | (5,711 | ) | | | — | | | | 802 | |
| Short-term securities 7.07% | | | | | | | | | | | | | | | | | | | | | | | | | | | | |
| Money market investments 6.96% | | | | | | | | | | | | | | | | | | | | | | | | | | | | |
| Capital Group Central Cash Fund 2.26%8 | | | 8,094,078 | | | | 31,894,921 | | | | 25,154,577 | | | | (2,425 | ) | | | (1,587 | ) | | | 14,830,410 | | | | 85,966 | |
| Money market investments purchased with collateral from securities on loan 0.11% | | | | | | | | | | | | | | | | | | | | | | | | | | | | |
| Capital Group Central Cash Fund 2.26%8,9 | | | 101,118 | | | | 130,306 | 13 | | | | | | | | | | | | | | | 231,424 | | | | — | 14 |
| Total short-term securities | | | | | | | | | | | | | | | | | | | | | | | 15,061,834 | | | | | |
| Total 12.38% | | | | | | | | | | | | | | $ | 1,504,135 | | | $ | (12,309,973 | ) | | $ | 26,379,960 | | | $ | 148,873 | |
Restricted securities6
| | | | | | | | | | | Percent | |
| | | Acquisition | | Cost | | | Value | | | of net | |
| | | date | | (000) | | | (000) | | | assets | |
| Waymo, LLC, Series A-2, 8.00% noncumulative preferred shares1,2,5 | | 5/1/2020 | | $ | 100,000 | | | $ | 106,818 | | | | .05 | % |
| Waymo, LLC, Series B-2, preferred shares1,2,5 | | 6/11/2021 | | | 15,000 | | | | 15,000 | | | | .01 | |
| Verily Life Sciences, LLC1,2,5 | | 12/21/2018 | | | 83,000 | | | | 101,444 | | | | .05 | |
| GM Cruise Holdings, LLC, Series F, preferred shares1,2,5 | | 5/7/2020 | | | 95,000 | | | | 95,990 | | | | .04 | |
| Epic Games, Inc.1,2,5 | | 3/29/2021 | | | 74,560 | | | | 61,853 | | | | .03 | |
| Chime Financial, Inc., Series G, preferred shares1,2,5 | | 8/24/2021 | | | 99,027 | | | | 59,801 | | | | .03 | |
| Stripe, Inc., Class B1,2,5 | | 5/6/2021 | | | 45,080 | | | | 32,287 | | | | .02 | |
| Stripe, Inc., Series H, 6.00% noncumulative preferred shares1,2,5 | | 3/15/2021 | | | 15,105 | | | | 10,819 | | | | .00 | |
| ABL Space Systems Co., Series B2, preferred shares1,2,5 | | 10/22/2021 | | | 39,166 | | | | 33,293 | | | | .02 | |
| Tipalti Solutions, Ltd., Series F, preferred shares1,2,5 | | 12/1/2021 | | | 65,064 | | | | 31,049 | | | | .01 | |
| Acerta Pharma BV1,2,5 | | 5/7/2015 | | | 10,221 | | | | 26,119 | | | | .01 | |
| PsiQuantum Corp., Series D, preferred shares1,2,5 | | 5/28/2021 | | | 16,100 | | | | 16,587 | | | | .01 | |
| Einride AB, convertible notes, 7.00% 20232,5 | | 1/7/2022 | | | 8,500 | | | | 9,562 | | | | .00 | |
| JUUL Labs, Inc., Class A1,2,5 | | 4/8/2019 | | | 120,000 | | | | 3,925 | | | | .00 | |
| Total | | | | $ | 785,823 | | | $ | 604,547 | | | | .28 | % |
| 14 | The Growth Fund of America |
| 1 | Security did not produce income during the last 12 months. |
| 2 | Valued under fair value procedures adopted by authority of the board of trustees. The total value of all such securities was $10,789,761,000, which represented 5.06% of the net assets of the fund. This amount includes $10,185,214,000 related to certain securities trading outside the U.S. whose values were adjusted as a result of significant market movements following the close of local trading. |
| 3 | Affiliate of the fund or part of the same “group of investment companies” as the fund, as defined under the Investment Company Act of 1940, as amended. |
| 4 | All or a portion of this security was on loan. The total value of all such securities was $589,812,000, which represented .28% of the net assets of the fund. Refer to Note 5 for more information on securities lending. |
| 5 | Value determined using significant unobservable inputs. |
| 6 | Restricted security subject to legal or contractual restrictions on resale, including private placement securities not registered under the Securities Act of 1933. The total value of all such restricted securities was $604,547,000, which represented .28% of the net assets of the fund. |
| 7 | Amount less than one thousand. |
| 8 | Rate represents the seven-day yield at 8/31/2022. |
| 9 | Security purchased with cash collateral from securities on loan. Refer to Note 5 for more information on securities lending. |
| 10 | Affiliated issuer during the reporting period but no longer an affiliate at 8/31/2022. Refer to the investment portfolio for the security value at 8/31/2022. |
| 11 | Affiliated issuer during the reporting period but no longer held at 8/31/2022. |
| 12 | This security changed its name during the reporting period. |
| 13 | Represents net activity. Refer to Note 5 for more information on securities lending. |
| 14 | Dividend income is included with securities lending income in the fund’s statement of operations and is not shown in this table. |
Key to abbreviations
ADR = American Depositary Receipts
CAD = Canadian dollars
REIT = Real Estate Investment Trust
USD = U.S. dollars
Refer to the notes to financial statements.
| The Growth Fund of America | 15 |
Financial statements
Statement of assets and liabilities
at August 31, 2022 | (dollars in thousands) |
| Assets: | | | | | | | | |
| Investment securities, at value (includes $589,812 of investment securities on loan): | | | | | | | | |
| Unaffiliated issuers (cost: $99,724,701) | | $ | 187,156,124 | | | | | |
| Affiliated issuers (cost: $23,804,163) | | | 26,379,960 | | | $ | 213,536,084 | |
| Cash | | | | | | | 5,554 | |
| Cash denominated in currencies other than U.S. dollars (cost: $19,655) | | | | | | | 19,655 | |
| Cash collateral received for securities on loan | | | | | | | 60,938 | |
| Receivables for: | | | | | | | | |
| Sales of investments | | | 185,849 | | | | | |
| Sales of fund’s shares | | | 121,524 | | | | | |
| Dividends and interest | | | 186,288 | | | | | |
| Securities lending income | | | 25 | | | | | |
| Other | | | 3 | | | | 493,689 | |
| | | | | | | | 214,115,920 | |
| | | | | | | | | |
| Liabilities: | | | | | | | | |
| Collateral for securities on loan | | | | | | | 609,383 | |
| Payables for: | | | | | | | | |
| Purchases of investments | | | 232,744 | | | | | |
| Repurchases of fund’s shares | | | 138,126 | | | | | |
| Investment advisory services | | | 49,860 | | | | | |
| Services provided by related parties | | | 44,082 | | | | | |
| Trustees’ deferred compensation | | | 5,655 | | | | | |
| Other | | | 8,025 | | | | 478,492 | |
| Net assets at August 31, 2022 | | | | | | $ | 213,028,045 | |
| | | | | | | | | |
| Net assets consist of: | | | | | | | | |
| Capital paid in on shares of beneficial interest | | | | | | $ | 116,084,423 | |
| Total distributable earnings | | | | | | | 96,943,622 | |
| Net assets at August 31, 2022 | | | | | | $ | 213,028,045 | |
Refer to the notes to financial statements.
| 16 | The Growth Fund of America |
| Financial statements (continued) | |
| | |
Statement of assets and liabilities
at August 31, 2022 (continued) | |
| (dollars and shares in thousands, except per-share amounts) |
| |
Shares of beneficial interest issued and outstanding (no stated par value) —
unlimited shares authorized (3,884,224 total shares outstanding) | |
| | | Net assets | | | Shares
outstanding | | | Net asset value
per share | |
| Class A | | $ | 104,663,653 | | | | 1,899,454 | | | $ | 55.10 | |
| Class C | | | 3,251,910 | | | | 66,727 | | | | 48.73 | |
| Class T | | | 12 | | | | — | * | | | 55.13 | |
| Class F-1 | | | 5,330,378 | | | | 97,548 | | | | 54.64 | |
| Class F-2 | | | 28,562,659 | | | | 519,335 | | | | 55.00 | |
| Class F-3 | | | 8,922,116 | | | | 161,582 | | | | 55.22 | |
| Class 529-A | | | 10,549,434 | | | | 194,254 | | | | 54.31 | |
| Class 529-C | | | 339,548 | | | | 6,951 | | | | 48.85 | |
| Class 529-E | | | 310,670 | | | | 5,817 | | | | 53.41 | |
| Class 529-T | | | 18 | | | | — | * | | | 55.10 | |
| Class 529-F-1 | | | 10 | | | | — | * | | | 54.19 | |
| Class 529-F-2 | | | 772,997 | | | | 14,030 | | | | 55.10 | |
| Class 529-F-3 | | | 31 | | | | 1 | | | | 55.05 | |
| Class R-1 | | | 269,414 | | | | 5,420 | | | | 49.71 | |
| Class R-2 | | | 1,804,919 | | | | 35,814 | | | | 50.40 | |
| Class R-2E | | | 189,789 | | | | 3,564 | | | | 53.25 | |
| Class R-3 | | | 4,118,208 | | | | 76,968 | | | | 53.51 | |
| Class R-4 | | | 5,093,297 | | | | 93,499 | | | | 54.47 | |
| Class R-5E | | | 996,296 | | | | 18,269 | | | | 54.53 | |
| Class R-5 | | | 1,456,577 | | | | 26,401 | | | | 55.17 | |
| Class R-6 | | | 36,396,109 | | | | 658,590 | | | | 55.26 | |
| * | Amount less than one thousand. |
Refer to the notes to financial statements.
| The Growth Fund of America | 17 |
Financial statements (continued)
Statement of operations
for the year ended August 31, 2022 | | (dollars in thousands) |
| Investment income: | | | | | | | | |
| Income: | | | | | | | | |
| Dividends (net of non-U.S. taxes of $39,133; also includes $148,071 from affiliates) | | $ | 2,103,958 | | | | | |
| Securities lending income (net of fees) | | | 9,395 | | | | | |
| Interest (includes $802 from affiliates) | | | 7,706 | | | $ | 2,121,059 | |
| Fees and expenses*: | | | | | | | | |
| Investment advisory services | | | 656,611 | | | | | |
| Distribution services | | | 465,063 | | | | | |
| Transfer agent services | | | 168,594 | | | | | |
| Administrative services | | | 76,457 | | | | | |
| 529 plan services | | | 8,350 | | | | | |
| Reports to shareholders | | | 4,409 | | | | | |
| Registration statement and prospectus | | | 2,198 | | | | | |
| Trustees’ compensation | | | (177 | ) | | | | |
| Auditing and legal | | | 237 | | | | | |
| Custodian | | | 3,630 | | | | | |
| Other | | | 344 | | | | | |
| Total fees and expenses before waiver | | | 1,385,716 | | | | | |
| Less waiver of fees and expenses: | | | | | | | | |
| Investment advisory services waiver | | | 426 | | | | | |
| Total fees and expenses after waiver | | | | | | | 1,385,290 | |
| Net investment income | | | | | | | 735,769 | |
| | | | | | | | | |
| Net realized gain and unrealized depreciation: | | | | | | | | |
| Net realized gain (loss) on: | | | | | | | | |
| Investments: | | | | | | | | |
| Unaffiliated issuers | | | 8,693,514 | | | | | |
| Affiliated issuers | | | 1,504,135 | | | | | |
| In-kind redemptions | | | 12,551 | | | | | |
| Currency transactions | | | (5,944 | ) | | | 10,204,256 | |
| Net unrealized depreciation on: | | | | | | | | |
| Investments (net of non-U.S. taxes of $4,005): | | | | | | | | |
| Unaffiliated issuers | | | (65,834,469 | ) | | | | |
| Affiliated issuers | | | (12,309,973 | ) | | | | |
| Currency translations | | | (616 | ) | | | (78,145,058 | ) |
| Net realized gain and unrealized depreciation | | | | | | | (67,940,802 | ) |
| | | | | | | | | |
| Net decrease in net assets resulting from operations | | | | | | $ | (67,205,033 | ) |
| * | Additional information related to class-specific fees and expenses is included in the notes to financial statements. |
Refer to the notes to financial statements.
| 18 | The Growth Fund of America |
Financial statements (continued)
| Statements of changes in net assets | (dollars in thousands) |
| | | Year ended August 31, | |
| | | 2022 | | | 2021 | |
| Operations: | | | | | | | | |
| Net investment income | | $ | 735,769 | | | $ | 321,192 | |
| Net realized gain | | | 10,204,256 | | | | 26,149,154 | |
| Net unrealized (depreciation) appreciation | | | (78,145,058 | ) | | | 40,957,744 | |
| Net (decrease) increase in net assets resulting from operations | | | (67,205,033 | ) | | | 67,428,090 | |
| |
| Distributions paid to shareholders | | | (22,497,477 | ) | | | (10,832,505 | ) |
| |
| Net capital share transactions | | | 12,808,331 | | | | (2,115,283 | ) |
| |
| Total (decrease) increase in net assets | | | (76,894,179 | ) | | | 54,480,302 | |
| |
| Net assets: | | | | | | | | |
| Beginning of year | | | 289,922,224 | | | | 235,441,922 | |
| End of year | | $ | 213,028,045 | | | $ | 289,922,224 | |
Refer to the notes to financial statements.
| The Growth Fund of America | 19 |
Notes to financial statements
1. Organization
The Growth Fund of America (the “fund”) is registered under the Investment Company Act of 1940, as amended (the “1940 Act”), as an open-end, diversified management investment company. The fund seeks to provide growth of capital.
The fund has 21 share classes consisting of six retail share classes (Classes A, C, T, F-1, F-2 and F-3), seven 529 college savings plan share classes (Classes 529-A, 529-C, 529-E, 529-T, 529-F-1, 529-F-2 and 529-F-3) and eight retirement plan share classes (Classes R-1, R-2, R-2E, R-3, R-4, R-5E, R-5 and R-6). The 529 college savings plan share classes can be used to save for college education. The retirement plan share classes are generally offered only through eligible employer-sponsored retirement plans. The fund’s share classes are described further in the following table:
| Share class | | Initial sales charge | | Contingent deferred sales
charge upon redemption | | Conversion feature |
| Classes A and 529-A | | Up to 5.75% for Class A; up to 3.50% for Class 529-A | | None (except 1.00% for certain redemptions within 18 months of purchase without an initial sales charge) | | None |
| Classes C and 529-C | | None | | 1.00% for redemptions within one year of purchase | | Class C converts to Class A after eight years and Class 529-C converts to Class 529-A after five years |
| Class 529-E | | None | | None | | None |
| Classes T and 529-T* | | Up to 2.50% | | None | | None |
| Classes F-1, F-2, F-3, 529-F-1, 529-F-2 and 529-F-3 | | None | | None | | None |
| Classes R-1, R-2, R-2E, R-3, R-4, R-5E, R-5 and R-6 | | None | | None | | None |
| * | Class T and 529-T shares are not available for purchase. |
Holders of all share classes have equal pro rata rights to the assets, dividends and liquidation proceeds of the fund. Each share class has identical voting rights, except for the exclusive right to vote on matters affecting only its class. Share classes have different fees and expenses (“class-specific fees and expenses”), primarily due to different arrangements for distribution, transfer agent and administrative services. Differences in class-specific fees and expenses will result in differences in net investment income and, therefore, the payment of different per-share dividends by each share class.
2. Significant accounting policies
The fund is an investment company that applies the accounting and reporting guidance issued in Topic 946 by the U.S. Financial Accounting Standards Board. The fund’s financial statements have been prepared to comply with U.S. generally accepted accounting principles (“U.S. GAAP”). These principles require the fund’s investment adviser to make estimates and assumptions that affect reported amounts and disclosures. Actual results could differ from those estimates. Subsequent events, if any, have been evaluated through the date of issuance in the preparation of the financial statements. The fund follows the significant accounting policies described in this section, as well as the valuation policies described in the next section on valuation.
Security transactions and related investment income — Security transactions are recorded by the fund as of the date the trades are executed with brokers. Realized gains and losses from security transactions are determined based on the specific identified cost of the securities. In the event a security is purchased with a delayed payment date, the fund will segregate liquid assets sufficient to meet its payment obligations. Dividend income is recognized on the ex-dividend date and interest income is recognized on an accrual basis. Market discounts, premiums and original issue discounts on fixed-income securities are amortized daily over the expected life of the security.
Class allocations — Income, fees and expenses (other than class-specific fees and expenses), realized gains and losses and unrealized appreciation and depreciation are allocated daily among the various share classes based on their relative net assets. Class-specific fees and expenses, such as distribution, transfer agent and administrative services, are charged directly to the respective share class.
Distributions paid to shareholders — Income dividends and capital gain distributions are recorded on the ex-dividend date.
| 20 | The Growth Fund of America |
Currency translation — Assets and liabilities, including investment securities, denominated in currencies other than U.S. dollars are translated into U.S. dollars at the exchange rates supplied by one or more pricing vendors on the valuation date. Purchases and sales of investment securities and income and expenses are translated into U.S. dollars at the exchange rates on the dates of such transactions. The effects of changes in exchange rates on investment securities are included with the net realized gain or loss and net unrealized appreciation or depreciation on investments in the fund’s statement of operations. The realized gain or loss and unrealized appreciation or depreciation resulting from all other transactions denominated in currencies other than U.S. dollars are disclosed separately.
In-kind redemptions — The fund normally redeems shares in cash; however, under certain conditions and circumstances, payment of the redemption price wholly or partly with portfolio securities or other fund assets may be permitted. A redemption of shares in-kind is based upon the closing value of the shares being redeemed as of the trade date. Realized gains or losses resulting from redemptions of shares in-kind are reflected separately in the fund’s statement of operations.
3. Valuation
Capital Research and Management Company (“CRMC”), the fund’s investment adviser, values the fund’s investments at fair value as defined by U.S. GAAP. The net asset value per share is calculated once daily as of the close of regular trading on the New York Stock Exchange, normally 4 p.m. New York time, each day the New York Stock Exchange is open.
Methods and inputs — The fund’s investment adviser uses the following methods and inputs to establish the fair value of the fund’s assets and liabilities. Use of particular methods and inputs may vary over time based on availability and relevance as market and economic conditions evolve.
Equity securities are generally valued at the official closing price of, or the last reported sale price on, the exchange or market on which such securities are traded, as of the close of business on the day the securities are being valued or, lacking any sales, at the last available bid price. Prices for each security are taken from the principal exchange or market on which the security trades.
Fixed-income securities, including short-term securities, are generally valued at prices obtained from one or more pricing vendors. Vendors value such securities based on one or more of the inputs described in the following table. The table provides examples of inputs that are commonly relevant for valuing particular classes of fixed-income securities in which the fund is authorized to invest. However, these classifications are not exclusive, and any of the inputs may be used to value any other class of fixed-income security.
| Fixed-income class | | Examples of standard inputs |
| All | | Benchmark yields, transactions, bids, offers, quotations from dealers and trading systems, new issues, spreads and other relationships observed in the markets among comparable securities; and proprietary pricing models such as yield measures calculated using factors such as cash flows, financial or collateral performance and other reference data (collectively referred to as “standard inputs”) |
| Corporate bonds, notes & loans; convertible securities | | Standard inputs and underlying equity of the issuer |
| Bonds & notes of governments & government agencies | | Standard inputs and interest rate volatilities |
| Mortgage-backed; asset-backed obligations | | Standard inputs and cash flows, prepayment information, default rates, delinquency and loss assumptions, collateral characteristics, credit enhancements and specific deal information |
When the fund’s investment adviser deems it appropriate to do so (such as when vendor prices are unavailable or deemed to be not representative), fixed-income securities will be valued in good faith at the mean quoted bid and ask prices that are reasonably and timely available (or bid prices, if ask prices are not available) or at prices for securities of comparable maturity, quality and type.
Securities with both fixed-income and equity characteristics, or equity securities traded principally among fixed-income dealers, are generally valued in the manner described for either equity or fixed-income securities, depending on which method is deemed most appropriate by the fund’s investment adviser. The Capital Group Central Cash Fund (“CCF”), a fund within the Capital Group Central Fund Series (“Central Funds”), is valued based upon a floating net asset value, which fluctuates with changes in the value of CCF’s portfolio securities. The underlying securities are valued based on the policies and procedures in CCF’s statement of additional information.
| The Growth Fund of America | 21 |
Securities and other assets for which representative market quotations are not readily available or are considered unreliable by the fund’s investment adviser are fair valued as determined in good faith under fair valuation guidelines adopted by authority of the fund’s board of trustees as further described. The investment adviser follows fair valuation guidelines, consistent with U.S. Securities and Exchange Commission rules and guidance, to consider relevant principles and factors when making fair value determinations. The investment adviser considers relevant indications of value that are reasonably and timely available to it in determining the fair value to be assigned to a particular security, such as the type and cost of the security; contractual or legal restrictions on resale of the security; relevant financial or business developments of the issuer; actively traded similar or related securities; conversion or exchange rights on the security; related corporate actions; significant events occurring after the close of trading in the security; and changes in overall market conditions. In addition, the closing prices of equity securities that trade in markets outside U.S. time zones may be adjusted to reflect significant events that occur after the close of local trading but before the net asset value of each share class of the fund is determined. Fair valuations and valuations of investments that are not actively trading involve judgment and may differ materially from valuations that would have been used had greater market activity occurred.
Processes and structure — The fund’s board of trustees has delegated authority to the fund’s investment adviser to make fair value determinations, subject to board oversight. The investment adviser has established a Joint Fair Valuation Committee (the “Fair Valuation Committee”) to administer, implement and oversee the fair valuation process, and to make fair value decisions. The Fair Valuation Committee regularly reviews its own fair value decisions, as well as decisions made under its standing instructions to the investment adviser’s valuation teams. The Fair Valuation Committee reviews changes in fair value measurements from period to period and may, as deemed appropriate, update the fair valuation guidelines to better reflect the results of back testing and address new or evolving issues. The Fair Valuation Committee reports any changes to the fair valuation guidelines to the board of trustees. The fund’s board and audit committee also regularly review reports that describe fair value determinations and methods.
The fund’s investment adviser has also established a Fixed-Income Pricing Review Group to administer and oversee the fixed-income valuation process, including the use of fixed-income pricing vendors. This group regularly reviews pricing vendor information and market data. Pricing decisions, processes and controls over security valuation are also subject to additional internal reviews facilitated by the investment adviser’s global risk management group.
Classifications — The fund’s investment adviser classifies the fund’s assets and liabilities into three levels based on the inputs used to value the assets or liabilities. Level 1 values are based on quoted prices in active markets for identical securities. Level 2 values are based on significant observable market inputs, such as quoted prices for similar securities and quoted prices in inactive markets. Certain securities trading outside the U.S. may transfer between Level 1 and Level 2 due to valuation adjustments resulting from significant market movements following the close of local trading. Level 3 values are based on significant unobservable inputs that reflect the investment adviser’s determination of assumptions that market participants might reasonably use in valuing the securities. The valuation levels are not necessarily an indication of the risk or liquidity associated with the underlying investment. For example, U.S. government securities are reflected as Level 2 because the inputs used to determine fair value may not always be quoted prices in an active market. The following table presents the fund’s valuation levels as of August 31, 2022 (dollars in thousands):
| | | Investment securities |
| | | Level 1 | | | Level 2 | | | Level 3 | | | Total | |
| Assets: | | | | | | | | | | | | | | | | |
| Common stocks: | | | | | | | | | | | | | | | | |
| Consumer discretionary | | $ | 45,075,914 | | | $ | 3,052,506 | | | $ | — | | | $ | 48,128,420 | |
| Information technology | | | 41,063,820 | | | | 3,541,324 | | | | 32,287 | | | | 44,637,431 | |
| Health care | | | 30,131,020 | | | | 539,882 | | | | 127,563 | | | | 30,798,465 | |
| Communication services | | | 21,726,862 | | | | 33,656 | | | | 61,853 | | | | 21,822,371 | |
| Industrials | | | 15,401,738 | | | | 1,336,893 | | | | — | | | | 16,738,631 | |
| Financials | | | 13,437,160 | | | | 300,550 | | | | — | | | | 13,737,710 | |
| Energy | | | 9,836,525 | | | | — | | | | — | | | | 9,836,525 | |
| Consumer staples | | | 3,891,733 | | | | 961,829 | | | | 3,925 | | | | 4,857,487 | |
| Materials | | | 4,229,283 | | | | 363,177 | | | | — | | | | 4,592,460 | |
| Utilities | | | 1,710,633 | | | | — | | | | — | | | | 1,710,633 | |
| Real estate | | | 344,761 | | | | — | | | | — | | | | 344,761 | |
| Preferred securities | | | 448,951 | | | | 55,397 | | | | 369,357 | | | | 873,705 | |
| Rights & warrants | | | 14,636 | | | | — | | | | — | | | | 14,636 | |
| Convertible stocks | | | 38,919 | | | | — | | | | — | | | | 38,919 | |
| Convertible bonds & notes | | | — | | | | 15,513 | | | | 9,562 | | | | 25,075 | |
| Short-term securities | | | 15,378,855 | | | | — | | | | — | | | | 15,378,855 | |
| Total | | $ | 202,730,810 | | | $ | 10,200,727 | | | $ | 604,547 | | | $ | 213,536,084 | |
| 22 | The Growth Fund of America |
4. Risk factors
Investing in the fund may involve certain risks including, but not limited to, those described below.
Market conditions — The prices of, and the income generated by, the common stocks and other securities held by the fund may decline — sometimes rapidly or unpredictably — due to various factors, including events or conditions affecting the general economy or particular industries or companies; overall market changes; local, regional or global political, social or economic instability; governmental, governmental agency or central bank responses to economic conditions; and currency exchange rate, interest rate and commodity price fluctuations.
Economies and financial markets throughout the world are highly interconnected. Economic, financial or political events, trading and tariff arrangements, wars, terrorism, cybersecurity events, natural disasters, public health emergencies (such as the spread of infectious disease) and other circumstances in one country or region, including actions taken by governmental or quasi-governmental authorities in response to any of the foregoing, could have impacts on global economies or markets. As a result, whether or not the fund invests in securities of issuers located in or with significant exposure to the countries affected, the value and liquidity of the fund’s investments may be negatively affected by developments in other countries and regions.
Issuer risks — The prices of, and the income generated by, securities held by the fund may decline in response to various factors directly related to the issuers of such securities, including reduced demand for an issuer’s goods or services, poor management performance, major litigation, investigations or other controversies related to the issuer, changes in financial condition or credit rating, changes in government regulations affecting the issuer or its competitive environment and strategic initiatives such as mergers, acquisitions or dispositions and the market response to any such initiatives.
Investing in growth-oriented stocks — Growth-oriented common stocks and other equity-type securities (such as preferred stocks, convertible preferred stocks and convertible bonds) may involve larger price swings and greater potential for loss than other types of investments.
Investing outside the U.S. — Securities of issuers domiciled outside the U.S., or with significant operations or revenues outside the U.S., may lose value because of adverse political, social, economic or market developments (including social instability, regional conflicts, terrorism and war) in the countries or regions in which the issuers operate or generate revenue. These securities may also lose value due to changes in foreign currency exchange rates against the U.S. dollar and/or currencies of other countries. Issuers of these securities may be more susceptible to actions of foreign governments, such as nationalization, currency blockage or the imposition of price controls, sanctions, or punitive taxes, each of which could adversely impact the value of these securities. Securities markets in certain countries may be more volatile and/or less liquid than those in the U.S. Investments outside the U.S. may also be subject to different regulatory, legal, accounting, auditing, financial reporting and recordkeeping requirements, and may be more difficult to value, than those in the U.S. In addition, the value of investments outside the U.S. may be reduced by foreign taxes, including foreign withholding taxes on interest and dividends. Further, there may be increased risks of delayed settlement of securities purchased or sold by the fund, which could impact the liquidity of the fund’s portfolio. The risks of investing outside the U.S. may be heightened in connection with investments in emerging markets.
Management — The investment adviser to the fund actively manages the fund’s investments. Consequently, the fund is subject to the risk that the methods and analyses, including models, tools and data, employed by the investment adviser in this process may be flawed or incorrect and may not produce the desired results. This could cause the fund to lose value or its investment results to lag relevant benchmarks or other funds with similar objectives.
5. Certain investment techniques
Securities lending — The fund has entered into securities lending transactions in which the fund earns income by lending investment securities to brokers, dealers or other institutions. Each transaction involves three parties: the fund, acting as the lender of the securities, a borrower, and a lending agent that acts as an intermediary.
| The Growth Fund of America | 23 |
Securities lending transactions are entered into by the fund under a securities lending agent agreement with the lending agent. The lending agent facilitates the exchange of securities between the fund and approved borrowers, ensures that securities loans are properly coordinated and documented, marks-to-market the value of collateral daily, secures additional collateral from a borrower if it falls below preset terms, and may reinvest cash collateral on behalf of the fund according to agreed parameters. The lending agent provides indemnification to the fund against losses resulting from a borrower default. Although risk is mitigated by the collateral and indemnification, the fund could experience a delay in recovering its securities and a potential loss of income or value if a borrower fails to return securities, collateral investments decline in value or the lending agent fails to perform.
The borrower is required to post highly liquid assets, such as cash or U.S. government securities, as collateral for the loan in an amount at least equal to the value of the securities loaned. Investments made with cash collateral are recognized as assets in the fund’s investment portfolio. The same amount is recorded as a liability in the fund’s statement of assets and liabilities. While securities are on loan, the fund will continue to receive the equivalent of the interest, dividends or other distributions paid by the issuer, as well as a portion of the interest on the investment of the collateral. Additionally, although the fund does not have the right to vote on securities while they are on loan, the fund has a right to consent on corporate actions and a right to recall loaned securities to vote. A borrower is obligated to return loaned securities at the conclusion of a loan or, during the pendency of a loan, on demand from the fund.
As of August 31, 2022, the total value of securities on loan was $589,812,000, and the total value of collateral received was $609,383,000, which consisted entirely of cash. Investment securities purchased from cash collateral are disclosed in the fund’s investment portfolio as short-term securities. Securities received as collateral, if any, are not recognized as fund assets. The contractual maturity of cash collateral received under the securities lending agreement is classified as overnight and continuous.
6. Taxation and distributions
Federal income taxation — The fund complies with the requirements under Subchapter M of the Internal Revenue Code applicable to regulated investment companies and intends to distribute substantially all of its net taxable income and net capital gains each year. The fund is not subject to income taxes to the extent such distributions are made. Therefore, no federal income tax provision is required.
As of and during the year ended August 31, 2022, the fund did not have a liability for any unrecognized tax benefits. The fund recognizes interest and penalties, if any, related to unrecognized tax benefits as income tax expense in the statement of operations. During the period, the fund did not incur any significant interest or penalties.
The fund’s tax returns are generally not subject to examination by federal, state and, if applicable, non-U.S. tax authorities after the expiration of each jurisdiction’s statute of limitations, which is typically three years after the date of filing but can be extended in certain jurisdictions.
Non-U.S. taxation — Dividend and interest income are recorded net of non-U.S. taxes paid. The fund may file withholding tax reclaims in certain jurisdictions to recover a portion of amounts previously withheld. As a result of rulings from European courts, the fund filed for additional reclaims related to prior years. These reclaims are recorded when the amount is known and there are no significant uncertainties on collectability. During the year ended August 31, 2022, the fund recognized $9,101,000 in reclaims (net of $249,000 in fees and the effect of realized gain or loss from currency translations) and $1,219,000 in interest related to European court rulings, which is included in dividend income and interest income, respectively, in the fund’s statement of operations. Gains realized by the fund on the sale of securities in certain countries, if any, may be subject to non-U.S. taxes. If applicable, the fund records an estimated deferred tax liability based on unrealized gains to provide for potential non-U.S. taxes payable upon the sale of these securities.
Distributions — Distributions determined on a tax basis may differ from net investment income and net realized gains for financial reporting purposes. These differences are due primarily to different treatment for items such as currency gains and losses; short-term capital gains and losses; capital losses related to sales of certain securities within 30 days of purchase and unrealized appreciation of certain investments in securities outside the U.S.. The fiscal year in which amounts are distributed may differ from the year in which the net investment income and net realized gains are recorded by the fund for financial reporting purposes. The fund may also designate a portion of the amount paid to redeeming shareholders as a distribution for tax purposes.
During the year ended August 31, 2022, the fund reclassified $983,689,000 from total distributable earnings to capital paid in on shares of beneficial interest to align financial reporting with tax reporting.
| 24 | The Growth Fund of America |
As of August 31, 2022, the tax basis components of distributable earnings, unrealized appreciation (depreciation) and cost of investments were as follows (dollars in thousands):
| Undistributed ordinary income | | $ | 622,728 | |
| Undistributed long-term capital gains | | | 7,024,949 | |
| Post-October capital loss deferral1 | | | (500,000 | ) |
| Gross unrealized appreciation on investments | | | 97,700,121 | |
| Gross unrealized depreciation on investments | | | (7,893,813 | ) |
| Net unrealized appreciation on investments | | | 89,806,308 | |
| Cost of investments | | | 123,729,776 | |
| 1 | This deferral is considered incurred in the subsequent year. |
Distributions paid were characterized for tax purposes as follows (dollars in thousands):
| | | Year ended August 31, 2022 | | | Year ended August 31, 2021 | |
| Share class | | Ordinary
income | | | Long-term
capital gains | | | Total
distributions
paid | | | Ordinary
income | | | Long-term
capital gains | | | Total
distributions
paid | |
| Class A | | $ | 117,403 | | | $ | 10,926,184 | | | $ | 11,043,587 | | | $ | 304,861 | | | $ | 4,904,093 | | | $ | 5,208,954 | |
| Class C | | | — | | | | 402,119 | | | | 402,119 | | | | — | | | | 192,825 | | | | 192,825 | |
| Class T | | | — | 2 | | | 1 | | | | 1 | | | | — | 2 | | | 1 | | | | 1 | |
| Class F-1 | | | — | | | | 584,336 | | | | 584,336 | | | | 16,567 | | | | 345,610 | | | | 362,177 | |
| Class F-2 | | | 104,867 | | | | 2,871,495 | | | | 2,976,362 | | | | 137,236 | | | | 1,255,271 | | | | 1,392,507 | |
| Class F-3 | | | 44,237 | | | | 893,053 | | | | 937,290 | | | | 46,777 | | | | 359,773 | | | | 406,550 | |
| Class 529-A | | | 7,149 | | | | 1,116,228 | | | | 1,123,377 | | | | 28,863 | | | | 508,035 | | | | 536,898 | |
| Class 529-C | | | — | | | | 44,516 | | | | 44,516 | | | | — | | | | 24,057 | | | | 24,057 | |
| Class 529-E | | | — | | | | 34,628 | | | | 34,628 | | | | 95 | | | | 16,165 | | | | 16,260 | |
| Class 529-T | | | — | 2 | | | 2 | | | | 2 | | | | — | 2 | | | 1 | | | | 1 | |
| Class 529-F-1 | | | — | 2 | | | 1 | | | | 1 | | | | — | 2 | | | — | 2 | | | — | 2 |
| Class 529-F-23 | | | 2,551 | | | | 73,501 | | | | 76,052 | | | | 2,999 | | | | 28,706 | | | | 31,705 | |
| Class 529-F-33 | | | — | 2 | | | 2 | | | | 2 | | | | — | 2 | | | 1 | | | | 1 | |
| Class R-1 | | | — | | | | 32,247 | | | | 32,247 | | | | — | | | | 16,878 | | | | 16,878 | |
| Class R-2 | | | — | | | | 213,900 | | | | 213,900 | | | | — | | | | 104,061 | | | | 104,061 | |
| Class R-2E | | | — | | | | 20,959 | | | | 20,959 | | | | — | | | | 10,945 | | | | 10,945 | |
| Class R-3 | | | — | | | | 470,734 | | | | 470,734 | | | | — | | | | 242,632 | | | | 242,632 | |
| Class R-4 | | | 1,862 | | | | 585,697 | | | | 587,559 | | | | 16,117 | | | | 301,902 | | | | 318,019 | |
| Class R-5E | | | 3,590 | | | | 105,116 | | | | 108,706 | | | | 3,890 | | | | 39,407 | | | | 43,297 | |
| Class R-5 | | | 6,838 | | | | 164,562 | | | | 171,400 | | | | 13,117 | | | | 109,944 | | | | 123,061 | |
| Class R-6 | | | 172,699 | | | | 3,497,000 | | | | 3,669,699 | | | | 207,814 | | | | 1,593,862 | | | | 1,801,676 | |
| Total | | $ | 461,196 | | | $ | 22,036,281 | | | $ | 22,497,477 | | | $ | 778,336 | | | $ | 10,054,169 | | | $ | 10,832,505 | |
| | |
| 2 | Amount less than one thousand. |
| 3 | Class 529-F-2 and 529-F-3 shares began investment operations on October 30, 2020. |
7. Fees and transactions with related parties
CRMC, the fund’s investment adviser, is the parent company of American Funds Distributors®, Inc. (“AFD”), the principal underwriter of the fund’s shares, and American Funds Service Company® (“AFS”), the fund’s transfer agent. CRMC, AFD and AFS are considered related parties to the fund.
Investment advisory services — The fund has an investment advisory and service agreement with CRMC that provides for monthly fees accrued daily. At the beginning of the year, these fees were based on a series of decreasing annual rates beginning with 0.500% on the first $1 billion of daily net assets and decreasing to 0.233% on such assets in excess of $210 billion. On September 14, 2021, the fund’s board of trustees approved an amended investment advisory and service agreement effective December 1, 2021, decreasing the annual rate to 0.231% and 0.229% on daily net assets in excess of $233 billion and $269 billion, respectively. CRMC waived investment advisory services fees of $426,000 in advance of the amended investment advisory agreement. CRMC does not intend to recoup this waiver. As a result, the fees shown on the fund’s statement of operations of $656,611,000, which were equivalent to an annualized rate of 0.258% of average daily net assets, were reduced to $656,185,000, which were equivalent to an annualized rate of 0.257% of average daily net assets.
| The Growth Fund of America | 25 |
Class-specific fees and expenses — Expenses that are specific to individual share classes are accrued directly to the respective share class. The principal class-specific fees and expenses are further described below:
Distribution services — The fund has plans of distribution for all share classes, except Class F-2, F-3, 529-F-2, 529-F-3, R-5E, R-5 and R-6 shares. Under the plans, the board of trustees approves certain categories of expenses that are used to finance activities primarily intended to sell fund shares and service existing accounts. The plans provide for payments, based on an annualized percentage of average daily net assets, ranging from 0.25% to 1.00% as noted in this section. In some cases, the board of trustees has limited the amounts that may be paid to less than the maximum allowed by the plans. All share classes with a plan may use up to 0.25% of average daily net assets to pay service fees, or to compensate AFD for paying service fees, to firms that have entered into agreements with AFD to provide certain shareholder services. The remaining amounts available to be paid under each plan are paid to dealers to compensate them for their sales activities.
| Share class | | Currently approved limits | | Plan limits | |
| Class A | | | 0.25 | % | | | 0.25 | % | |
| Class 529-A | | | 0.25 | | | | 0.50 | | |
| Classes C, 529-C and R-1 | | | 1.00 | | | | 1.00 | | |
| Class R-2 | | | 0.75 | | | | 1.00 | | |
| Class R-2E | | | 0.60 | | | | 0.85 | | |
| Classes 529-E and R-3 | | | 0.50 | | | | 0.75 | | |
| Classes T, F-1, 529-T, 529-F-1 and R-4 | | | 0.25 | | | | 0.50 | | |
For Class A and 529-A shares, distribution-related expenses include the reimbursement of dealer and wholesaler commissions paid by AFD for certain shares sold without a sales charge. These share classes reimburse AFD for amounts billed within the prior 15 months but only to the extent that the overall annual expense limits are not exceeded. As of August 31, 2022, there were no unreimbursed expenses subject to reimbursement for Class A or 529-A shares.
Transfer agent services — The fund has a shareholder services agreement with AFS under which the fund compensates AFS for providing transfer agent services to each of the fund’s share classes. These services include recordkeeping, shareholder communications and transaction processing. In addition, the fund reimburses AFS for amounts paid to third parties for performing transfer agent services on behalf of fund shareholders.
Administrative services — The fund has an administrative services agreement with CRMC under which the fund compensates CRMC for providing administrative services to all share classes. Administrative services are provided by CRMC and its affiliates to help assist third parties providing non-distribution services to fund shareholders. These services include providing in-depth information on the fund and market developments that impact fund investments. Administrative services also include, but are not limited to, coordinating, monitoring and overseeing third parties that provide services to fund shareholders. The agreement provides the fund the ability to charge an administrative services fee at the annual rate of 0.05% of the average daily net assets attributable to each share class of the fund. Currently the fund pays CRMC an administrative services fee at the annual rate of 0.03% of the average daily net assets attributable to each share class of the fund for CRMC’s provision of administrative services.
529 plan services — Each 529 share class is subject to service fees to compensate the Virginia College Savings Plan (“Virginia529”) for its oversight and administration of the CollegeAmerica 529 college savings plan. The fees are based on the combined net assets invested in Class 529 and ABLE shares of the American Funds. Class ABLE shares are offered on other American Funds by Virginia529 through ABLEAmerica®, a tax-advantaged savings program for individuals with disabilities. Virginia529 is not considered a related party to the fund.
Prior to January 1, 2022, the quarterly fees were based on a series of decreasing annual rates beginning with 0.09% on the first $20 billion of the combined net assets invested in the American Funds and decreasing to 0.03% on such assets in excess of $100 billion. Effective January 1, 2022, the quarterly fees were amended to a series of decreasing annual rates beginning with 0.09% on the first $20 billion of the combined net assets invested in the American Funds and decreasing to 0.03% on such assets in excess of $75 billion. The fees for any given calendar quarter are accrued and calculated on the basis of the average net assets of Class 529 and ABLE shares of the American Funds for the last month of the prior calendar quarter. For the year ended August 31, 2022, the 529 plan services fees were $8,350,000, which were equivalent to 0.058% of the average daily net assets of each 529 share class.
| 26 | The Growth Fund of America |
For the year ended August 31, 2022, class-specific expenses under the agreements were as follows (dollars in thousands):
| | Share class | | Distribution
services | | Transfer agent
services | | Administrative
services | | 529 plan
services | |
| | Class A | | $308,469 | | $ 85,956 | | $37,816 | | Not applicable | |
| | Class C | | 40,984 | | 2,773 | | 1,231 | | Not applicable | |
| | Class T | | — | | — | * | — | * | Not applicable | |
| | Class F-1 | | 16,458 | | 8,116 | | 1,982 | | Not applicable | |
| | Class F-2 | | Not applicable | | 36,154 | | 10,018 | | Not applicable | |
| | Class F-3 | | Not applicable | | 121 | | 3,131 | | Not applicable | |
| | Class 529-A | | 28,737 | | 7,899 | | 3,828 | | $7,363 | |
| | Class 529-C | | 4,494 | | 281 | | 135 | | 261 | |
| | Class 529-E | | 1,912 | | 137 | | 115 | | 221 | |
| | Class 529-T | | — | | — | * | — | * | — | * |
| | Class 529-F-1 | | — | | — | * | — | * | — | * |
| | Class 529-F-2 | | Not applicable | | 420 | | 263 | | 505 | |
| | Class 529-F-3 | | Not applicable | | — | * | — | * | — | * |
| | Class R-1 | | 3,348 | | 316 | | 101 | | Not applicable | |
| | Class R-2 | | 16,836 | | 7,947 | | 673 | | Not applicable | |
| | Class R-2E | | 1,437 | | 496 | | 72 | | Not applicable | |
| | Class R-3 | | 25,925 | | 7,934 | | 1,559 | | Not applicable | |
| | Class R-4 | | 16,463 | | 6,788 | | 1,977 | | Not applicable | |
| | Class R-5E | | Not applicable | | 1,828 | | 355 | | Not applicable | |
| | Class R-5 | | Not applicable | | 942 | | 561 | | Not applicable | |
| | Class R-6 | | Not applicable | | 486 | | 12,640 | | Not applicable | |
| | Total class-specific expenses | | $465,063 | | $168,594 | | $76,457 | | $8,350 | |
| | * | Amount less than one thousand. |
Trustees’ deferred compensation — Trustees who are unaffiliated with CRMC may elect to defer the cash payment of part or all of their compensation. These deferred amounts, which remain as liabilities of the fund, are treated as if invested in shares of the fund or other American Funds. These amounts represent general, unsecured liabilities of the fund and vary according to the total returns of the selected funds. Trustees’ compensation of $(177,000) in the fund’s statement of operations reflects $1,035,000 in current fees (either paid in cash or deferred) and a net decrease of $1,212,000 in the value of the deferred amounts.
Affiliated officers and trustees — Officers and certain trustees of the fund are or may be considered to be affiliated with CRMC, AFD and AFS. No affiliated officers or trustees received any compensation directly from the fund.
Investment in CCF — The fund holds shares of CCF, an institutional prime money market fund managed by CRMC. CCF invests in high-quality, short-term money market instruments. CCF is used as the primary investment vehicle for the fund’s short-term instruments. CCF shares are only available for purchase by CRMC, its affiliates, and other funds managed by CRMC or its affiliates, and are not available to the public. CRMC does not receive an investment advisory services fee from CCF.
Security transactions with related funds — The fund purchased investment securities from, and sold investment securities to, other funds managed by CRMC (or funds managed by certain affiliates of CRMC) under procedures adopted by the fund’s board of trustees. The funds involved in such transactions are considered related by virtue of having a common investment adviser (or affiliated investment advisers), common trustees and/or common officers. Each transaction was executed at the current market price of the security and no brokerage commissions or fees were paid in accordance with Rule 17a-7 of the 1940 Act. During the year ended August 31, 2022, the fund engaged in such purchase and sale transactions with related funds in the amounts of $1,903,777,000 and $2,232,149,000, respectively, which generated $316,261,000 of net realized losses from such sales.
Interfund lending — Pursuant to an exemptive order issued by the SEC, the fund, along with other CRMC-managed funds (or funds managed by certain affiliates of CRMC), may participate in an interfund lending program. The program provides an alternate credit facility that permits the funds to lend or borrow cash for temporary purposes directly to or from one another, subject to the conditions of the exemptive order. The fund did not lend or borrow cash through the interfund lending program at any time during the year ended August 31, 2022.
| The Growth Fund of America | 27 |
8. Indemnifications
The fund’s organizational documents provide board members and officers with indemnification against certain liabilities or expenses in connection with the performance of their duties to the fund. In the normal course of business, the fund may also enter into contracts that provide general indemnifications. The fund’s maximum exposure under these arrangements is unknown since it is dependent on future claims that may be made against the fund. The risk of material loss from such claims is considered remote. Insurance policies are also available to the fund’s board members and officers.
9. Capital share transactions
Capital share transactions in the fund were as follows (dollars and shares in thousands):
| | | Sales1 | | | Reinvestments of
distributions | | | Repurchases1 | | | Net increase
(decrease) | |
| Share class | | Amount | | | Shares | | | Amount | | | Shares | | | Amount | | | Shares | | | Amount | | | Shares | |
| | | | | | | | | | | | | | | | | | | | | | | | | |
| Year ended August 31, 2022 | | | | | | | | | | | | | | | | | | | | | | | |
| | | | | | | | | | | | | | | | | | | | | | | | | | | | | | | | | |
| Class A | | $ | 7,931,916 | | | | 119,722 | | | $ | 10,873,579 | | | | 151,675 | | | $ | (13,791,528 | ) | | | (208,423 | ) | | $ | 5,013,967 | | | | 62,974 | |
| Class C | | | 558,949 | | | | 9,396 | | | | 400,408 | | | | 6,281 | | | | (1,042,813 | ) | | | (17,774 | ) | | | (83,456 | ) | | | (2,097 | ) |
| Class T | | | — | | | | — | | | | — | | | | — | | | | — | | | | — | | | | — | | | | — | |
| Class F-1 | | | 294,307 | | | | 4,518 | | | | 577,145 | | | | 8,116 | | | | (961,859 | ) | | | (14,675 | ) | | | (90,407 | ) | | | (2,041 | ) |
| Class F-2 | | | 6,462,785 | | | | 99,632 | | | | 2,887,906 | | | | 40,419 | | | | (6,492,079 | ) | | | (99,208 | ) | | | 2,858,612 | | | | 40,843 | |
| Class F-3 | | | 2,242,510 | | | | 34,125 | | | | 917,116 | | | | 12,795 | | | | (2,113,197 | ) | | | (32,395 | ) | | | 1,046,429 | | | | 14,525 | |
| Class 529-A | | | 1,099,601 | | | | 16,704 | | | | 1,123,163 | | | | 15,893 | | | | (1,652,825 | ) | | | (25,504 | ) | | | 569,939 | | | | 7,093 | |
| Class 529-C | | | 76,381 | | | | 1,279 | | | | 44,506 | | | | 696 | | | | (176,890 | ) | | | (2,959 | ) | | | (56,003 | ) | | | (984 | ) |
| Class 529-E | | | 31,790 | | | | 491 | | | | 34,622 | | | | 497 | | | | (67,091 | ) | | | (1,032 | ) | | | (679 | ) | | | (44 | ) |
| Class 529-T | | | — | | | | — | | | | 2 | | | | — | 2 | | | — | | | | — | | | | 2 | | | | — | 2 |
| Class 529-F-1 | | | — | | | | — | | | | 1 | | | | — | 2 | | | — | | | | — | | | | 1 | | | | — | 2 |
| Class 529-F-2 | | | 192,971 | | | | 2,872 | | | | 76,051 | | | | 1,063 | | | | (119,065 | ) | | | (1,793 | ) | | | 149,957 | | | | 2,142 | |
| Class 529-F-3 | | | 5 | | | | 1 | | | | 3 | | | | — | 2 | | | — | | | | — | | | | 8 | | | | 1 | |
| Class R-1 | | | 36,889 | | | | 631 | | | | 32,161 | | | | 494 | | | | (79,389 | ) | | | (1,304 | ) | | | (10,339 | ) | | | (179 | ) |
| Class R-2 | | | 374,844 | | | | 6,165 | | | | 213,765 | | | | 3,242 | | | | (640,689 | ) | | | (10,337 | ) | | | (52,080 | ) | | | (930 | ) |
| Class R-2E | | | 48,203 | | | | 754 | | | | 20,959 | | | | 301 | | | | (87,466 | ) | | | (1,304 | ) | | | (18,304 | ) | | | (249 | ) |
| Class R-3 | | | 629,419 | | | | 9,779 | | | | 469,220 | | | | 6,724 | | | | (1,374,003 | ) | | | (21,011 | ) | | | (275,364 | ) | | | (4,508 | ) |
| Class R-4 | | | 680,931 | | | | 10,203 | | | | 587,218 | | | | 8,283 | | | | (1,726,459 | ) | | | (26,532 | ) | | | (458,310 | ) | | | (8,046 | ) |
| Class R-5E | | | 255,735 | | | | 3,884 | | | | 108,703 | | | | 1,534 | | | | (292,506 | ) | | | (4,359 | ) | | | 71,932 | | | | 1,059 | |
| Class R-5 | | | 193,049 | | | | 2,954 | | | | 170,439 | | | | 2,379 | | | | (571,803 | ) | | | (8,515 | ) | | | (208,315 | ) | | | (3,182 | ) |
| Class R-6 | | | 6,934,436 | | | | 107,058 | | | | 3,656,418 | | | | 50,967 | | | | (6,240,113 | ) | | | (93,876 | ) | | | 4,350,741 | | | | 64,149 | |
| Total net increase (decrease) | | $ | 28,044,721 | | | | 430,168 | | | $ | 22,193,385 | | | | 311,359 | | | $ | (37,429,775 | ) | | | (571,001 | ) | | $ | 12,808,331 | | | | 170,526 | |
Refer to the end of the table for footnotes.
| 28 | The Growth Fund of America |
| | | Sales1 | | | Reinvestments of
distributions | | | Repurchases1 | | | Net increase
(decrease) | |
| Share class | | Amount | | | Shares | | | Amount | | | Shares | | | Amount | | | Shares | | | Amount | | | Shares | |
| | | | | | | | | | | | | | | | | | | | | | | | | |
| Year ended August 31, 2021 | | | | | | | | | | | | | | | | | | | | | | | |
| | | | | | | | | | | | | | | | | | | | | | | | | | | | | | | | | |
| Class A | | $ | 10,931,972 | | | | 157,620 | | | $ | 5,138,087 | | | | 76,517 | | | $ | (14,527,129 | ) | | | (211,223 | ) | | $ | 1,542,930 | | | | 22,914 | |
| Class C | | | 729,156 | | | | 11,719 | | | | 191,952 | | | | 3,163 | | | | (1,153,841 | ) | | | (18,510 | ) | | | (232,733 | ) | | | (3,628 | ) |
| Class T | | | — | | | | — | | | | — | | | | — | | | | — | | | | — | | | | — | | | | — | |
| Class F-1 | | | 350,882 | | | | 5,124 | | | | 352,860 | | | | 5,295 | | | | (2,912,604 | ) | | | (41,558 | ) | | | (2,208,862 | ) | | | (31,139 | ) |
| Class F-2 | | | 6,830,576 | | | | 99,492 | | | | 1,349,189 | | | | 20,155 | | | | (6,620,287 | ) | | | (95,926 | ) | | | 1,559,478 | | | | 23,721 | |
| Class F-3 | | | 2,725,827 | | | | 39,370 | | | | 396,528 | | | | 5,907 | | | | (1,834,872 | ) | | | (26,538 | ) | | | 1,287,483 | | | | 18,739 | |
| Class 529-A | | | 1,253,180 | | | | 18,385 | | | | 536,742 | | | | 8,099 | | | | (1,841,086 | ) | | | (26,793 | ) | | | (51,164 | ) | | | (309 | ) |
| Class 529-C | | | 98,004 | | | | 1,570 | | | | 24,051 | | | | 395 | | | | (218,725 | ) | | | (3,491 | ) | | | (96,670 | ) | | | (1,526 | ) |
| Class 529-E | | | 37,758 | | | | 561 | | | | 16,253 | | | | 248 | | | | (67,174 | ) | | | (992 | ) | | | (13,163 | ) | | | (183 | ) |
| Class 529-T | | | — | | | | — | | | | 1 | | | | — | 2 | | | — | | | | — | | | | 1 | | | | — | 2 |
| Class 529-F-1 | | | 30,383 | | | | 501 | | | | 1 | | | | — | 2 | | | (631,766 | ) | | | (10,818 | ) | | | (601,382 | ) | | | (10,317 | ) |
| Class 529-F-23 | | | 789,112 | | | | 12,840 | | | | 31,702 | | | | 473 | | | | (101,080 | ) | | | (1,425 | ) | | | 719,734 | | | | 11,888 | |
| Class 529-F-33 | | | 25 | | | | — | 2 | | | 1 | | | | — | 2 | | | — | | | | — | | | | 26 | | | | — | 2 |
| Class R-1 | | | 38,083 | | | | 601 | | | | 16,839 | | | | 272 | | | | (121,311 | ) | | | (1,925 | ) | | | (66,389 | ) | | | (1,052 | ) |
| Class R-2 | | | 447,511 | | | | 6,974 | | | | 103,990 | | | | 1,661 | | | | (730,181 | ) | | | (11,456 | ) | | | (178,680 | ) | | | (2,821 | ) |
| Class R-2E | | | 57,547 | | | | 863 | | | | 10,945 | | | | 167 | | | | (87,538 | ) | | | (1,299 | ) | | | (19,046 | ) | | | (269 | ) |
| Class R-3 | | | 801,605 | | | | 11,943 | | | | 241,925 | | | | 3,684 | | | | (1,876,463 | ) | | | (27,989 | ) | | | (832,933 | ) | | | (12,362 | ) |
| Class R-4 | | | 812,301 | | | | 11,977 | | | | 317,854 | | | | 4,784 | | | | (2,276,190 | ) | | | (33,609 | ) | | | (1,146,035 | ) | | | (16,848 | ) |
| Class R-5E | | | 713,621 | | | | 10,238 | | | | 43,297 | | | | 651 | | | | (633,621 | ) | | | (9,482 | ) | | | 123,297 | | | | 1,407 | |
| Class R-5 | | | 354,275 | | | | 5,178 | | | | 122,054 | | | | 1,820 | | | | (1,407,454 | ) | | | (20,367 | ) | | | (931,125 | ) | | | (13,369 | ) |
| Class R-6 | | | 7,105,757 | | | | 102,071 | | | | 1,794,629 | | | | 26,714 | | | | (9,870,436 | ) | | | (143,501 | ) | | | (970,050 | ) | | | (14,716 | ) |
| Total net increase (decrease) | | $ | 34,107,575 | | | | 497,027 | | | $ | 10,688,900 | | | | 160,005 | | | $ | (46,911,758 | ) | | | (686,902 | ) | | $ | (2,115,283 | ) | | | (29,870 | ) |
| 1 | Includes exchanges between share classes of the fund. |
| 2 | Amount less than one thousand. |
| 3 | Class 529-F-2 and 529-F-3 shares began investment operations on October 30, 2020. |
10. Investment transactions
The fund engaged in purchases and sales of investment securities, excluding short-term securities and U.S. government obligations, if any, of $71,967,280,000 and $87,561,956,000, respectively, during the year ended August 31, 2022.
| The Growth Fund of America | 29 |
Financial highlights
| | | | | | (Loss) income from
investment operations1 | | | Dividends and distributions | | | | | | | | | | | | | | | | | | | |
| Year ended | | Net asset
value,
beginning
of year | | | Net
investment
income
(loss) | | | Net (losses)
gains on
securities
(both
realized and
unrealized) | | | Total from
investment
operations | | | Dividends
(from net
investment
income) | | | Distributions
(from capital
gains) | | | Total
dividends
and
distributions | | | Net asset
value,
end
of year | | | Total return2,3 | | | Net assets,
end of
year
(in millions) | | | Ratio of
expenses to
average net
assets before
reimburse-
ments4 | | | Ratio of
expenses to
average net
assets after
reimburse-
ments3,4 | | | Ratio of
net income
(loss)
to average
net assets3 | |
| Class A: | | | | | | | | | | | | | | | | | | | | | | | | | | | | | | | | | | | | | | | | | | | | | | | | | | | | |
| 8/31/2022 | | $ | 78.42 | | | $ | .15 | | | $ | (17.40 | ) | | $ | (17.25 | ) | | $ | (.06 | ) | | $ | (6.01 | ) | | $ | (6.07 | ) | | $ | 55.10 | | | | (23.78 | )% | | $ | 104,664 | | | | .60 | % | | | .60 | % | | | .23 | % |
| 8/31/2021 | | | 63.18 | | | | .05 | | | | 18.10 | | | | 18.15 | | | | (.17 | ) | | | (2.74 | ) | | | (2.91 | ) | | | 78.42 | | | | 29.49 | | | | 144,012 | | | | .61 | | | | .61 | | | | .07 | |
| 8/31/2020 | | | 49.39 | | | | .22 | | | | 17.23 | | | | 17.45 | | | | (.38 | ) | | | (3.28 | ) | | | (3.66 | ) | | | 63.18 | | | | 37.07 | | | | 114,585 | | | | .64 | | | | .64 | | | | .42 | |
| 8/31/2019 | | | 56.31 | | | | .30 | | | | (2.09 | ) | | | (1.79 | ) | | | (.31 | ) | | | (4.82 | ) | | | (5.13 | ) | | | 49.39 | | | | (1.31 | ) | | | 87,316 | | | | .63 | | | | .63 | | | | .61 | |
| 8/31/2018 | | | 48.81 | | | | .28 | | | | 10.70 | | | | 10.98 | | | | (.25 | ) | | | (3.23 | ) | | | (3.48 | ) | | | 56.31 | | | | 23.49 | | | | 93,649 | | | | .62 | | | | .62 | | | | .53 | |
| Class C: | | | | | | | | | | | | | | | | | | | | | | | | | | | | | | | | | | | | | | | | | | | | | | | | | | | | |
| 8/31/2022 | | | 70.50 | | | | (.32 | ) | | | (15.44 | ) | | | (15.76 | ) | | | — | | | | (6.01 | ) | | | (6.01 | ) | | | 48.73 | | | | (24.36 | ) | | | 3,252 | | | | 1.36 | | | | 1.36 | | | | (.53 | ) |
| 8/31/2021 | | | 57.32 | | | | (.42 | ) | | | 16.34 | | | | 15.92 | | | | — | | | | (2.74 | ) | | | (2.74 | ) | | | 70.50 | | | | 28.54 | | | | 4,852 | | | | 1.35 | | | | 1.35 | | | | (.68 | ) |
| 8/31/2020 | | | 45.09 | | | | (.14 | ) | | | 15.65 | | | | 15.51 | | | | — | 5 | | | (3.28 | ) | | | (3.28 | ) | | | 57.32 | | | | 36.07 | | | | 4,153 | | | | 1.38 | | | | 1.38 | | | | (.30 | ) |
| 8/31/2019 | | | 51.96 | | | | (.08 | ) | | | (1.97 | ) | | | (2.05 | ) | | | — | | | | (4.82 | ) | | | (4.82 | ) | | | 45.09 | | | | (2.09 | ) | | | 4,134 | | | | 1.41 | | | | 1.41 | | | | (.17 | ) |
| 8/31/2018 | | | 45.39 | | | | (.13 | ) | | | 9.93 | | | | 9.80 | | | | — | | | | (3.23 | ) | | | (3.23 | ) | | | 51.96 | | | | 22.54 | | | | 4,953 | | | | 1.42 | | | | 1.42 | | | | (.28 | ) |
| Class T: | | | | | | | | | | | | | | | | | | | | | | | | | | | | | | | | | | | | | | | | | | | | | | | | | | | | |
| 8/31/2022 | | | 78.44 | | | | .31 | | | | (17.38 | ) | | | (17.07 | ) | | | (.23 | ) | | | (6.01 | ) | | | (6.24 | ) | | | 55.13 | | | | (23.58 | )6 | | | — | 7 | | | .36 | 6 | | | .36 | 6 | | | .47 | 6 |
| 8/31/2021 | | | 63.19 | | | | .20 | | | | 18.10 | | | | 18.30 | | | | (.31 | ) | | | (2.74 | ) | | | (3.05 | ) | | | 78.44 | | | | 29.76 | 6 | | | — | 7 | | | .38 | 6 | | | .38 | 6 | | | .29 | 6 |
| 8/31/2020 | | | 49.39 | | | | .34 | | | | 17.24 | | | | 17.58 | | | | (.50 | ) | | | (3.28 | ) | | | (3.78 | ) | | | 63.19 | | | | 37.40 | 6 | | | — | 7 | | | .40 | 6 | | | .40 | 6 | | | .66 | 6 |
| 8/31/2019 | | | 56.34 | | | | .41 | | | | (2.12 | ) | | | (1.71 | ) | | | (.42 | ) | | | (4.82 | ) | | | (5.24 | ) | | | 49.39 | | | | (1.11 | )6 | | | — | 7 | | | .41 | 6 | | | .41 | 6 | | | .83 | 6 |
| 8/31/2018 | | | 48.84 | | | | .38 | | | | 10.72 | | | | 11.10 | | | | (.37 | ) | | | (3.23 | ) | | | (3.60 | ) | | | 56.34 | | | | 23.76 | 6 | | | — | 7 | | | .42 | 6 | | | .42 | 6 | | | .73 | 6 |
| Class F-1: | | | | | | | | | | | | | | | | | | | | | | | | | | | | | | | | | | | | | | | | | | | | | | | | | | | | |
| 8/31/2022 | | | 77.79 | | | | .11 | | | | (17.25 | ) | | | (17.14 | ) | | | — | | | | (6.01 | ) | | | (6.01 | ) | | | 54.64 | | | | (23.82 | ) | | | 5,330 | | | | .66 | | | | .66 | | | | .16 | |
| 8/31/2021 | | | 62.70 | | | | .01 | | | | 17.95 | | | | 17.96 | | | | (.13 | ) | | | (2.74 | ) | | | (2.87 | ) | | | 77.79 | | | | 29.40 | | | | 7,747 | | | | .66 | | | | .66 | | | | .02 | |
| 8/31/2020 | | | 49.02 | | | | .20 | | | | 17.11 | | | | 17.31 | | | | (.35 | ) | | | (3.28 | ) | | | (3.63 | ) | | | 62.70 | | | | 37.05 | | | | 8,196 | | | | .67 | | | | .67 | | | | .40 | |
| 8/31/2019 | | | 55.92 | | | | .27 | | | | (2.09 | ) | | | (1.82 | ) | | | (.26 | ) | | | (4.82 | ) | | | (5.08 | ) | | | 49.02 | | | | (1.40 | ) | | | 7,539 | | | | .69 | | | | .69 | | | | .54 | |
| 8/31/2018 | | | 48.47 | | | | .24 | | | | 10.64 | | | | 10.88 | | | | (.20 | ) | | | (3.23 | ) | | | (3.43 | ) | | | 55.92 | | | | 23.43 | | | | 8,381 | | | | .69 | | | | .69 | | | | .45 | |
| Class F-2: | | | | | | | | | | | | | | | | | | | | | | | | | | | | | | | | | | | | | | | | | | | | | | | | | | | | |
| 8/31/2022 | | | 78.29 | | | | .29 | | | | (17.35 | ) | | | (17.06 | ) | | | (.22 | ) | | | (6.01 | ) | | | (6.23 | ) | | | 55.00 | | | | (23.62 | ) | | | 28,563 | | | | .40 | | | | .40 | | | | .43 | |
| 8/31/2021 | | | 63.07 | | | | .19 | | | | 18.07 | | | | 18.26 | | | | (.30 | ) | | | (2.74 | ) | | | (3.04 | ) | | | 78.29 | | | | 29.76 | | | | 37,459 | | | | .40 | | | | .40 | | | | .28 | |
| 8/31/2020 | | | 49.30 | | | | .34 | | | | 17.20 | | | | 17.54 | | | | (.49 | ) | | | (3.28 | ) | | | (3.77 | ) | | | 63.07 | | | | 37.38 | | | | 28,682 | | | | .41 | | | | .41 | | | | .65 | |
| 8/31/2019 | | | 56.25 | | | | .40 | | | | (2.11 | ) | | | (1.71 | ) | | | (.42 | ) | | | (4.82 | ) | | | (5.24 | ) | | | 49.30 | | | | (1.10 | ) | | | 22,265 | | | | .42 | | | | .42 | | | | .81 | |
| 8/31/2018 | | | 48.76 | | | | .39 | | | | 10.69 | | | | 11.08 | | | | (.36 | ) | | | (3.23 | ) | | | (3.59 | ) | | | 56.25 | | | | 23.76 | | | | 22,226 | | | | .42 | | | | .42 | | | | .74 | |
| Class F-3: | | | | | | | | | | | | | | | | | | | | | | | | | | | | | | | | | | | | | | | | | | | | | | | | | | | | |
| 8/31/2022 | | | 78.57 | | | | .36 | | | | (17.40 | ) | | | (17.04 | ) | | | (.30 | ) | | | (6.01 | ) | | | (6.31 | ) | | | 55.22 | | | | (23.53 | ) | | | 8,922 | | | | .29 | | | | .29 | | | | .54 | |
| 8/31/2021 | | | 63.28 | | | | .26 | | | | 18.13 | | | | 18.39 | | | | (.36 | ) | | | (2.74 | ) | | | (3.10 | ) | | | 78.57 | | | | 29.88 | | | | 11,555 | | | | .30 | | | | .30 | | | | .38 | |
| 8/31/2020 | | | 49.45 | | | | .39 | | | | 17.26 | | | | 17.65 | | | | (.54 | ) | | | (3.28 | ) | | | (3.82 | ) | | | 63.28 | | | | 37.53 | | | | 8,120 | | | | .31 | | | | .31 | | | | .75 | |
| 8/31/2019 | | | 56.41 | | | | .46 | | | | (2.13 | ) | | | (1.67 | ) | | | (.47 | ) | | | (4.82 | ) | | | (5.29 | ) | | | 49.45 | | | | (1.01 | ) | | | 5,796 | | | | .32 | | | | .32 | | | | .92 | |
| 8/31/2018 | | | 48.90 | | | | .44 | | | | 10.71 | | | | 11.15 | | | | (.41 | ) | | | (3.23 | ) | | | (3.64 | ) | | | 56.41 | | | | 23.86 | | | | 4,704 | | | | .33 | | | | .33 | | | | .84 | |
| Class 529-A: | | | | | | | | | | | | | | | | | | | | | | | | | | | | | | | | | | | | | | | | | | | | | | | | | |
| 8/31/2022 | | | 77.37 | | | | .13 | | | | (17.14 | ) | | | (17.01 | ) | | | (.04 | ) | | | (6.01 | ) | | | (6.05 | ) | | | 54.31 | | | | (23.79 | ) | | | 10,549 | | | | .64 | | | | .64 | | | | .20 | |
| 8/31/2021 | | | 62.38 | | | | .02 | | | | 17.87 | | | | 17.89 | | | | (.16 | ) | | | (2.74 | ) | | | (2.90 | ) | | | 77.37 | | | | 29.45 | | | | 14,481 | | | | .64 | | | | .64 | | | | .03 | |
| 8/31/2020 | | | 48.80 | | | | .20 | | | | 17.01 | | | | 17.21 | | | | (.35 | ) | | | (3.28 | ) | | | (3.63 | ) | | | 62.38 | | | | 37.01 | | | | 11,695 | | | | .68 | | | | .68 | | | | .38 | |
| 8/31/2019 | | | 55.70 | | | | .26 | | | | (2.07 | ) | | | (1.81 | ) | | | (.27 | ) | | | (4.82 | ) | | | (5.09 | ) | | | 48.80 | | | | (1.38 | ) | | | 8,569 | | | | .70 | | | | .70 | | | | .54 | |
| 8/31/2018 | | | 48.33 | | | | .24 | | | | 10.59 | | | | 10.83 | | | | (.23 | ) | | | (3.23 | ) | | | (3.46 | ) | | | 55.70 | | | | 23.41 | | | | 9,114 | | | | .70 | | | | .70 | | | | .46 | |
Refer to the end of the table for footnotes.
| 30 | The Growth Fund of America |
Financial highlights (continued)
| | | | | | (Loss) income from
investment operations1 | | | Dividends and distributions | | | | | | | | | | | | | | | | | | | |
| Year ended | | Net asset
value,
beginning
of year | | | Net
investment
income
(loss) | | | Net (losses)
gains on
securities
(both
realized and
unrealized) | | | Total from
investment
operations | | | Dividends
(from net
investment
income) | | | Distributions
(from capital
gains) | | | Total
dividends
and
distributions | | | Net asset
value,
end
of year | | | Total return2,3 | | | Net assets,
end of
year
(in millions) | | | Ratio of
expenses to
average net
assets before
reimburse-
ments4 | | | Ratio of
expenses to
average net
assets after
reimburse-
ments3,4 | | | Ratio of
net income
(loss)
to average
net assets3 | |
| Class 529-C: | | | | | | | | | | | | | | | | | | | | | | | | | | | | | | | | | | | | | | | | | | | | | | | | | |
| 8/31/2022 | | $ | 70.68 | | | $ | (.35 | ) | | $ | (15.47 | ) | | $ | (15.82 | ) | | $ | — | | | $ | (6.01 | ) | | $ | (6.01 | ) | | $ | 48.85 | | | | (24.39 | )% | | $ | 340 | | | | 1.41 | % | | | 1.41 | % | | | (.59 | )% |
| 8/31/2021 | | | 57.48 | | | | (.44 | ) | | | 16.38 | | | | 15.94 | | | | — | | | | (2.74 | ) | | | (2.74 | ) | | | 70.68 | | | | 28.49 | | | | 561 | | | | 1.38 | | | | 1.38 | | | | (.71 | ) |
| 8/31/2020 | | | 45.23 | | | | (.15 | ) | | | 15.68 | | | | 15.53 | | | | — | | | | (3.28 | ) | | | (3.28 | ) | | | 57.48 | | | | 35.98 | | | | 544 | | | | 1.42 | | | | 1.42 | | | | (.31 | ) |
| 8/31/2019 | | | 52.11 | | | | (.10 | ) | | | (1.96 | ) | | | (2.06 | ) | | | — | | | | (4.82 | ) | | | (4.82 | ) | | | 45.23 | | | | (2.11 | ) | | | 989 | | | | 1.45 | | | | 1.45 | | | | (.21 | ) |
| 8/31/2018 | | | 45.54 | | | | (.16 | ) | | | 9.96 | | | | 9.80 | | | | — | | | | (3.23 | ) | | | (3.23 | ) | | | 52.11 | | | | 22.46 | | | | 1,240 | | | | 1.46 | | | | 1.46 | | | | (.34 | ) |
| Class 529-E: | | | | | | | | | | | | | | | | | | | | | | | | | | | | | | | | | | | | | | | | | | | | | | | | | |
| 8/31/2022 | | | 76.33 | | | | (.04 | ) | | | (16.87 | ) | | | (16.91 | ) | | | — | | | | (6.01 | ) | | | (6.01 | ) | | | 53.41 | | | | (23.98 | ) | | | 311 | | | | .88 | | | | .88 | | | | (.05 | ) |
| 8/31/2021 | | | 61.59 | | | | (.14 | ) | | | 17.64 | | | | 17.50 | | | | (.02 | ) | | | (2.74 | ) | | | (2.76 | ) | | | 76.33 | | | | 29.14 | | | | 447 | | | | .88 | | | | .88 | | | | (.21 | ) |
| 8/31/2020 | | | 48.22 | | | | .08 | | | | 16.80 | | | | 16.88 | | | | (.23 | ) | | | (3.28 | ) | | | (3.51 | ) | | | 61.59 | | | | 36.70 | | | | 372 | | | | .90 | | | | .90 | | | | .16 | |
| 8/31/2019 | | | 55.07 | | | | .15 | | | | (2.04 | ) | | | (1.89 | ) | | | (.14 | ) | | | (4.82 | ) | | | (4.96 | ) | | | 48.22 | | | | (1.60 | ) | | | 305 | | | | .93 | | | | .93 | | | | .30 | |
| 8/31/2018 | | | 47.81 | | | | .11 | | | | 10.48 | | | | 10.59 | | | | (.10 | ) | | | (3.23 | ) | | | (3.33 | ) | | | 55.07 | | | | 23.11 | | | | 351 | | | | .94 | | | | .94 | | | | .21 | |
| Class 529-T: | | | | | | | | | | | | | | | | | | | | | | | | | | | | | | | | | | | | | | | | | | | | | | | | | |
| 8/31/2022 | | | 78.41 | | | | .28 | | | | (17.39 | ) | | | (17.11 | ) | | | (.19 | ) | | | (6.01 | ) | | | (6.20 | ) | | | 55.10 | | | | (23.64 | )6 | | | — | 7 | | | .41 | 6 | | | .41 | 6 | | | .42 | 6 |
| 8/31/2021 | | | 63.17 | | | | .16 | | | | 18.10 | | | | 18.26 | | | | (.28 | ) | | | (2.74 | ) | | | (3.02 | ) | | | 78.41 | | | | 29.71 | 6 | | | — | 7 | | | .44 | 6 | | | .44 | 6 | | | .24 | 6 |
| 8/31/2020 | | | 49.38 | | | | .32 | | | | 17.23 | | | | 17.55 | | | | (.48 | ) | | | (3.28 | ) | | | (3.76 | ) | | | 63.17 | | | | 37.33 | 6 | | | — | 7 | | | .44 | 6 | | | .44 | 6 | | | .62 | 6 |
| 8/31/2019 | | | 56.32 | | | | .39 | | | | (2.12 | ) | | | (1.73 | ) | | | (.39 | ) | | | (4.82 | ) | | | (5.21 | ) | | | 49.38 | | | | (1.15 | )6 | | | — | 7 | | | .45 | 6 | | | .45 | 6 | | | .79 | 6 |
| 8/31/2018 | | | 48.83 | | | | .35 | | | | 10.72 | | | | 11.07 | | | | (.35 | ) | | | (3.23 | ) | | | (3.58 | ) | | | 56.32 | | | | 23.70 | 6 | | | — | 7 | | | .47 | 6 | | | .47 | 6 | | | .68 | 6 |
| Class 529-F-1: | | | | | | | | | | | | | | | | | | | | | | | | | | | | | | | | | | | | | | | | | | | | | | | | | |
| 8/31/2022 | | | 77.23 | | | | .23 | | | | (17.09 | ) | | | (16.86 | ) | | | (.17 | ) | | | (6.01 | ) | | | (6.18 | ) | | | 54.19 | | | | (23.68 | )6 | | | — | 7 | | | .48 | 6 | | | .48 | 6 | | | .35 | 6 |
| 8/31/2021 | | | 62.24 | | | | .13 | | | | 17.88 | | | | 18.01 | | | | (.28 | ) | | | (2.74 | ) | | | (3.02 | ) | | | 77.23 | | | | 29.74 | 6 | | | — | 7 | | | .42 | 6 | | | .42 | 6 | | | .22 | 6 |
| 8/31/2020 | | | 48.69 | | | | .31 | | | | 16.99 | | | | 17.30 | | | | (.47 | ) | | | (3.28 | ) | | | (3.75 | ) | | | 62.24 | | | | 37.35 | | | | 642 | | | | .45 | | | | .45 | | | | .61 | |
| 8/31/2019 | | | 55.65 | | | | .38 | | | | (2.12 | ) | | | (1.74 | ) | | | (.40 | ) | | | (4.82 | ) | | | (5.22 | ) | | | 48.69 | | | | (1.18 | ) | | | 445 | | | | .47 | | | | .47 | | | | .77 | |
| 8/31/2018 | | | 48.28 | | | | .35 | | | | 10.58 | | | | 10.93 | | | | (.33 | ) | | | (3.23 | ) | | | (3.56 | ) | | | 55.65 | | | | 23.69 | | | | 384 | | | | .47 | | | | .47 | | | | .68 | |
| Class 529-F-2: | | | | | | | | | | | | | | | | | | | | | | | | | | | | | | | | | | | | | | | | | | | | | | | | | |
| 8/31/2022 | | | 78.40 | | | | .29 | | | | (17.37 | ) | | | (17.08 | ) | | | (.21 | ) | | | (6.01 | ) | | | (6.22 | ) | | | 55.10 | | | | (23.61 | ) | | | 773 | | | | .40 | | | | .40 | | | | .44 | |
| 8/31/20218,9 | | | 59.21 | | | | .15 | | | | 22.06 | | | | 22.21 | | | | (.28 | ) | | | (2.74 | ) | | | (3.02 | ) | | | 78.40 | | | | 38.38 | 10 | | | 932 | | | | .43 | 11 | | | .43 | 11 | | | .26 | 11 |
| Class 529-F-3: | | | | | | | | | | | | | | | | | | | | | | | | | | | | | | | | | | | | | | | | | | | | | | | | | |
| 8/31/2022 | | | 78.35 | | | | .32 | | | | (17.36 | ) | | | (17.04 | ) | | | (.25 | ) | | | (6.01 | ) | | | (6.26 | ) | | | 55.05 | | | | (23.58 | ) | | | — | 7 | | | .35 | | | | .35 | | | | .49 | |
| 8/31/20218,9 | | | 59.21 | | | | .19 | | | | 22.06 | | | | 22.25 | | | | (.37 | ) | | | (2.74 | ) | | | (3.11 | ) | | | 78.35 | | | | 38.45 | 10 | | | — | 7 | | | .38 | 11 | | | .35 | 11 | | | .32 | 11 |
| Class R-1: | | | | | | | | | | | | | | | | | | | | | | | | | | | | | | | | | | | | | | | | | | | | | | | | | |
| 8/31/2022 | | | 71.80 | | | | (.33 | ) | | | (15.75 | ) | | | (16.08 | ) | | | — | | | | (6.01 | ) | | | (6.01 | ) | | | 49.71 | | | | (24.36 | ) | | | 269 | | | | 1.38 | | | | 1.38 | | | | (.55 | ) |
| 8/31/2021 | | | 58.35 | | | | (.45 | ) | | | 16.64 | | | | 16.19 | | | | — | | | | (2.74 | ) | | | (2.74 | ) | | | 71.80 | | | | 28.49 | | | | 402 | | | | 1.38 | | | | 1.38 | | | | (.70 | ) |
| 8/31/2020 | | | 45.86 | | | | (.16 | ) | | | 15.93 | | | | 15.77 | | | | — | | | | (3.28 | ) | | | (3.28 | ) | | | 58.35 | | | | 36.01 | | | | 388 | | | | 1.40 | | | | 1.40 | | | | (.33 | ) |
| 8/31/2019 | | | 52.74 | | | | (.09 | ) | | | (1.97 | ) | | | (2.06 | ) | | | — | | | | (4.82 | ) | | | (4.82 | ) | | | 45.86 | | | | (2.08 | ) | | | 359 | | | | 1.42 | | | | 1.42 | | | | (.19 | ) |
| 8/31/2018 | | | 46.04 | | | | (.14 | ) | | | 10.07 | | | | 9.93 | | | | — | | | | (3.23 | ) | | | (3.23 | ) | | | 52.74 | | | | 22.50 | | | | 448 | | | | 1.42 | | | | 1.42 | | | | (.28 | ) |
Refer to the end of the table for footnotes.
| The Growth Fund of America | 31 |
Financial highlights (continued)
| | | | | | (Loss) income from
investment operations1 | | | Dividends and distributions | | | | | | | | | | | | | | | | | | | |
| Year ended | | Net asset
value,
beginning
of year | | | Net
investment
income
(loss) | | | Net (losses)
gains on
securities
(both
realized and
unrealized) | | | Total from
investment
operations | | | Dividends
(from net
investment
income) | | | Distributions
(from capital
gains) | | | Total
dividends
and
distributions | | | Net asset
value,
end
of year | | | Total return2,3 | | | Net assets,
end of
year
(in millions) | | | Ratio of
expenses to
average net
assets before
reimburse-
ments4 | | | Ratio of
expenses to
average net
assets after
reimburse-
ments3,4 | | | Ratio of
net income
(loss)
to average
net assets3 | |
| Class R-2: | | | | | | | | | | | | | | | | | | | | | | | | | | | | | | | | | | | | | | | | | | | | | | | | | |
| 8/31/2022 | | $ | 72.72 | | | $ | (.35 | ) | | $ | (15.96 | ) | | $ | (16.31 | ) | | $ | — | | | $ | (6.01 | ) | | $ | (6.01 | ) | | $ | 50.40 | | | | (24.37 | )% | | $ | 1,805 | | | | 1.40 | % | | | 1.40 | % | | | (.57 | )% |
| 8/31/2021 | | | 59.07 | | | | (.46 | ) | | | 16.85 | | | | 16.39 | | | | — | | | | (2.74 | ) | | | (2.74 | ) | | | 72.72 | | | | 28.49 | | | | 2,672 | | | | 1.39 | | | | 1.39 | | | | (.71 | ) |
| 8/31/2020 | | | 46.39 | | | | (.16 | ) | | | 16.12 | | | | 15.96 | | | | — | | | | (3.28 | ) | | | (3.28 | ) | | | 59.07 | | | | 36.01 | | | | 2,337 | | | | 1.40 | | | | 1.40 | | | | (.34 | ) |
| 8/31/2019 | | | 53.29 | | | | (.09 | ) | | | (1.99 | ) | | | (2.08 | ) | | | — | | | | (4.82 | ) | | | (4.82 | ) | | | 46.39 | | | | (2.10 | ) | | | 1,970 | | | | 1.42 | | | | 1.42 | | | | (.18 | ) |
| 8/31/2018 | | | 46.47 | | | | (.13 | ) | | | 10.18 | | | | 10.05 | | | | — | | | | (3.23 | ) | | | (3.23 | ) | | | 53.29 | | | | 22.55 | | | | 2,304 | | | | 1.41 | | | | 1.41 | | | | (.27 | ) |
| Class R-2E: | | | | | | | | | | | | | | | | | | | | | | | | | | | | | | | | | | | | | | | | | | | | | | | | | |
| 8/31/2022 | | | 76.28 | | | | (.18 | ) | | | (16.84 | ) | | | (17.02 | ) | | | — | | | | (6.01 | ) | | | (6.01 | ) | | | 53.25 | | | | (24.15 | ) | | | 190 | | | | 1.10 | | | | 1.10 | | | | (.27 | ) |
| 8/31/2021 | | | 61.67 | | | | (.28 | ) | | | 17.63 | | | | 17.35 | | | | — | | | | (2.74 | ) | | | (2.74 | ) | | | 76.28 | | | | 28.85 | | | | 291 | | | | 1.09 | | | | 1.09 | | | | (.42 | ) |
| 8/31/2020 | | | 48.30 | | | | (.02 | ) | | | 16.83 | | | | 16.81 | | | | (.16 | ) | | | (3.28 | ) | | | (3.44 | ) | | | 61.67 | | | | 36.44 | | | | 252 | | | | 1.11 | | | | 1.11 | | | | (.04 | ) |
| 8/31/2019 | | | 55.21 | | | | .06 | | | | (2.05 | ) | | | (1.99 | ) | | | (.10 | ) | | | (4.82 | ) | | | (4.92 | ) | | | 48.30 | | | | (1.81 | ) | | | 203 | | | | 1.12 | | | | 1.12 | | | | .12 | |
| 8/31/2018 | | | 48.00 | | | | .02 | | | | 10.52 | | | | 10.54 | | | | (.10 | ) | | | (3.23 | ) | | | (3.33 | ) | | | 55.21 | | | | 22.90 | | | | 185 | | | | 1.12 | | | | 1.12 | | | | .04 | |
| Class R-3: | | | | | | | | | | | | | | | | | | | | | | | | | | | | | | | | | | | | | | | | | | | | | | | | | |
| 8/31/2022 | | | 76.50 | | | | (.08 | ) | | | (16.90 | ) | | | (16.98 | ) | | | — | | | | (6.01 | ) | | | (6.01 | ) | | | 53.51 | | | | (24.02 | ) | | | 4,118 | | | | .94 | | | | .94 | | | | (.12 | ) |
| 8/31/2021 | | | 61.75 | | | | (.18 | ) | | | 17.67 | | | | 17.49 | | | | — | | | | (2.74 | ) | | | (2.74 | ) | | | 76.50 | | | | 29.05 | | | | 6,233 | | | | .94 | | | | .94 | | | | (.26 | ) |
| 8/31/2020 | | | 48.32 | | | | .06 | | | | 16.84 | | | | 16.90 | | | | (.19 | ) | | | (3.28 | ) | | | (3.47 | ) | | | 61.75 | | | | 36.63 | | | | 5,794 | | | | .95 | | | | .95 | | | | .12 | |
| 8/31/2019 | | | 55.14 | | | | .13 | | | | (2.03 | ) | | | (1.90 | ) | | | (.10 | ) | | | (4.82 | ) | | | (4.92 | ) | | | 48.32 | | | | (1.64 | ) | | | 5,356 | | | | .97 | | | | .97 | | | | .26 | |
| 8/31/2018 | | | 47.86 | | | | .09 | | | | 10.49 | | | | 10.58 | | | | (.07 | ) | | | (3.23 | ) | | | (3.30 | ) | | | 55.14 | | | | 23.06 | | | | 6,728 | | | | .97 | | | | .97 | | | | .17 | |
| Class R-4: | | | | | | | | | | | | | | | | | | | | | | | | | | | | | | | | | | | | | | | | | | | | | | | | | |
| 8/31/2022 | | | 77.58 | | | | .12 | | | | (17.20 | ) | | | (17.08 | ) | | | (.02 | ) | | | (6.01 | ) | | | (6.03 | ) | | | 54.47 | | | | (23.81 | ) | | | 5,093 | | | | .64 | | | | .64 | | | | .18 | |
| 8/31/2021 | | | 62.53 | | | | .02 | | | | 17.92 | | | | 17.94 | | | | (.15 | ) | | | (2.74 | ) | | | (2.89 | ) | | | 77.58 | | | | 29.44 | | | | 7,878 | | | | .64 | | | | .64 | | | | .03 | |
| 8/31/2020 | | | 48.89 | | | | .21 | | | | 17.06 | | | | 17.27 | | | | (.35 | ) | | | (3.28 | ) | | | (3.63 | ) | | | 62.53 | | | | 37.06 | | | | 7,403 | | | | .65 | | | | .65 | | | | .42 | |
| 8/31/2019 | | | 55.79 | | | | .28 | | | | (2.09 | ) | | | (1.81 | ) | | | (.27 | ) | | | (4.82 | ) | | | (5.09 | ) | | | 48.89 | | | | (1.38 | ) | | | 6,860 | | | | .67 | | | | .67 | | | | .56 | |
| 8/31/2018 | | | 48.38 | | | | .24 | | | | 10.63 | �� | | | 10.87 | | | | (.23 | ) | | | (3.23 | ) | | | (3.46 | ) | | | 55.79 | | | | 23.46 | | | | 8,391 | | | | .67 | | | | .67 | | | | .47 | |
| Class R-5E: | | | | | | | | | | | | | | | | | | | | | | | | | | | | | | | | | | | | | | | | | | | | | | | | | |
| 8/31/2022 | | | 77.70 | | | | .25 | | | | (17.20 | ) | | | (16.95 | ) | | | (.21 | ) | | | (6.01 | ) | | | (6.22 | ) | | | 54.53 | | | | (23.66 | ) | | | 996 | | | | .45 | | | | .45 | | | | .39 | |
| 8/31/2021 | | | 62.61 | | | | .16 | | | | 17.94 | | | | 18.10 | | | | (.27 | ) | | | (2.74 | ) | | | (3.01 | ) | | | 77.70 | | | | 29.69 | | | | 1,337 | | | | .44 | | | | .44 | | | | .23 | |
| 8/31/2020 | | | 48.97 | | | | .31 | | | | 17.09 | | | | 17.40 | | | | (.48 | ) | | | (3.28 | ) | | | (3.76 | ) | | | 62.61 | | | | 37.36 | | | | 990 | | | | .45 | | | | .45 | | | | .61 | |
| 8/31/2019 | | | 55.97 | | | | .39 | | | | (2.14 | ) | | | (1.75 | ) | | | (.43 | ) | | | (4.82 | ) | | | (5.25 | ) | | | 48.97 | | | | (1.17 | ) | | | 732 | | | | .46 | | | | .46 | | | | .80 | |
| 8/31/2018 | | | 48.55 | | | | .42 | | | | 10.59 | | | | 11.01 | | | | (.36 | ) | | | (3.23 | ) | | | (3.59 | ) | | | 55.97 | | | | 23.72 | | | | 296 | | | | .45 | | | | .45 | | | | .79 | |
| Class R-5: | | | | | | | | | | | | | | | | | | | | | | | | | | | | | | | | | | | | | | | | | | | | | | | | | |
| 8/31/2022 | | | 78.50 | | | | .32 | | | | (17.39 | ) | | | (17.07 | ) | | | (.25 | ) | | | (6.01 | ) | | | (6.26 | ) | | | 55.17 | | | | (23.58 | ) | | | 1,457 | | | | .34 | | | | .34 | | | | .48 | |
| 8/31/2021 | | | 63.22 | | | | .23 | | | | 18.12 | | | | 18.35 | | | | (.33 | ) | | | (2.74 | ) | | | (3.07 | ) | | | 78.50 | | | | 29.84 | | | | 2,322 | | | | .34 | | | | .34 | | | | .34 | |
| 8/31/2020 | | | 49.40 | | | | .37 | | | | 17.24 | | | | 17.61 | | | | (.51 | ) | | | (3.28 | ) | | | (3.79 | ) | | | 63.22 | | | | 37.48 | | | | 2,716 | | | | .35 | | | | .35 | | | | .72 | |
| 8/31/2019 | | | 56.35 | | | | .43 | | | | (2.13 | ) | | | (1.70 | ) | | | (.43 | ) | | | (4.82 | ) | | | (5.25 | ) | | | 49.40 | | | | (1.08 | ) | | | 2,648 | | | | .37 | | | | .37 | | | | .86 | |
| 8/31/2018 | | | 48.84 | | | | .40 | | | | 10.72 | | | | 11.12 | | | | (.38 | ) | | | (3.23 | ) | | | (3.61 | ) | | | 56.35 | | | | 23.81 | | | | 3,430 | | | | .37 | | | | .37 | | | | .77 | |
| Class R-6: | | | | | | | | | | | | | | | | | | | | | | | | | | | | | | | | | | | | | | | | | | | | | | | | | |
| 8/31/2022 | | | 78.63 | | | | .36 | | | | (17.42 | ) | | | (17.06 | ) | | | (.30 | ) | | | (6.01 | ) | | | (6.31 | ) | | | 55.26 | | | | (23.54 | ) | | | 36,396 | | | | .29 | | | | .29 | | | | .54 | |
| 8/31/2021 | | | 63.32 | | | | .27 | | | | 18.14 | | | | 18.41 | | | | (.36 | ) | | | (2.74 | ) | | | (3.10 | ) | | | 78.63 | | | | 29.90 | | | | 46,741 | | | | .29 | | | | .29 | | | | .38 | |
| 8/31/2020 | | | 49.48 | | | | .40 | | | | 17.26 | | | | 17.66 | | | | (.54 | ) | | | (3.28 | ) | | | (3.82 | ) | | | 63.32 | | | | 37.53 | | | | 38,573 | | | | .30 | | | | .30 | | | | .76 | |
| 8/31/2019 | | | 56.44 | | | | .46 | | | | (2.13 | ) | | | (1.67 | ) | | | (.47 | ) | | | (4.82 | ) | | | (5.29 | ) | | | 49.48 | | | | (1.01 | ) | | | 32,028 | | | | .32 | | | | .32 | | | | .92 | |
| 8/31/2018 | | | 48.91 | | | | .44 | | | | 10.72 | | | | 11.16 | | | | (.40 | ) | | | (3.23 | ) | | | (3.63 | ) | | | 56.44 | | | | 23.88 | | | | 31,562 | | | | .32 | | | | .32 | | | | .83 | |
Refer to the end of the table for footnotes.
| 32 | The Growth Fund of America |
Financial highlights (continued)
| | | Year ended August 31, |
| | | 2022 | | 2021 | | 2020 | | 2019 | | 2018 |
| Portfolio turnover rate for all share classes12 | | 30% | | 24% | | 28% | | 36% | | 28% |
| 1 | Based on average shares outstanding. |
| 2 | Total returns exclude any applicable sales charges, including contingent deferred sales charges. |
| 3 | This column reflects the impact, if any, of certain reimbursements from CRMC. During one of the years shown, CRMC reimbursed a portion of transfer agent services fees for Class 529-F-3 shares. |
| 4 | Ratios do not include expenses of any Central Funds. The fund indirectly bears its proportionate share of the expenses of any Central Funds. |
| 5 | Amount less than $.01. |
| 6 | All or a significant portion of assets in this class consisted of seed capital invested by CRMC and/or its affiliates. Fees for distribution services are not charged or accrued on these seed capital assets. If such fees were paid by the fund on seed capital assets, fund expenses would have been higher and net income and total return would have been lower. |
| 7 | Amount less than $1 million. |
| 8 | Based on operations for a period that is less than a full year. |
| 9 | Class 529-F-2 and 529-F-3 shares began investment operations on October 30, 2020. |
| 10 | Not annualized. |
| 11 | Annualized. |
| 12 | Rates do not include the fund’s portfolio activity with respect to any Central Funds. |
Refer to the notes to financial statements.
| The Growth Fund of America | 33 |
Report of Independent Registered Public Accounting Firm
To the Shareholders and Board of Trustees of The Growth Fund of America:
Opinion on the Financial Statements and Financial Highlights
We have audited the accompanying statement of assets and liabilities of The Growth Fund of America (the “Fund”), including the investment portfolio, as of August 31, 2022, the related statement of operations for the year then ended, the statements of changes in net assets for each of the two years in the period then ended, the financial highlights for each of the five years in the period then ended, and the related notes. In our opinion, the financial statements and financial highlights present fairly, in all material respects, the financial position of the Fund as of August 31, 2022, and the results of its operations for the year then ended, the changes in its net assets for each of the two years in the period then ended, and the financial highlights for each of the five years in the period then ended, in conformity with accounting principles generally accepted in the United States of America.
Basis for Opinion
These financial statements and financial highlights are the responsibility of the Fund’s management. Our responsibility is to express an opinion on the Fund’s financial statements and financial highlights based on our audits. We are a public accounting firm registered with the Public Company Accounting Oversight Board (United States) (PCAOB) and are required to be independent with respect to the Fund in accordance with the U.S. federal securities laws and the applicable rules and regulations of the Securities and Exchange Commission and the PCAOB.
We conducted our audits in accordance with the standards of the PCAOB. Those standards require that we plan and perform the audit to obtain reasonable assurance about whether the financial statements and financial highlights are free of material misstatement, whether due to error or fraud. The Fund is not required to have, nor were we engaged to perform, an audit of its internal control over financial reporting. As part of our audits we are required to obtain an understanding of internal control over financial reporting but not for the purpose of expressing an opinion on the effectiveness of the Fund’s internal control over financial reporting. Accordingly, we express no such opinion.
Our audits included performing procedures to assess the risks of material misstatement of the financial statements and financial highlights, whether due to error or fraud, and performing procedures that respond to those risks. Such procedures included examining, on a test basis, evidence regarding the amounts and disclosures in the financial statements and financial highlights. Our audits also included evaluating the accounting principles used and significant estimates made by management, as well as evaluating the overall presentation of the financial statements and financial highlights. Our procedures included confirmation of securities owned as of August 31, 2022, by correspondence with the custodian and brokers; when replies were not received from brokers, we performed other auditing procedures. We believe that our audits provide a reasonable basis for our opinion.
Deloitte & Touche LLP
Costa Mesa, California
October 10, 2022
We have served as the auditor of one or more American Funds investment companies since 1956.
| 34 | The Growth Fund of America |
As a fund shareholder, you incur two types of costs: (1) transaction costs, such as initial sales charges on purchase payments and contingent deferred sales charges on redemptions (loads), and (2) ongoing costs, including management fees, distribution and service (12b-1) fees, and other expenses. This example is intended to help you understand your ongoing costs (in dollars) of investing in the fund so you can compare these costs with the ongoing costs of investing in other mutual funds. The example is based on an investment of $1,000 invested at the beginning of the period and held for the entire six-month period (March 1, 2022, through August 31, 2022).
Actual expenses:
The first line of each share class in the table on the following page provides information about actual account values and actual expenses. You may use the information in this line, together with the amount you invested, to estimate the expenses that you paid over the period. Simply divide your account value by $1,000 (for example, an $8,600 account value divided by $1,000 = 8.6), then multiply the result by the number in the first line under the heading titled “Expenses paid during period” to estimate the expenses you paid on your account during this period.
Hypothetical example for comparison purposes:
The second line of each share class in the table on the following page provides information about hypothetical account values and hypothetical expenses based on the actual expense ratio for the share class and an assumed rate of return of 5.00% per year before expenses, which is not the actual return of the share class. The hypothetical account values and expenses may not be used to estimate the actual ending account balance or expenses you paid for the period. You may use this information to compare the ongoing costs of investing in the fund and other funds. To do so, compare this 5.00% hypothetical example with the 5.00% hypothetical examples that appear in the shareholder reports of the other funds.
Notes:
Retirement plan participants may be subject to certain fees charged by the plan sponsor, and Class F-1, F-2, F-3, 529-F-1, 529-F-2 and 529-F-3 shareholders may be subject to fees charged by financial intermediaries, typically ranging from 0.75% to 1.50% of assets annually depending on services offered. You can estimate the impact of these fees by adding the amount of the fees to the total estimated expenses you paid on your account during the period as calculated above. In addition, your ending account value would be lower by the amount of these fees.
Note that the expenses shown in the table on the following page are meant to highlight your ongoing costs only and do not reflect any transactional costs, such as sales charges (loads). Therefore, the second line of each share class in the table is useful in comparing ongoing costs only and will not help you determine the relative total costs of owning different funds. In addition, if these transactional costs were included, your costs would have been higher.
| The Growth Fund of America | 35 |
Expense example (continued)
| | | Beginning
account value
3/1/2022 | | | Ending
account value
8/31/2022 | | | Expenses paid
during period* | | | Annualized
expense ratio | |
| Class A – actual return | | $ | 1,000.00 | | | $ | 855.04 | | | $ | 2.85 | | | | .61 | % |
| Class A – assumed 5% return | | | 1,000.00 | | | | 1,022.13 | | | | 3.11 | | | | .61 | |
| Class C – actual return | | | 1,000.00 | | | | 851.75 | | | | 6.39 | | | | 1.37 | |
| Class C – assumed 5% return | | | 1,000.00 | | | | 1,018.30 | | | | 6.97 | | | | 1.37 | |
| Class T – actual return | | | 1,000.00 | | | | 856.17 | | | | 1.68 | | | | .36 | |
| Class T – assumed 5% return | | | 1,000.00 | | | | 1,023.39 | | | | 1.84 | | | | .36 | |
| Class F-1 – actual return | | | 1,000.00 | | | | 854.84 | | | | 3.13 | | | | .67 | |
| Class F-1 – assumed 5% return | | | 1,000.00 | | | | 1,021.83 | | | | 3.41 | | | | .67 | |
| Class F-2 – actual return | | | 1,000.00 | | | | 856.02 | | | | 1.92 | | | | .41 | |
| Class F-2 – assumed 5% return | | | 1,000.00 | | | | 1,023.14 | | | | 2.09 | | | | .41 | |
| Class F-3 – actual return | | | 1,000.00 | | | | 856.52 | | | | 1.40 | | | | .30 | |
| Class F-3 – assumed 5% return | | | 1,000.00 | | | | 1,023.69 | | | | 1.53 | | | | .30 | |
| Class 529-A – actual return | | | 1,000.00 | | | | 855.00 | | | | 3.04 | | | | .65 | |
| Class 529-A – assumed 5% return | | | 1,000.00 | | | | 1,021.93 | | | | 3.31 | | | | .65 | |
| Class 529-C – actual return | | | 1,000.00 | | | | 851.65 | | | | 6.63 | | | | 1.42 | |
| Class 529-C – assumed 5% return | | | 1,000.00 | | | | 1,018.05 | | | | 7.22 | | | | 1.42 | |
| Class 529-E – actual return | | | 1,000.00 | | | | 854.03 | | | | 4.16 | | | | .89 | |
| Class 529-E – assumed 5% return | | | 1,000.00 | | | | 1,020.72 | | | | 4.53 | | | | .89 | |
| Class 529-T – actual return | | | 1,000.00 | | | | 855.87 | | | | 1.96 | | | | .42 | |
| Class 529-T – assumed 5% return | | | 1,000.00 | | | | 1,023.09 | | | | 2.14 | | | | .42 | |
| Class 529-F-1 – actual return | | | 1,000.00 | | | | 855.66 | | | | 2.29 | | | | .49 | |
| Class 529-F-1 – assumed 5% return | | | 1,000.00 | | | | 1,022.74 | | | | 2.50 | | | | .49 | |
| Class 529-F-2 – actual return | | | 1,000.00 | | | | 856.14 | | | | 1.87 | | | | .40 | |
| Class 529-F-2 – assumed 5% return | | | 1,000.00 | | | | 1,023.19 | | | | 2.04 | | | | .40 | |
| Class 529-F-3 – actual return | | | 1,000.00 | | | | 856.30 | | | | 1.64 | | | | .35 | |
| Class 529-F-3 – assumed 5% return | | | 1,000.00 | | | | 1,023.44 | | | | 1.79 | | | | .35 | |
| Class R-1 – actual return | | | 1,000.00 | | | | 851.78 | | | | 6.44 | | | | 1.38 | |
| Class R-1 – assumed 5% return | | | 1,000.00 | | | | 1,018.25 | | | | 7.02 | | | | 1.38 | |
| Class R-2 – actual return | | | 1,000.00 | | | | 851.76 | | | | 6.49 | | | | 1.39 | |
| Class R-2 – assumed 5% return | | | 1,000.00 | | | | 1,018.20 | | | | 7.07 | | | | 1.39 | |
| Class R-2E – actual return | | | 1,000.00 | | | | 852.96 | | | | 5.14 | | | | 1.10 | |
| Class R-2E – assumed 5% return | | | 1,000.00 | | | | 1,019.66 | | | | 5.60 | | | | 1.10 | |
| Class R-3 – actual return | | | 1,000.00 | | | | 853.86 | | | | 4.39 | | | | .94 | |
| Class R-3 – assumed 5% return | | | 1,000.00 | | | | 1,020.47 | | | | 4.79 | | | | .94 | |
| Class R-4 – actual return | | | 1,000.00 | | | | 854.96 | | | | 3.04 | | | | .65 | |
| Class R-4 – assumed 5% return | | | 1,000.00 | | | | 1,021.93 | | | | 3.31 | | | | .65 | |
| Class R-5E – actual return | | | 1,000.00 | | | | 855.79 | | | | 2.10 | | | | .45 | |
| Class R-5E – assumed 5% return | | | 1,000.00 | | | | 1,022.94 | | | | 2.29 | | | | .45 | |
| Class R-5 – actual return | | | 1,000.00 | | | | 856.29 | | | | 1.59 | | | | .34 | |
| Class R-5 – assumed 5% return | | | 1,000.00 | | | | 1,023.49 | | | | 1.73 | | | | .34 | |
| Class R-6 – actual return | | | 1,000.00 | | | | 856.47 | | | | 1.40 | | | | .30 | |
| Class R-6 – assumed 5% return | | | 1,000.00 | | | | 1,023.69 | | | | 1.53 | | | | .30 | |
| | |
| * | The “expenses paid during period” are equal to the “annualized expense ratio,” multiplied by the average account value over the period, multiplied by the number of days in the period, and divided by 365 (to reflect the one-half year period). |
| 36 | The Growth Fund of America |
We are required to advise you of the federal tax status of certain distributions received by shareholders during the fiscal year. The fund hereby designates the following amounts for the fund’s fiscal year ended August 31, 2022:
| Long-term capital gains | | $23,006,995,000 |
| Qualified dividend income | | 100% |
| Corporate dividends received deduction | | 100% |
| U.S. government income that may be exempt from state taxation | | $13,887,000 |
Individual shareholders should refer to their Form 1099 or other tax information, which will be mailed in January 2023, to determine the calendar year amounts to be included on their 2022 tax returns. Shareholders should consult their tax advisors.
| The Growth Fund of America | 37 |
Approval of Investment Advisory and Service Agreement
The fund’s board has approved the continuation of the fund’s Investment Advisory and Service Agreement (the “agreement”) with Capital Research and Management Company (“CRMC”) for an additional one-year term through November 30, 2023. The agreement was amended to add additional advisory fee breakpoints for when the fund’s net assets exceed $305 billion and $341 billion. The board approved the agreement following the recommendation of the fund’s Contracts Committee (the “committee”), which is composed of all the fund’s independent board members. The board and the committee determined in the exercise of their business judgment that the fund’s advisory fee structure was fair and reasonable in relation to the services provided, and that approving the agreement was in the best interests of the fund and its shareholders.
In reaching this decision, the board and the committee took into account their interactions with CRMC as well as information furnished to them throughout the year and otherwise provided to them, as well as information prepared specifically in connection with their review of the agreement, and were advised by their independent counsel with respect to the matters considered. They considered the following factors, among others, but did not identify any single issue or particular piece of information that, in isolation, was the controlling factor, and each board and committee member did not necessarily attribute the same weight to each factor.
1. Nature, extent and quality of services
The board and the committee considered the depth and quality of CRMC’s investment management process, including its global research capabilities; the experience, capability and integrity of its senior management and other personnel; the low turnover rates of its key personnel; the overall financial strength and stability of CRMC and the Capital Group organization; the resources and systems CRMC devotes to investment management (the manner in which the fund’s assets are managed, including liquidity management), financial, investment operations, compliance, trading, proxy voting, shareholder communications, and other services; and the ongoing evolution of CRMC’s organizational structure designed to maintain and strengthen these qualities. The board and the committee also considered the nature, extent and quality of administrative and shareholder services provided by CRMC to the fund under the agreement and other agreements, as well as the benefits to fund shareholders from investing in a fund that is part of a large family of funds. The board and the committee considered the risks assumed by CRMC in providing services to the fund, including operational, business, financial, reputational, regulatory and litigation risks. The board and the committee concluded that the nature, extent and quality of the services provided by CRMC have benefited and should continue to benefit the fund and its shareholders.
2. Investment results
The board and the committee considered the investment results of the fund in light of its objective. They compared the fund’s investment results with those of other funds (including funds that currently form the basis of the Lipper index for the category in which the fund is included) and data such as relevant market and fund indexes over various periods (including the fund’s lifetime) through March 31, 2022. They generally placed greater emphasis on investment results over longer term periods. On the basis of this evaluation and the board’s and the committee’s ongoing review of investment results, and considering the relative market conditions during certain reporting periods, the board and the committee concluded that the fund’s investment results have been satisfactory for renewal of the agreement, and that CRMC’s record in managing the fund indicated that its continued management should benefit the fund and its shareholders.
3. Advisory fees and total expenses
The board and the committee compared the advisory fees and total expense levels of the fund to those of other relevant funds. They observed that the fund’s advisory fees and expenses generally compared favorably to those of other similar funds included in the comparable Lipper category. The board and the committee also considered the breakpoint discounts in the fund’s advisory fee structure that reduce the level of fees charged by CRMC to the fund as fund assets increase. In addition, they reviewed information regarding the effective advisory fees charged to non-mutual fund clients by CRMC and its affiliates. They noted that, to the extent there were differences between the advisory fees paid by the fund and the advisory fees paid by those clients, the differences appropriately reflected the investment, operational, regulatory and market differences between advising the fund and the other clients. The board and the committee concluded that the fund’s cost structure was fair and reasonable in relation to the services provided, as well as in relation to the risks assumed by the adviser in sponsoring and managing the fund, and that the fund’s shareholders receive reasonable value in return for the advisory fees and other amounts paid to CRMC by the fund.
| 38 | The Growth Fund of America |
4. Ancillary benefits
The board and the committee considered a variety of other benefits that CRMC and its affiliates receive as a result of CRMC’s relationship with the fund and other American Funds, including fees for administrative services provided to certain share classes; fees paid to CRMC’s affiliated transfer agent; sales charges and distribution fees received and retained by the fund’s principal underwriter, an affiliate of CRMC; and possible ancillary benefits to CRMC and its institutional management affiliates in managing other investment vehicles. The board and the committee reviewed CRMC’s portfolio trading practices, noting that CRMC bears the cost of third-party research. The board and committee also noted that CRMC benefitted from the use of commissions from portfolio transactions made on behalf of the fund to facilitate payment to certain broker-dealers for research to comply with regulatory requirements applicable to these firms, with all such amounts reimbursed by CRMC. The board and the committee took these ancillary benefits into account in evaluating the reasonableness of the advisory fees and other amounts paid to CRMC by the fund.
5. Adviser financial information
The board and the committee reviewed information regarding CRMC’s costs of providing services to the American Funds, including personnel, systems and resources of investment, compliance, trading, accounting and other administrative operations. They considered CRMC’s costs and related cost allocation methodology as well as its track record of investing in technology, infrastructure and staff to maintain and expand services and capabilities, respond to industry and regulatory developments, and attract and retain qualified personnel. They noted information regarding the compensation structure for CRMC’s investment professionals. They reviewed information on the profitability of the investment adviser and its affiliates. The board and the committee also compared CRMC’s profitability and compensation data to the reported results and data of a number of large, publicly held investment management companies. The board and the committee noted the competitiveness and cyclicality of both the mutual fund industry and the capital markets, and the importance in that environment of CRMC’s long-term profitability for maintaining its independence, company culture and management continuity. They further considered the breakpoint discounts in the fund’s advisory fee structure and CRMC’s sharing of potential economies of scale, or efficiencies, through breakpoints and other fee reductions and costs voluntarily absorbed. The board and the committee concluded that the fund’s advisory fee structure reflected a reasonable sharing of benefits between CRMC and the fund’s shareholders.
| The Growth Fund of America | 39 |
This page was intentionally left blank.
| 40 | The Growth Fund of America |
This page was intentionally left blank.
| The Growth Fund of America | 41 |
Board of trustees and other officers
Independent trustees1
| Name and year of birth | | Year first
elected
a trustee
of the fund2 | | Principal occupation(s) during past five years | | Number of
portfolios in fund
complex overseen
by trustee3 | | Other directorships4
held by trustee |
| Joseph J. Bonner, 1955 | | 2019 | | President and CEO, Solana Beach Capital LLC (real estate advisory); Global Head of Real Estate, Board Member, The Interlink Group (private merchant bank) | | 3 | | Extra Space Storage |
| Mary Anne Dolan, 1947 | | 2010 | | Founder and President, MAD Ink (communications company); former Editor-in-Chief, The Los Angeles Herald Examiner (retired 1989) | | 10 | | None |
John G. Freund, MD, 1953
Chair of the Board
(Independent and Non-Executive) | | 2010 | | Founder and former Managing Director, Skyline Ventures (a venture capital investor in health care companies) ; Co-Founder of Intuitive Surgical, Inc. (1995 – 2000); Co-Founder and former CEO of Arixa Pharmaceuticals, Inc. (2016 - 2020) | | 6 | | Collegium Pharmaceutical, Inc.; SI – Bone, Inc.; Sutro Biopharma, Inc. |
| Yvonne L. Greenstreet, 1962 | | 2019 | | Chief Executive Officer, Alnylam Pharmaceuticals, Inc. | | 3 | | Pacira, Inc. (pharmaceuticals) |
| Linda Griego, 1947 | | 2015 | | Former President and CEO, Griego Enterprises, Inc. (business management company) | | 7 | | ViacomCBS Inc. |
| Leonade D. Jones, 1947 | | 1993 | | Retired; former Treasurer, The Washington Post Company (retired 1996) | | 10 | | None |
| Martin E. Koehler, 1957 | | 2021 | | Independent management consultant | | 6 | | None |
| Sharon I. Meers, 1965 | | 2017 | | Co-Founder and COO, Midi Health, Inc. (a women’s telehealth company); former Senior Director, Head of Strategic Partnerships, eBay Enterprise | | 7 | | None |
| Kenneth M. Simril, 1965 | | 2016 | | President and CEO, SCI Ingredients Holdings, Inc. (food manufacturing) | | 7 | | Bunge Limited (agricultural business and food company) |
| Christopher E. Stone, 1956 | | 2010 | | Professor of Practice of Public Integrity, University of Oxford, Blavatnik School of Government; former President, Open Society Foundations | | 9 | | None |
Interested trustees5,6
Name, year of birth and
position with fund | | Year first
elected
a trustee
or officer
of the fund2 | | Principal occupation(s) during past five years and
positions held with affiliated entities or
the principal underwriter of the fund | | Number of
portfolios in fund
complex overseen
by trustee3 | | Other directorships4
held by trustee |
Anne-Marie Peterson, 1972
Co-President and Trustee | | 2016 | | Partner — Capital World Investors, Capital Research and Management Company | | 3 | | None |
Brady L. Enright, 1967
Trustee | | 2019 | | Partner — Capital World Investors, Capital Research and Management Company; Partner — Capital World Investors, Capital Bank and Trust Company7 | | 3 | | None |
The fund’s statement of additional information includes further details about fund trustees and is available without charge upon request by calling American Funds Service Company at (800) 421-4225 or by visiting the Capital Group website at capitalgroup.com. The address for all trustees and officers of the fund is 6455 Irvine Center Drive, Irvine, CA 92618, Attention: Secretary.
| 42 | The Growth Fund of America |
Other officers6
Name, year of birth and
position with fund | | Year first
elected
an officer
of the fund2 | | Principal occupation(s) during past five years and positions held with affiliated entities
or the principal underwriter of the fund |
Christopher D. Buchbinder, 1971
Co-President | | 2015 | | Partner — Capital Research Global Investors, Capital Research and Management Company; Director, The Capital Group Companies, Inc.7 |
Donald D. O’Neal, 1960
Co-President | | 1995 | | Partner — Capital International Investors, Capital Research and Management Company; Partner — Capital International Investors, Capital Bank and Trust Company7 |
Walt Burkley, 1966
Principal Executive Officer | | 2010 | | Senior Vice President and Senior Counsel — Fund Business Management Group, Capital Research and Management Company; Director, Capital Research Company7; Director, Capital Research and Management Company |
Michael W. Stockton, 1967
Executive Vice President | | 2014 | | Senior Vice President — Fund Business Management Group, Capital Research and Management Company |
Julian N. Abdey, 1972
Senior Vice President | | 2021 | | Partner — Capital International Investors, Capital Research and Management Company |
Brad Barrett, 1977 Senior Vice President | | 2010 | | Partner — Capital Research Global Investors, Capital Research and Management Company; Director, The Capital Group Companies, Inc.7 |
Mark L. Casey, 1970
Senior Vice President | | 2016 | | Partner — Capital International Investors, Capital Research and Management Company |
J. Blair Frank, 1966
Senior Vice President | | 2019 | | Partner — Capital Research Global Investors, Capital Research and Management Company |
Joanna F. Jonsson, 1963
Senior Vice President | | 2019 | | Partner — Capital World Investors, Capital Research and Management Company; Vice Chair, President and Director, Capital Research and Management Company; Director, The Capital Group Companies, Inc.7 |
Carl M. Kawaja, 1964
Senior Vice President | | 2019 | | Partner — Capital World Investors, Capital Research and Management Company; Partner — Capital World Investors, Capital Bank and Trust Company7; Chairman and Director, Capital Research and Management Company |
Alex Popa, 1980
Senior Vice President | | 2020 | | Partner — Capital World Investors, Capital Research and Management Company |
Andraz Razen, 1975
Senior Vice President | | 2020 | | Partner — Capital World Investors, Capital Research Company7 |
Martin Romo, 1967
Senior Vice President | | 2010 | | Partner — Capital Research Global Investors, Capital Research and Management Company; Chairman, Principal Executive Officer and Director, Capital Research Company7; Director, The Capital Group Companies, Inc.7 |
Lawrence R. Solomon, 1962
Senior Vice President | | 2014 | | Partner — Capital Research Global Investors, Capital Research and Management Company; Chairman of the Board, President and Director, Capital Management Services, Inc.7 |
Alan J. Wilson, 1961
Senior Vice President | | 2019 | | Partner — Capital World Investors, Capital Research and Management Company; Director, Capital Research and Management Company |
Julie E. Lawton, 1973
Secretary | | 2010 | | Assistant Vice President — Fund Business Management Group, Capital Research and Management Company; Secretary, Capital Research Company7 |
Hong T. Le, 1978
Treasurer | | 2018 | | Vice President — Investment Operations, Capital Research and Management Company |
Sandra Chuon, 1972
Assistant Treasurer | | 2019 | | Vice President — Investment Operations, Capital Research and Management Company |
Brian C. Janssen, 1972
Assistant Treasurer | | 2016-2018,
2020 | | Senior Vice President — Investment Operations, Capital Research and Management Company |
| 1 | The term independent trustee refers to a trustee who is not an “interested person” of the fund within the meaning of the Investment Company Act of 1940. |
| 2 | Trustees and officers of the fund serve until their resignation, removal or retirement. |
| 3 | Funds managed by Capital Research and Management Company or its affiliates. |
| 4 | This includes all directorships/trusteeships (other than those in the American Funds or other funds managed by Capital Research and Management Company or its affiliates) that are held by each trustee as a trustee or director of a public company or a registered investment company. |
| 5 | The term interested trustee refers to a trustee who is an “interested person” within the meaning of the Investment Company Act of 1940, on the basis of their affiliation with the fund’s investment adviser, Capital Research and Management Company, or affiliated entities (including the fund’s principal underwriter). |
| 6 | All of the trustees and/or officers listed are officers and/or directors/trustees of one or more of the other funds for which Capital Research and Management Company serves as investment adviser. |
| 7 | Company affiliated with Capital Research and Management Company. |
| The Growth Fund of America | 43 |
Office of the fund
6455 Irvine Center Drive
Irvine, CA 92618-4518
Investment adviser
Capital Research and Management Company
333 South Hope Street
Los Angeles, CA 90071-1406
Transfer agent for shareholder accounts
American Funds Service Company
(Write to the address nearest you.)
P.O. Box 6007
Indianapolis, IN 46206-6007
P.O. Box 2280
Norfolk, VA 23501-2280
Custodian of assets
State Street Bank and Trust Company
One Lincoln Street
Boston, MA 02111-2900
Counsel
Dechert LLP
One Bush Street, Suite 1600
San Francisco, CA 94104-4446
Independent registered public accounting firm
Deloitte & Touche LLP
695 Town Center Drive
Suite 1000
Costa Mesa, CA 92626-7188
Principal underwriter
American Funds Distributors, Inc.
333 South Hope Street
Los Angeles, CA 90071-1406
| 44 | The Growth Fund of America |
Investors should carefully consider investment objectives, risks, charges and expenses. This and other important information is contained in the fund prospectus and summary prospectus, which can be obtained from your financial professional and should be read carefully before investing. You may also call American Funds Service Company (AFS) at (800) 421-4225 or visit the Capital Group website at capitalgroup.com.
“American Funds Proxy Voting Procedures and Principles” — which describes how we vote proxies relating to portfolio securities — is available on our website or upon request by calling AFS. The fund files its proxy voting record with the U.S. Securities and Exchange Commission (SEC) for the 12 months ended June 30 by August 31. The proxy voting record is available free of charge on the SEC website at sec.gov and on our website.
The Growth Fund of America files a complete list of its portfolio holdings with the SEC for the first and third quarters of each fiscal year on Form NPORT-P. The list of portfolio holdings is available free of charge on the SEC website and on our website.
This report is for the information of shareholders of The Growth Fund of America, but it also may be used as sales literature when preceded or accompanied by the current prospectus or summary prospectus, which gives details about charges, expenses, investment objectives and operating policies of the fund. If used as sales material after December 31, 2022, this report must be accompanied by an American Funds statistical update for the most recently completed calendar quarter.
The S&P 500 Index is a product of S&P Dow Jones Indices LLC and/or its affiliates and has been licensed for use by Capital Group. Copyright © 2022 S&P Dow Jones Indices LLC, a division of S&P Global, and/or its affiliates. All rights reserved. Redistribution or reproduction in whole or in part are prohibited without written permission of S&P Dow Jones Indices LLC.
American Funds Distributors, Inc., member FINRA.
The Capital Advantage®
Since 1931, Capital Group, home of American Funds, has helped investors pursue long-term investment success. Our consistent approach — in combination with The Capital SystemTM — has resulted in superior outcomes.
| | Aligned with investor success |
| | We base our decisions on a long-term perspective, which we believe aligns our goals with the interests of our clients. Our portfolio managers average 27 years of investment industry experience, including 21 years at our company, reflecting a career commitment to our long-term approach.1 |
| | |
| | The Capital System |
| | The Capital System combines individual accountability with teamwork. Funds using The Capital System are divided into portions that are managed independently by investment professionals with diverse backgrounds, ages and investment approaches. An extensive global research effort is the backbone of our system. |
| | |
| | American Funds’ superior outcomes |
| | Equity funds have beaten their Lipper peer indexes in 90% of 10-year periods and 99% of 20-year periods.2 Fixed income funds have helped investors achieve diversification through attention to correlation between bonds and equities.3 Fund management fees have been among the lowest in the industry.4 |
| | 1 | Investment industry experience as of December 31, 2021. |
| | 2 | Based on Class F-2 share results for rolling calendar-year periods starting the first full calendar year after each fund’s inception through December 31, 2021. Periods covered are the shorter of the fund’s lifetime or since the comparable Lipper index inception date (except Capital Income Builder and SMALLCAP World Fund, for which the Lipper average was used). Expenses differ for each share class, so results will vary. |
| | 3 | Based on Class F-2 share results as of December 31, 2021. Thirteen of the 17 fixed income American Funds that have been in existence for the three-year period showed a three-year correlation below 0.3. S&P 500 Index was used as an equity market proxy. Correlation based on monthly total returns. Correlation is a statistical measure of how two securities move in relation to each other. A correlation ranges from –1 to 1. A positive correlation close to 1 implies that as one security moves, either up or down, the other security will move in “lockstep,” in the same direction. A negative correlation close to –1 indicates that the securities have moved in the opposite direction. |
| | 4 | On average, our management fees were in the lowest quintile 63% of the time, based on the 20-year period ended December 31, 2021, versus comparable Lipper categories, excluding funds of funds. |
Class F-2 shares were first offered on August 1, 2008. Class F-2 share results prior to the date of first sale are hypothetical based on the results of the original share class of the fund without a sales charge, adjusted for typical estimated expenses. Results for certain funds with an inception date after August 1, 2008, also include hypothetical returns because those funds’ Class F-2 shares sold after the funds’ date of first offering. Visit capitalgroup.com for more information on specific expense adjustments and the actual dates of first sale.
All Capital Group trademarks mentioned are owned by The Capital Group Companies, Inc., an affiliated company or fund. All other company and product names mentioned are the property of their respective companies.

ITEM 2 – Code of Ethics
The Registrant has adopted a Code of Ethics that applies to its Principal Executive Officer and Principal Financial Officer. The Registrant undertakes to provide to any person without charge, upon request, a copy of the Code of Ethics. Such request can be made by calling 800/421-4225 or to the Secretary of the Registrant, 6455 Irvine Center Drive, Irvine, California 92618.
ITEM 3 – Audit Committee Financial Expert
The Registrant’s board has determined that Linda Griego, a member of the Registrant’s audit committee, is an “audit committee financial expert” and "independent," as such terms are defined in this Item. This designation will not increase the designee’s duties, obligations or liability as compared to his or her duties, obligations and liability as a member of the audit committee and of the board, nor will it reduce the responsibility of the other audit committee members. There may be other individuals who, through education or experience, would qualify as "audit committee financial experts" if the board had designated them as such. Most importantly, the board believes each member of the audit committee contributes significantly to the effective oversight of the Registrant’s financial statements and condition.
ITEM 4 – Principal Accountant Fees and Services
| a) Audit Fees: | | |
| Audit | 2021 | 123,000 |
| | 2022 | 8,000 |
| | | |
| b) Audit-Related Fees: | | |
| | 2021 | 34,000 |
| | 2022 | 43,000 |
| | | |
| c) Tax Fees: | | |
| | 2021 | 12,000 |
| | 2022 | 11,000 |
| | The tax fees consist of professional services relating to the preparation of the Registrant’s tax returns. | |
| | | |
| d) All Other Fees: | | |
| | 2021 | None |
| | 2022 | None |
| | | |
| | Adviser and affiliates (includes only fees for non-audit services billed to the adviser and affiliates for engagements that relate directly to the operations and financial reporting of the Registrant and were subject to the pre-approval policies described below): | |
| a) Audit Fees: | | |
| | Not Applicable | |
| | | |
| b) Audit-Related Fees: | | |
| | 2021 | 1,341,000 |
| | 2022 | 2,168,000 |
| | The audit-related fees consist of assurance and related services relating to the examination of the Registrant’s transfer agent, principal underwriter and investment adviser conducted in accordance with Statement on Standards for Attestation Engagements Number 18 issued by the American Institute of Certified Public Accountants. | |
| | | |
| c) Tax Fees: | | |
| | 2021 | 1,000 |
| | 2022 | 394,000 |
| | The tax fees consist of consulting services relating to the Registrant’s investments. | |
| | | |
| | | |
| d) All Other Fees: | | |
| | 2021 | 2,000 |
| | 2022 | None |
| | The other fees consist of subscription services related to an accounting research tool. | |
| | | |
| | | |
| | All audit and permissible non-audit services that the Registrant’s audit committee considers compatible with maintaining the independent registered public accounting firm’s independence are required to be pre-approved by the committee. The pre-approval requirement will extend to all non-audit services provided to the Registrant, the investment adviser, and any entity controlling, controlled by, or under common control with the investment adviser that provides ongoing services to the Registrant, if the engagement relates directly to the operations and financial reporting of the Registrant. The committee will not delegate its responsibility to pre-approve these services to the investment adviser. The committee may delegate to one or more committee members the authority to review and pre-approve audit and permissible non-audit services. Actions taken under any such delegation will be reported to the full committee at its next meeting. The pre-approval requirement is waived with respect to non-audit services if certain conditions are met. The pre-approval requirement was not waived for any of the non-audit services listed above provided to the Registrant, adviser and affiliates. | |
| | | |
| | Aggregate non-audit fees paid to the Registrant’s auditors, including fees for all services billed to the Registrant, adviser and affiliates that provide ongoing services to the Registrant, were $1,389,000 for fiscal year 2021 and $2,616,000 for fiscal year 2022. The non-audit services represented by these amounts were brought to the attention of the committee and considered to be compatible with maintaining the auditors’ independence. | |
ITEM 5 – Audit Committee of Listed Registrants
Not applicable to this Registrant, insofar as the Registrant is not a listed issuer as defined in Rule 10A-3 under the Securities Exchange Act of 1934.
ITEM 6 – Schedule of Investments
Not applicable, insofar as the schedule is included as part of the report to shareholders filed under Item 1 of this Form.
ITEM 7 – Disclosure of Proxy Voting Policies and Procedures for Closed-End Management Investment Companies
Not applicable to this Registrant, insofar as the Registrant is not a closed-end management investment company.
ITEM 8 – Portfolio Managers of Closed-End Management Investment Companies
Not applicable to this Registrant, insofar as the Registrant is not a closed-end management investment company.
ITEM 9 – Purchases of Equity Securities by Closed-End Management Investment Company and Affiliated Purchasers
Not applicable to this Registrant, insofar as the Registrant is not a closed-end management investment company.
ITEM 10 – Submission of Matters to a Vote of Security Holders
There have been no material changes to the procedures by which shareholders may recommend nominees to the Registrant’s board of trustees since the Registrant last submitted a proxy statement to its shareholders. The procedures are as follows. The Registrant has a nominating and governance committee comprised solely of persons who are not considered ‘‘interested persons’’ of the Registrant within the meaning of the Investment Company Act of 1940, as amended. The committee periodically reviews such issues as the board’s composition, responsibilities, committees, compensation and other relevant issues, and recommends any appropriate changes to the full board of trustees. While the committee normally is able to identify from its own resources an ample number of qualified candidates, it will consider shareholder suggestions of persons to be considered as nominees to fill future vacancies on the board. Such suggestions must be sent in writing to the nominating and governance committee of the Registrant, c/o the Registrant’s Secretary, and must be accompanied by complete biographical and occupational data on the prospective nominee, along with a written consent of the prospective nominee for consideration of his or her name by the nominating and governance committee.
ITEM 11 – Controls and Procedures
| (a) | The Registrant’s Principal Executive Officer and Principal Financial Officer have concluded, based on their evaluation of the Registrant’s disclosure controls and procedures (as such term is defined in Rule 30a-3 under the Investment Company Act of 1940), that such controls and procedures are adequate and reasonably designed to achieve the purposes described in paragraph (c) of such rule. |
| | |
| (b) | There were no changes in the Registrant’s internal controls over financial reporting (as defined in Rule 30a-3(d) under the Investment Company Act of 1940) that occurred during the Registrant’s semi-annual period covered by this report that has materially affected, or is reasonably likely to materially affect, the Registrant’s internal control over financial reporting. |
ITEM 12 – Exhibits
| (a)(1) | The Code of Ethics that is the subject of the disclosure required by Item 2 is attached as an exhibit hereto. |
| | |
| (a)(2) | The certifications required by Rule 30a-2 of the Investment Company Act of 1940 and Sections 302 and 906 of the Sarbanes-Oxley Act of 2002 are attached as exhibits hereto. |
SIGNATURES
Pursuant to the requirements of the Securities Exchange Act of 1934 and the Investment Company Act of 1940, the Registrant has duly caused this report to be signed on its behalf by the undersigned, thereunto duly authorized.
| | THE GROWTH FUND OF AMERICA |
| | |
| | By __/s/ Walter R. Burkley________________ |
| | Walter R. Burkley, Principal Executive Officer |
| | |
| | Date: October 31, 2022 |
Pursuant to the requirements of the Securities Exchange Act of 1934 and the Investment Company Act of 1940, this report has been signed below by the following persons on behalf of the Registrant and in the capacities and on the dates indicated.
| By _ /s/ Walter R. Burkley_____________ |
Walter R. Burkley, Principal Executive Officer |
| |
| Date: October 31, 2022 |
| By ___/s/ Hong T. Le__________________ |
Hong T. Le, Treasurer and Principal Financial Officer |
| |
| Date: October 31, 2022 |