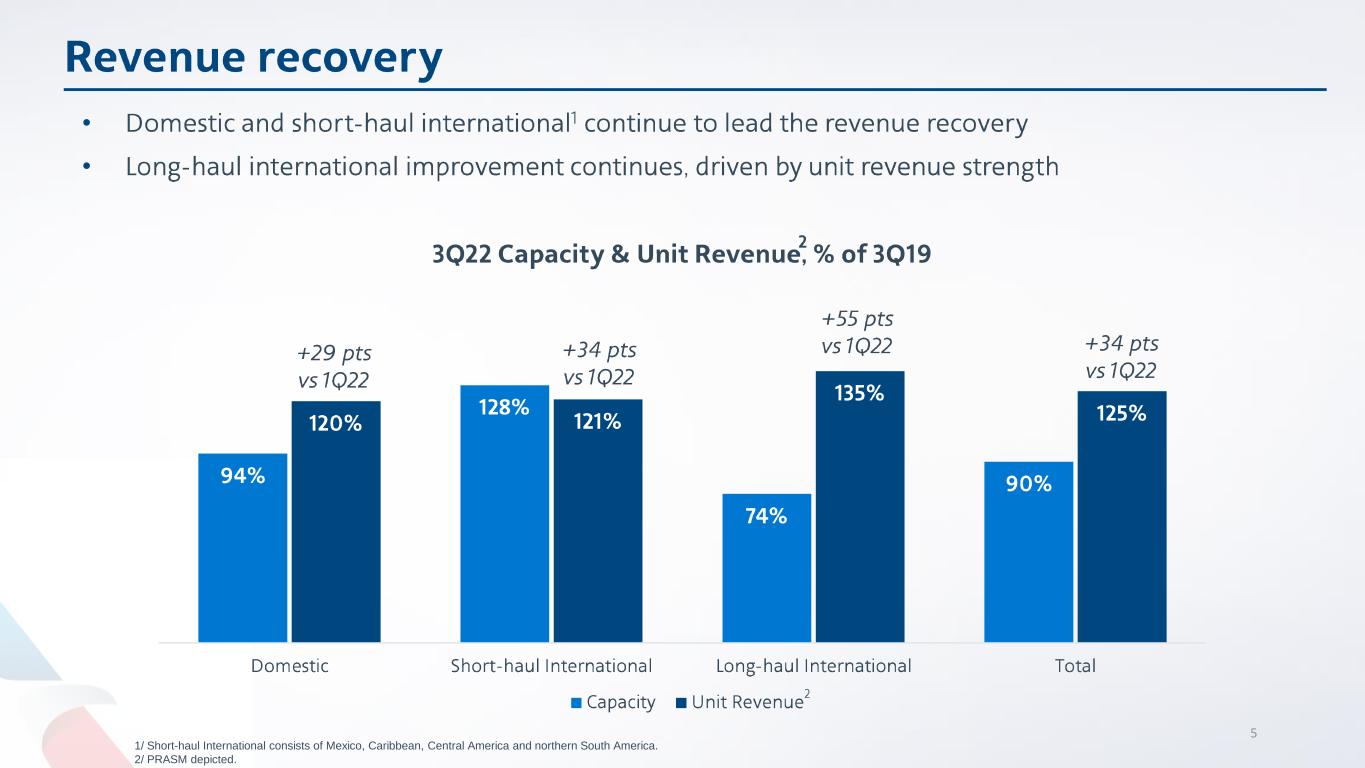
5 1/ Short-haul International consists of Mexico, Caribbean, Central America and northern South America. 2/ PRASM depicted. • •

• • • • • • 1/ Total debt includes debt, finance leases, operating lease liability and pension obligations.
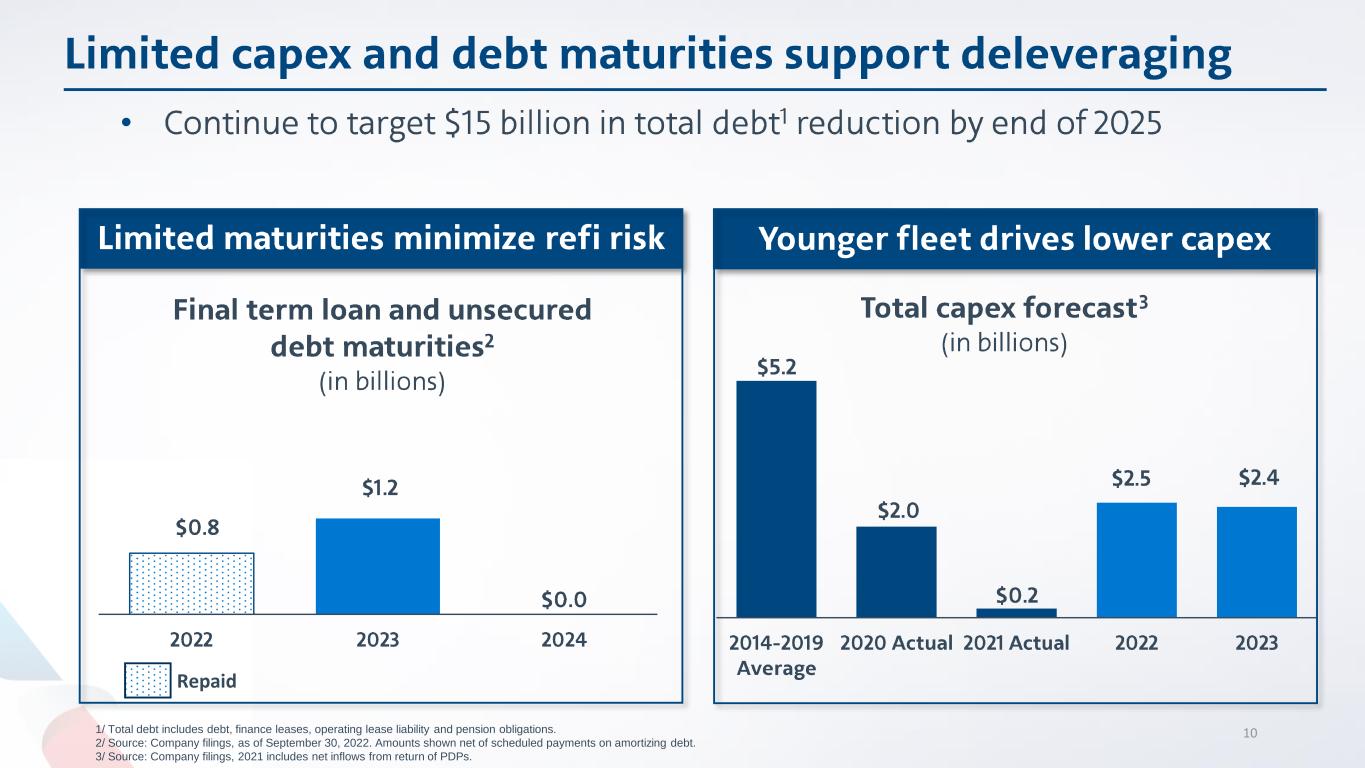
Repaid 1/ Total debt includes debt, finance leases, operating lease liability and pension obligations. 2/ Source: Company filings, as of September 30, 2022. Amounts shown net of scheduled payments on amortizing debt. 3/ Source: Company filings, 2021 includes net inflows from return of PDPs. 10 •
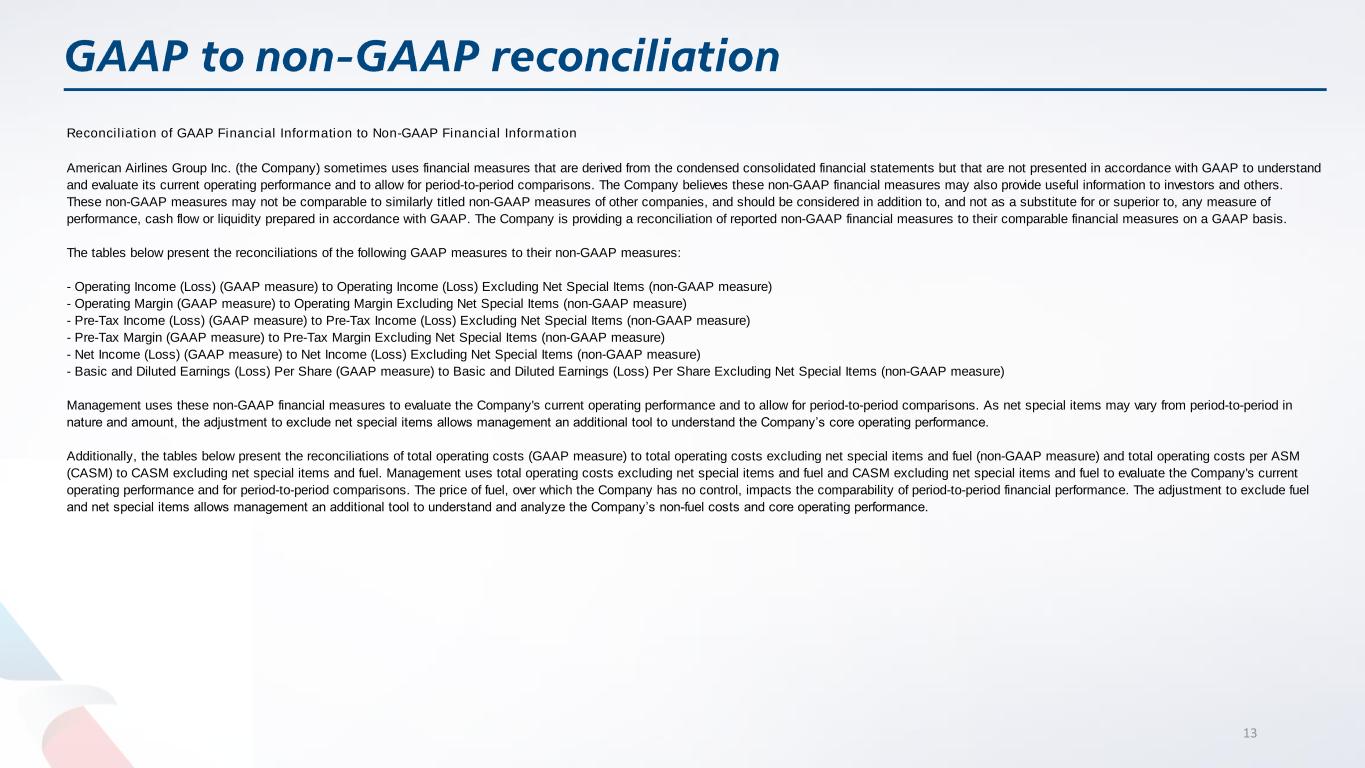
13 Reconciliation of GAAP Financial Information to Non-GAAP Financial Information American Airlines Group Inc. (the Company) sometimes uses financial measures that are derived from the condensed consolidated financial statements but that are not presented in accordance with GAAP to understand and evaluate its current operating performance and to allow for period-to-period comparisons. The Company believes these non-GAAP financial measures may also provide useful information to investors and others. These non-GAAP measures may not be comparable to similarly titled non-GAAP measures of other companies, and should be considered in addition to, and not as a substitute for or superior to, any measure of performance, cash flow or liquidity prepared in accordance with GAAP. The Company is providing a reconciliation of reported non-GAAP financial measures to their comparable financial measures on a GAAP basis. The tables below present the reconciliations of the following GAAP measures to their non-GAAP measures: - Operating Income (Loss) (GAAP measure) to Operating Income (Loss) Excluding Net Special Items (non-GAAP measure) - Operating Margin (GAAP measure) to Operating Margin Excluding Net Special Items (non-GAAP measure) - Pre-Tax Income (Loss) (GAAP measure) to Pre-Tax Income (Loss) Excluding Net Special Items (non-GAAP measure) - Pre-Tax Margin (GAAP measure) to Pre-Tax Margin Excluding Net Special Items (non-GAAP measure) - Net Income (Loss) (GAAP measure) to Net Income (Loss) Excluding Net Special Items (non-GAAP measure) - Basic and Diluted Earnings (Loss) Per Share (GAAP measure) to Basic and Diluted Earnings (Loss) Per Share Excluding Net Special Items (non-GAAP measure) Management uses these non-GAAP financial measures to evaluate the Company's current operating performance and to allow for period-to-period comparisons. As net special items may vary from period-to-period in nature and amount, the adjustment to exclude net special items allows management an additional tool to understand the Company’s core operating performance. Additionally, the tables below present the reconciliations of total operating costs (GAAP measure) to total operating costs excluding net special items and fuel (non-GAAP measure) and total operating costs per ASM (CASM) to CASM excluding net special items and fuel. Management uses total operating costs excluding net special items and fuel and CASM excluding net special items and fuel to evaluate the Company's current operating performance and for period-to-period comparisons. The price of fuel, over which the Company has no control, impacts the comparability of period-to-period financial performance. The adjustment to exclude fuel and net special items allows management an additional tool to understand and analyze the Company’s non-fuel costs and core operating performance.
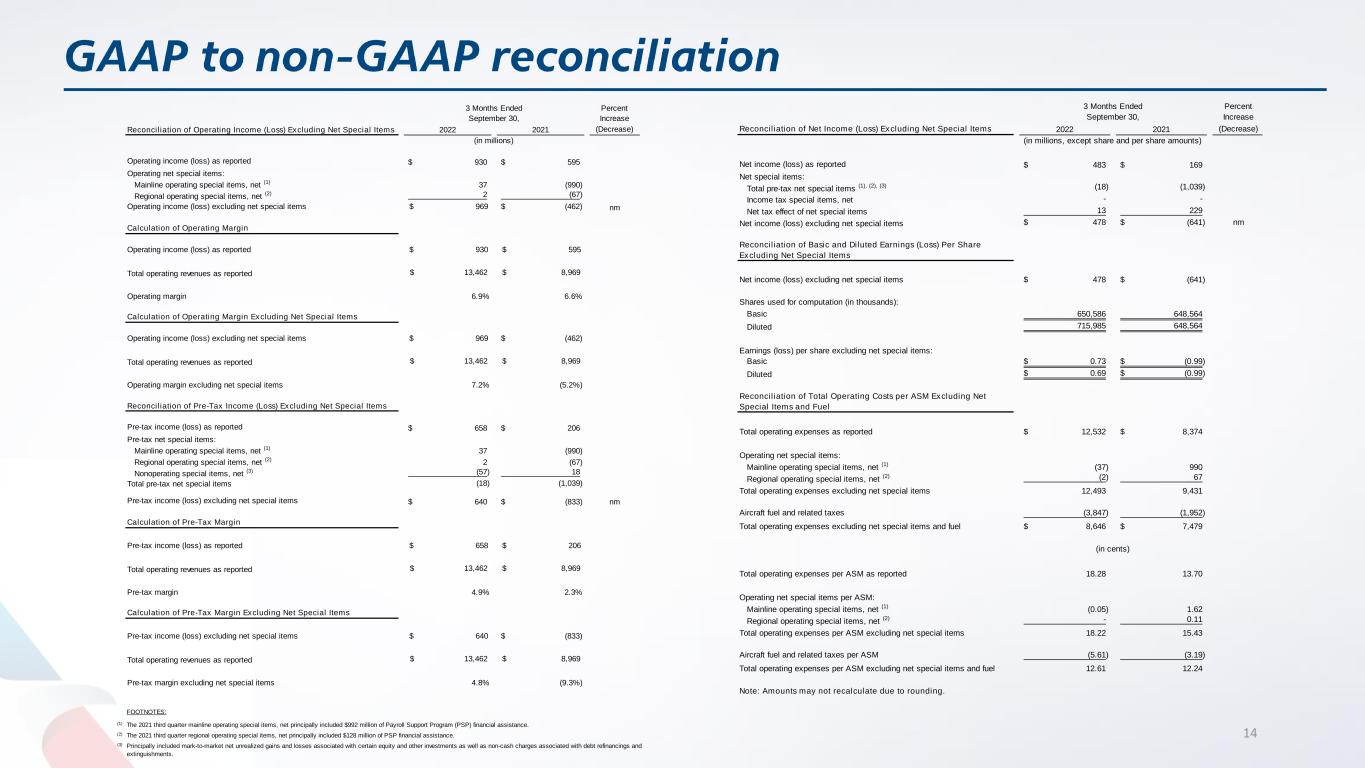
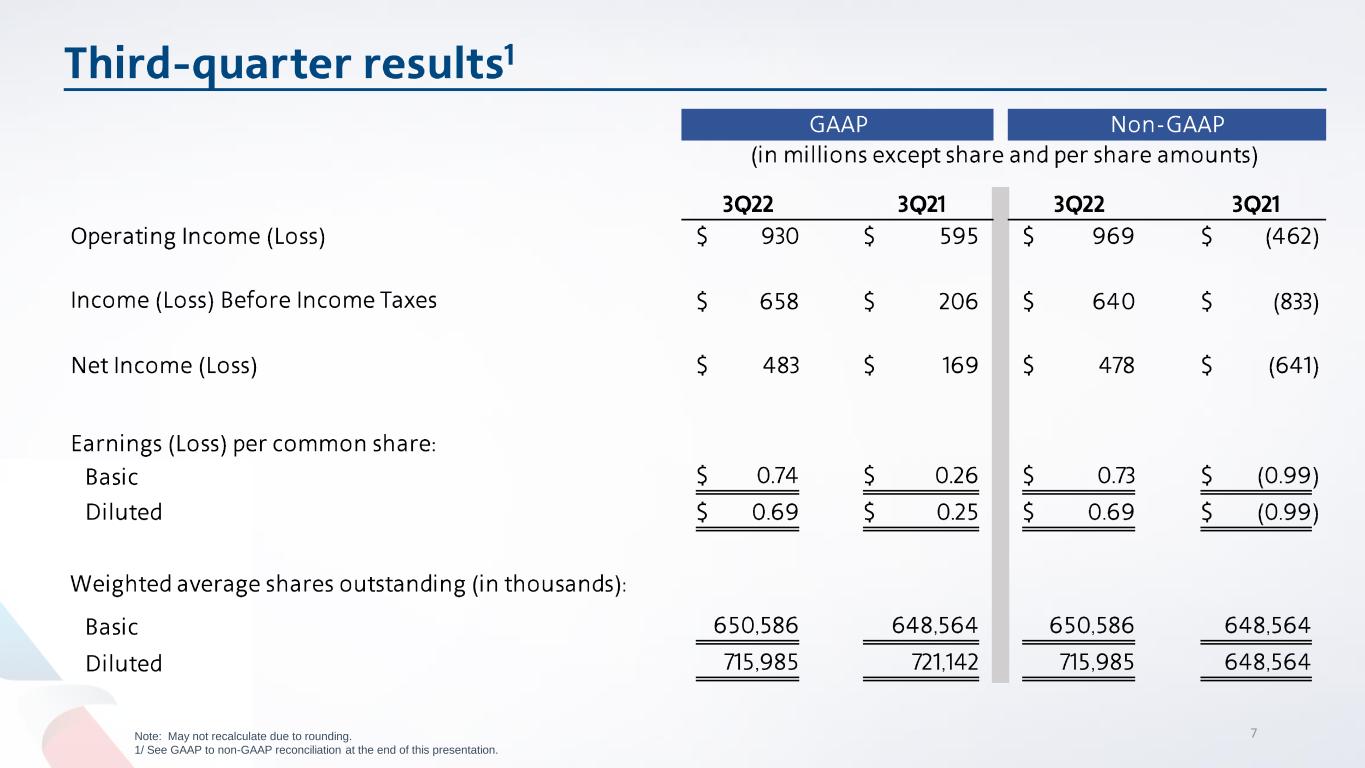
14 Percent Increase Reconciliation of Net Income (Loss) Excluding Net Special Items 2022 2021 (Decrease) Net income (loss) as reported 483$ 169$ Net special items: Total pre-tax net special items (1), (2), (3) (18) (1,039) Income tax special items, net - - Net tax effect of net special items 13 229 Net income (loss) excluding net special items 478$ (641)$ nm Reconciliation of Basic and Diluted Earnings (Loss) Per Share Excluding Net Special Items Net income (loss) excluding net special items 478$ (641)$ Shares used for computation (in thousands): Basic 650,586 648,564 Diluted 715,985 648,564 Earnings (loss) per share excluding net special items: Basic 0.73$ (0.99)$ Diluted 0.69$ (0.99)$ Reconciliation of Total Operating Costs per ASM Excluding Net Special Items and Fuel Total operating expenses as reported 12,532$ 8,374$ Operating net special items: Mainline operating special items, net (1) (37) 990 Regional operating special items, net (2) (2) 67 Total operating expenses excluding net special items 12,493 9,431 Aircraft fuel and related taxes (3,847) (1,952) Total operating expenses excluding net special items and fuel 8,646$ 7,479$ Total operating expenses per ASM as reported 18.28 13.70 Operating net special items per ASM: Mainline operating special items, net (1) (0.05) 1.62 Regional operating special items, net (2) - 0.11 Total operating expenses per ASM excluding net special items 18.22 15.43 Aircraft fuel and related taxes per ASM (5.61) (3.19) Total operating expenses per ASM excluding net special items and fuel 12.61 12.24 Note: Amounts may not recalculate due to rounding. (in millions, except share and per share amounts) (in cents) 3 Months Ended September 30, FOOTNOTES: (1) (2) (3) The 2021 third quarter mainline operating special items, net principally included $992 million of Payroll Support Program (PSP) financial assistance. Principally included mark-to-market net unrealized gains and losses associated with certain equity and other investments as well as non-cash charges associated with debt refinancings and extinguishments. The 2021 third quarter regional operating special items, net principally included $128 million of PSP financial assistance. Percent Increase Reconciliation of Operating Income (Loss) Excluding Net Special Items 2022 2021 (Decrease) Operating income (loss) as reported 930$ 595$ Operating net special items: Mainline operating special items, net (1) 37 (990) Regional operating special items, net (2) 2 (67) Operating income (loss) excluding net special items $ 969 $ (462) nm Calculation of Operating Margin Operating income (loss) as reported $ 930 $ 595 Total operating revenues as reported $ 13,462 $ 8,969 Operating margin 6.9% 6.6% Calculation of Operating Margin Excluding Net Special Items Operating income (loss) excluding net special items $ 969 $ (462) Total operating revenues as reported $ 13,462 $ 8,969 Operating margin excluding net special items 7.2% (5.2%) Reconciliation of Pre-Tax Income (Loss) Excluding Net Special Items Pre-tax income (loss) as reported 658$ 206$ Pre-tax net special items: Mainline operating special items, net (1) 37 (990) Regional operating special items, net (2) 2 (67) Nonoperating special items, net (3) (57) 18 Total pre-tax net special items (18) (1,039) Pre-tax income (loss) excluding net special items 640$ (833)$ nm Calculation of Pre-Tax Margin Pre-tax income (loss) as reported $ 658 $ 206 Total operating revenues as reported $ 13,462 $ 8,969 Pre-tax margin 4.9% 2.3% Calculation of Pre-Tax Margin Excluding Net Special Items Pre-tax income (loss) excluding net special items $ 640 $ (833) Total operating revenues as reported $ 13,462 $ 8,969 Pre-tax margin excluding net special items 4.8% (9.3%) (in millions) 3 Months Ended September 30,

