 November 6, 2014 Raymond James 2014 Global Airline & Transportation Conference Derek Kerr Chief Financial Officer American Airlines Group Inc. Exhibit 99.1 |
 2 Cautionary Statement Regarding Forward-Looking Statements and Information This document includes forward-looking statements within the meaning of the Private Securities Litigation Reform Act of 1995. These forward-looking statements may be identified by words such as “may,” “will,” “expect,” “intend,” “anticipate,” “believe,” “estimate,” “plan,” “project,” “could,” “should,” “would,” “continue,” “seek,” “target,” “guidance,” “outlook,” “if current trends continue,” “optimistic,” “forecast” and other similar words. Such statements include, but are not limited to, statements about future financial and operating results, our plans, objectives, estimates, expectations and intentions, and other statements that are not historical facts. These forward-looking statements are based on the current objectives, beliefs and expectations of the Company, and they are subject to significant risks and uncertainties that may cause actual results and financial position and timing of certain events to differ materially from the information in the forward-looking statements. The following factors, among others, could cause actual results and financial position and timing of certain events to differ materially from those described in the forward-looking statements: significant operating losses in the future; downturns in economic conditions that adversely affect the Company’s business; the impact of continued periods of high volatility in fuel costs, increased fuel prices and significant disruptions in the supply of aircraft fuel; competitive practices in the industry, including the impact of low cost carriers, airline alliances and industry consolidation; the challenges and costs of integrating operations and realizing anticipated synergies and other benefits of the merger transaction with US Airways Group, Inc.; the Company’s substantial indebtedness and other obligations and the effect they could have on the Company’s business and liquidity; an inability to obtain sufficient financing or other capital to operate successfully and in accordance with the Company’s current business plan; increased costs of financing, a reduction in the availability of financing and fluctuations in interest rates; the effect the Company’s high level of fixed obligations may have on its ability to fund general corporate requirements, obtain additional financing and respond to competitive developments and adverse economic and industry conditions; the Company’s significant pension and other post- employment benefit funding obligations; the impact of any failure to comply with the covenants contained in financing arrangements; provisions in credit card processing and other commercial agreements that may materially reduce the Company’s liquidity; the limitations of the Company’s historical consolidated financial information, which is not directly comparable to its financial information for prior or future periods; the impact of union disputes, employee strikes and other labor-related disruptions; any inability to maintain labor costs at competitive levels; interruptions or disruptions in service at one or more of the Company’s hub airports; any inability to obtain and maintain adequate facilities, infrastructure and slots to operate the Company’s flight schedule and expand or change its route network; the Company’s reliance on third-party regional operators or third-party service providers that have the ability to affect the Company’s revenue and the public’s perception about its services; any inability to effectively manage the costs, rights and functionality of third-party distribution channels on which the Company relies; extensive government regulation, which may result in increases in the Company’s costs, disruptions to the Company’s operations, limits on the Company’s operating flexibility, reductions in the demand for air travel, and competitive disadvantages; the impact of the heavy taxation to which the airline industry is subject; changes to the Company’s business model that may not successfully increase revenues and may cause operational difficulties or decreased demand; the loss of key personnel or inability to attract and retain additional qualified personnel; the impact of conflicts overseas, terrorist attacks and ongoing security concerns; the global scope of the Company’s business and any associated economic and political instability or adverse effects of events, circumstances or government actions beyond its control, including the impact of foreign currency exchange rate fluctuations and limitations on the repatriation of cash held in foreign countries; the impact of environmental regulation; the Company’s reliance on technology and automated systems and the impact of any failure of these technologies or systems; challenges in integrating the Company’s computer, communications and other technology systems; costs of ongoing data security compliance requirements and the impact of any significant data security breach; losses and adverse publicity stemming from any accident involving any of the Company’s aircraft or the aircraft of its regional or codeshare operators; delays in scheduled aircraft deliveries, or other loss of anticipated fleet capacity, and failure of new aircraft to perform as expected; the Company’s dependence on a limited number of suppliers for aircraft, aircraft engines and parts; the impact of changing economic and other conditions beyond the Company’s control, including global events that affect travel behavior such as an outbreak of a contagious disease, and volatility and fluctuations in the Company’s results of operations due to seasonality; the effect of a higher than normal number of pilot retirements and a potential shortage of pilots; the impact of possible future increases in insurance costs or reductions in available insurance coverage; the effect of several lawsuits that were filed in connection with the merger transaction with US Airways Group, Inc. and remain pending; an inability to use NOL carryforwards; any impairment in the amount of goodwill the Company recorded as a result of the application of the acquisition method of accounting and an inability to realize the full value of the Company’s and American Airlines’ respective intangible or long-lived assets and any material impairment charges that would be recorded as a result; price volatility of the Company’s common stock; delay or prevention of stockholders’ ability to change the composition of the Company’s board of directors and the effect this may have on takeover attempts that some of the Company’s stockholders might consider beneficial; the effect of provisions of the Company’s Certificate of Incorporation and Bylaws that limit ownership and voting of its equity interests, including its common stock; the effect of limitations in the Company’s Certificate of Incorporation on acquisitions and dispositions of its common stock designed to protect its NOL carryforwards and certain other tax attributes, which may limit the liquidity of its common stock; and other economic, business, competitive, and/or regulatory factors affecting the Company’s business, including those set forth in the Company’s quarterly report on Form 10-Q for the period ending September 30, 2014 (especially in the “Risk Factors” and “Management’s Discussion and Analysis of Financial Condition and Results of Operations” sections) and other risks and uncertainties listed from time to time in the Company’s filings with the SEC. Any forward-looking statements speak only as of the date hereof or as of the dates indicated in the statements. The Company does not assume any obligation to publicly update or supplement any forward-looking statement to reflect actual results, changes in assumptions or changes in other factors affecting these forward- looking statements except as required by law. |
 3 Introduction Source: Company reports. * Excludes net special items. Please refer to the GAAP to non-GAAP reconciliation at the end of this document. • A record breaking quarter: - Record 3Q profit* of $1.2 billion - All-time record GAAP net profit of $942 million - Record 3Q revenues: $11.1 billion - Record 3Q PRASM: 14.12 cents - Record 3Q Yield: 16.93 cents • After a difficult summer, operational performance is starting to show improvements • Returned $185 million to shareholders in the third quarter by buying back shares and paying a $0.10 per share dividend • While still early, integration has gone smoothly and teams continue to work well together combining the two networks • Anticipate record 4Q and FY 2014 earnings |
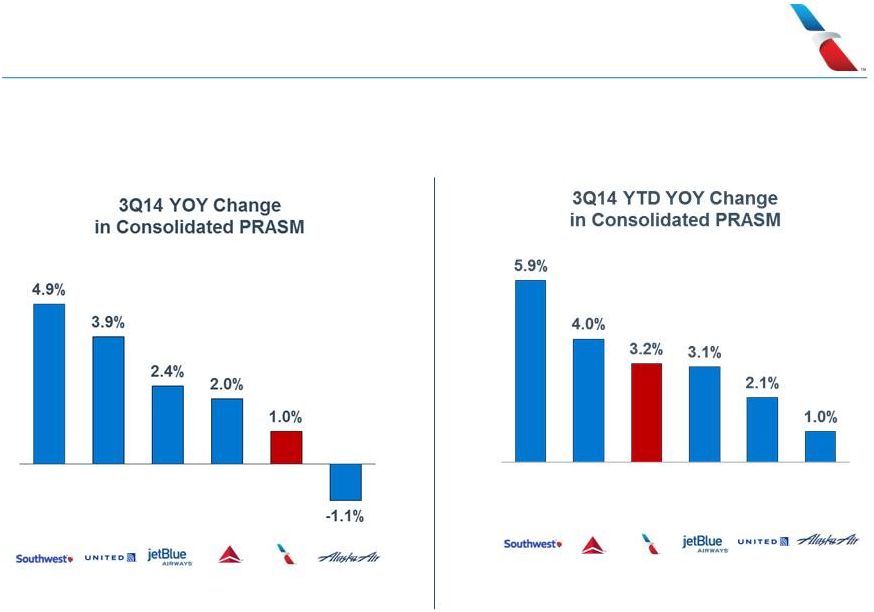 3Q Consolidated Passenger RASM 4 • Despite higher ASM growth and pressure in Latin America, American’s PRASM growth remains positive Source: Company reports |
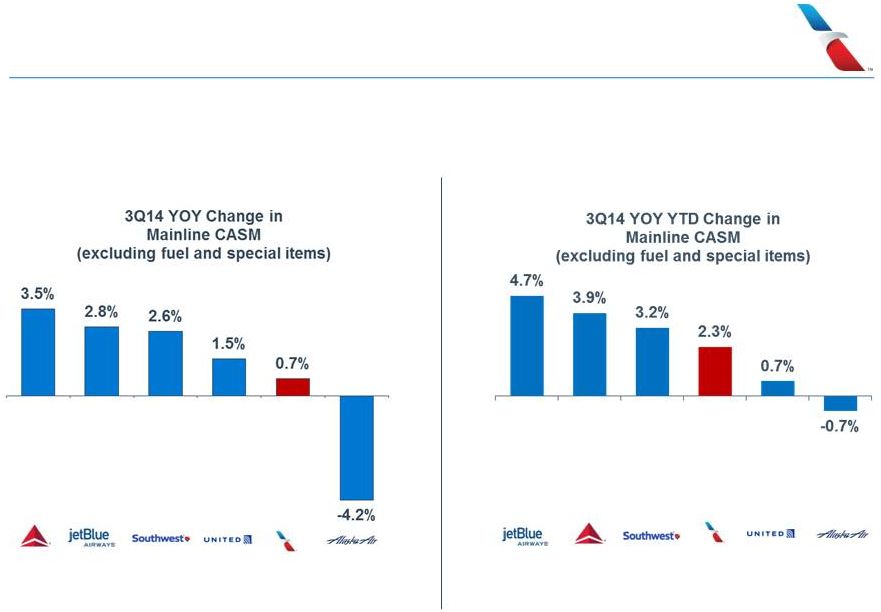 3Q Mainline CASM Performance 5 • Despite the impact of higher labor expenses, third quarter mainline CASM excluding fuel and special items was only up 0.7% YOY Source: Company reports. Excludes net special items. Please refer to the GAAP to Non-GAAP reconciliation at the end of this document |
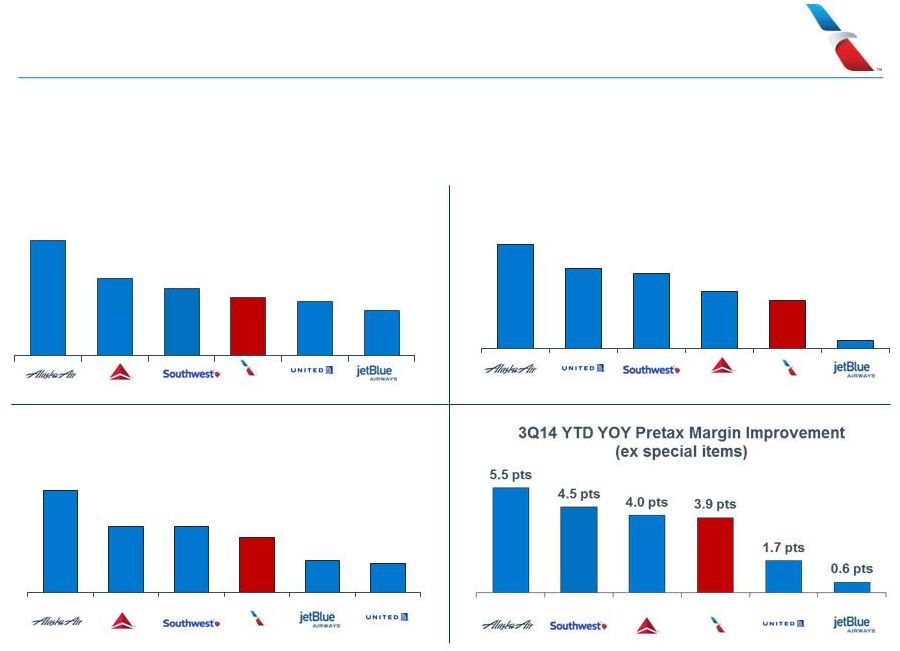 3Q Pretax Margin 6 • American’s pretax margin is already in line with peers Source: Company reports. Excludes net special items. Please refer to the GAAP to Non-GAAP reconciliation at the end of this document 21.8% 14.6% 12.7% 11.0% 10.2% 8.6% 3Q14 Pretax Margin (ex special items) 5.7 pts 4.4 pts 4.1 pts 3.1 pts 2.6 pts 0.4 pts 3Q14 YOY Pretax Margin Improvement (ex special items) 17.6% 11.5% 11.4% 9.5% 5.5% 5.0% 3Q14 YTD Pretax Margin (ex special items) |
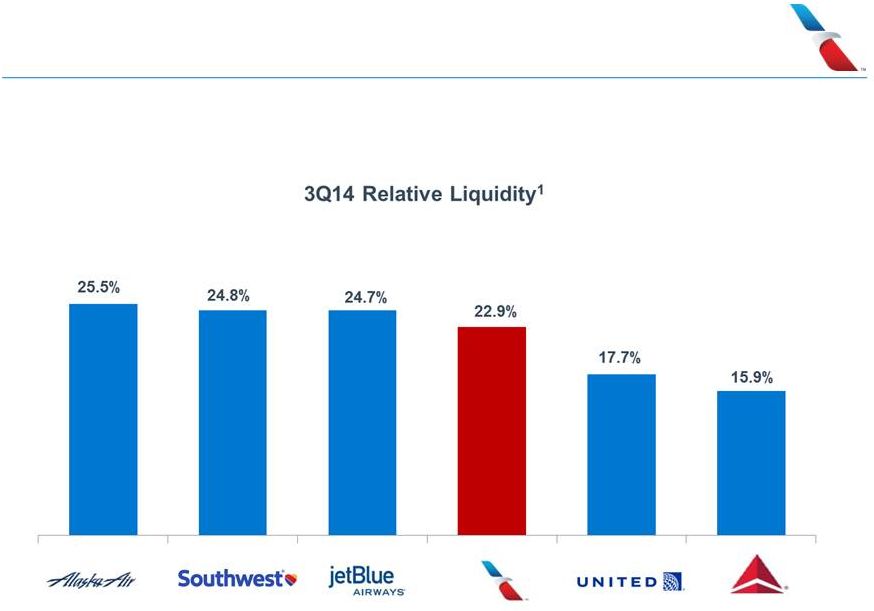 Total Relative Liquidity Position American had $9.8B in available liquidity, or 23% of LTM Revenues at the end of the third quarter Source: Company reports. 1. Data includes total on balance sheet cash as of September 30, 2014 plus available undrawn revolver capacity at that date. In October 2014, AAL increased its undrawn revolving credit capacity by $800 million, bringing the total undrawn revolving credit facility to $1.8 billion |
 Integration Update – Early Results Encouraging • US Airways launched a codeshare with BA, IB, Air Berlin and Finnair, fully integrating it into the Trans- Atlantic Joint Business Agreement • Announced a combined frequent flyer program for 2015 • Reached a tentative agreement with the Association of Professional Flight Attendants on a joint collective bargaining agreement • Recalibrated Miami schedule to increase the number of available connections and optimize revenue • Combined operations at 82 airports, including ORD • Broke ground on the state of the art Robert W. Baker Integrated Operations Center • Aligned award travel options, checked baggage policies and inflight services for First and Business Class customers • Made significant progress towards a Single Operating Certificate (SOC) |
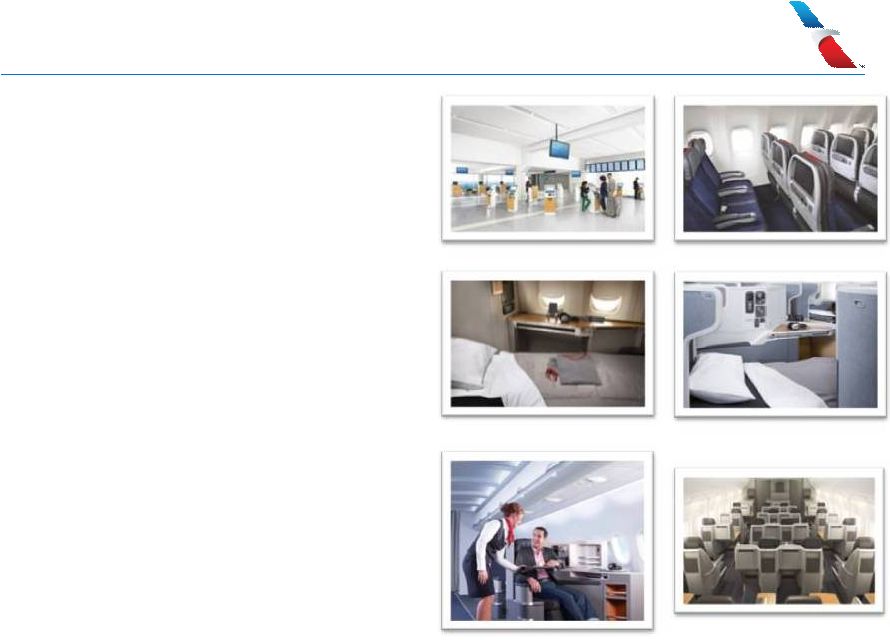 Investments in Our Product 9 • Improved check-in areas • Narrowbody standardization • Widebody aircraft retrofits • A321 Transcontinental - New fully lie-flat, all-aisle access Business Class seat - International Wi-Fi - AC power outlets and USB power - Walk-up bar - Enhanced in-seat entertainment - Main Cabin Extra seating - Fully lie-flat seats in First and Business - All-aisle access in First Class - Main Cabin Extra seating - AC power outlets and USB power - Personal in-seat entertainment |
 Fleet Replacement Plan 10 • American will have one of the most modern and fuel efficient fleets in the industry Combined AAG order book as of September 30, 2014 2014 2015 2016 2017 2018 Beyond 2018 Total A320 Family 53 42 25 20 - - 140 A320 Family Neo - - - 10 25 65 100 A330-200 3 - - - - - 3 A350-900 - - - 6 10 6 22 B737-800 20 18 20 20 - - 78 B737-8 Max - - - 3 17 80 100 B777-300ER 6 2 2 - - - 10 B787 Family 2 11 13 9 7 - 42 Mainline Total 84 73 60 68 59 151 495 Average Mainline Age (yrs) 12.3 11.1 10.3 9.9 10.1 CRJ-900 15 15 - - - - 30 E175 - 24 24 12 - - 60 Regional Total 15 39 24 12 - - 90 |
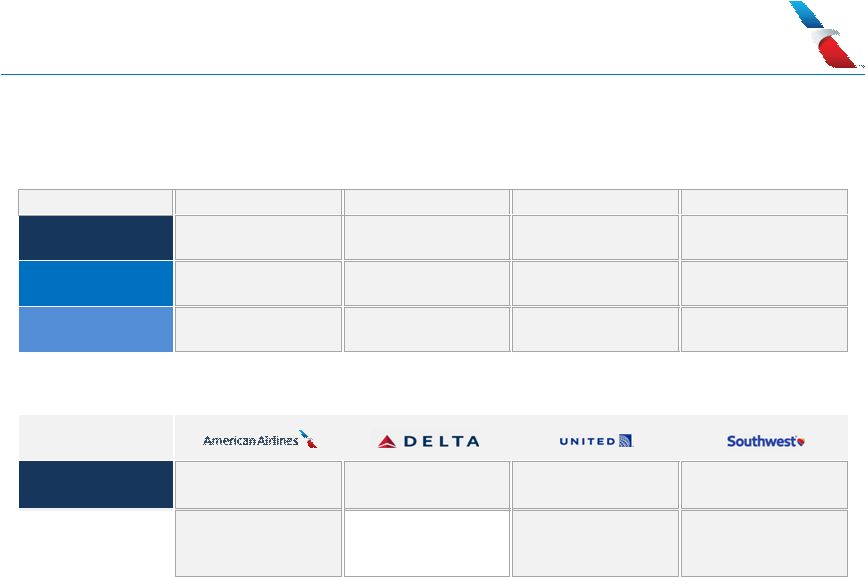   Retrofit Plan 11 • We are retrofitting our aircraft to add seats and bring them in line with industry standards Here are the facts on our planned retrofits Aircraft Type Current Configuration Retrofit Configuration Number of Aircraft Expected Completion Boeing 150 160 252 Phase 1: 4Q14 737-800 Seats Seats Aircraft Phase 2: 4Q15 Boeing 247 289 47 2Q 777-200 Seats Seats Aircraft 2016 Boeing 218 209 25 2Q 767-300 Seats Seats * Aircraft 2015 * The seat count on the B767-300 actually decreases because of the installation of fully lie-flat seats. How do we stack up to competitors with our retrofit projects? Aircraft Type Boeing 160 160 Up to 166 175 737-800 Seats Seats Seats Seats Boeing 777-200 International * United 777-200 aircraft is configured with 348 seats in select markets Up to 269 Seats* N/A 289 Seats 291 Seats |
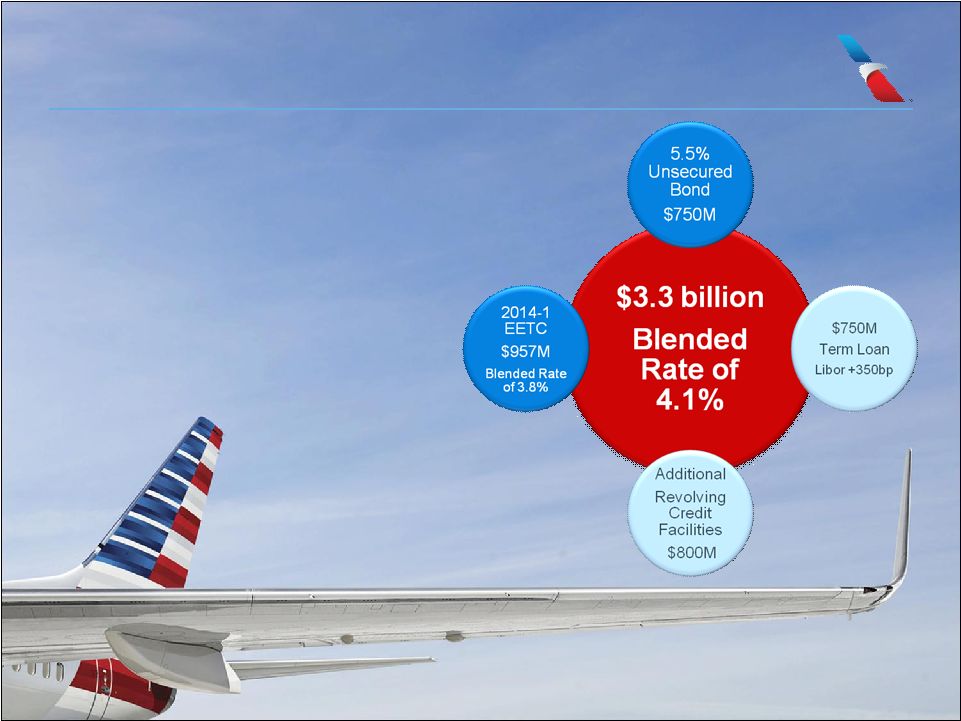 Financing Transactions 12 • The Company has taken advantage of attractive opportunities in the credit markets • At the same time, the Company has paid down higher cost debt • And reduced its average cost of capital |
 |
 4Q Outlook 14 • PRASM - 4Q PRASM expected to be approximately flat to up 2 percent - Excluding impact from Venezuela, 4Q PRASM up approximately 2 percent to 4 percent • CASM Excluding Fuel & Special Items - Mainline: +2 percent to +4 percent - Regional: flat to +2 percent • Fuel Price - Mainline: $2.56/gal to $2.61/gal - Regional: $2.60/gal to $2.65/gal • Pretax Margin Excluding Special Items - Approximately 10 percent to 12 percent 4Q Guidance Remains Unchanged from October 23 Earnings Call |
 15 American Long Term Vision Restore American to The Greatest Airline in the World Restore • Means we’ve been there before – tremendous asset • And it means that we know we’re not there yet – much work ahead Greatest • Hard to define, but certainly: - Airline customers want to fly - Airline where employees want to work - Airline where people want to invest Airline • Singular focus on running a great airline • Noble profession World • Global business |
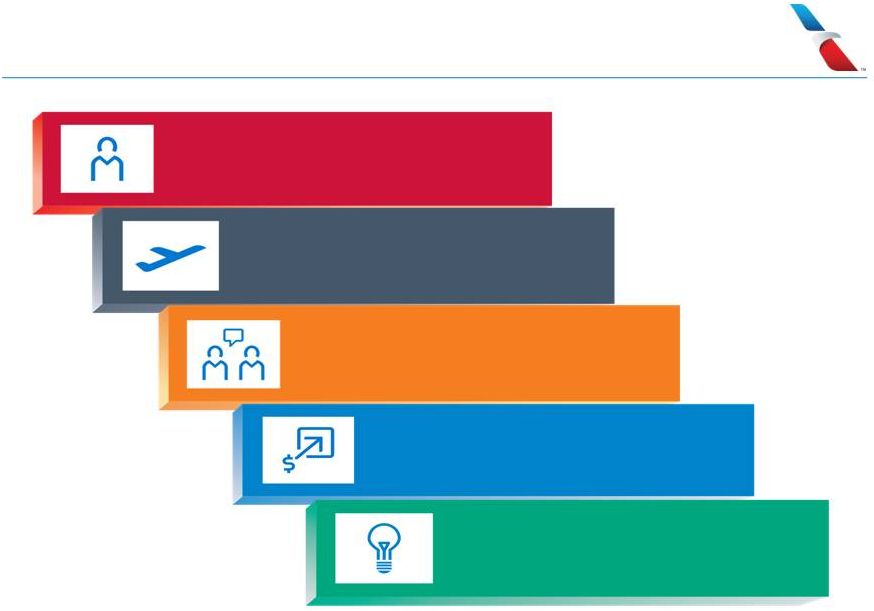 Five Imperatives Engage our team members. Ensure they have the tools and information they need to do the jobs they perform so well. Create an environment of coordinated, collaborative teamwork and mutual respect. Provide a return for our investors. As the largest airline in the world, we should be the most profitable. If not, investments will go to other airlines over ours and that is not a formula for success. Look to the future. Our industry is continuing to evolve and we need to ensure we are leading the change, not chasing it. 16 Focus on our customers’ needs and wants. Provide a network and a product that is as good or better than our competitors. Be an industry leader. Safe and reliable airline operations - It must be part of the fiber of our company. |
 17 Conclusion Source: Company reports. * Excludes net special items. Please refer to the GAAP to non-GAAP reconciliation at the end of this document. • A record breaking quarter: • After a difficult summer, operational performance is starting to show improvements • Returned $185 million to shareholders in the third quarter by buying back shares and paying a $0.10 per share dividend • While still early, integration has gone smoothly and teams continue to work well together combining the two networks • Anticipate record 4Q and FY 2014 earnings - Record 3Q profit* of $1.2 billion - All-time record GAAP net profit of $942 million - Record 3Q revenues: $11.1 billion - Record 3Q PRASM: 14.12 cents - Record 3Q Yield: 16.93 cents |
 |
 GAAP to non-GAAP Reconciliation 19 American Airlines Group Inc. Combined % Change 2014 2013 2014 2013 Reconciliation of Income Before Income Taxes Excluding Special Items Income before income taxes as reported 949 $ 625 $ 2,645 $ 879 $ Special items: Special items, net 221 55 335 201 Regional operating special items, net 2 (14) 7 (9) Nonoperating special items, net 50 80 101 197 Reorganization items, net - 151 - 435 Income before income taxes as adjusted for special items 1,222 $ 897 $ 36% 3,088 $ 1,703 $ Calculation of Pre-Tax Margin Excluding Special Items 2014 2013 2014 2013 Income before income taxes as adjusted for special items $ 1,222 $ 897 $ 3,088 $ 1,703 Total operating revenues $ 11,139 $ 10,668 $ 32,490 $ 30,435 Pre-tax margin excluding special items 11.0% 8.4% 9.5% 5.6% % Change Reconciliation of Net Income Excluding Special Items 2014 2013 2014 2013 Net income as reported 942 $ 505 $ 2,285 $ 714 $ Special items: Special items, net 221 55 335 201 Regional operating special items, net 2 (14) 7 (9) Nonoperating special items, net 50 80 101 197 Reorganization items, net - 151 - 435 Non-cash income tax provision 8 - 352 - Net tax effect of special items - (6) - (25) Net income as adjusted for special items 1,223 $ 771 $ 59% 3,080 $ 1,513 $ 3 Months Ended September 30, 9 Months Ended September 30, (In millions) (In millions) 3 Months Ended September 30, 9 Months Ended September 30, 3 Months Ended September 30, 9 Months Ended September 30, |
 GAAP to non-GAAP Reconciliation 20 % Change % Change Reconciliation of Operating Cost per ASM Excluding Special 2014 2013 2014 2013 Items and Fuel - Mainline only Total operating expenses 9,879 $ 9,540 $ 29,101 $ 28,144 $ Less regional expenses: Fuel (538) (535) (1,573) (1,591) Other (1,130) (1,064) (3,346) (3,210) Total mainline operating expenses 8,211 7,941 24,182 23,343 Special items, net (221) (55) (335) (201) Mainline operating expenses, excluding special items 7,990 7,886 23,847 23,142 Aircraft fuel and related taxes (2,829) (2,865) (8,370) (8,412) Mainline operating expenses, excluding special items and fuel 5,161 5,021 15,477 14,730 (In cents) Mainline operating expenses per ASM 13.28 $ 13.11 $ 13.46 $ 13.35 $ Special items, net per ASM (0.36) (0.09) (0.19) (0.11) Mainline operating expenses per ASM, excluding special items 12.92 13.02 13.27 13.23 Aircraft fuel and related taxes per ASM (4.57) (4.73) (4.66) (4.81) Mainline operating expenses per ASM, excluding special items and fuel 8.35 $ 8.29 $ 0.7% 8.61 $ 8.42 $ 2.3% Note: Amounts may not recalculate due to rounding. (In millions) 3 Months Ended September 30, 9 Months Ended September 30, (In millions) |
 Questions? |