| UNITED STATES | |
| SECURITIES AND EXCHANGE COMMISSION | |
| Washington, D.C. 20549 | |
| FORM N-CSR | |
| CERTIFIED SHAREHOLDER REPORT OF REGISTERED | |
| MANAGEMENT INVESTMENT COMPANIES | |
| Investment Company Act file number 811- 2402 | |
| John Hancock Sovereign Bond Fund | |
| (Exact name of registrant as specified in charter) | |
| 601 Congress Street, Boston, Massachusetts 02210 | |
| (Address of principal executive offices) (Zip code) | |
| Alfred P. Ouellette | |
| Senior Counsel and Assistant Secretary | |
| 601 Congress Street | |
| Boston, Massachusetts 02210 | |
| (Name and address of agent for service) | |
| Registrant's telephone number, including area code: | 617-663-4324 |
| Date of fiscal year end: | May 31 |
| Date of reporting period: | November 30, 2008 |
ITEM 1. REPORT TO SHAREHOLDERS.
A look at performance
For the period ended November 30, 2008
| Average annual returns (%) | Cumulative total returns (%) | |||||||||||
| with maximum sales charge (POP) | with maximum sales charge (POP) | SEC 30- | ||||||||||
| day yield | ||||||||||||
| Inception | Six | (%) as of | ||||||||||
| Class | date | 1-year | 5-year | 10-year | months | 1-year | 5-year | 10-year | 11-30-08 | |||
| A | 11-9-73 | –17.07 | –0.38 | 2.77 | –16.59 | –17.07 | –1.90 | 31.44 | 7.73 | |||
| B | 11-23-93 | –17.85 | –0.48 | 2.67 | –17.22 | –17.85 | –2.39 | 30.20 | 7.37 | |||
| C | 10-1-98 | –14.58 | –0.16 | 2.52 | –13.83 | –14.58 | –0.80 | 28.31 | 7.37 | |||
| I1,2 | 9-4-01 | –12.78 | 0.98 | 3.69 | –12.49 | –12.78 | 4.98 | 43.64 | 8.55 | |||
| R11,2 | 8-5-03 | –13.20 | 0.14 | 2.80 | –12.84 | –13.20 | 0.72 | 31.86 | 6.89 | |||
Performance figures assume all distributions are reinvested. Public offering price (POP) figures reflect maximum sales charges on Class A shares of 4.5% and the applicable contingent deferred sales charge (CDSC) on Class B and Class C shares. The returns for Class C shares have been adjusted to reflect the elimination of the front-end sales charge effective July 15, 2004. The Class B shares’ CDSC declines annually between years 1 to 6 according to the following schedule: 5, 4, 3, 3, 2, 1%. No sales charge will be assessed after the sixth year. Class C shares held for less than one year are subject to a 1% CDSC. Sales charge is not applicable for Class I and Class R1 shares.
The expense ratios of the Fund, both net (including any fee waivers or expense limitations) and gross (excluding any fee waivers or expense limitations), are set forth according to the most recent publicly available prospectuses for the Fund and may differ from the expense ratios disclosed in the Financial Highlights tables in this report. The net expenses equal the gross expenses and are as follows: Class A — 1.05%, Class B — 1.76%, Class C — 1.75%, Class I — 0.62%, Class R1 — 1.34%.
The returns reflect past results and should not be considered indicative of future performance. The return and principal value of an investment will fluctuate so that shares, when redeemed, may be worth more or less than their original cost. Due to market volatility, the Fund’s current performance may be higher or lower than the performance shown. For current to the most recent month end performance data, please call 1–800–225–5291 or visit the Fund’s Web site at www.jhfunds.com.
The performance table above and the chart on the next page do not reflect the deduction of taxes that a shareholder would pay on fund distributions or the redemption of fund shares.
The Fund’s performance results reflect any applicable expense reductions, without which the expenses would increase and results would have been less favorable.
1 For certain types of investors as described in the Fund’s Class I and Class R1 share prospectuses.
2 November 9, 1973 is the inception date for the Class A shares. Class I shares were first offered on September 4, 2001; the returns prior to this date are those of Class A shares that have been recalculated to apply the fees and expenses of Class I shares.
| 6 | Bond Fund | Semiannual report |
Growth of $10,000
This chart shows what happened to a hypothetical $10,000 investment in Bond Fund Class A shares for the period indicated. For comparison, we’ve shown the same investment in the Barclays Capital Government/Credit Bond Index.

| With maximum | ||||
| Class | Period beginning | Without sales charge | sales charge | Index |
| B2 | 11-30-98 | $13,020 | $13,020 | $16,607 |
| C2 | 11-30-98 | 12,831 | 12,831 | 16,607 |
| I3,4 | 11-30-98 | 14,364 | 14,364 | 16,607 |
| R13,5 | 11-30-98 | 13,186 | 13,186 | 16,607 |
Assuming all distributions were reinvested for the period indicated, the table above shows the value of a $10,000 investment in the Fund’s Class B, Class C, Class I and Class R1 shares, respectively, as of November 30, 2008. The Class C shares investment with maximum sales charge has been adjusted to reflect the elimination of the front-end sales charge effective July 15, 2004. Performance of the classes will vary based on the difference in sales charges paid by shareholders investing in the different classes and the fee structure of those classes.
Barclays Capital Government/Credit Bond Index is an unmanaged index that measures the performance of U.S government bonds, U.S. corporate bonds and Yankee bonds.
It is not possible to invest directly in an index. Index figures do not reflect sales charges which would have resulted in lower values if they did.
1 NAV represents net asset value and POP represents public offering price.
2 No contingent deferred sales charge applicable.
3 For certain types of investors as described in the Fund’s Class I and Class R1 share prospectuses.
4 November 9, 1973 is the inception date for the Class A shares. Class I shares were first offered on September 4, 2001; the returns prior to this date are those of Class A shares that have been recalculated to apply the fees and expenses of Class I shares.
5 November 9, 1973 is the inception date for Class A shares. Class R1 shares were first offered on August 5, 2003, the returns prior to this date are those of Class A shares that have been recalculated to apply the fees and expenses of Class R1 shares.
| Semiannual report | Bond Fund | 7 |
Your expenses
These examples are intended to help you understand your ongoing operating expenses.
Understanding fund expenses
As a shareholder of the Fund, you incur two types of costs:
■ Transaction costs which include sales charges (loads) on purchases or redemptions (varies by share class), minimum account fee charge, etc.
■ Ongoing operating expenses including management fees, distribution and service fees (if applicable), and other fund expenses.
We are going to present only your ongoing operating expenses here.
Actual expenses/actual returns
This example is intended to provide information about your fund’s actual ongoing operating expenses, and is based on your fund’s actual return. It assumes an account value of $1,000.00 on June 1, 2008 with the same investment held until November 30, 2008.
| Account value | Ending value | Expenses paid during | |
| on 6-1-08 | on 11-30-08 | period ended 11-30-081 | |
| Class A | $1,000.00 | $873.20 | $5.07 |
| Class B | 1,000.00 | 870.10 | 8.34 |
| Class C | 1,000.00 | 870.10 | 8.34 |
| Class I | 1,000.00 | 875.10 | 3.01 |
| Class R1 | 1,000.00 | 871.60 | 6.94 |
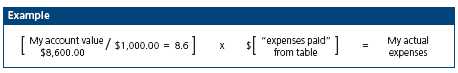
Together with the value of your account, you may use this information to estimate the operating expenses that you paid over the period. Simply divide your account value at November 30, 2008, by $1,000.00, then multiply it by the “expenses paid” for your share class from the table above. For example, for an account value of $8,600.00, the operating expenses should be calculated as follows:
| 8 | Bond Fund | Semiannual report |
Hypothetical example for comparison purposes
This table allows you to compare your fund’s ongoing operating expenses with those of any other fund. It provides an example of the Fund’s hypothetical account values and hypothetical expenses based on each class’s actual expense ratio and an assumed 5% annualized return before expenses (which is not your fund’s actual return). It assumes an account value of $1,000.00 on June 1, 2008, with the same investment held until November 30, 2008. Look in any other fund shareholder report to find its hypothetical example and you will be able to compare these expenses.
| Account value | Ending value | Expenses paid during | |
| on 6-1-08 | on 11-30-08 | period ended 11-30-081 | |
| Class A | $1,000.00 | $1,019.70 | $5.47 |
| Class B | 1,000.00 | 1,016.10 | 9.00 |
| Class C | 1,000.00 | 1,016.10 | 9.00 |
| Class I | 1,000.00 | 1,021.90 | 3.24 |
| Class R1 | 1,000.00 | 1,017.60 | 7.53 |
Remember, these examples do not include any transaction costs, such as sales charges; therefore, these examples will not help you to determine the relative total costs of owning different funds. If transaction costs were included, your expenses would have been higher. See the prospectus for details regarding transaction costs.
1 Expenses are equal to the Fund’s annualized expense ratio of 1.08%, 1.78%, 1.78%, 0.64% and 1.48% for Class A, Class B, Class C, Class I and Class R1 respectively, multiplied by the average account value over the period, multiplied by 183/365 (to reflect the one-half year period).
| Semiannual report | Bond Fund | 9 |
Portfolio summary
Portfolio diversification1
| Bonds | 40% | Collateralized mortgage obligations | 17% | |
| U.S. government & agency securities | 40% | Short-term & other | 3% | |
Sector distribution1,2
| U.S. government & agency | 39% | Energy | 3% | |
| Mortgage bonds | 16% | Materials | 2% | |
| Financials | 16% | Industrials | 2% | |
| Consumer staples | 5% | Health care | 1% | |
| Consumer discretionary | 5% | Information technology | 1% | |
| Utilities | 5% | Other | 1% | |
| Telecommunication services | 4% | |||
Quality distribution1
| AAA | 52% | |
| AA | 7% | |
| A | 12% | |
| BBB | 16% | |
| BB | 6% | |
| B | 4% | |
| CCC | 1% | |
| Short-term investments & other | 2% | |
1 As a percentage of net assets on November 30, 2008.
2 Sector investing is subject to greater risks than the market as a whole. Because the Fund may focus on particular sectors of the economy, its performance may depend on the performance of those sectors.
10 | Bond Fund | Semiannual report |
F I N A N C I A L S T A T E M E N T S
Fund’s investments
Securities owned by the Fund on 11-30-08 (unaudited)
This schedule is divided into seven main categories: bonds, preferred stocks, tranche loans, U.S. government & agency securities, collateralized mortgage obligations, asset backed securities and short-term investments. Bonds, preferred stocks and tranche loans are further broken down by industry group. Short-term investments, which represent the Fund’s cash position, are listed last.
| Interest | Maturity | Credit | Par value | |||
| Issuer, description | rate | date | rating (A) | (000) | Value | |
| Bonds 39.99% | $294,263,659 | |||||
| (Cost $389,050,836) | ||||||
| Aerospace & Defense 0.13% | 948,750 | |||||
| BE Aerospace, Inc., | ||||||
| Sr Note | 8.500% | 07-01-18 | BB+ | $1,150 | 948,750 | |
| Agricultural Products 0.22% | 1,595,206 | |||||
| Bunge Ltd. Finance Corp., | ||||||
| Gtd Sr Note | 5.350 | 04-15-14 | BBB– | 2,100 | 1,595,206 | |
| Airlines 0.91% | 6,721,668 | |||||
| Continental Airlines, Inc., | ||||||
| Pass Thru Ctf Ser 1999-1 Class A | 6.545 | 02-02-19 | A– | 909 | 731,685 | |
| Pass Thru Ctf Ser 2000-2 Class B | 8.307 | 04-02-18 | B+ | 1,216 | 851,421 | |
| Pass Thru Ctf Ser 2001-1 Class C | 7.033 | 06-15-11 | B+ | 622 | 423,018 | |
| Delta Air Lines, Inc., | ||||||
| Sec Pass Thru Ctf Ser A | 6.821 | 08-10-22 | A– | 2,791 | 1,758,194 | |
| Sr Pass Thru Ctf Ser 2002-1 | 6.417 | 07-02-12 | AA | 2,755 | 2,011,150 | |
| Northwest Airlines, Inc., | ||||||
| Gtd Pass Thru Ctf | 7.027 | 11-01-19 | BBB+ | 1,660 | 946,200 | |
| Aluminum 0.19% | 1,431,300 | |||||
| CII Carbon, LLC, | ||||||
| Gtd Sr Sub Note (S) | 11.125 | 11-15-15 | CCC+ | 1,835 | 1,431,300 | |
| Asset Management & Custody Banks 0.48% | 3,502,816 | |||||
| Northern Trust Co., | ||||||
| Sub Note | 6.500 | 08-15-18 | AA– | 920 | 915,314 | |
| Rabobank Capital Fund II, | ||||||
| Perpetual Bond (5.260% to 12-31-13 | ||||||
| then variable) (S) | 5.260 | 12-29-49 | AA | 4,005 | 2,587,502 | |
| Auto Parts & Equipment 0.24% | 1,767,250 | |||||
| Allison Transmission, Inc., | ||||||
| Gtd Sr Note (S) | 11.000 | 11-01-15 | B– | 1,885 | 923,650 | |
| Tenneco, Inc., | ||||||
| Gtd Sr Sub Note | 8.625 | 11-15-14 | B | 2,280 | 843,600 | |
| Brewers 0.22% | 1,642,208 | |||||
| SABmiller PLC, | ||||||
| Note (S) | 6.500 | 07-15-18 | BBB+ | 1,850 | 1,642,208 | |
See notes to financial statements
| Semiannual report | Bond Fund | 11 |
F I N A N C I A L S T A T E M E N T S
| Interest | Maturity | Credit | Par value | |||
| Issuer, description | rate | date | rating (A) | (000) | Value | |
| Broadcasting & Cable TV 1.39% | $10,211,853 | |||||
| Charter Communications Holdings | ||||||
| II, LLC, | ||||||
| Gtd Sr Note (S) | 10.250% | 10-01-13 | Caa2 | $1,680 | 714,000 | |
| Comcast Cable Communications | ||||||
| Holdings, Inc., | ||||||
| Sr Note | 8.375 | 03-15-13 | BBB+ | 1,420 | 1,418,344 | |
| Comcast Cable Holdings LLC, | ||||||
| Gtd Sr Note | 9.800 | 02-01-12 | BBB+ | 1,655 | 1,702,805 | |
| Comcast Corp., | ||||||
| Gtd Note | 4.950 | 06-15-16 | BBB+ | 1,470 | 1,207,959 | |
| Rogers Cable, Inc., | ||||||
| Gtd Sr Sec Note | 6.750 | 03-15-15 | BBB– | 1,595 | 1,489,277 | |
| Time Warner Cable, Inc., | ||||||
| Gtd Sr Note | 8.750 | 02-14-19 | BBB+ | 1,205 | 1,183,792 | |
| Gtd Sr Note | 6.750 | 07-01-18 | BBB+ | 2,235 | 1,960,176 | |
| XM Satellite Radio Holdings, Inc., | ||||||
| Gtd Sr Note (S) | 13.000 | 08-01-13 | CCC | 2,100 | 535,500 | |
| Building Products 0.20% | 1,454,958 | |||||
| CRH America, Inc., | ||||||
| Gtd Note | 8.125 | 07-15-18 | BBB+ | 1,930 | 1,454,958 | |
| Casinos & Gaming 1.47% | 10,849,266 | |||||
| Fontainebleau Las Vegas, | ||||||
| Note (S) | 10.250 | 06-15-15 | CCC | 1,825 | 237,250 | |
| Greektown Holdings, LLC, | ||||||
| Sr Note (G)(H)(L)(S) | 10.750 | 12-01-13 | D | 1,170 | 239,850 | |
| Indianapolis Downs LLC & Capital Corp., | ||||||
| Sr Sec Note (S) | 11.000 | 11-01-12 | CCC | 1,135 | 539,125 | |
| Jacobs Entertainment, Inc., | ||||||
| Gtd Sr Note | 9.750 | 06-15-14 | B– | 1,970 | 906,200 | |
| Little Traverse Bay Bands of | ||||||
| Odawa Indians, | ||||||
| Sr Note (S) | 10.250 | 02-15-14 | B– | 2,210 | 1,447,550 | |
| Mashantucket Western Pequot Tribe, | ||||||
| Bond Ser A (S) | 8.500 | 11-15-15 | BB– | 395 | 150,100 | |
| Mohegan Tribal Gaming Authority, | ||||||
| Sr Sub Note | 7.125 | 08-15-14 | B | 1,050 | 593,250 | |
| MTR Gaming Group, Inc., | ||||||
| Gtd Sr Note Ser B | 9.750 | 04-01-10 | B | 1,525 | 1,136,125 | |
| Gtd Sr Sub Note Ser B | 9.000 | 06-01-12 | CCC | 1,090 | 599,500 | |
| Seminole Tribe of Florida, | ||||||
| Bond (S) | 6.535 | 10-01-20 | BBB | 2,260 | 2,351,101 | |
| Turning Stone Resort & | ||||||
| Casino Enterprise, | ||||||
| Sr Note (S) | 9.125 | 09-15-14 | B+ | 1,985 | 1,508,600 | |
| Waterford Gaming, LLC, | ||||||
| Sr Note (S) | 8.625 | 09-15-14 | BB– | 1,207 | 1,140,615 | |
| Coal & Consumable Fuels 0.16% | 1,199,000 | |||||
| Drummond Co., Inc., | ||||||
| Sr Note (S) | 7.375 | 02-15-16 | BB– | 2,180 | 1,199,000 | |
See notes to financial statements
| 12 | Bond Fund | Semiannual report |
F I N A N C I A L S T A T E M E N T S
| Interest | Maturity | Credit | Par value | |||
| Issuer, description | rate | date | rating (A) | (000) | Value | |
| Commodity Chemicals 0.20% | $1,492,800 | |||||
| Sterling Chemicals, Inc., | ||||||
| Gtd Sr Sec Note | 10.250% | 04-01-15 | B– | $1,555 | 1,492,800 | |
| Computer Hardware 0.36% | 2,660,481 | |||||
| IBM Corp., | ||||||
| Sr Sub Note | 8.000 | 10-15-38 | A+ | 2,395 | 2,660,481 | |
| Consumer Finance 1.26% | 9,250,860 | |||||
| American Express Co., | ||||||
| Sr Note | 7.000 | 03-19-18 | A+ | 1,995 | 1,729,021 | |
| American Express Credit Co., | ||||||
| Sr Note Ser C | 7.300 | 08-20-13 | A+ | 2,700 | 2,560,915 | |
| American General Finance Corp., | ||||||
| Note Ser J | 6.900 | 12-15-17 | BBB | 1,735 | 716,718 | |
| Ford Motor Credit Co., LLC, | ||||||
| Sr Note | 9.875 | 08-10-11 | CCC+ | 1,135 | 533,467 | |
| Sr Note | 9.750 | 09-15-10 | CCC+ | 2,937 | 1,483,361 | |
| Nelnet, Inc., | ||||||
| Note (7.400% to 9-1-11 then variable) | 7.400 | 09-29-36 | BB+ | 2,595 | 653,486 | |
| SLM Corp., | ||||||
| Sr Note Ser MTN | 8.450 | 06-15-18 | BBB– | 2,170 | 1,573,892 | |
| Data Processing & Outsourced Services 0.19% | 1,382,405 | |||||
| Fiserv, Inc., | ||||||
| Gtd Sr Note | 6.800 | 11-20-17 | BBB | 1,690 | 1,382,405 | |
| Diversified Banks 1.63% | 11,976,322 | |||||
| Banco Mercantil del Norte SA, | ||||||
| Sub Note (S) | 6.862 | 10-13-21 | Baa1 | 2,500 | 1,529,440 | |
| BNP Paribas, | ||||||
| Jr Sub Note (7.195% to 6-25-37 | ||||||
| then variable) (S) | 7.195 | 06-29-49 | AA– | 985 | 590,893 | |
| Chuo Mitsui Trust & Banking Co. Ltd., | ||||||
| Jr Sub Note (5.506% to 4-15-15 | ||||||
| then variable) (S) | 5.506 | 12-15-49 | A2 | 2,530 | 1,741,429 | |
| HBOS PLC, | ||||||
| Perpetual Jr Sub Bond (6.413% to | ||||||
| 10-1-35 then variable) (S) | 6.413 | 09-29-49 | BBB+ | 2,410 | 1,065,774 | |
| Natixis, | ||||||
| Sub Bond (10.000% to 4-30-18 | ||||||
| then variable) (S) | 10.000 | 04-30-49 | BBB+ | 1,575 | 810,075 | |
| Royal Bank of Scotland Group PLC, | ||||||
| Jr Sub Bond (7.648% to 9-30-31 then | ||||||
| variable) (United Kingdom) (D) | 7.648 | 03-31-49 | BBB+ | 3,210 | 1,693,240 | |
| Jr Sub Bond Ser U (7.640% to 9-29-17 | ||||||
| then variable) (United Kingdom) (D) | 7.640 | 08-29-49 | BBB+ | 1,400 | 676,397 | |
| Silicon Valley Bank, | ||||||
| Sub Note | 6.050 | 06-01-17 | BBB | 2,335 | 1,963,810 | |
| Wachovia Bank NA, | ||||||
| Sub Note | 5.850 | 02-01-37 | A+ | 1,665 | 1,360,708 | |
| Sub Note Ser BKNT | 6.600 | 01-15-38 | A+ | 635 | 544,556 | |
See notes to financial statements
| Semiannual report | Bond Fund | 13 |
F I N A N C I A L S T A T E M E N T S
| Interest | Maturity | Credit | Par value | |||
| Issuer, description | rate | date | rating (A) | (000) | Value | |
| Diversified Financial Services 3.27% | $24,070,706 | |||||
| Beaver Valley Funding, | ||||||
| Sec Lease Obligation Bond | 9.000% | 06-01-17 | BBB | $3,200 | 3,056,576 | |
| BVPS II Funding Corp., | ||||||
| Collateralized Lease Bond | 8.890 | 06-01-17 | BBB | 2,295 | 2,343,361 | |
| Citigroup, Inc., | ||||||
| Jr Sub Bond (8.400% to 4-30-18 | ||||||
| then variable) | 8.400 | 04-29-49 | A | 2,855 | 1,685,735 | |
| Sr Note | 6.875 | 03-05-38 | AA | 1,115 | 1,035,163 | |
| Sr Note | 6.125 | 05-15-18 | AA– | 2,685 | 2,454,050 | |
| ERAC USA Finance Co., | ||||||
| Gtd Sr Note (S) | 6.375 | 10-15-17 | BBB | 1,730 | 1,211,188 | |
| General Electric Capital Corp., | ||||||
| Sr Note | 5.625 | 05-01-18 | AAA | 1,910 | 1,761,114 | |
| JPMorgan Chase & Co., | ||||||
| Jr Sub Note Ser 1 (7.900% to 4-30-18 | ||||||
| then variable) | 7.900 | 04-26-49 | A | 2,470 | 1,933,615 | |
| NiSource Finance Corp., | ||||||
| Gtd Bond | 6.800 | 01-15-19 | BBB– | 1,620 | 1,180,959 | |
| QBE Capital Funding II LP, | ||||||
| Gtd Sub Bond (6.797% to 6-1-17 | ||||||
| then variable) (S) | 6.797 | 06-29-49 | BBB | 2,485 | 1,739,500 | |
| Rio Tinto Finance (USA) Ltd., | ||||||
| Gtd Note | 6.500 | 07-15-18 | BBB+ | 1,855 | 1,274,854 | |
| SMFG Preferred Capital, | ||||||
| Sub Bond (6.078% to 1-25-17 | ||||||
| then variable) (S) | 6.078 | 01-01-49 | BBB+ | 2,215 | 1,533,865 | |
| Sovereign Capital Trust VI, | ||||||
| Gtd Note | 7.908 | 06-13-36 | BB+ | 1,840 | 1,090,938 | |
| TECO Finance, Inc., | ||||||
| Gtd Sr Note | 6.572 | 11-01-17 | BB+ | 839 | 684,070 | |
| Sr Note | 7.000 | 05-01-12 | BB+ | 1,166 | 1,085,718 | |
| Diversified Metals & Mining 0.23% | 1,718,806 | |||||
| Freeport-McMoRan Copper & Gold, Inc., | ||||||
| Sr Note | 8.375 | 04-01-17 | BBB– | 1,360 | 965,600 | |
| Vedanta Resources, PLC, | ||||||
| Note (S) | 8.750 | 01-15-14 | BB | 1,445 | 753,206 | |
| Diversified REIT’s 0.22% | 1,608,096 | |||||
| HRPT Properties Trust, | ||||||
| Sr Note | 6.650 | 01-15-18 | BBB | 1,070 | 687,687 | |
| ProLogis, | ||||||
| Sr Sec Note | 6.625 | 05-15-18 | BBB– | 2,285 | 920,409 | |
| Drug Retail 0.52% | 3,857,211 | |||||
| CVS Caremark Corp., | ||||||
| Jr Sub Bond (6.302% to 6-1-12 | ||||||
| then variable) | 6.302 | 06-01-37 | BBB– | 3,635 | 1,999,250 | |
| Sr Note | 5.750 | 06-01-17 | BBB+ | 2,140 | 1,857,961 | |
See notes to financial statements
| 14 | Bond Fund | Semiannual report |
F I N A N C I A L S T A T E M E N T S
| Interest | Maturity | Credit | Par value | |||
| Issuer, description | rate | date | rating (A) | (000) | Value | |
| Electric Utilities 3.50% | $25,774,149 | |||||
| AES Eastern Energy LP, | ||||||
| Sr Pass Thru Ctf Ser 1999-A | 9.000% | 01-02-17 | BB+ | $3,303 | 2,972,924 | |
| Commonwealth Edison Co., | ||||||
| Sec Bond | 5.800 | 03-15-18 | BBB+ | 2,995 | 2,610,526 | |
| Constellation Energy Group, Inc., | ||||||
| Sr Note | 4.550 | 06-15-15 | BBB | 3,875 | 3,083,802 | |
| Indiantown Cogeneration LP, | ||||||
| 1st Mtg Note Ser A–9 | 9.260 | 12-15-10 | BB+ | 836 | 788,252 | |
| IPALCO Enterprises, Inc., | ||||||
| Sr Sec Note | 8.625 | 11-14-11 | BB | 1,660 | 1,419,300 | |
| Israel Electric Corp., Ltd., | ||||||
| Sec Note (S) | 7.250 | 01-15-19 | BBB+ | 2,395 | 2,147,268 | |
| Midwest Generation LLC, | ||||||
| Gtd Pass Thru Ctf | 8.560 | 01-02-16 | BB+ | 2,809 | 2,570,329 | |
| Nevada Power Co., | ||||||
| Mtg Note Ser L | 5.875 | 01-15-15 | BBB | 1,725 | 1,572,429 | |
| Oncor Electric Delivery Co., | ||||||
| Sr Sec Note | 6.375 | 05-01-12 | BBB+ | 3,470 | 3,289,223 | |
| PNPP II Funding Corp., | ||||||
| Deb | 9.120 | 05-30-16 | BBB | 183 | 190,417 | |
| Texas Competitive Electric Holdings | ||||||
| Co. LLC, | ||||||
| Gtd Sr Note (S) | 10.500 | 11-01-15 | CCC | 2,265 | 1,449,600 | |
| Virginia Electric & Power Co., | ||||||
| Sr Note | 8.875 | 11-15-38 | A– | 1,200 | 1,303,642 | |
| Waterford 3 Funding Corp., | ||||||
| Sec Lease Obligation Bond | 8.090 | 01-02-17 | BBB | 2,254 | 2,376,437 | |
| Electrical Components & Equipment 0.03% | 217,770 | |||||
| GrafTech Finance, Inc., | ||||||
| Gtd Sr Note | 10.250 | 02-15-12 | BB | 238 | 217,770 | |
| Environmental & Facilities Services 0.10% | 756,600 | |||||
| Blaze Recycling & Metals LLC, | ||||||
| Sr Sec Note (G)(S) | 10.875 | 07-15-12 | B | 970 | 756,600 | |
| Fertilizers & Agricultural Chemicals 0.21% | 1,530,800 | |||||
| Mosiac Co., | ||||||
| Sr Note | 7.625 | 12-01-16 | BBB– | 1,780 | 1,530,800 | |
| Gas Utilities 0.16% | 1,198,655 | |||||
| Southern Union Co., | ||||||
| Jr Sub Note, Ser A (7.200% to 11-1-11 | ||||||
| then variable) | 7.200 | 11-01-66 | BB | 2,165 | 1,198,655 | |
| Health Care Equipment 0.18% | 1,345,996 | |||||
| Covidien International Finance SA, | ||||||
| Gtd Sr Note | 6.000 | 10-15-17 | A– | 1,455 | 1,345,996 | |
| Health Care Facilities 0.15% | 1,127,513 | |||||
| Community Health Systems, Inc., | ||||||
| Gtd Sr Sub Note | 8.875 | 07-15-15 | B | 1,405 | 1,127,513 | |
See notes to financial statements
| Semiannual report | Bond Fund | 15 |
F I N A N C I A L S T A T E M E N T S
| Interest | Maturity | Credit | Par value | |||
| Issuer, description | rate | date | rating (A) | (000) | Value | |
| Health Care Services 0.44% | $3,218,738 | |||||
| Humana, Inc., | ||||||
| Sr Note | 8.150% | 06-15-38 | BBB | $2,775 | 2,179,898 | |
| UnitedHealth Group, Inc., | ||||||
| Sr Note | 5.500 | 11-15-12 | A– | 1,090 | 1,038,840 | |
| Hotels, Resorts & Cruise Lines 0.17% | 1,239,000 | |||||
| Starwood Hotels & Resorts | ||||||
| Worldwide, Inc., | ||||||
| Sr Note | 6.250 | 02-15-13 | BBB– | 1,770 | 1,239,000 | |
| Household Products 0.13% | 932,325 | |||||
| Yankee Acquisition Corp., | ||||||
| Gtd Sr Sub Note | 8.500 | 02-15-15 | B– | 2,005 | 932,325 | |
| Industrial Conglomerates 0.11% | 839,722 | |||||
| Tyco Electronics Group SA, | ||||||
| Gtd Sr Note | 6.550 | 10-01-17 | BBB | 970 | 839,722 | |
| Industrial Machinery 0.28% | 2,049,266 | |||||
| Ingersoll-Rand Global Holding Co., Ltd., | ||||||
| Gtd Note | 6.875 | 08-15-18 | BBB+ | 2,240 | 2,049,266 | |
| Integrated Telecommunication Services 1.90% | 13,992,373 | |||||
| AT&T Inc., | ||||||
| Sr Note | 6.700 | 11-15-13 | A | 4,040 | 4,022,721 | |
| Sr Note | 6.400 | 05-15-38 | A | 1,840 | 1,507,893 | |
| Cincinnati Bell, Inc., | ||||||
| Sr Sub Note | 8.375 | 01-15-14 | B– | 1,950 | 1,440,562 | |
| Frontier Communications Corp., | ||||||
| Sr Note | 6.250 | 01-15-13 | BB | 1,540 | 1,205,050 | |
| Qwest Corp., | ||||||
| Sr Note | 7.875 | 09-01-11 | BBB– | 1,620 | 1,336,500 | |
| Telecom Italia Capital, | ||||||
| Gtd Sr Note | 7.721 | 06-04-38 | BBB | 2,860 | 2,030,600 | |
| Verizon Communications, Inc., | ||||||
| Sr Bond | 6.900 | 04-15-38 | A | 1,545 | 1,290,197 | |
| West Corp., | ||||||
| Gtd Sr Sub Note | 11.000 | 10-15-16 | B– | 2,695 | 1,158,850 | |
| Investment Banking & Brokerage 2.16% | 15,893,556 | |||||
| Bear Stearns Cos., Inc., | ||||||
| Sr Note | 7.250 | 02-01-18 | AA– | 1,950 | 1,974,186 | |
| Goldman Sachs Group, Inc., | ||||||
| Jr Sub Note | 6.750 | 10-01-37 | A+ | 1,830 | 1,173,178 | |
| Sr Note | 5.125 | 01-15-15 | AA– | 3,045 | 2,489,403 | |
| Jefferies Group, Inc., | ||||||
| Sr Note | 6.450 | 06-08-27 | BBB+ | 1,115 | 749,574 | |
| Merrill Lynch & Co., Inc., | ||||||
| Jr Sub Bond | 7.750 | 05-14-38 | A– | 1,770 | 1,554,719 | |
| Sr Note Ser | 6.875 | 04-25-18 | A | 3,375 | 3,178,028 | |
| Mizuho Financial Group, Ltd., | ||||||
| Gtd Sub Bond | 8.375 | 12-29-49 | Aa3 | 2,325 | 2,095,616 | |
| Morgan Stanley, | ||||||
| Sr Note Ser F | 6.625 | 04-01-18 | A+ | 3,230 | 2,678,852 | |
See notes to financial statements
| 16 | Bond Fund | Semiannual report |
F I N A N C I A L S T A T E M E N T S
| Interest | Maturity | Credit | Par value | |||
| Issuer, description | rate | date | rating (A) | (000) | Value | |
| Leisure Facilities 0.19% | $1,379,500 | |||||
| AMC Entertainment, Inc., | ||||||
| Sr Sub Note | 8.000% | 03-01-14 | CCC+ | $2,225 | 1,379,500 | |
| Life & Health Insurance 0.51% | 3,745,250 | |||||
| Lincoln National Corp., | ||||||
| Jr Sub Bond (6.050% to 4-20-17 | ||||||
| then variable) | 6.050 | 04-20-67 | A– | 915 | 375,150 | |
| Prudential Financial, Inc., | ||||||
| Sr Note Ser D | 5.150 | 01-15-13 | A+ | 2,700 | 2,405,120 | |
| Symetra Financial Corp., | ||||||
| Jr Sub Bond (8.300% to 10-15-17 | ||||||
| then variable) (S) | 8.300 | 10-15-37 | BB+ | 1,660 | 964,980 | |
| Marine 0.33% | 2,422,400 | |||||
| CMA CGM SA, | ||||||
| Sr Note (S) | 7.250 | 02-01-13 | BB– | 2,690 | 1,237,400 | |
| Navios Maritime Holdings, Inc., | ||||||
| Sr Note | 9.500 | 12-15-14 | B+ | 1,975 | 1,185,000 | |
| Meat, Poultry & Fish 0.10% | 741,338 | |||||
| Independencia International Ltd., | ||||||
| Gtd Sr Bond (Brazil) (D)(S) | 9.875 | 01-31-17 | B | 1,415 | 562,463 | |
| Gtd Sr Note (Brazil) (D)(S) | 9.875 | 05-15-15 | B | 450 | 178,875 | |
| Metal & Glass Containers 0.25% | 1,818,900 | |||||
| BWAY Corp., | ||||||
| Gtd Sr Sub Note | 10.000 | 10-15-10 | B– | 2,115 | 1,818,900 | |
| Movies & Entertainment 0.10% | 754,400 | |||||
| Cinemark, Inc., | ||||||
| Sr Disc Note (Zero to 3-15-09 then | ||||||
| 9.750%) (P) | Zero | 03-15-14 | CCC+ | 920 | 754,400 | |
| Multi-Line Insurance 0.77% | 5,630,395 | |||||
| AXA SA, | ||||||
| Sub Note (6.379% to 12-14-36 | ||||||
| then variable) (S) | 6.379 | 12-14-49 | BBB+ | 1,170 | 578,267 | |
| Genworth Financial, Inc., | ||||||
| Jr Sub Note (6.150% to 11-15-16 | ||||||
| then variable) | 6.150 | 11-15-66 | BBB | 1,640 | 156,394 | |
| Horace Mann Educators Corp., | ||||||
| Sr Note | 6.850 | 04-15-16 | BBB | 1,425 | 1,584,544 | |
| Liberty Mutual Group, | ||||||
| Bond (S) | 7.500 | 08-15-36 | BBB– | 3,070 | 1,963,572 | |
| Gtd Bond (S) | 7.800 | 03-15-37 | BB | 2,635 | 1,347,618 | |
| Multi-Media 0.51% | 3,723,190 | |||||
| News America Holdings, Inc., | ||||||
| Gtd Sr Deb | 8.250 | 08-10-18 | BBB+ | 2,165 | 2,135,924 | |
| Time Warner Entertainment Co., LP, | ||||||
| Sr Deb | 8.375 | 03-15-23 | BBB+ | 1,705 | 1,587,266 | |
See notes to financial statements
| Semiannual report | Bond Fund | 17 |
F I N A N C I A L S T A T E M E N T S
| Interest | Maturity | Credit | Par value | |||
| Issuer, description | rate | date | rating (A) | (000) | Value | |
| Multi-Utilities 0.59% | $4,315,595 | |||||
| Dynegy-Roseton Danskamme, | ||||||
| Gtd Pass Thru Ctf Ser B | 7.670% | 11-08-16 | B | $2,090 | 1,490,797 | |
| Salton Sea Funding Corp., | ||||||
| Sr Sec Bond Ser F | 7.475 | 11-30-18 | BBB– | 1,277 | 1,371,518 | |
| Sempra Energy, | ||||||
| Sr Bond | 8.900 | 11-15-13 | BBB+ | 1,465 | 1,453,280 | |
| Office Services & Supplies 0.22% | 1,597,900 | |||||
| Xerox Corp., | ||||||
| Sr Note | 6.750 | 02-01-17 | BBB | 2,204 | 1,597,900 | |
| Oil & Gas Drilling 0.24% | 1,785,761 | |||||
| Allis-Chalmers Energy, Inc., | ||||||
| Sr Note | 8.500 | 03-01-17 | B+ | 1,270 | 736,600 | |
| Delek & Avner Yam Tethys Ltd., | ||||||
| Sr Sec Note (S) | 5.326 | 08-01-13 | BBB– | 1,039 | 1,049,161 | |
| Oil & Gas Exploration & Production 0.42% | 3,078,970 | |||||
| McMoRan Exploration Co., | ||||||
| Gtd Sr Note | 11.875 | 11-15-14 | B | 1,230 | 894,825 | |
| Nexen, Inc., | ||||||
| Sr Note | 5.875 | 03-10-35 | BBB– | 1,500 | 1,035,729 | |
| Petro-Canada, | ||||||
| Sr Note | 6.050 | 05-15-18 | BBB | 1,460 | 1,148,416 | |
| Oil & Gas Refining & Marketing 0.59% | 4,327,224 | |||||
| Enterprise Products Operating LLP, | ||||||
| Gtd Jr Sub Note (7.034% to 1-15-18 | ||||||
| then variable) | 7.034 | 01-15-68 | BB | 2,130 | 1,107,600 | |
| Gtd Sr Note, Ser B | 5.600 | 10-15-14 | BBB– | 2,760 | 2,345,374 | |
| Targa Resources Partners LP, | ||||||
| Sr Note (S) | 8.250 | 07-01-16 | B | 1,345 | 874,250 | |
| Oil & Gas Storage & Transportation 1.60% | 11,790,912 | |||||
| Buckeye Partners LP, | ||||||
| Sr Note | 5.125 | 07-01-17 | BBB | 1,260 | 1,037,468 | |
| Kinder Morgan Energy Partners LP, | ||||||
| Sr Bond | 7.750 | 03-15-32 | BBB | 840 | 672,179 | |
| Sr Note | 5.125 | 11-15-14 | BBB | 980 | 819,139 | |
| Markwest Energy Partners LP, | ||||||
| Gtd Sr Note Ser B | 8.500 | 07-15-16 | B+ | 1,835 | 1,201,925 | |
| NGPL PipeCo LLC, | ||||||
| Sr Note (S) | 7.119 | 12-15-17 | BBB– | 2,150 | 1,848,228 | |
| ONEOK Partners LP, | ||||||
| Gtd Sr Note | 6.150 | 10-01-16 | BBB | 3,020 | 2,648,978 | |
| Plains All American Pipeline LP, | ||||||
| Sr Note | 6.500 | 05-01-18 | BBB– | 1,290 | 991,762 | |
| Spectra Energy Capital LLC, | ||||||
| Gtd Sr Note | 6.200 | 04-15-18 | BBB | 1,440 | 1,240,306 | |
| TEPPCO Partners LP, | ||||||
| Gtd Jr Sub Note (7.00% to 6-1-17 | ||||||
| then variable) | 7.000 | 06-01-67 | BB | 2,640 | 1,330,927 | |
See notes to financial statements
| 18 | Bond Fund | Semiannual report |
F I N A N C I A L S T A T E M E N T S
| Interest | Maturity | Credit | Par value | |||
| Issuer, description | rate | date | rating (A) | (000) | Value | |
| Packaged Foods & Meats 1.29% | $9,496,758 | |||||
| ASG Consolidated LLC, | ||||||
| Sr Disc Note | 11.500% | 11-01-11 | B+ | $2,200 | 1,881,000 | |
| General Mills, Inc., | ||||||
| Sr Note | 5.200 | 03-17-15 | BBB+ | 665 | 605,021 | |
| Kraft Foods, Inc., | ||||||
| Sr Bond | 6.125 | 02-01-18 | BBB+ | 3,280 | 3,023,337 | |
| Sr Note | 6.000 | 02-11-13 | BBB+ | 2,905 | 2,841,775 | |
| Minerva Overseas Ltd., | ||||||
| Gtd Note (S) | 9.500 | 02-01-17 | B | 2,350 | 1,145,625 | |
| Paper Packaging 0.04% | 302,500 | |||||
| U.S. Corrugated, Inc., | ||||||
| Sr Sec Note | 10.000 | 06-01-13 | B | 605 | 302,500 | |
| Paper Products 0.37% | 2,729,208 | |||||
| International Paper Co., | ||||||
| Sr Note | 7.950 | 06-15-18 | BBB | 1,745 | 1,369,708 | |
| Smurfit-Stone Container Corp., | ||||||
| Sr Note | 8.000 | 03-15-17 | B– | 2,060 | 545,900 | |
| Verso Paper Holdings LLC, | ||||||
| Gtd Sr Note Ser B | 9.125 | 08-01-14 | B+ | 1,695 | 813,600 | |
| Pharmaceuticals 0.12% | 911,083 | |||||
| Wyeth, | ||||||
| Sr Sub Note | 5.500 | 03-15-13 | A+ | 925 | 911,083 | |
| Property & Casualty Insurance 0.50% | 3,639,124 | |||||
| Chubb Corp., | ||||||
| Sr Note | 5.750 | 05-15-18 | A | 965 | 841,210 | |
| Ohio Casualty Corp., | ||||||
| Sr Note | 7.300 | 06-15-14 | BBB– | 2,330 | 2,147,144 | |
| Progressive Corp., | ||||||
| Jr Sub Deb (6.700% to 6-1-17 | ||||||
| then variable) | 6.700 | 06-15-37 | A– | 1,225 | 650,770 | |
| Publishing 0.35% | 2,550,299 | |||||
| Idearc, Inc., | ||||||
| Gtd Sr Note | 8.000 | 11-15-16 | CCC | 2,405 | 198,412 | |
| New York Times Co., | ||||||
| Sr Note | 4.500 | 03-15-10 | BB– | 2,605 | 2,012,587 | |
| R.H. Donnelley Corp., | ||||||
| Sr Note | 8.875 | 10-15-17 | B– | 2,610 | 339,300 | |
| Railroads 0.33% | 2,431,078 | |||||
| CSX Corp., | ||||||
| Sr Note | 5.500 | 08-01-13 | BBB– | 2,625 | 2,431,078 | |
| Real Estate Management & Development 0.80% | 5,917,878 | |||||
| Health Care Realty Trust, Inc., | ||||||
| Sr Note | 8.125 | 05-01-11 | BBB– | 1,340 | 1,203,360 | |
| Health Care REIT, Inc., | ||||||
| Sr Note | 6.200 | 06-01-16 | BBB– | 1,835 | 1,214,175 | |
See notes to financial statements
| Semiannual report | Bond Fund | 19 |
F I N A N C I A L S T A T E M E N T S
| Interest | Maturity | Credit | Par value | |||
| Issuer, description | rate | date | rating (A) | (000) | Value | |
| Real Estate Management & Development (continued) | ||||||
| Nationwide Health Properties, Inc., | ||||||
| Note | 6.500% | 07-15-11 | BBB– | $1,745 | $1,595,021 | |
| Simon Property Group LP, | ||||||
| Sr Note | 5.625 | 08-15-14 | A– | 2,520 | 1,905,322 | |
| Retail 0.15% | 1,116,689 | |||||
| Macy’s Retail Holdings, Inc., | ||||||
| Gtd Note | 7.875 | 07-15-15 | BBB– | 1,650 | 1,116,689 | |
| Soft Drinks 0.71% | 5,218,654 | |||||
| Bottling Group LLC, | ||||||
| Gtd Sr Note | 6.950 | 03-15-14 | A | 1,455 | 1,523,851 | |
| Coca Cola Enterprises, Inc., | ||||||
| Note | 7.375 | 03-03-14 | A | 1,750 | 1,820,194 | |
| Pepsico, Inc., | ||||||
| Sr Note | 7.900 | 11-01-18 | A+ | 1,680 | 1,874,609 | |
| Specialized Consumer Services 0.10% | 715,450 | |||||
| Sotheby’s, | ||||||
| Sr Note (S) | 7.750 | 06-15-15 | BBB– | 1,745 | 715,450 | |
| Specialized Finance 1.76% | 12,955,801 | |||||
| American Honda Finance Corp., | ||||||
| Note (S) | 7.625 | 10-01-18 | A+ | 2,750 | 2,792,867 | |
| Astoria Depositor Corp., | ||||||
| Pass Thru Ctf Ser B (G)(S) | 8.144 | 05-01-21 | BB | 3,590 | 2,656,600 | |
| Bosphorous Financial Services, | ||||||
| Sec Floating Rate Note (P)(S) | 3.949 | 02-15-12 | Baa2 | 2,161 | 2,092,492 | |
| CIT Group, Inc., | ||||||
| Sr Note | 5.650 | 02-13-17 | A– | 660 | 379,684 | |
| Sr Note | 5.125 | 09-30-14 | A– | 575 | 335,530 | |
| Sr Note | 5.000 | 02-13-14 | A– | 445 | 265,383 | |
| ESI Tractebel Acquisition Corp., | ||||||
| Gtd Sec Bond Ser B | 7.990 | 12-30-11 | BB | 2,894 | 2,655,245 | |
| HRP Myrtle Beach Operations, LLC, | ||||||
| Note (G)(H)(P)(S) | Zero | 04-01-12 | D | 1,075 | 473,000 | |
| USB Realty Corp., | ||||||
| Perpetual Bond (6.091% to 1-15-12 | ||||||
| then variable) (S) | 6.091 | 12-22-49 | A+ | 2,900 | 1,305,000 | |
| Specialized REIT’s 0.20% | 1,487,679 | |||||
| Plum Creek Timberlands LP, | ||||||
| Gtd Note | 5.875 | 11-15-15 | BBB– | 1,740 | 1,487,679 | |
| Specialty Chemicals 0.70% | 5,127,489 | |||||
| American Pacific Corp., | ||||||
| Gtd Sr Note | 9.000 | 02-01-15 | B+ | 2,160 | 1,879,200 | |
| Ecolab, Inc., | ||||||
| Sr Note | 4.875 | 02-15-15 | A | 1,905 | 1,591,932 | |
| Momentive Performance, | ||||||
| Gtd Sr Note | 9.750 | 12-01-14 | B | 2,235 | 866,063 | |
| Nova Chemicals Corp., | ||||||
| Note | 7.875 | 09-15-25 | B+ | 1,695 | 790,294 | |
See notes to financial statements
| 20 | Bond Fund | Semiannual report |
F I N A N C I A L S T A T E M E N T S
| Interest | Maturity | Credit | Par value | |||
| Issuer, description | rate | date | rating (A) | (000) | Value | |
| Steel 0.13% | $930,793 | |||||
| Commercial Metals Co., | ||||||
| Sr Note | 7.350% | 08-15-18 | BBB | $1,295 | 930,793 | |
| Tobacco 1.48% | 10,922,692 | |||||
| Alliance One International, Inc., | ||||||
| Gtd Sr Note | 8.500 | 05-15-12 | B+ | 890 | 667,500 | |
| Altria Group Inc., | ||||||
| Gtd Sr Note | 9.950 | 11-10-38 | BBB | 2,925 | 2,897,046 | |
| Gtd Sr Note | 8.500 | 11-10-13 | BBB | 3,405 | 3,418,201 | |
| Philip Morris International, Inc., | ||||||
| Sr Note | 5.650 | 05-16-18 | A | 2,905 | 2,607,304 | |
| Reynolds American, Inc., | ||||||
| Sr Sec Note | 7.250 | 06-01-13 | BBB | 1,535 | 1,332,641 | |
| Trading Companies & Distributors 0.07% | 513,300 | |||||
| United Rentals North America, Inc., | ||||||
| Gtd Sr Note | 7.750 | 11-15-13 | B | 485 | 291,000 | |
| Gtd Sr Note | 7.000 | 02-15-14 | B | 390 | 222,300 | |
| Wireless Telecommunication Services 1.46% | 10,727,024 | |||||
| America Movil SA de CV, | ||||||
| Sr Sec Note | 5.750 | 01-15-15 | BBB+ | 1,595 | 1,427,525 | |
| Crown Castle Towers LLC, | ||||||
| Sub Bond Ser 2005-1A Class D (S) | 5.612 | 06-15-35 | Baa2 | 3,455 | 2,794,197 | |
| Digicel Group Ltd., | ||||||
| Sr Note (S) | 8.875 | 01-15-15 | Caa1 | 2,115 | 1,089,225 | |
| Nextel Communications, Inc., | ||||||
| Sr Gtd Note Ser E | 6.875 | 10-31-13 | BB | 2,365 | 993,300 | |
| Verizon Wireless, | ||||||
| Sr Note (S) | 8.500 | 11-15-18 | A | 2,940 | 2,966,422 | |
| Sr Note (S) | 7.375 | 11-15-13 | A | 1,470 | 1,456,355 | |
| Credit | ||||||
| Issuer, description | rating (A) | Shares | Value | |||
| Preferred stocks 0.67% | $4,951,402 | |||||
| (Cost $6,474,548) | ||||||
| Agricultural Products 0.28% | 2,034,375 | |||||
| Ocean Spray Cranberries, Inc., | ||||||
| 6.25%, Ser A (S) | BBB– | 23,250 | 2,034,375 | |||
| Investment Banking & Brokerage 0.24% | 1,797,607 | |||||
| Merrill Lynch & Co., Inc., | ||||||
| 8.625%, Ser MER | BBB+ | 100,425 | 1,797,607 | |||
| Wireless Telecommunication Services 0.15% | 1,119,420 | |||||
| Telephone & Data Systems, Inc., | ||||||
| 7.60% | BBB– | 81,000 | 1,119,420 | |||
See notes to financial statements
| Semiannual report | Bond Fund | 21 |
F I N A N C I A L S T A T E M E N T S
| Credit | Par value | |||||
| Issuer, description, maturity date | rating (A) | (000) | Value | |||
| Tranche loans 0.07% | $503,750 | |||||
| (Cost $767,250) | ||||||
| Hotels, Resorts & Cruise Lines 0.07% | 503,750 | |||||
| East Valley Tourist Development Authority, | ||||||
| Tranche 8-6-12 | B3 | $775 | 503,750 | |||
| Interest | Maturity | Credit | Par value | |||
| Issuer, description | rate | date | rating (A) | (000) | Value | |
| U.S. government & agency securities 39.54% | $290,927,688 | |||||
| (Cost $284,294,992) | ||||||
| U.S. Government 3.55% | 26,108,210 | |||||
| United States Treasury, | ||||||
| Bond | 4.375% | 02-15-38 | AAA | $3,740 | 4,332,850 | |
| Note | 3.875 | 05-15-18 | AAA | 6,562 | 7,083,370 | |
| Note | 3.750 | 11-15-18 | AAA | 13,765 | 14,691,990 | |
| U.S. Government Agency 35.99% | 264,819,478 | |||||
| Federal Home Loan Mortgage Corp., | ||||||
| 30 Yr Pass Thru Ctf | 11.250 | 01-01-16 | AAA | 30 | 34,241 | |
| 30 Yr Pass Thru Ctf | 6.000 | 08-15-32 | AAA | 2,401 | 2,440,272 | |
| 30 Yr Pass Thru Ctf | 6.000 | 08-01-38 | AAA | 14,156 | 14,482,005 | |
| 30 Yr Pass Thru Ctf | 5.500 | 07-01-38 | AAA | 4,628 | 4,700,247 | |
| 30 Yr Pass Thru Ctf | 5.500 | 07-01-38 | AAA | 4,287 | 4,353,596 | |
| 30 Yr Pass Thru Ctf | 5.000 | 07-01-35 | AAA | 8,357 | 8,418,733 | |
| 30 Yr Pass Thru Ctf | 5.000 | 09-01-35 | AAA | 1,009 | 1,016,512 | |
| Federal National Mortgage Assn., | ||||||
| 30 Yr Pass Thru Ctf | 6.000 | 01-01-38 | AAA | 31,628 | 32,377,854 | |
| 30 Yr Pass Thru Ctf | 5.500 | 05-01-35 | AAA | 23,902 | 24,367,701 | |
| 30 Yr Pass Thru Ctf | 5.500 | 01-01-36 | AAA | 7,812 | 7,953,005 | |
| 30 Yr Pass Thru Ctf | 5.500 | 02-01-37 | AAA | 15,755 | 16,032,618 | |
| 30 Yr Pass Thru Ctf | 5.500 | 04-01-37 | AAA | 15,829 | 16,107,712 | |
| 30 Yr Pass Thru Ctf | 5.500 | 04-01-37 | AAA | 7,201 | 7,327,871 | |
| 30 Yr Pass Thru Ctf | 5.500 | 05-01-37 | AAA | 4,729 | 4,812,256 | |
| 30 Yr Pass Thru Ctf | 5.500 | 06-01-37 | AAA | 7,579 | 7,712,557 | |
| 30 Yr Pass Thru Ctf | 5.500 | 06-01-37 | AAA | 10,891 | 11,082,860 | |
| 30 Yr Pass Thru Ctf | 5.500 | 09-01-37 | AAA | 17,697 | 18,008,719 | |
| 30 Yr Pass Thru Ctf | 5.500 | 12-01-37 | AAA | 9,403 | 9,568,261 | |
| 30 Yr Pass Thru Ctf | 5.500 | 06-01-38 | AAA | 9,063 | 9,223,165 | |
| 30 Yr Pass Thru Ctf | 5.500 | 07-01-38 | AAA | 6,365 | 6,477,034 | |
| 30 Yr Pass Thru Ctf | 5.000 | 11-01-33 | AAA | 4,439 | 4,481,721 | |
| 30 Yr Pass Thru Ctf | 5.000 | 03-01-38 | AAA | 10,378 | 10,454,411 | |
| 30 Yr Pass Thru Ctf | 5.000 | 03-01-38 | AAA | 16,314 | 16,434,263 | |
| 30 Yr Pass Thru Ctf | 5.000 | 05-01-38 | AAA | 20,976 | 21,130,359 | |
| 30 Yr Pass Thru Ctf | 5.000 | 05-01-38 | AAA | 1,003 | 1,009,979 | |
| STRIPS | Zero | 02-01-15 | Aaa | 2,020 | 1,543,869 | |
| Government National Mortgage Assn., | ||||||
| 30 Yr Pass Thru Ctf | 10.500 | 01-15-16 | AAA | 10 | 11,994 | |
| 30 Yr Pass Thru Ctf | 10.000 | 06-15-20 | AAA | 25 | 28,896 | |
| 30 Yr Pass Thru Ctf | 10.000 | 11-15-20 | AAA | 11 | 12,347 | |
See notes to financial statements
| 22 | Bond Fund | Semiannual report |
F I N A N C I A L S T A T E M E N T S
| Interest | Maturity | Credit | Par value | |||
| Issuer, description | rate | date | rating (A) | (000) | Value | |
| U.S. Government Agency (continued) | ||||||
| SBA CMBS Trust, | ||||||
| Sub Bond Ser 2005-1A Class D (S) | 6.219% | 11-15-35 | Baa2 | $850 | $589,824 | |
| Sub Bond Ser 2005-1A Class E (S) | 6.706 | 11-15-35 | Baa3 | 795 | 539,726 | |
| Small Business Administration CMBS Trust, | ||||||
| Sub Bond Ser 2006-1A Class H (S) | 7.389 | 11-15-36 | Ba3 | 1,373 | 1,308,050 | |
| Sub Bond Ser 2006-1A Class J (S) | 7.825 | 11-15-36 | B1 | 850 | 776,820 | |
| Interest | Maturity | Credit | Par value | |||
| Issuer, description | rate | date | rating (A) | (000) | Value | |
| Collateralized mortgage obligations 16.80% | $123,648,707 | |||||
| (Cost $194,996,273) | ||||||
| Collateralized mortgage obligations 16.80% | 123,648,707 | |||||
| American Home Mortgage Assets, | ||||||
| Ser 2006-6 Class A1A (P) | 1.585% | 12-25-46 | AAA | $2,732 | 1,080,511 | |
| Ser 2006-6 Class XP IO | 1.935 | 12-25-46 | BBB | 50,763 | 1,649,788 | |
| Ser 2007-5 Class XP IO | 2.465 | 06-25-47 | AAA | 36,382 | 1,910,076 | |
| American Home Mortgage | ||||||
| Investment Trust, | ||||||
| Ser 2007-1 Class GIOP IO | 2.078 | 05-25-47 | AAA | 29,569 | 1,617,044 | |
| American Tower Trust, | ||||||
| Ser 2007-1A Class D (S) | 5.957 | 04-15-37 | BBB | 3,175 | 2,772,048 | |
| Banc of America Commercial | ||||||
| Mortgage, Inc., | ||||||
| Ser 2005-6 Class A4 (P) | 5.352 | 09-10-47 | AAA | 2,965 | 2,176,412 | |
| Ser 2006-3 Class A4 | 5.889 | 07-10-44 | AAA | 5,260 | 3,688,666 | |
| Ser 2006-2 Class A3 (P) | 5.901 | 05-10-45 | AAA | 5,400 | 4,099,904 | |
| Ser 2006-4 Class A3A | 5.600 | 07-10-46 | AAA | 4,245 | 3,147,372 | |
| Banc of America Funding Corp., | ||||||
| Ser 2006-B Class 6A1 (P) | 5.886 | 03-20-36 | A | 3,467 | 2,580,692 | |
| Ser 2006-D Class 6B1 (P) | 5.940 | 05-20-36 | CCC | 2,113 | 368,784 | |
| Ser 2007-E Class 4A1 (P) | 5.850 | 07-20-47 | AAA | 2,017 | 1,326,143 | |
| Bear Stearns Alt-A Trust, | ||||||
| Ser 2005-3 Class B2 (P) | 5.436 | 04-25-35 | AA+ | 1,166 | 351,153 | |
| Bear Stearns Commercial Mortgage | ||||||
| Securities, Inc., | ||||||
| Ser 2006-PW14 Class D (S) | 5.412 | 12-11-38 | A | 2,480 | 441,633 | |
| Bear Stearns Mortgage Funding Trust, | ||||||
| Ser 2006-AR1 2A1 | 1.615 | 08-25-36 | AAA | 1,993 | 740,217 | |
| Chaseflex Trust, | ||||||
| Ser 2005-2 Class 4A1 | 5.000 | 05-25-20 | AAA | 2,709 | 2,333,487 | |
| Citigroup Commercial Mortgage Trust, | ||||||
| Ser 2006-C4 Class A3 (P) | 5.915 | 03-15-49 | Aaa | 3,350 | 2,183,548 | |
| Citigroup Mortgage Loan Trust, Inc., | ||||||
| Ser 2005-5 Class 2A3 | 5.000 | 08-25-35 | AAA | 1,563 | 1,268,371 | |
| Ser 2005-10 Class 1A5A (P) | 5.839 | 12-25-35 | AAA | 2,633 | 1,382,544 | |
| Citigroup/Deutsche Bank Commercial | ||||||
| Mortgage Trust, | ||||||
| Ser 2005-CD1 Class C (P) | 5.399 | 07-15-44 | AA | 1,030 | 249,434 | |
| ContiMortgage Home Equity Loan Trust, | ||||||
| Ser 1995-2 Class A–5 | 8.100 | 08-15-25 | CCC | 291 | 247,416 | |
See notes to financial statements
| Semiannual report | Bond Fund | 23 |
F I N A N C I A L S T A T E M E N T S
| Interest | Maturity | Credit | Par value | |||
| Issuer, description | rate | date | rating (A) | (000) | Value | |
| Collateralized mortgage obligations (continued) | ||||||
| Countrywide Alternative Loan Trust, | ||||||
| Ser 2005-59 Class 2X IO (P) | 3.188% | 11-20-35 | AAA | $37,828 | $1,134,854 | |
| Ser 2006-0A3 Class X IO (P) | 1.834 | 05-25-36 | AAA | 16,388 | 573,589 | |
| Ser 2006-11CB Class 3A1 | 6.500 | 05-25-36 | A3 | 3,545 | 1,693,744 | |
| Ser 2007-25 Class 1A2 | 6.500 | 11-25-37 | AAA | 5,339 | 2,550,957 | |
| Crown Castle Towers LLC, | ||||||
| Ser 2006-1A Class E (S) | 6.065 | 11-15-36 | Baa3 | 2,900 | 2,005,060 | |
| Ser 2006-1A–Class F (S) | 6.650 | 11-15-36 | Ba1 | 5,065 | 3,297,323 | |
| DB Master Finance LLC, | ||||||
| Ser 2006-1-M1 (S) | 8.285 | 06-20-31 | BB | 1,065 | 819,858 | |
| Ser 2006-1 Class A2 (S) | 5.779 | 06-20-31 | AA | 4,605 | 3,715,084 | |
| Dominos Pizza Master Issuer LLC, | ||||||
| CMO-Remic Ser 2007-1-M1 (S) | 7.629 | 04-25-37 | BB | 3,215 | 1,977,225 | |
| DSLA Mortgage Loan Trust, | ||||||
| Ser 2005-AR5 Class X2 IO | 0.151 | 08-19-45 | AAA | 34,615 | 843,744 | |
| First Horizon Alternative | ||||||
| Mortgage Securities, | ||||||
| Ser 2004-AA5 Class B1 (P) | 5.214 | 12-25-34 | AA | 1,199 | 124,841 | |
| Ser 2006-AA2 Class B1 (G)(P) | 6.135 | 05-25-36 | CCC | 1,323 | 80,290 | |
| Global Signal Trust, | ||||||
| Sub Bond Ser 2004-2A Class D (S) | 5.093 | 12-15-14 | Baa2 | 1,425 | 1,289,126 | |
| Sub Bond Ser 2006-1 Class E (S) | 6.495 | 02-15-36 | Baa3 | 1,850 | 1,778,745 | |
| Global Tower Partners Acquisition | ||||||
| Partners LLC, | ||||||
| Ser 2007-1A Class F (S) | 7.050 | 05-15-37 | BB | 780 | 725,675 | |
| GMAC Commercial Mortgage | ||||||
| Securities, Inc., | ||||||
| Ser 2003-C2 Class B (P) | 5.683 | 05-10-40 | AAA | 7,495 | 6,148,947 | |
| GMAC Mortgage Corp. Loan Trust, | ||||||
| Ser 2006-AR1 Class 2A1 (P) | 5.632 | 04-19-36 | AAA | 2,324 | 1,517,760 | |
| Greenpoint Mortgage Funding Trust, | ||||||
| Ser 2005-AR4 Class 4A2 (P) | 1.755 | 10-25-45 | AAA | 2,902 | 892,104 | |
| Ser 2005-AR1 Class A3 (P) | 1.675 | 06-25-45 | AAA | 641 | 223,338 | |
| Ser 2006-AR1 Class A2A (P) | 1.765 | 02-25-36 | AAA | 4,761 | 1,900,503 | |
| Greenwich Capital Commercial | ||||||
| Funding Corp., | ||||||
| Ser 2007-GG9 Class C | 5.554 | 03-10-39 | AA | 1,810 | 319,154 | |
| Ser 2007-GG9 Class F | 5.633 | 03-10-39 | A | 995 | 151,629 | |
| GSR Mortgage Loan Trust, | ||||||
| Ser 2004-9 Class B1 (G)(P) | 4.523 | 08-25-34 | AAA | 1,738 | 649,426 | |
| Ser 2006-AR1 Class 3A1 (P) | 5.366 | 01-25-36 | AAA | 5,046 | 3,401,845 | |
| HarborView Mortgage Loan Trust, | ||||||
| CMO-Remic Ser 2007-3 Class ES IO (G) | 0.350 | 05-19-47 | AAA | 68,671 | 429,194 | |
| CMO-Remic Ser 2007-4 Class ES IO (G) | 0.350 | 07-19-47 | AAA | 68,722 | 450,986 | |
| CMO-Remic Ser 2007-6 Class ES IO | ||||||
| (G)(S) | 0.343 | 08-19-37 | BB | 49,117 | 306,982 | |
| Ser 2005-16 Class 2A1B (P) | 1.804 | 01-19-36 | AAA | 1,636 | 575,947 | |
| Ser 2005-8 Class 1X IO | 0.544 | 09-19-35 | AAA | 26,554 | 360,963 | |
| Ser 2006-SB1 Class A1A (P) | 3.329 | 12-19-36 | AAA | 3,377 | 1,239,530 | |
See notes to financial statements
| 24 | Bond Fund | Semiannual report |
F I N A N C I A L S T A T E M E N T S
| Interest | Maturity | Credit | Par value | |||
| Issuer, description | rate | date | rating (A) | (000) | Value | |
| Collateralized mortgage obligations (continued) | ||||||
| Indymac Index Mortgage Loan Trust, | ||||||
| Ser 2004-AR13 Class B1 | 5.296% | 01-25-35 | AA | $1,173 | $495,190 | |
| Ser 2005-AR18 Class 1X IO | 1.746 | 10-25-36 | AAA | 62,108 | 1,434,702 | |
| Ser 2005-AR18 Class 2X IO | 1.524 | 10-25-36 | AAA | 76,833 | 622,346 | |
| Ser 2005-AR5 Class B1 (P) | 5.431 | 05-25-35 | AA | 1,648 | 231,911 | |
| Ser 2006-AR19 Class 1B1 (P) | 6.322 | 08-25-36 | CCC | 1,780 | 120,351 | |
| JPMorgan Chase Commercial Mortgage | ||||||
| Security Corp., | ||||||
| Ser 2005-LDP3 Class A4B | 4.996 | 08-15-42 | AAA | 2,865 | 1,971,810 | |
| Ser 2006-LDP7 Class A4 (P) | 6.065 | 04-15-45 | AAA | 3,345 | 2,245,356 | |
| Ser 2005-LDP4 Class B | 5.129 | 10-15-42 | Aa2 | 1,646 | 395,342 | |
| JPMorgan Mortgage Trust, | ||||||
| Ser 2005-S2 Class 2A16 | 6.500 | 09-25-35 | AAA | 2,354 | 2,137,018 | |
| Ser 2005-S3 Class 2A2 | 5.500 | 01-25-21 | AAA | 3,145 | 2,570,296 | |
| Ser 2006-A7 Class 2A5 (P) | 5.799 | 01-25-37 | Caa1 | 4,193 | 1,095,001 | |
| LB–UBS Commercial Mortgage Trust, | ||||||
| Ser 2006-C4 Class A4 (P) | 6.080 | 06-15-38 | AAA | 3,950 | 2,803,279 | |
| Master Adjustable Rate Mortgages Trust, | ||||||
| Ser 2006-2 Class 4A1 (P) | 4.982 | 02-25-36 | AAA | 3,881 | 2,653,304 | |
| Merrill Lynch/Countrywide Commercial | ||||||
| Mtg. Trust, | ||||||
| Ser 2006-2 Class A4 (P) | 6.104 | 06-12-46 | AAA | 4,535 | 3,221,617 | |
| MLCC Mortgage Investors, Inc., | ||||||
| Ser 2007-3 Class M1 (G)(P) | 5.934 | 09-25-37 | AA | 1,565 | 724,928 | |
| Ser 2007-3 Class M2 (G)(P) | 5.934 | 09-25-37 | A | 585 | 470,231 | |
| Ser 2007-3 Class M3 (G)(P) | 5.934 | 09-25-37 | BBB | 375 | 261,283 | |
| Morgan Stanley Capital I, | ||||||
| Ser 2005-IQ10 Class A4A | 5.230 | 09-15-42 | AAA | 2,680 | 1,989,096 | |
| Ser 2006-IQ12 Class E | 5.538 | 12-15-43 | A+ | 2,430 | 437,847 | |
| Ser 2005-HQ7 Class A4 (P) | 5.378 | 11-14-42 | AAA | 3,065 | 2,232,191 | |
| Provident Funding Mortgage Loan Trust, | ||||||
| Ser 2005-1 Class B1 (P) | 4.815 | 05-25-35 | AA | 1,586 | 508,045 | |
| Residential Accredit Loans, Inc., | ||||||
| Ser 2005-QA12 Class NB5 (P) | 5.952 | 12-25-35 | AAA | 2,397 | 1,574,123 | |
| Ser 2007-QS10 Class A1 | 6.500 | 09-25-37 | B+ | 3,500 | 1,672,530 | |
| Ser 2007-QS11 Class A1 | 7.000 | 10-25-37 | B+ | 2,907 | 1,478,103 | |
| Residential Asset Securitization Trust, | ||||||
| Ser 2006-A7CB Class 2A1 | 6.500 | 07-25-36 | B | 3,848 | 1,838,432 | |
| Structured Asset Securities Corp., | ||||||
| Ser 2003-6A Class B1 (P) | 5.261 | 03-25-33 | AA | 2,514 | 1,908,513 | |
| Washington Mutual, Inc., | ||||||
| Ser 2005-6 Class 1CB | 6.500 | 08-25-35 | AAA | 1,531 | 1,038,018 | |
| Ser 2005-AR13 Class B1 (P) | 1.995 | 10-25-45 | AA+ | 4,068 | 1,016,966 | |
| Ser 2005-AR19 Class A1B3 (P) | 1.745 | 12-25-45 | AAA | 1,155 | 469,930 | |
| Ser 2005-AR19 Class B1 (P) | 2.095 | 12-25-45 | AA+ | 2,370 | 592,403 | |
| Ser 2005-AR4 Class 1A1B (P) | 3.419 | 05-25-46 | AAA | 2,913 | 946,787 | |
| Ser 2005-AR6 Class B1 (P) | 1.995 | 04-25-45 | AA+ | 4,566 | 684,945 | |
| Ser 2007-0A4 Class XPPP IO | 0.484 | 04-25-47 | Aaa | 70,139 | 657,555 | |
| Ser 2007-0A5 Class 1XPP IO | 0.478 | 06-25-47 | Aaa | 163,075 | 1,528,829 | |
| Ser 2007-0A6 Class 1XPP IO | 0.428 | 07-25-47 | Aaa | 94,697 | 858,188 | |
| Ser 2007-1 Class B1 (P) | 6.212 | 02-25-37 | CCC | 2,118 | 176,056 | |
See notes to financial statements
| Semiannual report | Bond Fund | 25 |
F I N A N C I A L S T A T E M E N T S
| Interest | Maturity | Credit | Par value | |||||
| Issuer, description | rate | date | rating (A) | (000) | Value | |||
| Collateralized mortgage obligations (continued) | ||||||||
| Wells Fargo Mortgage Backed | ||||||||
| Securites Trust, | ||||||||
| Ser 2006-AR15 Class A3 (P) | 5.660% | 10-25-36 | Baa1 | $4,586 | $1,792,519 | |||
| Interest | Maturity | Credit | Par value | |||||
| Issuer, description | rate | date | rating (A) | (000) | Value | |||
| Asset backed securities 1.03% | $7,561,053 | |||||||
| (Cost $12,023,234) | ||||||||
| Asset Backed Securities 1.03% | 7,561,053 | |||||||
| Lehman XS Trust, | ||||||||
| Ser 2005-5N Class 3A2 (P) | 1.755% | 11-25-35 | AAA | $3,373 | 1,138,596 | |||
| Ser 2005-7N Class 1A1B (P) | 1.695 | 12-25-35 | AAA | 2,379 | 847,224 | |||
| Ser 2006-2N Class 1A2 (P) | 1.735 | 02-25-46 | AAA | 7,363 | 2,384,711 | |||
| Renaissance Home Equity Loan Trust, | ||||||||
| Ser 2005-2 Class AF3 | 4.499 | 08-25-35 | AAA | 1,086 | 1,050,979 | |||
| Ser 2005-2 Class AF4 | 4.934 | 08-25-35 | AAA | 2,365 | 2,139,543 | |||
| Interest | Par value | |||||||
| Issuer, description | rate | (000) | Value | |||||
| Short-term investments 1.12% | $8,256,910 | |||||||
| (Cost $8,256,910) | ||||||||
| Joint Repurchase Agreement 1.12% | 8,236,000 | |||||||
| Joint Repurchase Agreement with Barclays Bank Plc dated | ||||||||
| 11-28-08 at 0.15% to be repurchased at $8,236,137 on | ||||||||
| 1-12-08, collateralized by $8,175,805 U.S. Treasury Note, | ||||||||
| 3.625% due 10-31-09 (valued at $8,400,720, | ||||||||
| including interest). | 0.200% | $8,236 | 8,236,000 | |||||
| Issuer | Shares | Value | ||||||
| Cash Equivalents 0.00% | 20,910 | |||||||
| John Hancock Cash Investment Trust (T)(W) | 1.6231 (Y) | 20,910 | 20,910 | |||||
| Total investments (Cost $895,864,043)† 99.22% | $730,113,169 | |||||||
| Other assets and liabilities, net 0.78% | $5,736,998 | |||||||
| Total net assets 100.00% | $735,850,167 | |||||||
The percentage shown for each investment category is the total value of that category as a percentage of the net assets applicable to common shareholders.
Gtd Guaranteed
IO Interest only (carries notional principal amount)
MTN Medium-Term Note
REIT Real Estate Investment Trust
(A) Credit ratings are unaudited and are rated by Moody’s Investors Service where Standard & Poor’s ratings are not available unless indicated otherwise.
(D) Par value of foreign bonds is expressed in local currency, as shown parenthetically in security description.
See notes to financial statements
| 26 | Bond Fund | Semiannual report |
F I N A N C I A L S T A T E M E N T S
Notes to Schedule of Investments (continued)
(G) Security rated internally by John Hancock Advisers, LLC.
(H) Non-income-producing issuer filed for protection under the Federal Bankruptcy Code or is in default of interest payment.
(L) All or a portion of this security is on loan as of November 30, 2008.
(P) Variable rate obligation. The coupon rate shown represents the rate at period end.
(S) These securities are exempt from registration under Rule 144A of the Securities Act of 1933. Such securities may be resold, normally to qualified institutional buyers, in transactions exempt from registration. Rule 144A securities amounted to $87,976,590 or 11.96% of the net assets of the Fund as of November 30, 2008.
(T) Represents investment of securities lending collateral.
(W) Issuer is an affiliate of John Hancock Advisers, LLC.
(Y) Represents current yield on November 30, 2008.
† At November 30, 2008, the aggregate cost of investment securities for federal income tax purposes was $896,552,632. Net unrealized depreciation aggregated $166,439,463, of which $13,047,586 related to appreciated investment securities and $179,487,049 related to depreciated investment securities.
The Fund had the following credit default swap contracts1 open on November 30, 2008:
| IMPLIED | |||||||
| (PAY)/ | CREDIT | UNREALIZED | |||||
| COUNTERPARTY/ | NOTIONAL | BUY/SELL | RECEIVE | MATURITY | SPREAD AT | APPRECIATION | MARKET |
| REFERENCE OBLIGATIONS | AMOUNT2 | PROTECTION | FIXED RATE | DATE | 11-30-083 | (DEPRECIATION) | VALUE4 |
| Lehman Brothers | |||||||
| General Motors Corp. | $3,000,000 | Sell | 5.35% | Mar 2009 | 156.94 | ($1,794,588) | ($1,794,588) |
| Bank of America | |||||||
| Goodyear Tire & Rubber Co. | $5,000,000 | Sell | 1.51 | Jun 2012 | 18.92 | (1,044,329) | (1,044,329) |
| ($2,838,917) | ($2,838,917) | ||||||
1 If the Fund is a buyer of protection and a credit event occurs, as defined under the terms of that particular swap agreement, the Fund will either receive from the seller of protection an amount equal to the notional amount of the swap and deliver the referenced obligation or underlying securities comprising the referenced index or receive a net settlement amount in the form of cash or securities equal to the notional amount of the swap less the recovery value of the referenced obligation or underlying securities comprising the referenced index.
If the Fund is a seller of protection and a credit event occurs, as defined under the terms of that particular swap agreement, the Fund will either pay to the buyer of protection an amount equal to the notional amount of the swap and take delivery of the referenced obligation or underlying securities comprising the referenced index or pay a net settlement amount in the form of cash or securities equal to the notional amount of the swap less the recovery value of the referenced obligation or underlying securities comprising the referenced index.
2 The maximum potential amount the Fund could be required to make as a seller of credit protection or receive as a buyer of credit protection if a credit event occurs as defined under the terms of that particular swap agreement.
3 Implied credit spreads, represented in absolute terms, utilized in determining the market value of credit default swap agreements on corporate issues or sovereign issues of an emerging country as of period end serve as an indicator of the current status of the payment/performance risk and represent the likelihood or risk of default for the credit derivative. The implied credit spread of a particular referenced entity reflects the cost of buying/selling protection and may include upfront payments required to be made to enter into the agreement. Wider credit spreads represent a deterioration of the referenced entity’s credit soundness and a greater likelihood or risk of default or other credit event occurring as defined under the terms of the agreement. A credit spread identified as “Defaulted” indicates a credit event has occurred for the referenced entity or obligation.
4 The quoted market prices and resulting values for credit default swap agreements on asset-backed securities and credit indices serve as an indicator of the current status of the payment/performance risk and represent the likelihood of an expected liability (or profit) for the credit derivative should the notional amount of the swap agreement be closed/sold as of the period end. Increasing market values, in absolute terms when compared to the notional amount of the swap, represent a deterioration of the referenced entity’s credit soundness and a greater likelihood or risk of default or other credit event occurring as defined under the terms of the agreement.
See notes to financial statements
| Semiannual report | Bond Fund | 27 |
F I N A N C I A L S T A T E M E N T S
Financial statements
Statement of assets and liabilities 11-30-08 (unaudited)
This Statement of Assets and Liabilities is the Fund’s balance sheet. It shows the value of what the Fund owns, is due and owes. You’ll also find the net asset value and the maximum offering price per share.
| Assets | |
| Investments in unaffiliated issuers, at value (Cost $895,843,133) including | |
| $20,500 of securities loaned (Note 2) | $730,092,259 |
| Investments in affiliated issuers, at value (Cost $20,910) | 20,910 |
| Total investments, at value (Cost $895,864,043) | 730,113,169 |
| Foreign currency at value (Cost $68,253) | 55,334 |
| Receivable for shares sold | 485,278 |
| Interest receivable | 10,203,041 |
| Unrealized appreciation of swap contracts (Note 2) | 17,775 |
| Receivable from affiliates | 114,850 |
| Other assets | 12,641 |
| Total assets | 741,002,088 |
| Liabilities | |
| Due to custodian | 722,816 |
| Payable for shares repurchased | 660,276 |
| Payable upon return of securities loaned (Note 2) | 20,910 |
| Unrealized depreciation of swap contracts (Note 2) | 2,856,692 |
| Payable to affiliates | |
| Management fees | 295,749 |
| Distribution and service fees | 205,390 |
| Other | 321,934 |
| Other payables and accrued expenses | 68,154 |
| Total liabilities | 5,151,921 |
| Net assets | |
| Capital paid-in | 938,822,942 |
| Accumulated net realized loss on investments, financial futures contracts, | |
| foreign currency transactions and swap contracts | (34,159,237) |
| Net unrealized depreciation of investments, translation of assets and | |
| liabilities in foreign currencies and swap contracts | (168,602,710) |
| Accumulated distributions in excess of net investment income | (210,828) |
| Net assets | $735,850,167 |
| Net asset value per share | |
| Based on net asset values and shares outstanding — the Fund has an | |
| unlimited number of shares authorized with no par value | |
| Class A ($666,596,425 ÷ 55,106,064 shares) | $12.10 |
| Class B ($30,461,542 ÷ 2,518,426 shares)1 | $12.10 |
| Class C ($21,464,815 ÷ 1,774,433 shares)1 | $12.10 |
| Class I ($16,504,063 ÷ 1,364,344 shares) | $12.10 |
| Class R1 ($823,322 ÷ 67,958 shares) | $12.12 |
| Maximum offering price per share | |
| Class A ($12.10 ÷ 95.5%)2 | $12.67 |
1 Redemption price is equal to net asset value less any applicable contingent deferred sales charge.
2 On single retail sales of less than $100,000. On sales of $100,000 or more and on group sales the offering price is reduced.
See notes to financial statements
| 28 | Bond Fund | Semiannual report |
F I N A N C I A L S T A T E M E N T S
Statement of operations For the period ended 11-30-08 (unaudited)1
This Statement of Operations summarizes the Fund’s investment income earned and expenses incurred in operating the Fund. It also shows net gains (losses) for the period stated.
| Investment income | |
| Interest | $30,239,743 |
| Dividends | 266,683 |
| Securities lending | 63,231 |
| Income from affiliated issuers | 62,135 |
| Total investment income | 30,631,792 |
| Expenses | |
| Investment management fees (Note 4) | 2,124,094 |
| Distribution and service fees (Note 4) | 1,468,505 |
| Transfer agent fees (Note 4) | 752,110 |
| Accounting and legal services fees (Note 4) | 62,024 |
| Custodian fees | 153,100 |
| Printing fees | 64,050 |
| Professional fees | 57,360 |
| Blue sky fees | 42,450 |
| Trustees’ fees | 11,405 |
| Miscellaneous | 17,975 |
| Total expenses | 4,753,073 |
| Less expense reductions (Note 4) | (493) |
| Net expenses | 4,752,580 |
| Net investment income | 25,879,212 |
| Realized and unrealized gain (loss) | |
| Net realized gain (loss) on | |
| Investments | (2,546,175) |
| Financial futures contracts | (157,275) |
| Foreign currency transactions | 152 |
| Swap contracts | 148,812 |
| (2,554,486) | |
| Change in net unrealized appreciation (depreciation) of | |
| Investments | (131,933,567) |
| Financial futures contracts | 64,764 |
| Swap contracts | (2,533,300) |
| Translation of assets and liabilities in foreign currencies | 11,649 |
| (134,390,454) | |
| Net realized and unrealized loss | (136,944,940) |
| Decrease in net assets from operations | ($111,065,728) |
1 Semiannual period from 6-1-08 to 11-30-08.
See notes to financial statements
| Semiannual report | Bond Fund | 29 |
F I N A N C I A L S T A T E M E N T S
Statements of changes in net assets
These Statements of Changes in Net Assets show how the value of the Fund’s net assets has changed during the last two periods. The difference reflects earnings less expenses, any investment gains and losses, distributions, if any, paid to shareholders and the net of Fund share transactions.
| Year | Period | |
| ended | ended | |
| 5-31-08 | 11-30-081 | |
| Increase (decrease) in net assets | ||
| From operations | ||
| Net investment income | $51,718,418 | $25,879,212 |
| Net realized gain (loss) | 5,424,574 | (2,554,486) |
| Change in net unrealized appreciation (depreciation) | (33,550,312) | (134,390,454) |
| Increase (decrease) in net assets resulting from operations | 23,592,680 | (111,065,728) |
| Distributions to shareholders | ||
| From net investment income | ||
| Class A | (47,507,427) | (24,097,263) |
| Class B | (2,418,760) | (1,035,634) |
| Class C | (1,363,427) | (733,023) |
| Class I | (728,380) | (664,200) |
| Class R1 | (58,466) | (31,769) |
| (52,076,460) | (26,561,889) | |
| From Fund share transactions (Note 5) | (12,435,902) | (43,989,330) |
| Total decrease | (40,919,682) | (181,616,947) |
| Net assets | ||
| Beginning of period | 958,386,796 | 917,467,114 |
| End of period2 | $917,467,114 | $735,850,167 |
1 Semiannual period from 6-1-08 to 11-30-08. Unaudited.
2 Includes accumulated/(distributions in excess of) net investment income of $471,849 and ($210,828), respectively.
See notes to financial statements
| 30 | Bond Fund | Semiannual report |
F I N A N C I A L S T A T E M E N T S
Financial highlights
The Financial Highlights show how the Fund’s net asset value for a share has changed since the end of the previous period.
CLASS A SHARES
| Period ended | 5-31-04 | 5-31-05 | 5-31-06 | 5-31-07 | 5-31-08 | 11-30-081 |
| Per share operating performance | ||||||
| Net asset value, beginning of period | $15.69 | $14.98 | $15.30 | $14.51 | $14.75 | $14.31 |
| Net investment income2 | 0.70 | 0.67 | 0.68 | 0.75 | 0.81 | 0.42 |
| Net realized and unrealized gain | ||||||
| (loss) on investments | (0.65) | 0.38 | (0.74) | 0.26 | (0.43) | (2.20) |
| Total from investment operations | 0.05 | 1.05 | (0.06) | 1.01 | 0.38 | (1.78) |
| Less distributions | ||||||
| From net investment income | (0.76) | (0.73) | (0.72) | (0.77) | (0.82) | (0.43) |
| From capital paid-in | — | — | (0.01) | — | — | — |
| Total distributions | (0.76) | (0.73) | (0.73) | (0.77) | (0.82) | (0.43) |
| Net asset value, end of period | $14.98 | $15.30 | $14.51 | $14.75 | $14.31 | $12.10 |
| Total return (%)3 | 0.31 | 7.114 | (0.45)4 | 7.08 | 2.57 | (12.68)4,5 |
| Ratios and supplemental data | ||||||
| Net assets, end of period | ||||||
| (in millions) | $1,047 | $1,012 | $899 | $870 | $824 | $667 |
| Ratios (as a percentage | ||||||
| of average net assets): | ||||||
| Expenses before reductions | 1.09 | 1.06 | 1.08 | 1.05 | 1.05 | 1.086 |
| Expenses net of all fee waivers | 1.09 | 1.05 | 1.07 | 1.05 | 1.05 | 1.086 |
| Expenses net of all fee waivers | ||||||
| and credits | 1.09 | 1.05 | 1.07 | 1.05 | 1.05 | 1.086 |
| Net investment income | 4.55 | 4.41 | 4.56 | 5.11 | 5.54 | 6.136 |
| Portfolio turnover (%) | 241 | 139 | 135 | 106 | 90 | 39 |
1 Semiannual period from 6-1-08 to 11-30-08. Unaudited.
2 Based on the average of the shares outstanding.
3 Assumes dividend reinvestment and does not reflect the effect of sales charges.
4 Total returns would have been lower had certain expenses not been reduced during the periods shown.
5 Not annualized.
6 Annualized.
See notes to financial statements
| Semiannual report | Bond Fund | 31 |
F I N A N C I A L S T A T E M E N T S
Financial highlights
CLASS B SHARES
| Period ended | 5-31-04 | 5-31-05 | 5-31-06 | 5-31-07 | 5-31-08 | 11-30-081 |
| Per share operating performance | ||||||
| Net asset value, beginning of period | $15.69 | $14.98 | $15.30 | $14.51 | $14.75 | $14.31 |
| Net investment income2 | 0.59 | 0.57 | 0.58 | 0.65 | 0.71 | 0.37 |
| Net realized and unrealized gain | ||||||
| (loss) on investments | (0.65) | 0.37 | (0.74) | 0.26 | (0.43) | (2.20) |
| Total from investment operations | (0.06) | 0.94 | (0.16) | 0.91 | 0.28 | (1.83) |
| Less distributions | ||||||
| From net investment income | (0.65) | (0.62) | (0.62) | (0.67) | (0.72) | (0.38) |
| From capital paid-in | — | — | (0.01) | — | — | — |
| Total distributions | (0.65) | (0.62) | (0.63) | (0.67) | (0.72) | (0.38) |
| Net asset value, end of period | $14.98 | $15.30 | $14.51 | $14.75 | $14.31 | $12.10 |
| Total return (%)3 | (0.39) | 6.374 | (1.14)4 | 6.33 | 1.864 | (12.99)4,5 |
| Ratios and supplemental data | ||||||
| Net assets, end of period | ||||||
| (in millions) | $164 | $128 | $87 | $59 | $42 | $30 |
| Ratios (as a percentage | ||||||
| of average net assets): | ||||||
| Expenses before reductions | 1.79 | 1.76 | 1.78 | 1.75 | 1.76 | 1.786 |
| Expenses net of all fee waivers | 1.79 | 1.75 | 1.77 | 1.75 | 1.76 | 1.786 |
| Expenses net of all fee waivers | ||||||
| and credits | 1.79 | 1.75 | 1.77 | 1.75 | 1.75 | 1.786 |
| Net investment income | 3.84 | 3.70 | 3.84 | 4.40 | 4.82 | 5.426 |
| Portfolio turnover (%) | 241 | 139 | 135 | 106 | 90 | 39 |
1 Semiannual period from 6-1-08 to 11-30-08. Unaudited.
2 Based on the average of the shares outstanding.
3 Assumes dividend reinvestment and does not reflect the effect of sales charges.
4 Total returns would have been lower had certain expenses not been reduced during the periods shown.
5 Not annualized.
6 Annualized.
See notes to financial statements
| 32 | Bond Fund | Semiannual report |
F I N A N C I A L S T A T E M E N T S
Financial highlights
CLASS C SHARES
| Period ended | 5-31-04 | 5-31-05 | 5-31-06 | 5-31-07 | 5-31-08 | 11-30-081 |
| Per share operating performance | ||||||
| Net asset value, beginning of period | $15.69 | $14.98 | $15.30 | $14.51 | $14.75 | $14.31 |
| Net investment income2 | 0.59 | 0.57 | 0.58 | 0.65 | 0.71 | 0.37 |
| Net realized and unrealized gain | ||||||
| (loss) on investments | (0.64) | 0.37 | (0.74) | 0.26 | (0.43) | (2.20) |
| Total from investment operations | (0.05) | 0.94 | (0.16) | 0.91 | 0.28 | (1.83) |
| Less distributions | ||||||
| From net investment income | (0.66) | (0.62) | (0.62) | (0.67) | (0.72) | (0.38) |
| From capital paid-in | — | — | (0.01) | — | — | — |
| Total distributions | (0.66) | (0.62) | (0.63) | (0.67) | (0.72) | (0.38) |
| Net asset value, end of period | $14.98 | $15.30 | $14.51 | $14.75 | $14.31 | $12.10 |
| Total return (%)3 | (0.39) | 6.374 | (1.14)4 | 6.33 | 1.864 | (12.99)4,5 |
| Ratios and supplemental data | ||||||
| Net assets, end of period | ||||||
| (in millions) | $32 | $28 | $24 | $23 | $29 | $21 |
| Ratios (as a percentage | ||||||
| of average net assets): | ||||||
| Expenses before reductions | 1.79 | 1.76 | 1.78 | 1.75 | 1.75 | 1.786 |
| Expenses net of all fee waivers | 1.79 | 1.75 | 1.77 | 1.75 | 1.75 | 1.786 |
| Expenses net of all fee waivers | ||||||
| and credits | 1.79 | 1.75 | 1.77 | 1.75 | 1.75 | 1.786 |
| Net investment income | 3.84 | 3.71 | 3.86 | 4.41 | 4.86 | 5.426 |
| Portfolio turnover (%) | 241 | 139 | 135 | 106 | 90 | 39 |
1 Semiannual period from 6-1-08 to 11-30-08. Unaudited.
2 Based on the average of the shares outstanding.
3 Assumes dividend reinvestment and does not reflect the effect of sales charges.
4 Total returns would have been lower had certain expenses not been reduced during the periods shown.
5 Not annualized.
6 Annualized.
See notes to financial statements
| Semiannual report | Bond Fund | 33 |
F I N A N C I A L S T A T E M E N T S
Financial highlights
CLASS I SHARES
| Period ended | 5-31-04 | 5-31-05 | 5-31-06 | 5-31-07 | 5-31-08 | 11-30-081 |
| Per share operating performance | ||||||
| Net asset value, beginning of period | $15.69 | $14.98 | $15.30 | $14.51 | $14.74 | $14.31 |
| Net investment income2 | 0.76 | 0.73 | 0.75 | 0.81 | 0.88 | 0.45 |
| Net realized and unrealized gain | ||||||
| (loss) on investments | (0.64) | 0.38 | (0.74) | 0.25 | (0.43) | (2.20) |
| Total from investment operations | 0.12 | 1.11 | 0.01 | 1.06 | 0.45 | (1.75) |
| Less distributions | ||||||
| From net investment income | (0.83) | (0.79) | (0.79) | (0.83) | (0.88) | (0.46) |
| From capital paid-in | — | — | (0.01) | — | — | — |
| Total distributions | (0.83) | (0.79) | (0.80) | (0.83) | (0.88) | (0.46) |
| Net asset value, end of period | $14.98 | $15.30 | $14.51 | $14.74 | $14.31 | $12.10 |
| Total return (%)3 | 0.78 | 7.55 | (0.01) | 7.53 | 3.01 | (12.49)4,5 |
| Ratios and supplemental data | ||||||
| Net assets, end of period | ||||||
| (in millions) | $5 | $5 | $5 | $5 | $22 | $17 |
| Ratios (as a percentage | ||||||
| of average net assets): | ||||||
| Expenses before reductions | 0.63 | 0.65 | 0.64 | 0.62 | 0.62 | 0.645 |
| Expenses net of all fee waivers | 0.63 | 0.65 | 0.64 | 0.62 | 0.62 | 0.645 |
| Expenses net of all fee waivers | ||||||
| and credits | 0.63 | 0.65 | 0.64 | 0.62 | 0.62 | 0.645 |
| Net investment income | 4.98 | 4.82 | 4.99 | 5.54 | 6.08 | 6.565 |
| Portfolio turnover (%) | 241 | 139 | 135 | 106 | 90 | 39 |
1 Semiannual period from 6-1-08 to 11-30-08. Unaudited.
2 Based on the average of the shares outstanding.
3 Assumes dividend reinvestment.
4 Not annualized.
5 Annualized.
See notes to financial statements
| 34 | Bond Fund | Semiannual report |
F I N A N C I A L S T A T E M E N T S
Financial highlights
CLASS R1 SHARES
| Period ended | 5-31-041 | 5-31-05 | 5-31-06 | 5-31-07 | 5-31-08 | 11-30-082 |
| Per share operating performance | ||||||
| Net asset value, beginning of period | $14.93 | $14.98 | $15.30 | $14.51 | $14.74 | $14.38 |
| Net investment income3 | 0.54 | 0.67 | 0.59 | 0.65 | 0.77 | 0.39 |
| Net realized and unrealized gain | ||||||
| (loss) on investments | 0.10 | 0.36 | (0.75) | 0.26 | (0.42) | (2.20) |
| Total from investment operations | 0.64 | 1.03 | (0.16) | 0.91 | 0.35 | (1.81) |
| Less distributions | ||||||
| From net investment income | (0.59) | (0.71) | (0.62) | (0.68) | (0.71) | (0.45) |
| From capital paid-in | — | — | (0.01) | — | — | — |
| Total distributions | (0.59) | (0.71) | (0.63) | (0.68) | (0.71) | (0.45) |
| Net asset value, end of period | $14.98 | $15.30 | $14.51 | $14.74 | $14.38 | $12.12 |
| Total return (%)4 | 4.305 | 7.02 | (1.09) | 6.38 | 2.30 | (12.84)5 |
| Ratios and supplemental data | ||||||
| Net assets, end of period | ||||||
| (in millions) | —6 | $—6 | $1 | $1 | $1 | $1 |
| Ratios (as a percentage | ||||||
| of average net assets): | ||||||
| Expenses before reductions | 1.387 | 1.12 | 1.76 | 1.72 | 1.34 | 1.487 |
| Expenses net of all fee waivers | 1.387 | 1.12 | 1.76 | 1.72 | 1.34 | 1.487 |
| Expenses net of all fee waivers | ||||||
| and credits | 1.387 | 1.12 | 1.76 | 1.72 | 1.34 | 1.487 |
| Net investment income | 4.407 | 4.44 | 3.95 | 4.45 | 5.30 | 5.697 |
| Portfolio turnover (%) | 241 | 139 | 135 | 106 | 90 | 39 |
1 Class R1 shares began operations on 8-5-03.
2 Semiannual period from 6-1-08 to 11-30-08. Unaudited.
3 Based on the average of the shares outstanding.
4 Assumes dividend reinvestment.
5 Not annualized.
6 Less than $500,000.
7 Annualized.
See notes to financial statements
| Semiannual report | Bond Fund | 35 |
Notes to financial statements (unaudited)
Note 1
Organization
John Hancock Bond Fund (the Fund) is a diversified series of John Hancock Sovereign Bond Fund, an open-end management investment company registered under the Investment Company Act of 1940, as amended (the 1940 Act). The investment objective of the Fund is to generate a high level of current income, consistent with prudent investment risk.
The Trustees have authorized the issuance of multiple classes of shares of the Fund, designated as Class A, Class B, Class C, Class I and Class R1 shares. The shares of each class represent an interest in the same portfolio of investments of the Fund and have equal rights as to voting, redemptions, dividends and liquidation, except that certain expenses, subject to the approval of the Trustees, may be applied differently to each class of shares in accordance with current regulations of the Securities and Exchange Commission (SEC) and the Internal Revenue Service. Shareholders of a class that bears distribution and service expenses under the terms of a distribution plan have exclusive voting rights to that distribution plan. Class B shares will convert to Class A shares eight years after purchase.
Note 2
Significant accounting policies
The financial statements have been prepared in conformity with accounting principles generally accepted in the United States of America, which require management to make certain estimates and assumptions at the date of the financial statements. Actual results could differ from those estimates.
The Fund has adopted the provisions of Financial Accounting Standards Board (FASB) Staff Position No. FAS 133-1 and FIN 45-4, “Disclosures about Credit Derivatives and Certain Guarantees: An Amendment of FASB Statement No. 133 and FASB Interpretation No. 45” (the Position). The Position amends FASB Statement No. 133 (FAS 133), “Accounting for Derivative Instruments and Hedging Activities”, and also amends FASB Interpretation No. 45 (FIN 45), Guarantor’s Accounting and Disclosure Requirements for Guarantees, Including Indirect Guarantees of Indebtedness of Others. The amendments to FAS 133 include required disclosure for the nature and terms of the credit derivative, reasons for entering into the credit derivative, the events or circumstances that would require the seller to perform under the credit derivative, and the current status of the payment/ performance risk of the credit derivative, the maximum potential amo unt of future payments (undiscounted) the seller could be required to make under the credit derivative, the fair value of the credit derivative, and the nature of any recourse provisions and assets held either as collateral or by third parties. The amendments to FIN 45 require additional disclosures about the current status of the payment/performance risk of a guarantee. All changes to accounting policies have been made in accordance with the Position and incorporated for the current period as part of the Notes to the Schedules of Investments and disclosures within Note 2, Credit default swap agreements.
The following summarizes the significant accounting policies of the Fund:
Security valuation
The net asset value of the Fund is determined daily as of the close of the New York Stock Exchange (NYSE), normally at 4:00 P.M., Eastern Time. Short-term debt investments that have a remaining maturity of 60 days or less are valued at amortized cost, and thereafter assume a constant amortization to maturity of any discount or premium, which approximates market value. Investments in John Hancock Cash Investment Trust (JHCIT), an affiliate of John Hancock Advisers, LLC (the Adviser), a wholly owned subsidiary of
| 36 | Bond Fund | Semiannual report |
John Hancock Financial Services, Inc., a subsidiary of Manulife Financial Corporation (MFC), are valued at their net asset value each business day. All other securities held by the Fund are valued at the last sale price or official closing price (closing bid price or last evaluated price if no sale has occurred) as of the close of business on the principal securities exchange (domestic or foreign) on which they trade or, lacking any sales, at the closing bid price. Securities traded only in the over-the-counter market are valued at the last bid price quoted by brokers making markets in the securities at the close of trading. Securities for which there are no such quotations, principally debt securities, are valued based on the evaluated prices provided by an independent pricing service, which utilizes both dealer-supplied and electronic data processing techniques, which take into account factors such as institutional-size trading in similar groups of securities, yield, q uality, coupon rate, maturity, type of issue, trading characteristics and other market data.
Other portfolio securities for which no such quotations are readily available are valued at fair value as determined in good faith by the Trust’s Pricing Committee in accordance with procedures adopted by the Board of Trustees. Generally, trading in non-U.S. securities is substantially completed each day at various times prior to the close of trading on the NYSE. The values of such securities used in computing the net asset value of the Fund’s shares are generally determined as of such times. Occasionally, significant events that affect the values of such securities may occur between the times at which such values are generally determined and the close of the NYSE. Upon such an occurrence, these securities will be valued at fair value as determined in good faith under consistently applied procedures established by and under the general supervision of the Board of Trustees. Debt securities whose prices cannot be provided by an independent pricing service are val ued at prices provided by broker-dealers.
Valuations change in response to many factors including the historical and prospective earnings of the issuer, the value of the issuer’s assets, general economic conditions, interest rates, investor perceptions and market liquidity.
The Fund adopted Statement of Financial Accounting Standards No. 157 (FAS 157), Fair Value Measurements, effective with the beginning of the Fund’s fiscal year. FAS 157 established a three-tier hierarchy to prioritize the assumptions, referred to as inputs, used in valuation techniques to measure fair value. The three-tier hierarchy of inputs is summarized in the three broad levels listed below:
Level 1 — Quoted prices in active markets for identical securities.
Level 2 — Prices determined using other significant observable inputs. Observable inputs are inputs that other market participants would use in pricing a security. These may include quoted prices for similar securities, interest rates, prepayment speeds, credit risk and others.
Level 3 — Prices determined using significant unobservable inputs. In situations where quoted prices or observable inputs are unavailable, such as when there is little or no market activity for an investment, unobservable inputs may be used. Unobservable inputs reflect the Fund’s own assumptions about the factors that market participants would use in pricing an investment and would be based on the best information available.
The inputs or methodology used for valuing securities are not necessarily an indication of the risk associated with investing in those securities.
| Semiannual report | Bond Fund | 37 |
The following is a summary of the inputs used to value the Fund’s net assets as of November 30, 2008:
| INVESTMENTS IN | OTHER FINANCIAL | ||
| VALUATION INPUTS | SECURITIES | INSTRUMENTS* | |
| Level 1 — Quoted Prices | $2,937,937 | — | |
| Level 2 — Other Significant Observable Inputs | 700,951,291 | ($2,838,917) | |
| Level 3 — Significant Unobservable Inputs | 26,223,941 | — | |
| Total | $730,113,169 | ($2,838,917) | |
*Other financial instruments are derivative instruments not reflected in the Portfolio of Investments, such as futures, forwards and swap contracts, which are valued at the unrealized appreciation/depreciation on the instrument.
The following is a reconciliation of Level 3 assets for which significant unobservable inputs were used to determine fair value:
| INVESTMENTS IN | OTHER FINANCIAL | ||
| SECURITIES | INSTRUMENTS | ||
| Balance as of May 31, 2008 | $32,387,014 | — | |
| Accrued discounts/premiums | 16,819 | — | |
| Realized gain (loss) | 386,262 | — | |
| Change in unrealized appreciation (depreciation) | (6,382,444) | — | |
| Net purchases (sales) | (6,658,435) | — | |
| Transfers in and/or out of Level 3 | 6,474,725 | — | |
| Balance as of November 30, 2008 | $26,223,941 | — | |
Joint repurchase agreement
Pursuant to an exemptive order issued by the SEC, the Fund, along with other registered investment companies having a management contract with the Adviser, may participate in a joint repurchase agreement transaction. Aggregate cash balances are invested in one or more large repurchase agreements, whose underlying securities are obligations of the U.S. government and/or its agencies. The Fund’s custodian bank receives delivery of the underlying securities for the joint account on the Fund’s behalf. When a Fund enters into a repurchase agreement, it receives delivery of collateral, the amount of which at the time of purchase and each subsequent business day is required to be maintained at such a level that the value is generally 102% of the repurchase amount.
Foreign currency translation
The books and records of the Fund are maintained in U.S. dollars. Investment securities and other assets and liabilities denominated in a foreign currency are translated into U.S. dollars at the prevailing exchange rates at period end. Purchases and sales of investment securities, income and expenses are translated into U.S. dollars at the prevailing exchange rates on the respective dates of the transactions.
Net realized and unrealized gains and losses on foreign currency transactions represent net gains and losses between trade and settlement dates on securities transactions, the disposition of forward foreign currency exchange contracts and foreign currencies, and the difference between the amount of net investment income accrued and the U.S. dollar amount actually received. That portion of both realized and unrealized gains and losses on investments that results from fluctuations in foreign currency exchange rates is not separately disclosed but is included with net realized and unrealized gain/appreciation and loss/depreciation on investments.
Investment transactions
Investment transactions are accounted for on a trade date plus one basis for daily net asset value calculations. However, for financial reporting purposes, investment security transactions are reported on trade date. Interest income is recorded on the accrual
| 38 | Bond Fund | Semiannual report |
basis. Dividend income is recorded on the ex-dividend date net of foreign withholding taxes. Discounts/premiums are accreted/amortized for financial reporting purposes. Realized gains and losses from investment transactions are recorded on an identified cost basis.
Inflation indexed securities are fixed-income securities whose principal value is periodically adjusted according the rate of inflation. Interest is accrued based upon the principal value, which is adjusted for inflation. Principal of inflation index protected securities is increased or decreased by the rate of change in the Consumer Price Index. Interest income includes accretion of discounts and amortization of premiums as well as accretion or amortization of principal of inflation index protected securities.
Class allocations
Income, common expenses and realized and unrealized gains (losses) are determined at the fund level and allocated daily to each class of shares based on the appropriate net asset value of the respective classes. Distribution and service fees, if any, and transfer agent fees for Class A, Class B, Class C Class I and Class R1 shares are calculated daily at the class level based on the appropriate net asset value of each class and the specific expense rate(s) applicable to each class.
Expenses
The majority of expenses are directly identifiable to an individual fund. Trust expenses that are not readily identifiable to a specific fund are allocated in such a manner as deemed equitable, taking into consideration, among other things, the nature and type of expense and the relative size of the funds. Expense estimates are accrued in the period to which they relate and adjustments are made when actual amounts are known.
Bank borrowings
The Fund is permitted to have bank borrowings for temporary or emergency purposes, including the meeting of redemption requests that otherwise might require the untimely disposition of securities. The Fund has entered into a line of credit agreement with The Bank of New York Mellon (BNYM), the Swing Line Lender and Administrative Agent. This agreement enables the Fund to participate, with other funds managed by the Adviser, in an unsecured line of credit with BNYM, which permits borrowings of up to $150 million, collectively. Interest is charged to each fund based on its borrowing. In addition, a commitment fee is charged to each fund based on the average daily unused portion of the line of credit and is allocated among the participating funds. The Fund had no borrowing activity under the line of credit during the period ended November 30, 2008. There was no outstanding borrowing under the line of credit on November 30, 2008.
Pursuant to the custodian agreement, the Custodian may, in its discretion, advance funds to the Fund to make properly authorized payments. When such payments result in an overdraft, the Fund is obligated to repay the Custodian for any overdraft together with interest due thereon. The Custodian has a lien, security interest or security entitlement in any Fund property, to the maximum extent permitted by law to the extent of any overdraft.
Securities lending
The Fund may lend portfolio securities from time to time in order to earn additional income. The Fund retains beneficial ownership of the securities it has loaned and continues to receive interest and dividends paid by the issuer of securities and to participate in any changes in their value. On the settlement date of the loan, the Fund receives cash collateral against the loaned securities and maintains the cash collateral in an amount not less than 100% of the market value of the loaned securities during the period of the loan. The market value of the loaned securities is determined at the close of business of the Fund and any additional required cash collateral is delivered to the Fund on the next business day. Cash collateral received is invested in the JHCIT. If the borrower is unable to return the securities loaned upon sale of security and/or other fund
| Semiannual report | Bond Fund | 39 |
instructions because of insolvency or other reasons, a fund could experience delays and costs in recovering the securities loaned or in gaining access to the collateral and could prevent the fund from voting on proxy statements. The Fund may receive compensation for lending their securities either in the form of fees, guarantees, and/or by retaining a portion of interest on the investment of any cash received as collateral.
The Fund has entered into an agreement with Morgan Stanley & Co., Inc. and MS Securities Services, Inc. (collectively, Morgan Stanley) which permits the Fund to lend securities to Morgan Stanley on a principal basis. Morgan Stanley is the primary borrower of securities of the Fund. The risk of having one primary borrower of Fund securities (as opposed to several borrowers in an agency relationship) is that should Morgan Stanley fail financially, all securities lent may be affected by the failure and by any delays in recovery of the securities (or loss of rights in the collateral).
Futures
The Fund may purchase and sell financial futures contracts and options on those contracts. The Fund invests in contracts based on financial instruments such as U.S. Treasury Bonds or Notes or on securities indices such as the Standard & Poor’s 500 Index, in order to hedge against a decline in the value of securities owned by the Fund.
Initial margin deposits required upon entering into futures contracts are satisfied by the delivery of specific securities or cash as collateral to the broker (the Fund’s agent in acquiring the futures position). If the position is closed out by an opposite position prior to the settlement date of the futures contract, a final determination of variation margin is made, cash is required to be paid to or released by the broker and the Fund realizes a gain or loss.
When the Fund sells a futures contract based on a financial instrument, the Fund becomes obligated to deliver that kind of instrument at an agreed upon date for a specified price. The Fund realizes a gain or loss depending on whether the price of an offsetting purchase is less or more than the price of the initial sale or on whether the price of an offsetting sale is more or less than the price of the initial purchase. The Fund could be exposed to risks if it could not close out futures positions because of an illiquid secondary market or the inability of counterparties to meet the terms of their contracts. Futures contracts are valued at the quoted daily settlement prices established by the exchange on which they trade.
The Fund had no open financial futures contracts on November 30, 2008.
Swap contracts
The Fund may enter into interest rate, credit default, cross- currency, and other forms of swap transactions to manage its exposure to credit, currency and interest rate risks or to enhance the Fund’s income. Swap agreements are privately negotiated agreements between a Fund and a counterparty to exchange investment cash flows, assets, foreign currencies or market-linked returns at specified, future intervals. In connection with these agreements, the fund will hold cash or identify securities equal to the net amount, if any, of the Fund’s obligations with respect to the swap agreements to provide assets of value and recourse in the event of default or bankruptcy/insolvency.
Swaps are marked to market daily based upon values from third party vendors or quotations from market makers to the extent available and the change in value, if any, is recorded as an unrealized appreciation/depreciation of swap contracts on the Statements of Assets and Liabilities. In the event that market quotations are not readily available or deemed reliable, certain swap agreements may be valued at fair value as determined in good faith by the Trust’s Pricing Committee in accordance with procedures adopted by the Board of Trustees.
Entering into swap agreements involves, to varying degrees, elements of credit, market and documentation risk in excess of the amounts recognized on the Statements of Assets and Liabilities. Such risks involve the possibility
| 40 | Bond Fund | Semiannual report |
that there will be no liquid market for these agreements, that the counterparty to the agreements may default on its obligation to perform or disagree as to the meaning of contractual terms in the agreements and that there may be unfavorable changes in interest rates. The Fund may also suffer losses if it is unable to terminate outstanding swap contracts or reduce its exposure through offsetting transactions.
Credit default swap agreements
Credit default swaps (CDS) involve the exchange of a fixed rate premium (paid by “the Buyer”) for protection against the loss in value of an underlying debt instrument, referenced entity or index in the event of a defined credit event (such as payment default or bankruptcy). Under the terms of the swap, one party acts as a “guarantor” (the Seller) receiving a periodic payment that is a fixed percentage applied to a notional principal amount. In return, the party agrees to remedies which are specified within the credit default agreement and are dependent on the referenced obligation, entity or credit index. The Fund may enter into CDS in which the Fund may act as the Buyer or Seller. By acting as the Seller, the Fund effectively adds leverage to its portfolio because, in addition to its total net assets, the Fund would be subject to investment exposure on the notional amount of the swap.
If the Fund is the Seller and a credit event occurs, the Fund will either pay to the Buyer the notional amount of the swap and take delivery of the referenced obligation, other deliverable obligations or underlying securities comprising the referenced index or pay a net settlement amount in the form of cash or securities equal to the notional amount of the swap less the recovery value of the referenced obligation or underlying securities comprising the referenced index. If the Fund is the Buyer of protection and a credit event occurs the Fund will either receive an amount equal to the notional amount of the swap and deliver the referenced obligation, other deliverable obligations or underlying securities comprising the referenced index or receive a net settlement amount in the form of cash or securities equal to the notional amount of the swap less the recovery value of the referenced obligation or underlying securities comprising the refer enced index. Recovery values are assumed by market makers considering either industry standard recovery rates or entity specific factors and considerations until a credit event occurs. If a credit event has occurred, the recovery value is determined by a facilitated auction whereby a minimum number of allowable broker bids, together with a specified valuation method, are used to calculate the settlement value.
CDS agreements on corporate issues, sovereign issues of an emerging country and asset-backed securities involve the Buyer making a stream of payments to the Seller in exchange for the right to receive a specified return in the event of a default or other credit event. If a credit event occurs on corporate issues or sovereign issues of an emerging country and cash settlement is not elected, a variety of other deliverable obligations may be delivered in lieu of the specific referenced obligation. The ability to deliver other obligations may result in a cheapest-to-deliver option (the Buyer’s right to choose the deliverable obligation with the lowest value following a credit event). Deliverable obligations on CDS on asset-backed securities would be limited to the specific referenced obligation as performance for asset-backed securities can vary across deals. Prepayments, principal pay-downs, and other write down or loss events on the underlying mortgage loans will redu ce the outstanding principal balance of the referenced obligation. These reductions may be temporary or permanent as defined under the terms of the swap agreement and the notional amount for the swap agreement will be adjusted by corresponding amounts. The Fund may use CDS on these types of securities to provide a measure of protection against defaults of the issuers or to take an active long or short position with respect to the likelihood of a particular issuer’s default.
Implied credit spreads, represented in absolute terms, utilized in determining the market value of CDS agreements on corporate issues
| Semiannual report | Bond Fund | 41 |
or sovereign issues of an emerging country as of period end are disclosed in the footnotes to the Schedules of Investments and serve as an indicator of the current status of the payment/ performance risk and represent the likelihood or risk of default for the credit derivative. The implied credit spread of a particular referenced entity reflects the cost of buying/selling protection and may include upfront payments required to be made to enter into the agreement. For CDS agreements on asset-backed securities and credit indices, the quoted market prices and resulting values serve as the indicator of the current status of the payment/ performance risk. Wider credit spreads and increasing market values, in absolute terms when compared to the notional amount of the swap, represent a deterioration of the referenced entity’s credit soundness and a greater likelihood or risk of default or other credit event occurring as defined under the terms of the agreement.
The maximum potential amount of future payments (undiscounted) that the Fund as the Seller could be required to make under a CDS agreement would be an amount equal to the notional amount of the agreement. Notional amounts of all CDS agreements outstanding as of November 30, 2008 for which the Fund is the Seller are disclosed in the footnotes to the Schedules of Investments. These potential amounts would be partially offset by any recovery values of the respective referenced obligations, upfront payments received upon entering into the agreement, or net amounts received from the settlement of buy protection CDS agreements entered into by the Fund for the same referenced entity or entities.
Federal income taxes
The Fund qualifies as a regulated investment company by complying with the applicable provisions of the Internal Revenue Code and will not be subject to federal income tax on taxable income that is distributed to shareholders. Therefore, no federal income tax provision is required.
For federal income tax purposes, the Fund has $31,001,431 of a capital loss carryforward available, to the extent provided by regulations, to offset future net realized capital gains. To the extent that such carryforward is used by the Fund, no capital gain distributions will be made. The loss carryforwards expire as follows: May 31, 2009 — $11,364,216, May 31, 2010 — $35,777, May 31, 2014 — $505,866 and May 31, 2015 — $19,095,572.
The Fund is subject to the provisions of Financial Accounting Standards Board (FASB) Interpretation No. 48, Accounting for Uncertainty in Income Taxes, an interpretation of FASB Statement 109 (FIN 48). FIN 48 prescribes a minimum threshold for financial statement recognition of the benefit of a tax position taken or expected to be taken in a tax return. The implementation of FIN 48 did not have a material impact on the Fund’s financial statements. Each of the Fund’s federal tax returns for the prior three years remain subject to examination by the Internal Revenue Service.
New accounting pronouncements
In March 2008, FASB No. 161 (FAS 161), Disclosures about Derivative Instruments and Hedging Activities, an amendment of FAS 133, was issued and is effective for fiscal years and interim reporting periods beginning after November 15, 2008. FAS 161 amends and expands the disclosure requirements of FAS 133 in order to provide financial statement users an understanding of a company’s use of derivative instruments, how derivative instruments are accounted for under FAS 133 and related interpretations and how these instruments affect a company’s financial position, performance, and cash flows. FAS 161 requires companies to disclose information detailing the objectives and strategies for using derivative instruments, the level of derivative activity entered into by the company, and any credit risk-related contingent features of the agreements. Management is currently evaluating the adoption of FAS 161 o n the Fund’s financial statement disclosures.
Distribution of income and gains
The Fund records distributions to shareholders from net investment income and net realized gains, if any, on the ex-dividend date. The Fund
| 42 | Bond Fund | Semiannual report |
generally declares dividends daily and pays them monthly. Capital gains, if any, are distributed annually. During the year ended May 31, 2008, the tax character of distributions paid was as follows: ordinary income $52,076,460. Distributions paid by the Fund with respect to each class of shares are calculated in the same manner, at the same time and are in the same amount, except for the effect of expenses that may be applied differently to each class.
Such distributions, on a tax basis, are determined in conformity with income tax regulations, which may differ from accounting principles generally accepted in the United States of America. Distributions in excess of tax basis earnings and profits, if any, are reported in the Fund’s financial statements as a return of capital.
Note 3
Risks and uncertainties
Derivatives and counterparty risk
The use of derivative instruments may involve risks different from, or potentially greater than, the risks associated with investing directly in securities. Specifically, derivative instruments exposes a fund to the risk that the counterparty to an over-the-counter (OTC) derivatives contract will be unable or unwilling to make timely settlement payments or otherwise to honor its obligations. OTC derivatives transactions typically can only be closed out with the other party to the transaction. If the counterparty defaults, the fund will have contractual remedies, but there is no assurance that the counterparty will meet its contractual obligations or that, in the event of default, the fund will succeed in enforcing them.
Interest-rate risk
Fixed-income securities are affected by changes in interest rates. When interest rates decline, the market value of the fixed-income securities generally can be expected to rise. Conversely, when interest rates rise, the market value of fixed-income securities generally can be expected to decline. The longer the duration or maturity of a fixed-income security, the more susceptible it is to interest rate risk.
Mortgage security risk
The Fund may invest a portion of its assets in issuers and/or securities of issuers that hold mortgage securities, including subprime mortgage securities. The value of these securities is sensitive to changes in economic conditions, including delinquencies and/or defaults, and may be adversely affected by shifts in the market’s perception of the issuers and changes in interest rates. Decreases in interest rates may cause prepayments on underlying mortgages to an IO security to accelerate resulting in a lower than anticipated yield and increases the risk of loss on the IO investments.
Risks associated with foreign investments
Investing in securities issued by companies whose principal business activities are outside the United States may involve significant risks not present in domestic investments. For example, there is generally less information available about foreign companies, particularly those not subject to the disclosure and reporting requirements of the U.S. securities laws. Foreign issuers are generally not bound by uniform accounting, auditing, and financial reporting requirements and standards of practice comparable to those applicable to domestic issuers. Investments in foreign securities also involve the risk of possible adverse changes in investment or exchange control regulations, expropriation or confiscatory taxation, limitation on the removal of funds or other assets of the Fund, political or financial instability or diplomatic and other developments which could affect such investments. Foreign stock markets, while growing in volume and sophistication, are generally not as de veloped as those in the United States, and securities of some foreign issuers (particularly those located in developing countries) may be less liquid and more volatile than securities of comparable U.S. companies. In general, there is less overall governmental supervision and regulation of foreign securities markets, broker-dealers and issuers than in the United States.
| Semiannual report | Bond Fund | 43 |
Note 4
Guarantees and indemnifications
Under the Fund’s organizational documents, its Officers and Trustees are indemnified against certain liability arising out of the performance of their duties to the Fund. Additionally, in the normal course of business, the Fund enters into contracts with service providers that contain general indemnification clauses. The Fund’s maximum exposure under these arrangements is unknown, as this would involve future claims that may be made against the Fund that have not yet occurred.
Note 5
Management fee and transactions with
affiliates and others
The Fund has an investment management contract with the Adviser. Under the investment management contract, the Fund pays a monthly management fee to the Adviser equivalent, on an annual basis, to the sum of: (a) 0.50% of the first $1,500,000,000 of the Fund’s average daily net asset value, (b) 0.45% of the next $500,000,000, (c) 0.40% of the next $500,000,000 and (d) 0.35% of the Fund’s average daily net asset value in excess of $2,500,000,000. The effective rate for the period ended November 30, 2008 is 0.50% of the Fund’s average daily net asset value. The Fund has a subadvisory agreement with MFC Global Investment Management (U.S.), LLC, a subsidiary of John Hancock Financial Services, Inc. The Fund is not responsible for payment of subadvisory fees.
The Fund has a Distribution Agreement with John Hancock Funds, LLC (JH Funds), a wholly owned subsidiary of the Adviser. The Fund has adopted Distribution Plans with respect to Class A, Class B, Class C and Class R1, pursuant to Rule 12b-1 under the 1940 Act, to pay JH Funds for the services it provides as distributor of shares of the Fund. Accordingly, the Fund makes monthly payments to JH Funds at an annual rate not to exceed 0.30%, 1.00%, 1.00% and 0.50% of average daily net asset value of Class A, Class B, Class C and Class R1, respectively. A maximum of 0.25% of such payments may be service fees, as defined by the Conduct Rules of the Financial Industry Regulatory Authority (formerly the National Association of Securities Dealers). Under the Conduct Rules, curtailment of a portion of the Fund’s 12b-1 payments could occur under certain circumstances. In addition, under a Service Plan for Class R1 shar es, the Fund pays up to 0.25% of Class R1 average daily net asset value for certain other services.
Class A shares are assessed up-front sales charges. During the period ended November 30, 2008, JH Funds received net up-front sales charges of $144,417 with regard to sales of Class A shares. Of this amount, $14,963 was retained and used for printing prospectuses, advertising, sales literature and other purposes, $88,268 was paid as sales commissions to unrelated broker-dealers and $41,186 was paid as sales commissions to sales personnel of Signator Investors, Inc. (Signator Investors), a related broker-dealer. The Adviser’s indirect parent, John Hancock Life Insurance Company (JHLICO), is the indirect sole shareholder of Signator Investors.
Class B shares that are redeemed within six years of purchase are subject to a contingent deferred sales charge (CDSC) at declining rates, beginning at 5.00% of the lesser of the current market value at the time of redemption or the original purchase cost of the shares being redeemed. Class C shares that are redeemed within one year of purchase are subject to a CDSC at a rate of 1.00% of the lesser of the current market value at the time of redemption or the original purchase cost of the shares being redeemed. Proceeds from the CDSCs are paid to JH Funds and are used in whole or in part to defray its expenses for providing distribution-related services to the Fund in connection with the sale of Class B and Class C shares. During the period ended November 30, 2008, CDSCs received by JH Funds amounted to $24,830 for Class B shares and $3,496 for Class C shares.
The Fund has a transfer agent agreement with John Hancock Signature Services, Inc. (Signature Services), an indirect subsidiary of JHLICO. The transfer agent fees are made up of three components:
| 44 | Bond Fund | Semiannual report |
• The Fund pays amonthly transfer agent fee at an annual rate of 0.015% of each class’s average daily net assets.
• All classes pay a monthly fee based on an annual rate of $17.50 per shareholder account.
• In addition, Signature Services is reimbursed for certain out-of-pocket expenses, which are aggregated and allocated to each class based on the relative net assets of the classes.
The Fund receives earnings credits from its transfer agent as a result of uninvested cash balances. These credits are used to reduce a portion of the Fund’s transfer agent fees and out-of-pocket expenses. During the period ended November 30, 2008, the Fund’s transfer agent fees and out-of-pocket expenses were reduced by $493 for transfer agent credits earned.
Class level expenses for the period ended November 30, 2008 were as follows:
| Distribution and | Transfer | ||
| Share class | service fees | agent fees | |
| Class A | $1,148,382 | $689,487 | |
| Class B | 185,465 | 33,410 | |
| Class C | 131,137 | 23,613 | |
| Class I | — | 4,824 | |
| Class R1 | 3,521 | 776 | |
| Total | $1,468,505 | $752,110 | |
The Fund has an agreement with the Adviser and affiliates to perform necessary tax, accounting, compliance, legal and other administrative services for the Fund. The compensation for the period amounted to $62,024 with an effective rate of 0.01% of the Fund’s average daily net asset value.
Mr. James R. Boyle is Chairman of the Adviser, as well as affiliated Trustee of the Fund, and is compensated by the Adviser and/ or its affiliates. The compensation of unaffiliated Trustees is borne by the Fund. The unaffiliated Trustees may elect to defer, for tax purposes, their receipt of this compensation under the John Hancock Group of Funds Deferred Compensation Plan. The Fund makes investments into other John Hancock funds, as applicable, to cover its liability for the deferred compensation. Investments to cover the Fund’s deferred compensation liability are recorded on the Fund’s books as an other asset. The deferred compensation liability and the related other asset are always equal and are marked to market on a periodic basis to reflect any income earned by the investments, as well as any unrealized gains or losses. The Deferred Compensation Plan investments had no impact on the operations of the Fund.
| Semiannual report | Bond Fund | 45 |
Note 6
Fund share transactions
This listing illustrates the number of Fund shares sold, reinvested and repurchased during the year ended May 31, 2008, and the period ended November 30, 2008, along with the corresponding dollar value.
| Year ended 5-31-08 | Period ended 11-30-081 | |||
| Shares | Amount | Shares | Amount | |
| Class A shares | ||||
| Sold | 4,970,203 | $72,866,428 | 1,459,910 | $19,698,835 |
| Distributions reinvested | 2,709,382 | 39,624,359 | 1,519,819 | 20,129,787 |
| Repurchased | (9,096,620) | (133,109,540) | (5,478,394) | (73,140,984) |
| Net decrease | (1,417,035) | ($20,618,753) | (2,498,665) | ($33,312,362) |
| Class B shares | ||||
| Sold | 365,170 | $5,361,215 | 157,080 | $2,101,180 |
| Distributions reinvested | 123,685 | 1,809,288 | 58,501 | 771,924 |
| Repurchased | (1,571,829) | (22,985,817) | (610,688) | (8,165,184) |
| Net increase (decrease) | (1,082,974) | ($15,815,314) | (395,107) | ($5,292,080) |
| Class C shares | ||||
| Sold | 841,590 | $12,345,475 | 167,116 | $2,242,040 |
| Distributions reinvested | 65,616 | 959,429 | 39,744 | 526,008 |
| Repurchased | (451,594) | (6,586,590) | (460,686) | (6,219,081) |
| Net increase (decrease) | 455,612 | $6,718,314 | (253,826) | ($3,451,033) |
| Class I shares | ||||
| Sold | 1,367,835 | $20,037,936 | 167,321 | $2,263,235 |
| Distributions reinvested | 44,387 | 647,866 | 43,772 | 580,264 |
| Repurchased | (239,853) | (3,508,887) | (353,285) | (4,702,942) |
| Net increase (decrease) | 1,172,369 | $17,176,915 | (142,192) | ($1,859,443) |
| Class R1 shares | ||||
| Sold | 64,980 | $951,559 | 21,179 | $292,560 |
| Distributions reinvested | 4,004 | 58,517 | 2,386 | 32,579 |
| Repurchased | (62,400) | (907,140) | (29,180) | (399,551) |
| Net increase (decrease) | 6,584 | $102,936 | (5,615) | ($74,412) |
| Net decrease | (865,444) | ($12,435,902) | (3,295,405) | ($43,989,330) |
1 Semiannual period from 6-1-08 to 11-30-08. Unaudited.
Note 7
Purchase and sale of securities
Purchases and proceeds from sales or maturities of securities, other than short-term securities and obligations of the U.S. government, during the period ended November 30, 2008, aggregated $245,746,774 and $254,187,564, respectively. Purchases and proceeds from sales or maturities of obligations of the U.S. government aggregated $79,832,866 and $81,494,142, respectively, during the period ended November 30, 2008.
| 46 | Bond Fund | Semiannual report |
Board Consideration of and
Continuation of Investment Advisory
Agreement and Subadvisory
Agreement: John Hancock Bond Fund
The Investment Company Act of 1940 (the 1940 Act) requires the Board of Trustees (the Board) of John Hancock Sovereign Bond Fund (the Trust), including a majority of the Trustees who have no direct or indirect interest in the investment advisory agreement and are not “interested persons” of the Trust, as defined in the 1940 Act (the Independent Trustees), annually to meet in person to review and consider the continuation of: (i) the investment advisory agreement (the Advisory Agreement) with John Hancock Advisers, LLC (the Adviser) and (ii) the investment subadvisory agreement (the Subadvisory Agreement) with MFC Global Investment Management (U.S.), LLC (the Subadviser) for the John Hancock Bond Fund (the Fund). The Advisory Agreement and the Subadvisory Agreement are collectively referred to as the Advisory Agreements.
At meetings held on May 5–6 and June 9–10, 2008, the Board considered the factors and reached the conclusions described below relating to the selection of the Adviser and Subadviser and the continuation of the Advisory Agreements. During such meetings, the Board’s Contracts/Operations Committee and the Independent Trustees also met in executive sessions with their independent legal counsel.
In evaluating the Advisory Agreements, the Board, including the Contracts/Operations Committee and its Independent Trustees, reviewed a broad range of information requested for this purpose. This information included:
(i) the investment performance of the Fund relative to a category of relevant funds (the Category) and a peer group of comparable funds (the Peer Group). The funds within each Category and Peer Group were selected by Morningstar Inc. (Morningstar), an independent provider of investment company data.
Data covered a range of periods ended December 31, 2007,
(ii) advisory and other fees incurred by, and the expense ratios of, the Fund relative to a Category and a Peer Group,
(iii) the advisory fees of comparable portfolios of other clients of the Adviser and the Subadviser,
(iv) the Adviser’s financial results and condition, including its and certain of its affiliates’ profitability from services performed for the Fund,
(v) breakpoints in the Fund’s and the Peer Group’s fees, and information about economies of scale,
(vi) the Adviser’s and Subadviser’s record of compliance with applicable laws and regulations, with the Fund’s investment policies and restrictions, and with the applicable Code of Ethics, and the structure and responsibilities of the Adviser’s and Subadviser’s compliance department,
(vii) the background and experience of senior management and investment professionals, and
(viii) the nature, cost and character of advisory and non-investment management services provided by the Adviser and its affiliates and by the Subadviser.
The Independent Trustees considered the legal advice of independent legal counsel and relied on their own business judgment in determining the factors to be considered in evaluating the materials that were presented to them and the weight to be given to each such factor. The Board’s review and conclusions were based on a comprehensive consideration of all information presented to the Board and not the result of any single controlling factor. The Board principally considered data on performance and other information provided by Morningstar as of December 31, 2007. The Board also considered updated performance information provided to it by the Adviser or Subadviser at its May and June 2008 meetings. Performance and other information may be quite different as of the date of this shareholders report. The key factors considered by the Board and the conclusions reached are described below.
| Semiannual report | Bond Fund | 47 |
Nature, extent and quality of services
The Board considered the ability of the Adviser and the Subadviser, based on their resources, reputation and other attributes, to attract and retain qualified investment professionals, including research, advisory, and supervisory personnel. The Board considered the investment philosophy, research and investment decision-making processes of the Adviser and Subadviser. The Board considered the Adviser’s execution of its oversight responsibilities. The Board further considered the culture of compliance, resources dedicated to compliance, compliance programs and compliance records of the Adviser and Subadviser. In addition, the Board took into account the administrative and other non-advisory services provided to the Fund by the Adviser and its affiliates.
Based on the above factors, together with those referenced below, the Board concluded that, within the context of its full deliberations, the nature, extent and quality of the investment advisory services provided to the Fund by the Adviser and Subadviser supported renewal of the Advisory Agreements.
Fund performance
The Board considered the performance results for the Fund over various time periods ended December 31, 2007. The Board also considered these results in comparison to the performance of the Category, as well as the Fund’s Peer Group and benchmark index. The Board reviewed with representatives of Morningstar the methodology used by Morningstar to select the funds in the Category and the Peer Group.
The Board noted that the Fund’s performance for the 1-year period was lower than the performance of the Peer Group and Category medians, and its benchmark index, the Lehman Brothers Government/Credit Bond Index. The Board also noted that the Fund’s performance was lower than the performance of its benchmark index for the 3- and 10-year period, but higher than the benchmark index performance for the 5-year period. The Board favorably viewed that the Fund’s performance for the 3-, 5- and 10-year periods was higher than the performance of the Peer Group and Category medians.
Investment advisory fee and subadvisory fee rates and expenses
The Board reviewed and considered the contractual investment advisory fee rate payable by the Fund to the Adviser for investment advisory services (the Advisory Agreement Rate). The Board received and considered information comparing the Advisory Agreement Rate with the advisory fees for the Peer Group and Category. The Board noted that the Advisory Agreement Rate was equal to the Category and the Peer Group median rates.
The Board received and considered expense information regarding the Fund’s various components, including advisory fees, distribution and fees other than advisory and distribution fees, including transfer agent fees, custodian fees, and other miscellaneous fees (e.g., fees for accounting and legal services). The Board considered comparisons of these expenses to the Peer Group median. The Board also received and considered expense information regarding the Fund’s total operating expense ratio (Expense Ratio). The Board noted that, unlike the Fund, several funds in the Peer Group employed fee waivers or reimbursements. The Board received and considered information comparing the Expense Ratio of the Fund to that of the Peer Group and Category medians before the application of fee waivers and reimbursements (Gross Expense Ratio) and after the application of such waivers and reimbursement (Net Expen se Ratio). The Board noted that the Fund’s Gross and Net Expense Ratios were higher than the median of its Peer Group and Category.
The Adviser also discussed the Morningstar data and rankings, and other relevant information, for the Fund. Based on the above-referenced considerations and other factors, the Board concluded that the Fund’s overall performance and expenses supported the re-approval of the Advisory Agreements.
The Board also received information about the investment subadvisory fee rate (the Subadvisory Agreement Rate) payable by the Adviser to the Subadviser for investment subadvisory services. The Board concluded that the Subadvisory Agreement Rate was fair and equitable, based on its consideration of the factors described here.
| 48 | Bond Fund | Semiannual report |
Profitability
The Board received and considered a detailed profitability analysis of the Adviser based on the Advisory Agreements, as well as on other relationships between the Fund and the Adviser and its affiliates, including the Subadviser. The Board also considered a comparison of the Adviser’s profitability to that of other similar investment advisers whose profitability information is publicly available. The Board concluded that, in light of the costs of providing investment management and other services to the Fund, the profits and other ancillary benefits reported by the Adviser were not unreasonable.
Economies of scale
The Board received and considered general information regarding economies of scale with respect to the management of the Fund, including the Fund’s ability to appropriately benefit from economies of scale under the Fund’s fee structure. The Board recognized the inherent limitations of any analysis of economies of scale, stemming largely from the Board’s understanding that most of the Adviser’s costs are not specific to individual Funds, but rather are incurred across a variety of products and services.
To the extent the Board and the Adviser were able to identify actual or potential economies of scale from Fund-specific or allocated expenses, in order to ensure that any such economies continue to be reasonably shared with the Fund as its assets increase, the Adviser and the Board agreed to continue the existing breakpoints to the Advisory Agreement Rate.
Information about services to other clients
The Board also received information about the nature, extent and quality of services and fee rates offered by the Adviser and Subadviser to their other clients, including other registered investment companies, institutional investors and separate accounts. The Board concluded that the Advisory Agreement Rate and the Subadvisory Agreement Rate were not unreasonable, taking into account fee rates offered to others by the Adviser and Subadviser, respectively, after giving effect to differences in services.
Other benefits to the Adviser
The Board received information regarding potential “fall-out” or ancillary benefits received by the Adviser and its affiliates, including the Subadviser, as a result of their relationship with the Fund. Such benefits could include, among others, benefits directly attributable to the relationship of the Adviser and Subadviser with the Fund and benefits potentially derived from an increase in business as a result of their relationship with the Fund (such as the ability to market to shareholders other financial products offered by the Adviser and its affiliates).
The Board also considered the effectiveness of the Adviser’s, Subadviser’s and Fund’s policies and procedures for complying with the requirements of the federal securities laws, including those relating to best execution of portfolio transactions and brokerage allocation.
Other factors and broader review
As discussed above, the Board reviewed detailed materials received from the Adviser and Subadviser as part of the annual re-approval process. The Board also regularly reviews and assesses the quality of the services that the Fund receives throughout the year. In this regard, the Board reviews reports of the Adviser at least quarterly, which include, among other things, fund performance reports and compliance reports. In addition, the Board meets with portfolio managers and senior investment officers at various times throughout the year.
After considering the above-described factors and based on its deliberations and its evaluation of the information described above, the Board concluded that approval of the continuation of the Advisory Agreements for the Fund was in the best interest of the Fund and its shareholders. Accordingly, the Board unanimously approved the continuation of the Advisory Agreements.
| Semiannual report | Bond Fund | 49 |
More information
| Trustees | Investment adviser |
| Patti McGill Peterson, Chairperson | John Hancock Advisers, LLC |
| James R. Boyle† | |
| James F. Carlin | Subadviser |
| William H. Cunningham* | MFC Global Investment |
| Deborah C. Jackson* | Management (U.S.), LLC |
| Charles L. Ladner | |
| Stanley Martin* | Principal distributor |
| Dr. John A. Moore | John Hancock Funds, LLC |
| Steven R. Pruchansky | |
| Custodian | |
| *Members of the Audit Committee | State Street Bank & Trust Company |
| †Non-Independent Trustee | |
| Transfer agent | |
| Officers | John Hancock Signature Services, Inc. |
| Keith F. Hartstein | |
| President and Chief Executive Officer | Legal counsel |
| K&L Gates LLP | |
| Thomas M. Kinzler | |
| Secretary and Chief Legal Officer | |
| Francis V. Knox, Jr. | |
| Chief Compliance Officer | |
| Charles A. Rizzo | |
| Chief Financial Officer | |
| Gordon M. Shone | |
| Treasurer | |
| John G. Vrysen | |
| Chief Operating Officer |
Additional information about your fund is available without charge in several ways. As required by the SEC, you can access proxy voting information and quarterly portfolio information on your fund. The proxy voting information includes a description of proxy voting policies, procedures and information regarding how the fund voted proxies relating to portfolio securities during the most recent twelve-month period ended June 30. The quarterly portfolio information that includes a complete list of the fund’s holdings for the first and third quarters of the fund’s fiscal period is filed on Form N-Q. You have access to this information:
| By phone | On the fund’s Web site | At the SEC | |
| 1-800-225-5291 | www.jhfunds.com | www.sec.gov | |
| 1-800-SEC-0330 | |||
| SEC Public Reference Room | |||
| You can also contact us: | |||
| Regular mail: | Express mail: | ||
| John Hancock Signature Services, Inc. | John Hancock Signature Services, Inc. | ||
| P.O. Box 9510 | Mutual Fund Image Operations | ||
| Portsmouth, NH 03802-9510 | 164 Corporate Drive | ||
| Portsmouth, NH 03801 | |||
Month-end portfolio holdings are available at www.jhfunds.com.
| 50 | Bond Fund | Semiannual report |

1-800-225-5291
1-800-554-6713 TDD
1-800-338-8080 EASI-Line
www.jhfunds.com
Now available: electronic delivery
www.jhfunds.com/edelivery
| This report is for the information of the shareholders of John Hancock Bond Fund. | 210SA 11/08 |
| It is not authorized for distribution to prospective investors unless preceded or accompanied by a prospectus. | 1/09 |
ITEM 2. CODE OF ETHICS.
Not applicable at this time.
ITEM 3. AUDIT COMMITTEE FINANCIAL EXPERT.
Not applicable at this time.
ITEM 4. PRINCIPAL ACCOUNTANT FEES AND SERVICES.
Not applicable at this time.
ITEM 5. AUDIT COMMITTEE OF LISTED REGISTRANTS.
Not applicable at this time.
ITEM 6. SCHEDULE OF INVESTMENTS.
(a) Not applicable.
(b) Not applicable.
ITEM 7. DISCLOSURE OF PROXY VOTING POLICIES AND PROCEDURES FOR CLOSED-END MANAGEMENT INVESTMENT COMPANIES.
Not applicable.
ITEM 8. PORTFOLIO MANAGERS OF CLOSED-END MANAGEMENT INVESTMENT COMPANIES.
Not applicable.
ITEM 9. PURCHASES OF EQUITY SECURITIES BY CLOSED-END MANAGEMENT INVESTMENT COMPANY AND AFFILIATED PURCHASERS.
Not applicable.
ITEM 10. SUBMISSION OF MATTERS TO A VOTE OF SECURITY HOLDERS.
There were no material changes to previously disclosed John Hancock Funds - Administration Committee Charter and John Hancock Funds – Governance Committee Charter.
ITEM 11. CONTROLS AND PROCEDURES.
(a) Based upon their evaluation of the registrant's disclosure controls and procedures as conducted within 90 days of the filing date of this Form N-CSR, the registrant's principal executive officer and principal financial officer have concluded that those disclosure controls and procedures provide reasonable assurance that the material information required to be disclosed by the registrant on this report is recorded, processed, summarized and reported within the time periods specified in the Securities and Exchange Commission's rules and forms.
(b) There were no changes in the registrant's internal control over financial reporting that occurred during the registrant's most recent fiscal half-year (the registrant's second fiscal half-year in the case of an annual report) that have materially affected, or are reasonably likely to materially affect, the registrant's internal control over financial reporting.
ITEM 12. EXHIBITS.
(a) Separate certifications for the registrant's principal executive officer and principal financial officer, as required by Section 302 of the Sarbanes-Oxley Act of 2002 and Rule 30a-2(a) under the Investment Company Act of 1940, are attached.
(b) Separate certifications for the registrant's principal executive officer and principal financial officer, as required by 18 U.S.C. Section 1350, as adopted pursuant to Section 906 of the Sarbanes-Oxley Act of 2002, and Rule 30a-2(b) under the Investment Company Act of 1940, are attached. The certifications furnished pursuant to this paragraph are not deemed to be "filed" for purposes of Section 18 of the Securities Exchange Act of 1934, or otherwise subject to the liability of that section. Such certifications are not deemed to be incorporated by reference into any filing under the Securities Act of 1933 or the Securities Exchange Act of 1934, except to the extent that the Registrant specifically incorporates them by reference.
(c)(1) Submission of Matters to a Vote of Security Holders is attached. See attached “John Hancock Funds – Governance Committee Charter”.
(c)(2) Contact person at the registrant.
| SIGNATURES |
Pursuant to the requirements of the Securities Exchange Act of 1934 and the Investment Company Act of 1940, the registrant has duly caused this report to be signed on its behalf by the undersigned, thereunto duly authorized.
John Hancock Sovereign Bond Fund
By: /s/ Keith F. Hartstein
-------------------------------------
Keith F. Hartstein
President and Chief Executive Officer
Date: January 23, 2009
Pursuant to the requirements of the Securities Exchange Act of 1934 and the Investment Company Act of 1940, this report has been signed below by the following persons on behalf of the registrant and in the capacities and on the dates indicated.
By: /s/ Keith F. Hartstein
-------------------------------------
Keith F. Hartstein
President and Chief Executive Officer
Date: January 23, 2009
By: /s/ Charles A. Rizzo
-------------------------------------
Charles A. Rizzo
Chief Financial Officer
Date: January 23, 2009