| UNITED STATES | |
| SECURITIES AND EXCHANGE COMMISSION | |
| Washington, D.C. 20549 | |
| FORM N-CSR | |
| CERTIFIED SHAREHOLDER REPORT OF REGISTERED | |
| MANAGEMENT INVESTMENT COMPANIES | |
| Investment Company Act file number 811-2402 | |
| John Hancock Sovereign Bond Fund | |
| (Exact name of registrant as specified in charter) | |
| 601 Congress Street, Boston, Massachusetts 02210 | |
| (Address of principal executive offices) (Zip code) | |
| Salvatore Schiavone | |
| Treasurer | |
| 601 Congress Street | |
| Boston, Massachusetts 02210 | |
| (Name and address of ag ent for service) | |
| Registrant's telephone number, including area code: 617-663-4497 | |
| Date of fiscal year end: | May 31 |
| Date of reporting period: | November 30, 2013 |
ITEM 1. REPORTS TO STOCKHOLDERS.
A look at performance
Total returns for the period ended November 30, 2013
| SEC 30-day | SEC 30-day | ||||||||
| Average annual total returns (%) | Cumulative total returns (%) | yield (%) | yield (%) | ||||||
| with maximum sales charge | with maximum sales charge | subsidized | unsubsidized1 | ||||||
| as of | as of | ||||||||
| 1-year | 5-year | 10-year | 6-months | 1-year | 5-year | 10-year | 11-30-13 | 11-30-13 | |
| Class A | –3.35 | 10.60 | 5.45 | –5.17 | –3.35 | 65.52 | 70.03 | 3.47 | 3.42 |
| Class B | –4.36 | 10.58 | 5.35 | –5.92 | –4.36 | 65.37 | 68.36 | 2.94 | 2.88 |
| Class C | –0.49 | 10.85 | 5.20 | –2.03 | –0.49 | 67.39 | 66.05 | 2.94 | 2.88 |
| Class I2,3 | 1.61 | 12.10 | 6.39 | –0.49 | 1.61 | 77.00 | 85.81 | 3.94 | 3.89 |
| Class R22,3 | 1.31 | 11.68 | 5.94 | –0.69 | 1.31 | 73.72 | 78.13 | 3.31 | 3.25 |
| Class R62,3 | 1.70 | 12.19 | 6.45 | –0.43 | 1.70 | 77.71 | 86.82 | 4.04 | 3.99 |
| Index† | –2.02 | 5.45 | 4.69 | –0.87 | –2.02 | 30.41 | 58.07 | — | — |
Performance figures assume all distributions have been reinvested. Figures reflect maximum sales charges on Class A shares of 4.5% and the applicable contingent deferred sales charge (CDSC) on Class B and Class C shares. The returns for Class C shares have been adjusted to reflect the elimination of the front-end sales charge effective 7-15-04. The Class B shares’ CDSC declines annually between years 1 to 6 according to the following schedule: 5%, 4%, 3%, 3%, 2%, 1%. No sales charge will be assessed after the sixth year. Class C shares held for less than one year are subject to a 1% CDSC. Sales charges are not applicable to Class I, Class R2, and Class R6 shares. Effective 2-3-14, Class A sales charges of the fund are being reduced to 4.0%.
The expense ratios of the fund, both net (including any fee waivers or expense limitations) and gross (excluding any fee waivers or expense limitations), are set forth according to the most recent publicly available prospectuses for the fund and may differ from those disclosed in the Financial highlights tables in this report. The fee waivers and expense limitations are contractual at least until 9-30-14 for Class A, Class B, Class C, Class I, Class R2, and Class R6 shares. Had the fee waivers and expense limitations not been in place, gross expenses would apply. The expense ratios are as follows:
| Class A | Class B | Class C | Class I | Class R2 | Class R6 | ||
| Net (%) | 0.98 | 1.68 | 1.68 | 0.60 | 1.03 | 0.52 | |
| Gross (%) | 1.03 | 1.73 | 1.73 | 0.65 | 1.08 | 0.57 |
The returns reflect past results and should not be considered indicative of future performance. The return and principal value of an investment will fluctuate so that shares, when redeemed, may be worth more or less than their original cost. Due to market volatility, the fund’s current performance may be higher or lower than the performance shown. For current to the most recent month-end performance data, please call 800-225-5291 or visit the fund’s website at jhinvestments.com.
The performance table above and the chart on the next page do not reflect the deduction of taxes that a shareholder may pay on fund distributions or on the redemption of fund shares. The fund’s performance results reflect any applicable fee waivers or expense reductions, without which the expenses would increase and results would have been less favorable.
† Index is the Barclays Government/Credit Bond Index.
See the following page for footnotes.
| 6 | Bond Fund | Semiannual report |

| With maximum | Without | |||
| Start date | sales charge | sales charge | Index | |
| Class B4 | 11-30-03 | $16,836 | $16,836 | $15,807 |
| Class C4 | 11-30-03 | 16,605 | 16,605 | 15,807 |
| Class I2 | 11-30-03 | 18,581 | 18,581 | 15,807 |
| Class R22 | 11-30-03 | 17,813 | 17,813 | 15,807 |
| Class R62 | 11-30-03 | 18,682 | 18,682 | 15,807 |
Performance of the classes will vary based on the difference in sales charges paid by shareholders investing in the different classes and the fee structure of those classes.
The Class C shares investment with maximum sales charge has been adjusted to reflect the elimination of the front-end sales charge, effective 7-15-04.
Barclays Government/Credit Bond Index is an unmanaged index of U.S. government bonds, U.S. corporate bonds, and Yankee bonds.
It is not possible to invest directly in an index. Index figures do not reflect expenses or sales charges, which would have resulted in lower values.
Footnotes related to performance pages
1 Unsubsidized yield reflects what the yield would have been without the effect of reimbursements and waivers.
2 For certain types of investors, as described in the fund’s prospectuses.
3 Class R6 and Class R2 shares were first offered 9-1-11 and 3-1-12, respectively. Returns prior to these dates are those of Class A shares that have been recalculated to apply the gross fees and expenses of Class R2 and Class R6 shares, as applicable.
4 The contingent deferred sales charge is not applicable.
| Semiannual report | Bond Fund | 7 |
Your expenses
These examples are intended to help you understand your ongoing operating expenses of investing in the fund so you can compare these costs with the ongoing costs of investing in other mutual funds.
Understanding fund expenses
As a shareholder of the fund, you incur two types of costs:
■ Transaction costs, which include sales charges (loads) on purchases or redemptions (varies by share class), minimum account fee charge, etc.
■ Ongoing operating expenses, including management fees, distribution and service fees (if applicable), and other fund expenses.
We are going to present only your ongoing operating expenses here.
Actual expenses/actual returns
This example is intended to provide information about the fund’s actual ongoing operating expenses and is based on the fund’s actual return. It assumes an account value of $1,000.00 on June 1, 2013, with the same investment held until November 30, 2013.
| Account value | Ending value | Expenses paid during | |
| on 6-1-13 | on 11-30-13 | period on 11-30-131 | |
| Class A | $1,000.00 | $992.90 | $4.65 |
| Class B | 1,000.00 | 989.40 | 8.13 |
| Class C | 1,000.00 | 989.40 | 8.13 |
| Class I | 1,000.00 | 995.10 | 3.00 |
| Class R2 | 1,000.00 | 993.10 | 4.90 |
| Class R6 | 1,000.00 | 995.70 | 2.55 |
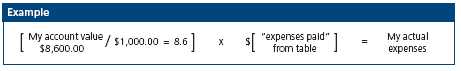
Together with the value of your account, you may use this information to estimate the operating expenses that you paid over the period. Simply divide your account value at November 30, 2013, by $1,000.00, then multiply it by the “expenses paid” for your share class from the table above. For example, for an account value of $8,600.00, the operating expenses should be calculated as follows:
| 8 | Bond Fund | Semiannual report |
Hypothetical example for comparison purposes
This table allows you to compare the fund’s ongoing operating expenses with those of any other fund. It provides an example of the fund’s hypothetical account values and hypothetical expenses based on each class’s actual expense ratio and an assumed 5% annualized return before expenses (which is not the fund’s actual return). It assumes an account value of $1,000.00 on June 1, 2013, with the same investment held until November 30, 2013. Look in any other fund shareholder report to find its hypothetical example and you will be able to compare these expenses. Please remember that these hypothetical account values and expenses may not be used to estimate the actual ending account balance or expenses you paid for the period.
| Account value | Ending value | Expenses paid during | |
| on 6-1-13 | on 11-30-13 | period on 11-30-131 | |
| Class A | $1,000.00 | $1,020.40 | $4.71 |
| Class B | 1,000.00 | 1,016.90 | 8.24 |
| Class C | 1,000.00 | 1,016.90 | 8.24 |
| Class I | 1,000.00 | 1,022.10 | 3.04 |
| Class R2 | 1,000.00 | 1,020.20 | 4.96 |
| Class R6 | 1,000.00 | 1,022.50 | 2.59 |
Remember, these examples do not include any transaction costs; therefore, these examples will not help you to determine the relative total costs of owning different funds. If transaction costs were included, your expenses would have been higher. See the prospectuses for details regarding transaction costs.
1 Expenses are equal to the fund’s annualized expense ratio of 0.93%, 1.63%, 1.63%, 0.60%, 0.98%, and 0.51% for Class A, Class B, Class C, Class I, Class R2, and Class R6 shares, respectively, multiplied by the average account value over the period, multiplied by 183/365 (to reflect the one-half year period).
| Semiannual report | Bond Fund | 9 |
Portfolio summary
| Portfolio Composition1 | ||||
| Corporate Bonds | 49.0% | Capital Preferred Securities | 1.4% | |
| U.S. Government Agency | 14.4% | Preferred Securities | 1.2% | |
| Collateralized Mortgage Obligations | 13.1% | Term Loans | 1.0% | |
| U.S. Government | 7.3% | Foreign Government Obligations | 0.2% | |
| Asset Backed Securities | 5.9% | Convertible Bonds | 0.1% | |
| U.S. Government Agency Collateralized | Short-Term Investments & Other | 2.5% | ||
| Mortgage Obligations | 3.9% | |||
| Quality Composition1,2 | ||||
| U.S. Government Agency | 14.4% | BBB | 30.9% | |
| U.S. Government | 7.3% | BB | 12.2% | |
| U.S. Government Agency Collateralized | B | 10.8% | ||
| Mortgage Obligations | 3.9% | CCC & Below | 5.9% | |
| AAA | 1.2% | Not Rated | 0.5% | |
| AA | 3.5% | Equity | 1.2% | |
| A | 5.7% | Short-Term Investments & Other | 2.5% | |
1 As a percentage of net assets on 11-30-13.
2 Ratings are from Moody’s Investors Service, Inc. If not available, we have used ratings from Standard & Poor’s Ratings Services. In the absence of ratings from these agencies, we have used Fitch Ratings, Inc. ratings. “Not Rated” securities are those with no ratings available from these agencies. All ratings are as of 11-30-13 and do not reflect subsequent downgrades or upgrades, if any.
Fixed-income investments are subject to interest-rate and credit risk; their value will normally decline as interest rates rise or if a creditor is unable or unwilling to make principal or interest payments. Illiquid securities may be difficult to sell at a price approximating their value. Investments in higher-yielding, lower-rated securities include a higher risk of default. Foreign investing, has additional risks, such as currency and market volatility and political and social instability. Mortgage and asset-backed securities may be sensitive to changes in interest rates, and may be subject to early repayment and the market’s perception of issuer creditworthiness. The use of hedging and derivatives could produce disproportionate gains or losses and may increase costs. Sector investing is subject to greater risks than the market as a whole. Because the fund may focus on particular sectors of the economy, its performance may depend on the performance of those sectors and investments focused in one sector may fluctuate more widely than investments diversified across sectors. Please see the fund’s prospectuses for additional risks.
| 10 | Bond Fund | Semiannual report |
Fund’s investments
As of 11-30-13 (unaudited)
| Maturity | |||||
| Rate (%) | date | Par value^ | Value | ||
| Corporate Bonds 49.0% | $881,593,307 | ||||
| (Cost $859,752,755) | |||||
| Consumer Discretionary 5.0% | 89,424,691 | ||||
| Auto Components 0.4% | |||||
| Allison Transmission, Inc. (S) | 7.125 | 05-15-19 | 2,050,000 | 2,208,854 | |
| Dana Holding Corp. | 6.000 | 09-15-23 | 2,955,000 | 2,991,938 | |
| Stackpole International Intermediate | |||||
| Company SA (S) | 7.750 | 10-15-21 | 1,695,000 | 1,767,038 | |
| Automobiles 1.3% | |||||
| Ford Motor Credit Company LLC | 5.000 | 05-15-18 | 2,890,000 | 3,219,032 | |
| Ford Motor Credit Company LLC | 5.875 | 08-02-21 | 12,220,000 | 13,868,197 | |
| Ford Motor Credit Company LLC | 8.000 | 12-15-16 | 2,885,000 | 3,429,296 | |
| General Motors Company (S) | 4.875 | 10-02-23 | 3,025,000 | 3,043,906 | |
| General Motors Financial Company, Inc. (S) | 3.250 | 05-15-18 | 630,000 | 631,575 | |
| Hotels, Restaurants & Leisure 0.9% | |||||
| Arcos Dorados Holdings, Inc. (S) | 10.250 | 07-13-16 | BRL 3,275,000 | 1,339,884 | |
| CCM Merger, Inc. (S) | 9.125 | 05-01-19 | 2,495,000 | 2,619,750 | |
| GLP Capital LP (S) | 4.375 | 11-01-18 | 600,000 | 612,000 | |
| Greektown Superholdings, Inc. | 13.000 | 07-01-15 | 2,440,000 | 2,507,100 | |
| Landry’s, Inc. (S) | 9.375 | 05-01-20 | 2,610,000 | 2,844,900 | |
| Little Traverse Bay Bands of Odawa Indians (S) | 9.000 | 08-31-20 | 1,195,000 | 1,171,100 | |
| Seminole Indian Tribe of Florida (S) | 6.535 | 10-01-20 | 2,594,000 | 2,827,460 | |
| Waterford Gaming LLC (S) | 8.625 | 09-15-14 | 556,852 | 158,212 | |
| Wok Acquisition Corp. (S) | 10.250 | 06-30-20 | 1,590,000 | 1,717,200 | |
| Household Durables 0.1% | |||||
| Arcelik AS (S) | 5.000 | 04-03-23 | 1,650,000 | 1,460,250 | |
| Internet & Catalog Retail 0.2% | |||||
| QVC, Inc. | 4.375 | 03-15-23 | 2,170,000 | 2,062,958 | |
| QVC, Inc. | 5.125 | 07-02-22 | 1,420,000 | 1,413,002 | |
| Media 0.8% | |||||
| CBS Corp. | 7.875 | 07-30-30 | 3,230,000 | 3,972,561 | |
| Cinemark USA, Inc. | 4.875 | 06-01-23 | 1,780,000 | 1,668,750 | |
| Cinemark USA, Inc. | 7.375 | 06-15-21 | 925,000 | 1,010,563 | |
| Gibson Brands, Inc. (S) | 8.875 | 08-01-18 | 800,000 | 818,000 | |
| Myriad International Holdings BV (S) | 6.000 | 07-18-20 | 1,770,000 | 1,867,350 | |
| News America, Inc. | 6.150 | 03-01-37 | 975,000 | 1,067,556 | |
| News America, Inc. | 6.400 | 12-15-35 | 705,000 | 790,707 | |
| Time Warner Cable, Inc. | 8.250 | 04-01-19 | 2,360,000 | 2,769,533 | |
| See notes to financial statements | Semiannual report | Bond Fund | 11 |
| Maturity | |||||
| Rate (%) | date | Par value^ | Value | ||
| Multiline Retail 0.2% | |||||
| Macy’s Retail Holdings, Inc. | 7.875 | 08-15-36 | 2,885,000 | $3,261,455 | |
| Specialty Retail 0.8% | |||||
| AutoNation, Inc. | 5.500 | 02-01-20 | 2,185,000 | 2,359,800 | |
| Hillman Group, Inc. | 10.875 | 06-01-18 | 2,205,000 | 2,386,913 | |
| Jo-Ann Stores Holdings, Inc., PIK (S) | 9.750 | 10-15-19 | 2,915,000 | 3,046,175 | |
| L Brands, Inc. | 6.625 | 04-01-21 | 3,585,000 | 3,947,981 | |
| New Look Bondco I PLC (S) | 8.375 | 05-14-18 | 855,000 | 882,788 | |
| Toys R Us Property Company II LLC | 8.500 | 12-01-17 | 655,000 | 678,744 | |
| Toys R Us, Inc. | 10.375 | 08-15-17 | 1,235,000 | 1,167,075 | |
| Textiles, Apparel & Luxury Goods 0.3% | |||||
| Burlington Coat Factory Warehouse Corp. | 10.000 | 02-15-19 | 3,410,000 | 3,823,463 | |
| Hot Topic, Inc. (S) | 9.250 | 06-15-21 | 1,925,000 | 2,011,625 | |
| Consumer Staples 2.3% | 40,892,607 | ||||
| Beverages 0.2% | |||||
| Ajecorp BV (S) | 6.500 | 05-14-22 | 2,145,000 | 2,134,275 | |
| Crestview DS Merger Sub II, Inc. (S) | 10.000 | 09-01-21 | 2,175,000 | 2,305,500 | |
| Food & Staples Retailing 0.7% | |||||
| Safeway, Inc. | 4.750 | 12-01-21 | 925,000 | 939,984 | |
| Safeway, Inc. | 5.000 | 08-15-19 | 5,820,000 | 6,232,219 | |
| Safeway, Inc. | 7.250 | 02-01-31 | 1,315,000 | 1,359,940 | |
| Sun Merger Sub, Inc. (S) | 5.875 | 08-01-21 | 600,000 | 621,000 | |
| Tops Holding Corp. (S) | 8.875 | 12-15-17 | 960,000 | 1,053,600 | |
| Tops Holding II Corp., PIK (S) | 8.750 | 06-15-18 | 1,580,000 | 1,639,250 | |
| Food Products 0.6% | |||||
| B&G Foods, Inc. | 4.625 | 06-01-21 | 1,390,000 | 1,327,450 | |
| Bunge, Ltd. Finance Corp. | 8.500 | 06-15-19 | 2,236,000 | 2,785,763 | |
| Corporacion Pesquera Inca SAC (S) | 9.000 | 02-10-17 | 2,205,000 | 2,177,438 | |
| KazAgro National Management Holding JSC (S) | 4.625 | 05-24-23 | 1,385,000 | 1,255,087 | |
| Simmons Foods, Inc. (S) | 10.500 | 11-01-17 | 3,495,000 | 3,669,750 | |
| Household Products 0.3% | |||||
| Harbinger Group, Inc. (S) | 7.875 | 07-15-19 | 2,555,000 | 2,740,238 | |
| The Sun Products Corp. (S) | 7.750 | 03-15-21 | 2,550,000 | 2,193,000 | |
| Personal Products 0.1% | |||||
| Revlon Consumer Products Corp. (S) | 5.750 | 02-15-21 | 2,000,000 | 1,982,500 | |
| Tobacco 0.4% | |||||
| Alliance One International, Inc. (S) | 9.875 | 07-15-21 | 5,500,000 | 5,060,000 | |
| Vector Group, Ltd. | 7.750 | 02-15-21 | 1,345,000 | 1,415,613 | |
| Energy 5.9% | 106,419,920 | ||||
| Energy Equipment & Services 0.8% | |||||
| Astoria Depositor Corp., Series B (S) | 8.144 | 05-01-21 | 3,790,000 | 3,676,300 | |
| Exterran Partners LP (S) | 6.000 | 04-01-21 | 670,000 | 666,650 | |
| Key Energy Services, Inc. | 6.750 | 03-01-21 | 1,890,000 | 1,932,525 | |
| Offshore Group Investment, Ltd. | 7.125 | 04-01-23 | 1,530,000 | 1,575,900 | |
| Precision Drilling Corp. | 6.625 | 11-15-20 | 1,405,000 | 1,499,838 | |
| RKI Exploration & Production LLC (S) | 8.500 | 08-01-21 | 1,775,000 | 1,854,875 | |
| Rowan Companies, Inc. | 4.875 | 06-01-22 | 1,990,000 | 2,037,380 | |
| Trinidad Drilling, Ltd. (S) | 7.875 | 01-15-19 | 1,180,000 | 1,253,750 | |
| 12 | Bond Fund | Semiannual report | See notes to financial statements |
| Maturity | |||||
| Rate (%) | date | Par value^ | Value | ||
| Gas Utilities 0.1% | |||||
| DCP Midstream LLC (5.850% to 5-21-23, then | |||||
| 3 month LIBOR + 3.850%) (S) | 5.850 | 05-21-43 | 2,710,000 | $2,516,913 | |
| Oil, Gas & Consumable Fuels 5.0% | |||||
| Afren PLC (S) | 6.625 | 12-09-20 | 2,600,000 | 2,592,233 | |
| Afren PLC (S) | 10.250 | 04-08-19 | 1,260,000 | 1,464,750 | |
| Afren PLC (S) | 11.500 | 02-01-16 | 1,200,000 | 1,392,000 | |
| BreitBurn Energy Partners LP | 7.875 | 04-15-22 | 2,180,000 | 2,229,050 | |
| CNOOC Finance 2013, Ltd. | 3.000 | 05-09-23 | 1,625,000 | 1,480,794 | |
| Continental Resources, Inc. | 5.000 | 09-15-22 | 2,130,000 | 2,193,900 | |
| DCP Midstream LLC (S) | 9.750 | 03-15-19 | 2,675,000 | 3,394,182 | |
| DCP Midstream Operating LP | 3.875 | 03-15-23 | 1,500,000 | 1,397,376 | |
| Ecopetrol SA | 5.875 | 09-18-23 | 1,300,000 | 1,374,750 | |
| Energy Transfer Partners LP | 5.200 | 02-01-22 | 915,000 | 973,092 | |
| Energy Transfer Partners LP | 9.700 | 03-15-19 | 2,140,000 | 2,781,362 | |
| Enterprise Products Operating LLC (7.000% to | |||||
| 6-1-17, then 3 month LIBOR + 2.778%) | 7.000 | 06-01-67 | 4,085,000 | 4,187,125 | |
| Enterprise Products Operating LLC (8.375% to | |||||
| 8-1-16, then 3 month LIBOR + 3.708%) | 8.375 | 08-01-66 | 1,570,000 | 1,730,925 | |
| EP Energy LLC | 7.750 | 09-01-22 | 1,145,000 | 1,288,125 | |
| EV Energy Partners LP | 8.000 | 04-15-19 | 2,370,000 | 2,399,625 | |
| Halcon Resources Corp. | 8.875 | 05-15-21 | 1,385,000 | 1,405,775 | |
| Hess Corp. | 8.125 | 02-15-19 | 3,911,000 | 4,913,213 | |
| Kerr-McGee Corp. | 6.950 | 07-01-24 | 3,665,000 | 4,377,527 | |
| Kinder Morgan Energy Partners LP | 7.750 | 03-15-32 | 1,090,000 | 1,335,094 | |
| Lukoil International Finance BV (S) | 3.416 | 04-24-18 | 4,655,000 | 4,690,844 | |
| MarkWest Energy Partners LP | 6.500 | 08-15-21 | 1,414,000 | 1,527,120 | |
| Midstates Petroleum Company, Inc. | 9.250 | 06-01-21 | 3,010,000 | 3,141,688 | |
| Newfield Exploration Company | 5.750 | 01-30-22 | 1,890,000 | 1,970,325 | |
| NuStar Logistics LP | 8.150 | 04-15-18 | 1,446,000 | 1,639,403 | |
| Pacific Rubiales Energy Corp. (S) | 5.125 | 03-28-23 | 1,920,000 | 1,742,400 | |
| Pacific Rubiales Energy Corp. (S) | 5.375 | 01-26-19 | 2,275,000 | 2,275,000 | |
| Petrobras Global Finance BV | 4.375 | 05-20-23 | 2,590,000 | 2,352,909 | |
| Petroleos de Venezuela SA | 5.375 | 04-12-27 | 3,755,000 | 2,027,700 | |
| Petroleos Mexicanos | 4.875 | 01-24-22 | 1,475,000 | 1,511,875 | |
| Plains Exploration & Production Company | 6.750 | 02-01-22 | 4,780,000 | 5,221,792 | |
| Plains Exploration & Production Company | 6.875 | 02-15-23 | 745,000 | 825,088 | |
| Regency Energy Partners LP | 5.500 | 04-15-23 | 3,300,000 | 3,242,250 | |
| Rex Energy Corp. | 8.875 | 12-01-20 | 1,190,000 | 1,300,075 | |
| Summit Midstream Holdings LLC (S) | 7.500 | 07-01-21 | 1,115,000 | 1,165,175 | |
| TransCanada Pipelines, Ltd. (6.350% to | |||||
| 5-15-17, then 3 month LIBOR + 2.210%) | 6.350 | 05-15-67 | 3,910,000 | 4,060,461 | |
| Tullow Oil PLC (S) | 6.000 | 11-01-20 | 1,550,000 | 1,559,688 | |
| Williams Partners LP | 5.250 | 03-15-20 | 4,060,000 | 4,427,073 | |
| WPX Energy, Inc. | 6.000 | 01-15-22 | 1,805,000 | 1,814,025 | |
| Financials 17.1% | 307,426,290 | ||||
| Capital Markets 2.2% | |||||
| Jefferies Group, Inc. | 6.875 | 04-15-21 | 3,720,000 | 4,203,600 | |
| Jefferies Group, Inc. | 8.500 | 07-15-19 | 1,965,000 | 2,397,300 | |
| Macquarie Bank, Ltd. (S) | 6.625 | 04-07-21 | 1,255,000 | 1,389,722 | |
| See notes to financial statements | Semiannual report | Bond Fund | 13 |
| Maturity | |||||
| Rate (%) | date | Par value^ | Value | ||
| Capital Markets (continued) | |||||
| Macquarie Group, Ltd. (S) | 6.000 | 01-14-20 | 1,495,000 | $1,655,893 | |
| Morgan Stanley | 4.100 | 05-22-23 | 4,060,000 | 3,912,715 | |
| Morgan Stanley | 5.500 | 01-26-20 | 3,210,000 | 3,627,085 | |
| Morgan Stanley | 5.550 | 04-27-17 | 1,620,000 | 1,821,447 | |
| Morgan Stanley | 5.750 | 01-25-21 | 3,130,000 | 3,565,890 | |
| Morgan Stanley | 7.300 | 05-13-19 | 6,640,000 | 8,141,198 | |
| The Goldman Sachs Group, Inc. | 5.250 | 07-27-21 | 7,400,000 | 8,138,764 | |
| The Goldman Sachs Group, Inc. | 5.750 | 01-24-22 | 680,000 | 767,159 | |
| Commercial Banks 2.7% | |||||
| Banco do Brasil SA/Cayman Island (6.250% | |||||
| to 4-15-24, then 10 Year U.S. Treasury + | |||||
| 4.398%) (Q)(S) | 6.250 | 04-15-24 | 3,300,000 | 2,595,450 | |
| Barclays Bank PLC (Q)(S) | 5.926 | 12-15-16 | 2,065,000 | 2,183,738 | |
| Barclays Bank PLC (S) | 10.179 | 06-12-21 | 3,950,000 | 5,231,933 | |
| BPCE SA (S) | 5.700 | 10-22-23 | 4,240,000 | 4,373,475 | |
| Commerzbank AG (S) | 8.125 | 09-19-23 | 2,350,000 | 2,579,125 | |
| Fifth Third Bancorp (5.100% to 6-30-23, then | |||||
| 3 month LIBOR + 3.033%) (Q) | 5.100 | 06-30-23 | 2,940,000 | 2,601,900 | |
| HBOS PLC (S) | 6.000 | 11-01-33 | 3,110,000 | 3,038,999 | |
| ICICI Bank, Ltd. (S) | 4.700 | 02-21-18 | 2,325,000 | 2,370,026 | |
| ICICI Bank, Ltd. (S) | 5.750 | 11-16-20 | 2,410,000 | 2,454,587 | |
| Nordea Bank AB (S) | 3.125 | 03-20-17 | 2,945,000 | 3,099,683 | |
| PNC Financial Services Group, Inc. (Q) | 4.459 | 01-09-14 | 1,695,000 | 1,695,000 | |
| PNC Financial Services Group, Inc. (4.850% to | |||||
| 6-1-23, then 3 month LIBOR + 3.040%) (Q) | 4.850 | 06-01-23 | 2,150,000 | 1,924,250 | |
| Royal Bank of Scotland Group PLC | 6.125 | 12-15-22 | 2,420,000 | 2,465,043 | |
| Sberbank of Russia (S) | 6.125 | 02-07-22 | 1,700,000 | 1,797,750 | |
| Synovus Financial Corp. | 7.875 | 02-15-19 | 1,075,000 | 1,222,813 | |
| VTB Bank OJSC (9.500% to 12-6-22, then 10 | |||||
| Year U.S. Treasury + 8.067%) (Q)(S) | 9.500 | 12-06-22 | 2,065,000 | 2,258,594 | |
| Wachovia Bank NA | 5.850 | 02-01-37 | 1,915,000 | 2,175,013 | |
| Wells Fargo & Company, Series K (7.980% to | |||||
| 3-15-18, then 3 month LIBOR + 3.770%) (Q) | 7.980 | 03-15-18 | 4,382,000 | 4,918,795 | |
| Consumer Finance 0.8% | |||||
| Capital One Financial Corp. | 4.750 | 07-15-21 | 3,995,000 | 4,271,993 | |
| Discover Bank | 7.000 | 04-15-20 | 1,340,000 | 1,578,115 | |
| Discover Financial Services | 5.200 | 04-27-22 | 2,795,000 | 2,941,159 | |
| DTEK Finance PLC (S) | 7.875 | 04-04-18 | 2,860,000 | 2,491,632 | |
| Springleaf Finance Corp. (S) | 6.000 | 06-01-20 | 2,285,000 | 2,250,725 | |
| Diversified Financial Services 5.1% | |||||
| Alfa Bank OJSC (S) | 7.750 | 04-28-21 | 695,000 | 742,781 | |
| Banco Santander Brasil SA (S) | 8.000 | 03-18-16 | BRL 6,000,000 | 2,396,916 | |
| Bank of America Corp. | 3.300 | 01-11-23 | 1,645,000 | 1,555,856 | |
| Bank of America Corp. | 5.000 | 05-13-21 | 4,705,000 | 5,148,827 | |
| Bank of America Corp. | 5.700 | 01-24-22 | 2,765,000 | 3,142,884 | |
| Bank of America NA | 5.300 | 03-15-17 | 895,000 | 997,593 | |
| Bank of Ceylon (S) | 6.875 | 05-03-17 | 1,425,000 | 1,428,563 | |
| Citigroup, Inc. | 3.875 | 10-25-23 | 1,235,000 | 1,212,913 | |
| Citigroup, Inc. | 5.500 | 09-13-25 | 2,760,000 | 2,920,226 | |
| 14 | Bond Fund | Semiannual report | See notes to financial statements |
| Maturity | |||||
| Rate (%) | date | Par value^ | Value | ||
| Diversified Financial Services (continued) | |||||
| Citigroup, Inc. | 6.125 | 08-25-36 | 2,120,000 | $2,232,197 | |
| Doric Nimrod Air Alpha 2013-1 Pass Through | |||||
| Trust (S) | 5.250 | 05-30-23 | 1,700,000 | 1,717,000 | |
| Doric Nimrod Air Alpha 2013-1 Pass Through | |||||
| Trust (S) | 6.125 | 11-30-19 | 1,400,000 | 1,449,000 | |
| Doric Nimrod Air Finance Alpha, Ltd. 2012-1 | |||||
| Class A Pass Through (S) | 5.125 | 11-30-22 | 1,599,968 | 1,623,967 | |
| General Electric Capital Corp. (P) | 0.721 | 08-15-36 | 2,745,000 | 2,309,893 | |
| General Electric Capital Corp. | 4.375 | 09-16-20 | 1,610,000 | 1,756,639 | |
| General Electric Capital Corp. | 5.300 | 02-11-21 | 880,000 | 978,864 | |
| General Electric Capital Corp. | 5.550 | 05-04-20 | 4,270,000 | 4,948,038 | |
| General Electric Capital Corp. | 5.875 | 01-14-38 | 665,000 | 752,458 | |
| General Electric Capital Corp. (6.375% to | |||||
| 11-15-17, then 3 month LIBOR + 2.289%) | 6.375 | 11-15-67 | 1,170,000 | 1,269,450 | |
| General Electric Capital Corp. (7.125% until | |||||
| 6-15-22, then 3 month LIBOR + 5.296%) (Q) | 7.125 | 06-15-22 | 3,750,000 | 4,171,875 | |
| ING Bank NV (S) | 5.800 | 09-25-23 | 1,560,000 | 1,625,434 | |
| ING US, Inc. | 5.500 | 07-15-22 | 1,475,000 | 1,612,737 | |
| ING US, Inc. (5.650% to 5-15-23, then | |||||
| 3 month LIBOR + 3.580%) | 5.650 | 05-15-53 | 1,760,000 | 1,715,472 | |
| Intercorp Retail Trust (S) | 8.875 | 11-14-18 | 750,000 | 787,500 | |
| iPayment, Inc. | 10.250 | 05-15-18 | 1,350,000 | 1,066,500 | |
| JPMorgan Chase & Company | 4.625 | 05-10-21 | 5,965,000 | 6,422,474 | |
| JPMorgan Chase & Company (5.150% to | |||||
| 5-1-23, then 3 month LIBOR + 3.250%) (Q) | 5.150 | 05-01-23 | 2,615,000 | 2,353,500 | |
| JPMorgan Chase & Company (7.900% to | |||||
| 4-30-18, then 3 month LIBOR + 3.470%) (Q) | 7.900 | 04-30-18 | 2,840,000 | 3,138,200 | |
| Leucadia National Corp. | 5.500 | 10-18-23 | 4,420,000 | 4,454,419 | |
| Merrill Lynch & Company, Inc. | 6.875 | 04-25-18 | 4,365,000 | 5,210,164 | |
| Rabobank Nederland NV | 3.875 | 02-08-22 | 6,085,000 | 6,139,473 | |
| Rabobank Nederland NV (11.000% to 6-30-19, | |||||
| then 3 month LIBOR + 10.868%) (Q)(S) | 11.000 | 06-30-19 | 3,579,000 | 4,733,228 | |
| SPL Logistics Escrow LLC (S) | 8.875 | 08-01-20 | 1,216,000 | 1,292,000 | |
| The Bear Stearns Companies LLC | 7.250 | 02-01-18 | 2,100,000 | 2,536,586 | |
| UBS AG | 7.625 | 08-17-22 | 2,555,000 | 2,921,213 | |
| USB Realty Corp. (P)(Q)(S) | 1.391 | 01-15-17 | 2,900,000 | 2,541,125 | |
| Insurance 3.0% | |||||
| Aflac, Inc. | 8.500 | 05-15-19 | 2,105,000 | 2,731,671 | |
| American International Group, Inc. | 4.125 | 02-15-24 | 1,985,000 | 2,004,552 | |
| American International Group, Inc. | 8.250 | 08-15-18 | 1,365,000 | 1,727,904 | |
| American International Group, Inc. (8.175% to | |||||
| 5-15-38, then 3 month LIBOR + 4.195%) | 8.175 | 05-15-58 | 1,720,000 | 2,064,860 | |
| AXA SA | 8.600 | 12-15-30 | 1,695,000 | 2,080,840 | |
| CNA Financial Corp. | 7.250 | 11-15-23 | 3,415,000 | 4,147,142 | |
| Glen Meadow Pass-Through Trust (6.505% to | |||||
| 2-15-17, then 3 month LIBOR + 2.125%) (S) | 6.505 | 02-12-67 | 4,320,000 | 4,190,400 | |
| Liberty Mutual Group, Inc. (S) | 5.000 | 06-01-21 | 4,540,000 | 4,832,499 | |
| Liberty Mutual Group, Inc. (S) | 7.800 | 03-15-37 | 3,235,000 | 3,461,450 | |
| Lincoln National Corp. (6.050% to 4-20-17, | |||||
| then 3 month LIBOR + 2.040%) | 6.050 | 04-20-67 | 2,275,000 | 2,263,625 | |
| See notes to financial statements | Semiannual report | Bond Fund | 15 |
| Maturity | |||||
| Rate (%) | date | Par value^ | Value | ||
| Insurance (continued) | |||||
| Lincoln National Corp. (7.000% to 5-17-16, | |||||
| then 3 month LIBOR + 2.358%) | 7.000 | 05-17-66 | 915,000 | $937,875 | |
| MetLife, Inc. | 6.400 | 12-15-36 | 1,940,000 | 1,988,500 | |
| Nippon Life Insurance Company (P)(S) | 5.000 | 10-18-42 | 1,795,000 | 1,830,900 | |
| Onex USI Acquisition Corp. (S) | 7.750 | 01-15-21 | 2,265,000 | 2,315,963 | |
| Pacific LifeCorp. (S) | 6.000 | 02-10-20 | 1,190,000 | 1,336,729 | |
| Prudential Financial, Inc. (P) | 5.200 | 03-15-44 | 760,000 | 727,700 | |
| Prudential Financial, Inc. (5.875% to 9-1-22, | |||||
| then 3 month LIBOR + 4.175%) | 5.875 | 09-15-42 | 2,555,000 | 2,580,550 | |
| Teachers Insurance & Annuity Association of | |||||
| America (S) | 6.850 | 12-16-39 | 3,225,000 | 3,981,640 | |
| The Chubb Corp. (6.375% until 4-15-17, then | |||||
| 3 month LIBOR + 2.250%) | 6.375 | 03-29-67 | 2,225,000 | 2,417,463 | |
| The Hanover Insurance Group, Inc. | 6.375 | 06-15-21 | 735,000 | 812,491 | |
| Unum Group | 7.125 | 09-30-16 | 1,785,000 | 2,040,169 | |
| White Mountains Re Group, Ltd. (7.506% to | |||||
| 6-30-17, then 3 month LIBOR + 3.200%) (Q)(S) | 7.506 | 06-30-17 | 2,375,000 | 2,432,819 | |
| WR Berkley Corp. | 5.375 | 09-15-20 | 1,705,000 | 1,864,484 | |
| Real Estate Investment Trusts 2.7% | |||||
| Corrections Corp. of America | 4.625 | 05-01-23 | 2,140,000 | 2,016,950 | |
| DDR Corp. | 7.500 | 04-01-17 | 5,155,000 | 6,054,764 | |
| DDR Corp. | 7.875 | 09-01-20 | 715,000 | 886,968 | |
| Goodman Funding Pty, Ltd. (S) | 6.375 | 04-15-21 | 3,120,000 | 3,450,552 | |
| Health Care REIT, Inc. | 4.950 | 01-15-21 | 1,095,000 | 1,169,549 | |
| Health Care REIT, Inc. | 6.125 | 04-15-20 | 4,995,000 | 5,686,198 | |
| Healthcare Realty Trust, Inc. | 6.500 | 01-17-17 | 2,120,000 | 2,388,371 | |
| Highwoods Realty LP | 5.850 | 03-15-17 | 4,325,000 | 4,808,431 | |
| Host Hotels & Resorts LP | 5.250 | 03-15-22 | 2,420,000 | 2,533,457 | |
| MPT Operating Partnership LP | 6.375 | 02-15-22 | 1,685,000 | 1,735,550 | |
| MPT Operating Partnership LP | 6.875 | 05-01-21 | 1,175,000 | 1,260,188 | |
| ProLogis International Funding II (S) | 4.875 | 02-15-20 | 1,055,000 | 1,057,064 | |
| ProLogis LP | 3.350 | 02-01-21 | 2,100,000 | 2,059,840 | |
| Realty Income Corp. | 4.650 | 08-01-23 | 1,165,000 | 1,190,248 | |
| Ventas Realty LP | 4.000 | 04-30-19 | 1,985,000 | 2,104,285 | |
| Ventas Realty LP | 4.750 | 06-01-21 | 4,815,000 | 5,103,563 | |
| WEA Finance LLC (S) | 6.750 | 09-02-19 | 1,520,000 | 1,827,317 | |
| Weyerhaeuser Company | 7.375 | 03-15-32 | 3,410,000 | 4,183,333 | |
| Real Estate Management & Development 0.2% | |||||
| General Shopping Investments, Ltd. | |||||
| (12.000% to 3-20-17, then 5 Year USGG + | |||||
| 11.052%) (Q)(S) | 12.000 | 03-20-17 | 1,270,000 | 1,098,550 | |
| NANA Development Corp. (S) | 9.500 | 03-15-19 | 1,685,000 | 1,727,125 | |
| Thrifts & Mortgage Finance 0.4% | |||||
| Nationstar Mortgage LLC | 7.875 | 10-01-20 | 2,050,000 | 2,126,875 | |
| Nationstar Mortgage LLC | 9.625 | 05-01-19 | 1,755,000 | 1,974,375 | |
| Nationstar Mortgage LLC | 10.875 | 04-01-15 | 2,690,000 | 2,763,975 | |
| 16 | Bond Fund | Semiannual report | See notes to financial statements |
| Maturity | |||||
| Rate (%) | date | Par value^ | Value | ||
| Health Care 1.2% | $21,247,252 | ||||
| Health Care Equipment & Supplies 0.1% | |||||
| Alere, Inc. | 7.250 | 07-01-18 | 2,005,000 | 2,195,475 | |
| Health Care Providers & Services 0.6% | |||||
| HCA, Inc. | 7.500 | 02-15-22 | 1,855,000 | 2,063,688 | |
| LifePoint Hospitals, Inc. (S) | 5.500 | 12-01-21 | 550,000 | 552,750 | |
| Medco Health Solutions, Inc. | 7.125 | 03-15-18 | 1,820,000 | 2,187,296 | |
| National Mentor Holdings, Inc. (S) | 12.500 | 02-15-18 | 3,385,000 | 3,621,950 | |
| Tenet Healthcare Corp. (S) | 6.000 | 10-01-20 | 730,000 | 762,850 | |
| WellCare Health Plans, Inc. | 5.750 | 11-15-20 | 1,330,000 | 1,366,575 | |
| Pharmaceuticals 0.5% | |||||
| Endo Health Solutions, Inc. | 7.250 | 01-15-22 | 2,295,000 | 2,484,338 | |
| Mylan, Inc. (S) | 7.875 | 07-15-20 | 3,685,000 | 4,186,330 | |
| Valeant Pharmaceuticals International, Inc. (S) | 7.500 | 07-15-21 | 1,660,000 | 1,826,000 | |
| Industrials 6.6% | 119,559,382 | ||||
| Aerospace & Defense 0.9% | |||||
| Embraer Overseas, Ltd. (S) | 5.696 | 09-16-23 | 1,548,000 | 1,548,000 | |
| Huntington Ingalls Industries, Inc. | 7.125 | 03-15-21 | 2,090,000 | 2,278,100 | |
| Kratos Defense & Security Solutions, Inc. | 10.000 | 06-01-17 | 2,800,000 | 3,031,000 | |
| Textron Financial Corp. (6.000% to 2-15-17, | |||||
| then 3 month LIBOR + 1.735%) (S) | 6.000 | 02-15-67 | 4,770,000 | 4,209,525 | |
| Textron, Inc. | 5.600 | 12-01-17 | 2,195,000 | 2,433,265 | |
| Textron, Inc. | 7.250 | 10-01-19 | 1,440,000 | 1,697,943 | |
| Airlines 2.3% | |||||
| America West Airlines 2000-1 Pass | |||||
| Through Trust | 8.057 | 07-02-20 | 593,567 | 641,053 | |
| American Airlines 2011-1 Class B Pass Through | |||||
| Trust (S) | 7.000 | 01-31-18 | 5,230,703 | 5,505,315 | |
| American Airlines 2013-2 Class A Pass Through | |||||
| Trust (S) | 4.950 | 01-15-23 | 2,550,000 | 2,671,125 | |
| American Airlines 2013-2 Class B Pass Through | |||||
| Trust (S) | 5.600 | 07-15-20 | 1,230,000 | 1,234,613 | |
| British Airways PLC (S) | 4.625 | 06-20-24 | 4,245,000 | 4,329,900 | |
| British Airways PLC (S) | 5.625 | 06-20-20 | 1,135,000 | 1,174,725 | |
| Continental Airlines 1997-4 Class A Pass | |||||
| Through Trust | 6.900 | 01-02-18 | 1,930,768 | 2,068,238 | |
| Continental Airlines 1998-1 Class A Pass | |||||
| Through Trust | 6.648 | 09-15-17 | 509,738 | 540,322 | |
| Continental Airlines 1999-1 Class A Pass | |||||
| Through Trust | 6.545 | 02-02-19 | 953,928 | 1,035,012 | |
| Continental Airlines 2000-2 Class B Pass | |||||
| Through Trust | 8.307 | 04-02-18 | 303,256 | 320,693 | |
| Continental Airlines 2007-1 Class A Pass | |||||
| Through Trust | 5.983 | 04-19-22 | 2,278,908 | 2,489,707 | |
| Continental Airlines 2010-1 Class A Pass | |||||
| Through Trust | 4.750 | 01-12-21 | 727,057 | 774,316 | |
| Continental Airlines 2012-1 Class B Pass | |||||
| Through Trust | 6.250 | 04-11-20 | 1,257,854 | 1,314,457 | |
| Delta Air Lines 2002-1 Class G-1 Pass | |||||
| Through Trust | 6.718 | 01-02-23 | 3,389,704 | 3,804,942 | |
| See notes to financial statements | Semiannual report | Bond Fund | 17 |
| Maturity | |||||
| Rate (%) | date | Par value^ | Value | ||
| Airlines (continued) | |||||
| Delta Air Lines 2007-1 Class A Pass | |||||
| Through Trust | 6.821 | 08-10-22 | 4,504,059 | $5,067,066 | |
| Delta Air Lines 2010-1 Class A Pass | |||||
| Through Trust | 6.200 | 07-02-18 | 784,880 | 873,179 | |
| Delta Air Lines 2011-1 Class A Pass | |||||
| Through Trust | 5.300 | 04-15-19 | 1,437,816 | 1,560,030 | |
| Northwest Airlines 2007-1 Class A Pass | |||||
| Through Trust | 7.027 | 11-01-19 | 1,684,941 | 1,870,621 | |
| UAL 2009-1 Pass Through Trust | 10.400 | 11-01-16 | 420,915 | 475,634 | |
| UAL 2009-2A Pass Through Trust | 9.750 | 01-15-17 | 1,413,286 | 1,607,613 | |
| US Airways 2010-1 Class A Pass Through Trust | 6.250 | 04-22-23 | 1,555,610 | 1,683,948 | |
| US Airways 2012-1 Class A Pass Through Trust | 5.900 | 10-01-24 | 946,058 | 1,019,377 | |
| Building Products 0.5% | |||||
| Masco Corp. | 7.125 | 03-15-20 | 1,680,000 | 1,906,800 | |
| Owens Corning | 4.200 | 12-15-22 | 2,710,000 | 2,625,470 | |
| Voto-Votorantim Overseas Trading Operations | |||||
| NV (S) | 6.625 | 09-25-19 | 2,145,000 | 2,386,313 | |
| Voto-Votorantim, Ltd. (S) | 6.750 | 04-05-21 | 2,590,000 | 2,868,425 | |
| Commercial Services & Supplies 0.6% | |||||
| Ahern Rentals, Inc. (S) | 9.500 | 06-15-18 | 1,380,000 | 1,483,500 | |
| Casella Waste Systems, Inc. | 7.750 | 02-15-19 | 2,385,000 | 2,408,850 | |
| Iron Mountain, Inc. | 5.750 | 08-15-24 | 2,330,000 | 2,178,550 | |
| Iron Mountain, Inc. | 6.000 | 08-15-23 | 3,080,000 | 3,141,600 | |
| Safway Group Holding LLC (S) | 7.000 | 05-15-18 | 1,225,000 | 1,283,188 | |
| Construction & Engineering 0.4% | |||||
| Aeropuertos Dominicanos Siglo XXI SA (S) | 9.250 | 11-13-19 | 3,025,000 | 3,009,875 | |
| Empresas ICA SAB de CV (S) | 8.375 | 07-24-17 | 1,675,000 | 1,641,500 | |
| Tutor Perini Corp. | 7.625 | 11-01-18 | 2,945,000 | 3,158,513 | |
| Electrical Equipment 0.1% | |||||
| Coleman Cable, Inc. | 9.000 | 02-15-18 | 1,460,000 | 1,540,300 | |
| Industrial Conglomerates 0.5% | |||||
| KOC Holding AS (S) | 3.500 | 04-24-20 | 2,385,000 | 2,095,819 | |
| Odebrecht Finance, Ltd. (S) | 7.125 | 06-26-42 | 2,725,000 | 2,530,844 | |
| Odebrecht Finance, Ltd. (Q)(S) | 7.500 | 09-14-15 | 970,000 | 940,900 | |
| Odebrecht Finance, Ltd. (S) | 8.250 | 04-25-18 | BRL 2,850,000 | 1,019,492 | |
| Tenedora Nemak SA de CV (S) | 5.500 | 02-28-23 | 1,980,000 | 1,915,650 | |
| Marine 0.3% | |||||
| Navios Maritime Acquisition Corp. (S) | 8.125 | 11-15-21 | 1,835,000 | 1,857,938 | |
| Navios South American Logistics, Inc. | 9.250 | 04-15-19 | 3,910,000 | 4,222,800 | |
| Road & Rail 0.3% | |||||
| Penske Truck Leasing Company LP (S) | 3.750 | 05-11-17 | 2,515,000 | 2,654,223 | |
| The Kenan Advantage Group, Inc. (S) | 8.375 | 12-15-18 | 2,335,000 | 2,451,750 | |
| Trading Companies & Distributors 0.7% | |||||
| Air Lease Corp. | 3.375 | 01-15-19 | 2,965,000 | 2,972,294 | |
| Air Lease Corp. | 4.500 | 01-15-16 | 535,000 | 565,094 | |
| Air Lease Corp. | 4.750 | 03-01-20 | 1,480,000 | 1,539,200 | |
| Air Lease Corp. | 5.625 | 04-01-17 | 1,200,000 | 1,317,000 | |
| Aircastle, Ltd. | 6.250 | 12-01-19 | 1,360,000 | 1,468,800 | |
| 18 | Bond Fund | Semiannual report | See notes to financial statements |
| Maturity | |||||
| Rate (%) | date | Par value^ | Value | ||
| Trading Companies & Distributors (continued) | |||||
| Aircastle, Ltd. | 7.625 | 04-15-20 | 885,000 | $1,000,050 | |
| Glencore Funding LLC (S) | 4.125 | 05-30-23 | 2,625,000 | 2,455,706 | |
| International Lease Finance Corp. (S) | 7.125 | 09-01-18 | 1,435,000 | 1,659,219 | |
| Information Technology 0.6% | 11,088,401 | ||||
| Internet Software & Services 0.2% | |||||
| Ancestry.com, Inc. | 11.000 | 12-15-20 | 1,980,000 | 2,301,750 | |
| Ancestry.com, Inc., PIK (S) | 9.625 | 10-15-18 | 920,000 | 947,600 | |
| Healthcare Technology Intermediate, Inc., PIK (S) | 7.375 | 09-01-18 | 1,275,000 | 1,310,063 | |
| IT Services 0.2% | |||||
| Brightstar Corp. (S) | 9.500 | 12-01-16 | 2,975,000 | 3,287,375 | |
| Software 0.2% | |||||
| Aspect Software, Inc. | 10.625 | 05-15-17 | 2,265,000 | 2,315,963 | |
| Blackboard, Inc. (S) | 7.750 | 11-15-19 | 935,000 | 925,650 | |
| Materials 4.4% | 79,157,042 | ||||
| Chemicals 1.2% | |||||
| Braskem Finance, Ltd. (S) | 7.000 | 05-07-20 | 3,250,000 | 3,477,500 | |
| CF Industries, Inc. | 7.125 | 05-01-20 | 3,500,000 | 4,130,879 | |
| Incitec Pivot Finance LLC (S) | 6.000 | 12-10-19 | 1,920,000 | 2,131,945 | |
| LyondellBasell Industries NV | 5.000 | 04-15-19 | 6,670,000 | 7,486,935 | |
| Methanex Corp. | 5.250 | 03-01-22 | 2,320,000 | 2,487,021 | |
| Nufarm Australia, Ltd. (S) | 6.375 | 10-15-19 | 1,005,000 | 1,040,175 | |
| Rain CII Carbon LLC (S) | 8.250 | 01-15-21 | 1,225,000 | 1,255,625 | |
| Construction Materials 0.4% | |||||
| American Gilsonite Company (S) | 11.500 | 09-01-17 | 2,785,000 | 2,757,150 | |
| Cemex SAB de CV (S) | 6.500 | 12-10-19 | 2,350,000 | 2,379,375 | |
| Magnesita Finance, Ltd. (Q)(S) | 8.625 | 04-05-17 | 2,220,000 | 2,131,200 | |
| Severstal Columbus LLC | 10.250 | 02-15-18 | 490,000 | 519,400 | |
| Containers & Packaging 0.7% | |||||
| ARD Finance SA, PIK (S) | 11.125 | 06-01-18 | 2,210,517 | 2,365,253 | |
| Consolidated Container Company LLC (S) | 10.125 | 07-15-20 | 2,011,000 | 2,156,798 | |
| Pretium Packaging LLC | 11.500 | 04-01-16 | 780,000 | 832,650 | |
| Rock-Tenn Company | 4.000 | 03-01-23 | 3,130,000 | 3,038,770 | |
| Tekni-Plex, Inc. (S) | 9.750 | 06-01-19 | 1,470,000 | 1,675,800 | |
| Wise Metals Group LLC (S) | 8.750 | 12-15-18 | 2,215,000 | 2,248,225 | |
| Metals & Mining 1.8% | |||||
| Allegheny Technologies, Inc. | 5.950 | 01-15-21 | 965,000 | 1,005,404 | |
| Allegheny Technologies, Inc. | 9.375 | 06-01-19 | 5,025,000 | 6,207,367 | |
| AngloGold Ashanti Holdings PLC | 8.500 | 07-30-20 | 2,845,000 | 2,980,138 | |
| ArcelorMittal | 10.350 | 06-01-19 | 1,695,000 | 2,139,938 | |
| Barrick Gold Corp. | 4.100 | 05-01-23 | 2,335,000 | 2,104,255 | |
| Commercial Metals Company | 7.350 | 08-15-18 | 1,570,000 | 1,789,800 | |
| Edgen Murray Corp. (S) | 8.750 | 11-01-20 | 1,810,000 | 2,095,075 | |
| Gerdau Trade, Inc. (S) | 4.750 | 04-15-23 | 1,550,000 | 1,433,750 | |
| JMC Steel Group (S) | 8.250 | 03-15-18 | 1,025,000 | 1,019,875 | |
| MMC Finance, Ltd. (S) | 5.550 | 10-28-20 | 1,515,000 | 1,511,213 | |
| Rain CII Carbon LLC (S) | 8.000 | 12-01-18 | 2,070,000 | 2,142,450 | |
| SunCoke Energy, Inc. | 7.625 | 08-01-19 | 1,606,000 | 1,730,465 | |
| See notes to financial statements | Semiannual report | Bond Fund | 19 |
| Maturity | |||||
| Rate (%) | date | Par value^ | Value | ||
| Metals & Mining (continued) | |||||
| Thompson Creek Metals Company, Inc. | 7.375 | 06-01-18 | 2,005,000 | $1,749,363 | |
| Vedanta Resources PLC (S) | 7.125 | 05-31-23 | 1,950,000 | 1,796,438 | |
| Walter Energy, Inc. | 9.875 | 12-15-20 | 1,445,000 | 1,278,825 | |
| Xstrata Finance Canada, Ltd. (S) | 4.250 | 10-25-22 | 1,475,000 | 1,408,926 | |
| Paper & Forest Products 0.3% | |||||
| Georgia-Pacific LLC | 7.250 | 06-01-28 | 900,000 | 1,107,394 | |
| International Paper Company | 9.375 | 05-15-19 | 1,950,000 | 2,588,615 | |
| Neenah Paper, Inc. (S) | 5.250 | 05-15-21 | 980,000 | 953,050 | |
| Telecommunication Services 3.8% | 67,788,835 | ||||
| Diversified Telecommunication Services 2.6% | |||||
| American Tower Corp. | 3.400 | 02-15-19 | 1,580,000 | 1,603,133 | |
| American Tower Corp. | 4.700 | 03-15-22 | 2,210,000 | 2,225,492 | |
| CenturyLink, Inc. | 5.625 | 04-01-20 | 950,000 | 966,625 | |
| CenturyLink, Inc. | 5.800 | 03-15-22 | 2,915,000 | 2,878,563 | |
| CenturyLink, Inc. | 6.450 | 06-15-21 | 1,880,000 | 1,959,900 | |
| CenturyLink, Inc. | 7.600 | 09-15-39 | 1,645,000 | 1,488,725 | |
| Crown Castle Towers LLC (S) | 4.883 | 08-15-20 | 3,275,000 | 3,479,167 | |
| Crown Castle Towers LLC (S) | 6.113 | 01-15-20 | 2,924,000 | 3,287,977 | |
| GTP Acquisition Partners I LLC (S) | 4.704 | 05-15-18 | 3,440,000 | 3,401,582 | |
| GTP Acquisition Partners I LLC (S) | 7.628 | 06-15-16 | 3,625,000 | 3,909,055 | |
| Oi SA (S) | 9.750 | 09-15-16 | BRL 3,440,000 | 1,318,968 | |
| PAETEC Holding Corp. | 9.875 | 12-01-18 | 2,119,000 | 2,367,983 | |
| T-Mobile USA, Inc. | 6.125 | 01-15-22 | 970,000 | 988,188 | |
| Telecom Italia Capital SA | 6.999 | 06-04-18 | 2,130,000 | 2,354,489 | |
| Telecom Italia Capital SA | 7.200 | 07-18-36 | 1,790,000 | 1,650,607 | |
| Telefonica Emisiones SAU | 6.421 | 06-20-16 | 4,270,000 | 4,770,145 | |
| Verizon Communications, Inc. | 4.500 | 09-15-20 | 3,130,000 | 3,360,512 | |
| Verizon Communications, Inc. | 6.550 | 09-15-43 | 3,220,000 | 3,662,689 | |
| Wireless Telecommunication Services 1.2% | |||||
| Clearwire Communications LLC (S) | 12.000 | 12-01-15 | 1,805,000 | 1,859,150 | |
| Digicel Group, Ltd. (S) | 8.250 | 09-30-20 | 2,455,000 | 2,565,475 | |
| ENTEL Chile SA (S) | 4.875 | 10-30-24 | 1,775,000 | 1,738,005 | |
| MetroPCS Wireless, Inc. (S) | 6.250 | 04-01-21 | 1,200,000 | 1,248,000 | |
| Millicom International Cellular SA (S) | 4.750 | 05-22-20 | 1,485,000 | 1,418,175 | |
| Millicom International Cellular SA (S) | 6.625 | 10-15-21 | 2,015,000 | 2,055,300 | |
| SBA Tower Trust (S) | 2.933 | 12-15-17 | 2,220,000 | 2,229,544 | |
| SBA Tower Trust (S) | 3.598 | 04-15-18 | 2,545,000 | 2,511,627 | |
| SBA Tower Trust (S) | 5.101 | 04-17-17 | 2,090,000 | 2,257,259 | |
| SoftBank Corp. (S) | 4.500 | 04-15-20 | 2,800,000 | 2,782,500 | |
| Verizon New York, Inc. | 7.000 | 12-01-33 | 1,450,000 | 1,450,000 | |
| Utilities 2.1% | 38,588,887 | ||||
| Electric Utilities 1.2% | |||||
| Beaver Valley II Funding Corp. | 9.000 | 06-01-17 | 566,000 | 570,989 | |
| BVPS II Funding Corp. | 8.890 | 06-01-17 | 1,172,000 | 1,241,191 | |
| DPL, Inc. | 7.250 | 10-15-21 | 2,975,000 | 3,034,500 | |
| Electricite de France SA (5.250% to 1-29-23, | |||||
| then 10 Year Swap Rate + 3.709%) (Q)(S) | 5.250 | 01-29-23 | 1,330,000 | 1,314,040 | |
| 20 | Bond Fund | Semiannual report | See notes to financial statements |
| Maturity | |||||
| Rate (%) | date | Par value^ | Value | ||
| Electric Utilities (continued) | |||||
| Israel Electric Corp., Ltd. (S) | 5.625 | 06-21-18 | 2,790,000 | $2,935,892 | |
| Israel Electric Corp., Ltd. (S) | 6.875 | 06-21-23 | 1,415,000 | 1,504,635 | |
| Israel Electric Corp., Ltd. (S) | 7.250 | 01-15-19 | 2,720,000 | 3,025,353 | |
| NextEra Energy Capital Holdings, Inc. (6.650% | |||||
| to 6-15-17, then 3 month LIBOR + 2.125%) | 6.650 | 06-15-67 | 1,355,000 | 1,388,875 | |
| PNPP II Funding Corp. | 9.120 | 05-30-16 | 426,000 | 446,825 | |
| PPL Capital Funding, Inc. (6.700% to 3-30-17, | |||||
| then 3 month LIBOR + 2.665%) | 6.700 | 03-30-67 | 2,860,000 | 2,885,025 | |
| Southern California Edison Company | |||||
| (6.250% to 2-1-22, then 3 month LIBOR + | |||||
| 4.199%) (Q) | 6.250 | 02-01-22 | 1,710,000 | 1,769,850 | |
| W3A Funding Corp. | 8.090 | 01-02-17 | 1,206,010 | 1,206,229 | |
| Gas Utilities 0.0% | |||||
| LBC Tank Terminals Holding Netherlands BV (S) | 6.875 | 05-15-23 | 755,000 | 790,863 | |
| Independent Power Producers & Energy Traders 0.3% | |||||
| AES Corp. | 4.875 | 05-15-23 | 555,000 | 523,088 | |
| Calpine Corp. (S) | 6.000 | 01-15-22 | 745,000 | 765,488 | |
| NRG Energy, Inc. | 7.625 | 01-15-18 | 2,460,000 | 2,804,400 | |
| NRG Energy, Inc. | 8.250 | 09-01-20 | 1,910,000 | 2,124,875 | |
| Multi-Utilities 0.6% | |||||
| CMS Energy Corp. | 5.050 | 03-15-22 | 3,889,000 | 4,249,775 | |
| Integrys Energy Group, Inc. (6.110% to | |||||
| 12-1-16, then 3 month LIBOR + 2.120%) | 6.110 | 12-01-66 | 3,915,000 | 3,949,256 | |
| Wisconsin Energy Corp. (6.250% to 5-15-17, | |||||
| then 3 month LIBOR + 2.113%) | 6.250 | 05-15-67 | 2,010,000 | 2,057,738 | |
| U.S. Government & Agency Obligations 21.7% | $391,317,020 | ||||
| (Cost $394,813,404) | |||||
| U.S. Government 7.3% | 131,412,532 | ||||
| U.S. Treasury | |||||
| Bond | 3.625 | 08-15-43 | 33,090,000 | 31,973,213 | |
| Note | 1.000 | 06-30-19 | 14,525,000 | 14,042,726 | |
| Note | 1.250 | 10-31-18 | 7,140,000 | 7,108,763 | |
| Note | 1.375 | 09-30-18 | 14,085,000 | 14,126,818 | |
| Note | 2.750 | 11-15-23 | 64,141,000 | 64,161,012 | |
| U.S. Government Agency 14.4% | 259,904,488 | ||||
| Federal Home Loan Mortgage Corp. | |||||
| 30 Yr Pass Thru | 3.000 | 03-01-43 | 7,391,822 | 7,120,115 | |
| 30 Yr Pass Thru | 3.500 | 05-01-42 | 5,188,694 | 5,230,852 | |
| 30 Yr Pass Thru | 3.500 | 06-01-42 | 12,626,358 | 12,728,948 | |
| 30 Yr Pass Thru | 4.500 | 11-01-39 | 8,368,125 | 8,922,840 | |
| 30 Yr Pass Thru | 5.000 | 04-01-41 | 4,025,441 | 4,352,036 | |
| 30 Yr Pass Thru | 6.500 | 09-01-39 | 2,621,710 | 2,912,700 | |
| Federal National Mortgage Association | |||||
| 15 Yr Pass Thru | 3.000 | 09-01-27 | 8,781,815 | 9,065,852 | |
| 15 Yr Pass Thru | 3.500 | 02-01-26 | 1,374,211 | 1,450,008 | |
| 15 Yr Pass Thru | 3.500 | 03-01-26 | 11,187,974 | 11,805,060 | |
| 15 Yr Pass Thru | 4.000 | 12-01-24 | 7,186,525 | 7,703,057 | |
| 30 Yr Pass Thru | 3.000 | 10-01-42 | 8,116,099 | 7,843,132 | |
| 30 Yr Pass Thru | 3.000 | 12-01-42 | 4,202,766 | 4,061,415 | |
| 30 Yr Pass Thru | 3.000 | 01-01-43 | 3,009,086 | 2,907,882 | |
| 30 Yr Pass Thru | 3.000 | 03-01-43 | 2,118,712 | 2,050,102 | |
| See notes to financial statements | Semiannual report | Bond Fund | 21 |
| Maturity | |||||
| Rate (%) | date | Par value^ | Value | ||
| U.S. Government Agency (continued) | |||||
| Federal National Mortgage Association | |||||
| 30 Yr Pass Thru | 3.000 | 05-01-43 | 2,767,040 | $2,677,435 | |
| 30 Yr Pass Thru | 3.500 | 06-01-42 | 6,707,679 | 6,775,804 | |
| 30 Yr Pass Thru | 3.500 | 08-01-42 | 11,673,804 | 11,792,365 | |
| 30 Yr Pass Thru | 4.000 | 11-01-40 | 2,633,494 | 2,755,602 | |
| 30 Yr Pass Thru | 4.000 | 09-01-41 | 14,523,716 | 15,198,744 | |
| 30 Yr Pass Thru | 4.000 | 10-01-41 | 4,072,922 | 4,257,954 | |
| 30 Yr Pass Thru | 4.500 | 02-01-41 | 15,709,524 | 16,772,371 | |
| 30 Yr Pass Thru | 4.500 | 06-01-41 | 16,578,445 | 17,744,115 | |
| 30 Yr Pass Thru | 4.500 | 07-01-41 | 7,258,554 | 7,768,921 | |
| 30 Yr Pass Thru | 5.000 | 09-01-40 | 10,196,324 | 11,082,130 | |
| 30 Yr Pass Thru | 5.000 | 09-01-40 | 10,046,080 | 11,019,294 | |
| 30 Yr Pass Thru | 5.000 | 02-01-41 | 7,565,838 | 8,327,151 | |
| 30 Yr Pass Thru | 5.000 | 03-01-41 | 8,461,168 | 9,296,708 | |
| 30 Yr Pass Thru | 5.000 | 04-01-41 | 15,350,339 | 16,711,463 | |
| 30 Yr Pass Thru | 5.500 | 05-01-35 | 4,093,800 | 4,491,026 | |
| 30 Yr Pass Thru | 5.500 | 04-01-36 | 1,098,691 | 1,201,522 | |
| 30 Yr Pass Thru | 5.500 | 05-01-36 | 4,901,735 | 5,363,570 | |
| 30 Yr Pass Thru | 5.500 | 01-01-39 | 4,030,342 | 4,422,040 | |
| 30 Yr Pass Thru | 6.000 | 02-01-37 | 1,127,004 | 1,233,620 | |
| 30 Yr Pass Thru | 6.000 | 07-01-38 | 4,356,038 | 4,797,282 | |
| 30 Yr Pass Thru | 6.500 | 01-01-39 | 5,392,715 | 5,991,672 | |
| 30 Yr Pass Thru | 6.500 | 06-01-39 | 1,852,256 | 2,069,700 | |
| Foreign Government Obligations 0.2% | $3,320,000 | ||||
| (Cost $3,199,741) | |||||
| Argentina 0.2% | 3,320,000 | ||||
| City of Buenos Aires (S) | 9.950 | 03-01-17 | 3,320,000 | 3,320,000 | |
| Convertible Bonds 0.1% | $1,228,769 | ||||
| (Cost $702,974) | |||||
| Consumer Discretionary 0.1% | 1,228,769 | ||||
| Media 0.1% | |||||
| XM Satellite Radio, Inc. (S) | 7.000 | 12-01-14 | 586,000 | 1,228,769 | |
| Term Loans (M) 1.0% | $17,632,911 | ||||
| (Cost $17,513,950) | |||||
| Consumer Discretionary 0.1% | 1,888,435 | ||||
| Auto Components 0.0% | |||||
| Tower Automotive Holdings USA LLC | 4.750 | 04-23-20 | 472,628 | 476,161 | |
| Distributors 0.0% | |||||
| Hudson’s Bay Company | 8.250 | 11-04-21 | 200,000 | 204,400 | |
| Hotels, Restaurants & Leisure 0.1% | |||||
| CCM Merger, Inc. | 5.000 | 03-01-17 | 660,325 | 663,834 | |
| Specialty Retail 0.0% | |||||
| Toys R Us Property Company I LLC | 6.000 | 08-21-19 | 560,000 | 544,040 | |
| 22 | Bond Fund | Semiannual report | See notes to financial statements |
| Maturity | |||||
| Rate (%) | date | Par value^ | Value | ||
| Consumer Staples 0.1% | $2,460,836 | ||||
| Household Products 0.1% | |||||
| The Sun Products Corp. | 5.500 | 03-23-20 | 2,628,396 | 2,460,836 | |
| Energy 0.1% | 1,543,069 | ||||
| Oil, Gas & Consumable Fuels 0.1% | |||||
| Templar Energy LLC (T) | TBD | 11-25-20 | 1,545,000 | 1,543,069 | |
| Financials 0.1% | 2,462,149 | ||||
| Capital Markets 0.1% | |||||
| Walter Investment Management Corp. | 5.750 | 11-28-17 | 1,901,203 | 1,914,511 | |
| Real Estate Investment Trusts 0.0% | |||||
| iStar Financial, Inc. | 4.500 | 10-16-17 | 545,082 | 547,638 | |
| Industrials 0.3% | 5,556,445 | ||||
| Aerospace & Defense 0.1% | |||||
| WP CPP Holdings LLC | 4.750 | 12-27-19 | 992,500 | 992,500 | |
| Air Freight & Logistics 0.1% | |||||
| Syncreon Holdings, Ltd. | 5.250 | 10-28-20 | 3,000,000 | 2,970,000 | |
| Airlines 0.1% | |||||
| Delta Air Lines, Inc. | 4.000 | 10-18-18 | 1,588,000 | 1,593,945 | |
| Information Technology 0.0% | 453,563 | ||||
| Software 0.0% | |||||
| BMC Software Finance, Inc. | 5.000 | 09-10-20 | 450,000 | 453,563 | |
| Materials 0.1% | 1,448,573 | ||||
| Metals & Mining 0.1% | |||||
| FMG Resources August 2006 Pty, Ltd. | 4.250 | 06-28-19 | 1,435,500 | 1,448,573 | |
| Telecommunication Services 0.0% | 497,904 | ||||
| Wireless Telecommunication Services 0.0% | |||||
| Cricket Communications, Inc. | 4.750 | 10-10-19 | 496,250 | 497,904 | |
| Utilities 0.1% | 1,321,937 | ||||
| Electric Utilities 0.1% | |||||
| La Frontera Generation LLC | 4.500 | 09-30-20 | 1,311,283 | 1,321,937 | |
| Capital Preferred Securities 1.4% | $24,892,376 | ||||
| (Cost $24,662,123) | |||||
| Financials 1.4% | 24,892,376 | ||||
| Capital Markets 0.2% | |||||
| State Street Capital Trust IV (P) | 1.254 | 06-15-37 | 4,580,000 | 3,533,470 | |
| Commercial Banks 0.5% | |||||
| Allfirst Preferred Capital Trust (P) | 1.744 | 07-15-29 | 1,305,000 | 1,070,100 | |
| Fifth Third Capital Trust IV (6.500% to 4-15-17, | |||||
| then 3 month LIBOR + 1.368%) | 6.500 | 04-15-37 | 5,175,000 | 5,168,531 | |
| PNC Financial Services Group, Inc. (6.750% to | |||||
| 8-1-21, then 3 month LIBOR + 3.678%) (Q) | 6.750 | 08-01-21 | 1,200,000 | 1,257,000 | |
| Sovereign Capital Trust VI | 7.908 | 06-13-36 | 2,115,000 | 2,199,600 | |
| See notes to financial statements | Semiannual report | Bond Fund | 23 |
| Maturity | |||||
| Rate (%) | date | Par value^ | Value | ||
| Insurance 0.7% | |||||
| MetLife Capital Trust IV (7.875% to 12-15-32, | |||||
| then 3 month LIBOR + 3.960%) (S) | 7.875 | 12-15-37 | 960,000 | $1,096,800 | |
| MetLife Capital Trust X (9.250% to 4-8-33, | |||||
| then 3 month LIBOR + 5.540%) (S) | 9.250 | 04-08-38 | 2,050,000 | 2,624,000 | |
| ZFS Finance USA Trust II (6.450% to 6-15-16 | |||||
| then 3 month LIBOR + 2.000%) (S) | 6.450 | 12-15-65 | 5,885,000 | 6,326,375 | |
| ZFS Finance USA Trust V (6.500% to 5-9-17, | |||||
| then 3 month LIBOR + 2.285%) (S) | 6.500 | 05-09-37 | 1,525,000 | 1,616,500 | |
| Collateralized Mortgage Obligations 17.0% | $305,382,564 | ||||
| (Cost $296,337,969) | |||||
| Commercial & Residential 13.1% | 234,754,024 | ||||
| American Home Mortgage Assets LLC | |||||
| Series 2006-6, Class XP IO | 2.023 | 12-25-46 | 21,641,422 | 1,511,725 | |
| American Home Mortgage Investment Trust | |||||
| Series 2005-1, Class 1A1 (P) | 0.386 | 06-25-45 | 4,279,862 | 3,961,440 | |
| Americold 2010 LLC Trust | |||||
| Series 2010-ARTA, Class D (S) | 7.443 | 01-14-29 | 4,285,000 | 4,831,625 | |
| Banc of America Commercial Mortgage Trust, Inc. | |||||
| Series 2006-2, Class AM (P) | 5.958 | 05-10-45 | 3,615,000 | 4,001,425 | |
| Series 2006-4, Class AM | 5.675 | 07-10-46 | 5,350,000 | 5,890,976 | |
| Series 2006-3, Class A4 (P) | 5.889 | 07-10-44 | 3,935,000 | 4,296,693 | |
| Banc of America Re-Remic Trust | |||||
| Series 2013-DSNY, Class E (P)(S) | 2.767 | 09-15-26 | 2,300,000 | 2,306,569 | |
| Bear Stearns Adjustable Rate Mortgage Trust | |||||
| Series 2005-2, Class A1 (P) | 2.600 | 03-25-35 | 3,388,319 | 3,411,604 | |
| Series 2005-5, Class A2 (P) | 2.250 | 08-25-35 | 3,710,974 | 3,714,009 | |
| Bear Stearns Alt-A Trust | |||||
| Series 2004-12, Class 1A1 (P) | 0.866 | 01-25-35 | 5,552,927 | 5,393,164 | |
| Series 2005-5, Class 1A4 (P) | 0.726 | 07-25-35 | 3,158,257 | 2,957,938 | |
| Series 2005-7, Class 11A1 (P) | 0.706 | 08-25-35 | 5,000,482 | 4,576,616 | |
| Bear Stearns Asset Backed Securities Trust | |||||
| Series 2004-AC5, Class A1 (P) | 5.750 | 10-25-34 | 2,387,403 | 2,394,327 | |
| Citigroup/Deutsche Bank Commercial | |||||
| Mortgage Trust | |||||
| Series 2005-CD1, Class C (P) | 5.392 | 07-15-44 | 1,230,000 | 1,258,732 | |
| Commercial Mortgage Pass Through Certificates | |||||
| Series 2010-C1, Class D (P) (S) | 6.078 | 07-10-46 | 3,280,000 | 3,459,537 | |
| Series 2012-CR2, Class XA IO | 2.107 | 08-15-45 | 19,793,838 | 2,237,297 | |
| Series 2012-CR5, Class XA IO | 2.075 | 12-10-45 | 28,164,989 | 3,024,159 | |
| Series 2012-LC4, Class B (P) | 4.934 | 12-10-44 | 1,955,000 | 2,071,238 | |
| Series 2012-LC4, Class C (P) | 5.823 | 12-10-44 | 4,110,000 | 4,408,090 | |
| Series 2013-300P, Class D (P)(S) | 4.540 | 08-10-30 | 4,315,000 | 4,015,733 | |
| Series 2013-CR11, Class B (P) | 5.333 | 10-10-46 | 3,835,000 | 4,030,435 | |
| Series 2013-LC13, Class B (P)(S) | 5.009 | 08-10-46 | 3,565,000 | 3,705,917 | |
| Deutsche Mortgage Securities, Inc. | |||||
| Series 2004-4, Class 2AR1 (P) | 0.706 | 06-25-34 | 3,962,408 | 3,639,582 | |
| Extended Stay America Trust | |||||
| Series 2013-ESFL, Class DFL (P)(S) | 3.309 | 12-05-31 | 3,615,000 | 3,557,352 | |
| Series 2013-ESHM, Class M (S) | 7.625 | 12-05-19 | 2,900,000 | 2,938,434 | |
| Fontainebleau Miami Beach Trust | |||||
| Series 2012-FBLU, Class C (S) | 4.270 | 05-05-27 | 1,555,000 | 1,591,213 | |
| Series 2012-FBLU, Class D (S) | 5.007 | 05-05-27 | 2,750,000 | 2,831,345 | |
| 24 | Bond Fund | Semiannual report | See notes to financial statements |
| Maturity | |||||
| Rate (%) | date | Par value^ | Value | ||
| Commercial & Residential (continued) | |||||
| GMAC Mortgage Corp. Loan Trust | |||||
| Series 2004-AR2, Class 3A (P) | 3.325 | 08-19-34 | 2,625,292 | $2,549,676 | |
| Greenwich Capital Commercial Funding Corp. | |||||
| Series 2006-GG7, Class AM (P) | 6.018 | 07-10-38 | 3,325,000 | 3,648,257 | |
| GS Mortgage Securities Corp. II | |||||
| Series 2013-KYO, Class D (P)(S) | 2.769 | 11-08-29 | 3,685,000 | 3,675,939 | |
| GSR Mortgage Loan Trust | |||||
| Series 2005-AR6, Class 3A1 (P) | 2.656 | 09-25-35 | 4,096,545 | 4,035,568 | |
| Series 2004-9, Class B1 (P) | 3.113 | 08-25-34 | 1,593,300 | 954,148 | |
| Series 2006-AR1, Class 3A1 (P) | 2.936 | 01-25-36 | 2,453,097 | 2,125,626 | |
| HarborView Mortgage Loan Trust | |||||
| Series 2005-11, Class X IO | 2.106 | 08-19-45 | 9,556,323 | 506,237 | |
| Series 2005-9, Class 2A1C (P) | 0.618 | 06-20-35 | 4,963,010 | 4,817,008 | |
| Series 2005-8, Class 1X IO | 2.194 | 09-19-35 | 12,022,670 | 809,907 | |
| Series 2007-3, Class ES IO (S) | 0.350 | 05-19-47 | 60,053,127 | 638,064 | |
| Series 2007-4, Class ES IO | 0.350 | 07-19-47 | 64,425,718 | 684,523 | |
| Series 2007-6, Class ES IO (S) | 0.342 | 08-19-37 | 50,093,560 | 532,244 | |
| Hilton USA Trust | |||||
| Series 2013-HLF, Class EFL (P)(S) | 3.919 | 11-05-30 | 3,360,000 | 3,366,581 | |
| Series 2013-HLT, Class DFX (S) | 4.407 | 11-05-30 | 1,622,000 | 1,638,415 | |
| IndyMac Index Mortgage Loan Trust | |||||
| Series 2005-AR18, Class 1X IO | 2.035 | 10-25-36 | 24,538,285 | 1,567,390 | |
| Series 2005-AR18, Class 2X IO | 1.672 | 10-25-36 | 38,480,077 | 1,338,437 | |
| JPMorgan Chase Commercial Mortgage Securities Corp. | |||||
| Series 2006-LDP7, Class AM (P) | 6.056 | 04-15-45 | 4,195,000 | 4,646,193 | |
| Series 2007-LD12, Class AM (P) | 6.192 | 02-15-51 | 5,600,000 | 6,243,104 | |
| Series 2007-LDPX, Class AM (P) | 5.464 | 01-15-49 | 6,175,000 | 6,357,082 | |
| Series 2012-HSBC, Class XA IO (S) | 1.582 | 07-05-32 | 20,100,000 | 2,082,340 | |
| Series 2012-PHH, Class D (P)(S) | 3.435 | 10-15-25 | 1,575,000 | 1,585,045 | |
| Series 2013-INMZ, Class M (P)(S) | 6.145 | 09-15-18 | 3,490,000 | 3,511,381 | |
| Series 2013-JWRZ, Class D (P)(S) | 3.158 | 04-15-30 | 3,095,000 | 3,080,110 | |
| LB–UBS Commercial Mortgage Trust | |||||
| Series 2006-C6, Class AM | 5.413 | 09-15-39 | 6,124,000 | 6,774,148 | |
| MASTR Adjustable Rate Mortgages Trust | |||||
| Series 2004-11, Class M2 (P) | 1.266 | 11-25-34 | 3,370,000 | 3,132,648 | |
| Merrill Lynch Mortgage Investors Trust | |||||
| Series 2004-1, Class 2A1 (P) | 2.157 | 12-25-34 | 3,535,461 | 3,518,976 | |
| Series 2007-3, Class M1 (P) | 3.214 | 09-25-37 | 1,024,890 | 559,326 | |
| Series 2007-3, Class M2 (P) | 3.214 | 09-25-37 | 345,193 | 39,566 | |
| Series 2007-3, Class M3 (P) | 3.214 | 09-25-37 | 99,377 | 1,746 | |
| Morgan Stanley Bank of America Merrill | |||||
| Lynch Trust | |||||
| Series 2013-C7, Class C (P) | 4.328 | 02-15-46 | 2,403,000 | 2,282,182 | |
| Morgan Stanley Capital I Trust | |||||
| Series 2006-HQ10, Class AM | 5.360 | 11-12-41 | 3,500,000 | 3,863,927 | |
| Morgan Stanley Mortgage Loan Trust | |||||
| Series 2004-6AR, Class 2A2 (P) | 2.786 | 08-25-34 | 5,157,971 | 5,043,134 | |
| MortgageIT Trust | |||||
| Series 2005-2, Class 1A2 (P) | 0.496 | 05-25-35 | 3,157,345 | 2,929,852 | |
| Motel 6 Trust | |||||
| Series 2012-MTL6, Class D (S) | 3.781 | 10-05-25 | 5,845,000 | 5,836,063 | |
| Residential Accredit Loans, Inc. | |||||
| Series 2005-QO4, Class XIO IO | 2.357 | 12-25-45 | 23,878,238 | 1,025,210 | |
| Springleaf Mortgage Loan Trust | |||||
| Series 2012-3A, Class M1 (P)(S) | 2.660 | 12-25-59 | 1,520,000 | 1,503,883 | |
| See notes to financial statements | Semiannual report | Bond Fund | 25 |
| Maturity | |||||
| Rate (%) | date | Par value^ | Value | ||
| Commercial & Residential (continued) | |||||
| Thornburg Mortgage Securities Trust | |||||
| Series 2004-1, Class II2A (P) | 1.773 | 03-25-44 | 3,185,437 | $3,073,650 | |
| UBS Commercial Mortgage Trust | |||||
| Series 2012-C1, Class B | 4.822 | 05-10-45 | 2,220,000 | 2,318,439 | |
| Series 2012-C1, Class C (P)(S) | 5.720 | 05-10-45 | 1,580,000 | 1,675,100 | |
| UBS-Barclays Commercial Mortgage Trust | |||||
| Series 2012-C2, Class XA IO (S) | 1.955 | 05-10-63 | 27,575,213 | 2,507,883 | |
| VFC 2013-1 LLC | |||||
| Series 2013-1, Class A (S) | 3.130 | 03-20-26 | 2,926,088 | 2,943,747 | |
| Wachovia Bank Commercial Mortgage Trust | |||||
| Series 2007-C31, Class AM (P) | 5.591 | 04-15-47 | 1,810,000 | 1,982,743 | |
| WaMu Mortgage Pass Through Certificates | |||||
| Series 2005-AR13, Class X IO | 1.470 | 10-25-45 | 104,609,255 | 4,306,962 | |
| Series 2005-AR19, Class A1A2 (P) | 0.456 | 12-25-45 | 4,622,275 | 4,129,153 | |
| Series 2005-AR2, Class 2A1B (P) | 0.536 | 01-25-45 | 1,725,184 | 1,551,865 | |
| Series 2005-AR2, Class 2A3 (P) | 0.516 | 01-25-45 | 2,603,777 | 2,346,029 | |
| Series 2005-AR8, Class 2AB2 (P) | 0.586 | 07-25-45 | 4,587,659 | 4,273,202 | |
| Wells Fargo Commercial Mortgage Trust | |||||
| Series 2013-1, Class 20B (P)(S) | 2.800 | 03-18-28 | 6,210,000 | 5,744,796 | |
| Series 2013-BTC, Class E (P)(S) | 3.668 | 04-16-35 | 2,850,000 | 2,198,752 | |
| WF-RBS Commercial Mortgage Trust | |||||
| Series 2012-C9, Class XA IO (S) | 2.418 | 11-15-45 | 30,263,272 | 3,801,581 | |
| Series 2013-C15, Class B (P) | 4.636 | 08-15-46 | 1,072,000 | 1,084,479 | |
| Series 2013-C16, Class B (P) | 5.152 | 09-15-46 | 1,800,000 | 1,894,532 | |
| U.S. Government Agency 3.9% | 70,628,540 | ||||
| Federal Home Loan Mortgage Corp. | |||||
| Series 290, Class IO | 3.500 | 11-15-32 | 11,407,081 | 2,253,016 | |
| Series 3794, Class PI IO | 4.500 | 02-15-38 | 2,237,994 | 251,954 | |
| Series 3908, Class PA | 4.000 | 06-15-39 | 2,462,169 | 2,602,141 | |
| Series 4060, Class HC | 3.000 | 03-15-41 | 5,839,969 | 6,106,704 | |
| Series 4065, Class QA | 3.000 | 08-15-41 | 4,126,544 | 4,251,797 | |
| Series 4068, Class AP | 3.500 | 06-15-40 | 6,305,943 | 6,610,804 | |
| Series 4077, Class IK IO | 5.000 | 07-15-42 | 5,140,850 | 1,191,446 | |
| Series 4136, Class IH IO | 3.500 | 09-15-27 | 16,812,951 | 2,436,842 | |
| Series K017, Class X1 IO | 1.595 | 12-25-21 | 14,840,532 | 1,314,396 | |
| Series K018, Class X1 IO | 1.602 | 01-25-22 | 19,814,825 | 1,769,702 | |
| Series K021, Class X1 IO | 1.645 | 06-25-22 | 4,686,820 | 469,896 | |
| Series K022, Class X1 IO | 1.431 | 07-25-22 | 36,518,813 | 3,140,545 | |
| Series K708, Class X1 IO | 1.642 | 01-25-19 | 30,678,305 | 2,065,049 | |
| Series K709, Class X1 IO | 1.675 | 03-25-19 | 17,320,500 | 1,207,083 | |
| Series K710, Class X1 IO | 1.913 | 05-25-19 | 14,041,303 | 1,153,142 | |
| Series K711, Class X1 IO | 1.832 | 07-25-19 | 49,818,676 | 3,996,703 | |
| Federal National Mortgage Association | |||||
| Series 2009-50, Class GI IO | 5.000 | 05-25-39 | 2,539,463 | 409,753 | |
| Series 2009-78, Class IB IO | 5.000 | 06-25-39 | 3,285,532 | 411,104 | |
| Series 2012-118, Class IB IO | 3.500 | 11-25-42 | 8,274,239 | 1,896,050 | |
| Series 2012-137, Class QI IO | 3.000 | 12-25-27 | 17,089,405 | 2,536,787 | |
| Series 2012-137, Class WI IO | 3.500 | 12-25-32 | 12,208,047 | 2,542,312 | |
| Series 2012-19, Class JA | 3.500 | 03-25-41 | 8,056,175 | 8,392,126 | |
| Series 2012-67, Class KG | 3.500 | 02-25-41 | 1,925,418 | 2,001,635 | |
| Series 402, Class 3 IO | 4.000 | 11-25-39 | 1,840,752 | 359,792 | |
| Series 402, Class 4 IO | 4.000 | 10-25-39 | 2,893,807 | 512,063 | |
| Series 402, Class 7 IO | 4.500 | 11-25-39 | 2,835,756 | 528,817 | |
| Series 407, Class 15 IO | 5.000 | 01-25-40 | 3,287,801 | 571,894 | |
| Series 407, Class 21 IO | 5.000 | 01-25-39 | 1,742,882 | 321,159 | |
| Series 407, Class 7 IO | 5.000 | 03-25-41 | 2,647,507 | 525,046 | |
| 26 | Bond Fund | Semiannual report | See notes to financial statements |
| Maturity | |||||
| Rate (%) | date | Par value^ | Value | ||
| U.S. Government Agency (continued) | |||||
| Federal National Mortgage Association | |||||
| Series 407, Class 8 IO | 5.000 | 03-25-41 | 1,313,811 | $244,222 | |
| Series 407, Class C6 IO | 5.500 | 01-25-40 | 6,693,963 | 1,265,561 | |
| Government National Mortgage Association | |||||
| Series 2012-114, Class IO | 1.031 | 01-16-53 | 11,446,748 | 1,070,981 | |
| Series 2013-42, Class IA IO | 3.500 | 03-20-43 | 16,812,906 | 2,710,585 | |
| Series 2013-42, Class YI IO | 3.500 | 03-20-43 | 21,924,964 | 3,507,433 | |
| Asset Backed Securities 5.9% | $106,251,433 | ||||
| (Cost $102,863,630) | |||||
| ACE Securities Corp. | |||||
| Series 2006-ASP5, Class A2B (P) | 0.296 | 10-25-36 | 1,928,681 | 902,844 | |
| Series 2006-ASP5, Class A2C (P) | 0.346 | 10-25-36 | 1,618,621 | 759,604 | |
| Series 2006-ASP5, Class A2D (P) | 0.426 | 10-25-36 | 3,104,968 | 1,472,705 | |
| ACE Securities Corp. Home Equity Loan Trust | |||||
| Series 2005-HE3, Class M2 (P) | 0.616 | 05-25-35 | 2,419,980 | 2,282,218 | |
| Aegis Asset Backed Securities Trust | |||||
| Series 2004-3, Class A1 (P) | 0.886 | 09-25-34 | 1,636,296 | 1,602,498 | |
| Series 2005-4, Class M1 (P) | 0.616 | 10-25-35 | 4,810,000 | 3,978,062 | |
| Ameriquest Mortgage Securities, Inc. | |||||
| Series 2005-R3, Class M2 (P) | 0.636 | 05-25-35 | 2,840,000 | 2,583,704 | |
| Argent Securities, Inc. | |||||
| Series 2003-W10, Class M1 (P) | 1.246 | 01-25-34 | 1,648,594 | 1,580,949 | |
| Series 2004-W6, Class M1 (P) | 0.716 | 05-25-34 | 1,878,086 | 1,832,122 | |
| Series 2006-M2, Class A2C (P) | 0.316 | 09-25-36 | 8,450,585 | 3,371,775 | |
| Asset Backed Funding Certificates | |||||
| Series 2005-HE1, Class M1 (P) | 0.586 | 03-25-35 | 2,630,560 | 2,494,618 | |
| Bravo Mortgage Asset Trust | |||||
| Series 2006-1A, Class A2 (P)(S) | 0.406 | 07-25-36 | 3,889,336 | 3,558,991 | |
| Citicorp Residential Mortgage Securities, Inc. | |||||
| Series 2007-2, Class A6 (P) | 5.923 | 06-25-37 | 1,817,743 | 1,834,226 | |
| CKE Restaurant Holdings, Inc. | |||||
| Series 2013-1A, Class A2 (S) | 4.474 | 03-20-43 | 7,121,188 | 7,241,877 | |
| ContiMortgage Home Equity Loan Trust | |||||
| Series 1995-2, Class A5 | 8.100 | 08-15-25 | 135,770 | 133,935 | |
| Countrywide Asset-Backed Certificates | |||||
| Series 2004-10, Class AF5B (P) | 5.110 | 02-25-35 | 3,010,955 | 3,150,772 | |
| Credit-Based Asset Servicing and | |||||
| Securitization LLC | |||||
| Series 2005-CB2, Class M1 (P) | 0.826 | 04-25-36 | 2,944,159 | 2,844,128 | |
| CSMC Trust | |||||
| Series 2006-CF2, Class M1 (P)(S) | 0.636 | 05-25-36 | 3,245,000 | 3,126,214 | |
| Dominos Pizza Master Issuer LLC | |||||
| Series 2012-1A, Class A2 (S) | 5.216 | 01-25-42 | 6,227,131 | 6,742,850 | |
| Encore Credit Receivables Trust | |||||
| Series 2005-2, Class M2 (P) | 0.626 | 11-25-35 | 3,350,000 | 3,074,195 | |
| Fremont Home Loan Trust | |||||
| Series 2005-1, Class M3 (P) | 0.931 | 06-25-35 | 2,500,000 | 2,387,873 | |
| GSAA Home Equity Trust | |||||
| Series 2005-11, Class 3A1 (P) | 0.436 | 10-25-35 | 4,922,114 | 4,558,788 | |
| GSAA Trust | |||||
| Series 2005-10, Class M3 (P) | 0.716 | 06-25-35 | 4,265,000 | 3,992,270 | |
| GSAMP Trust | |||||
| Series 2006-NC1, Class A2 (P) | 0.346 | 02-25-36 | 2,175,758 | 2,037,064 | |
| See notes to financial statements | Semiannual report | Bond Fund | 27 |
| Maturity | |||||
| Rate (%) | date | Par value^ | Value | ||
| Home Equity Asset Trust | |||||
| Series 2005-6, Class M1 (P) | 0.636 | 12-25-35 | 1,810,000 | $1,755,952 | |
| Home Equity Mortgage Loan | |||||
| Asset-Backed Trust | |||||
| Series 2005-C, Class AII3 (P) | 0.536 | 10-25-35 | 3,212,500 | 3,014,960 | |
| MASTR Asset Backed Securities Trust | |||||
| Series 2007-HE2, Class A2 (P) | 0.866 | 08-25-37 | 947,638 | 930,966 | |
| Merrill Lynch Mortgage Investors, Inc. | |||||
| Series 2005-WMC1, Class M1 (P) | 0.916 | 09-25-35 | 2,074,762 | 1,922,669 | |
| Morgan Stanley ABS Capital I | |||||
| Series 2006-HE4, Class A3 (P) | 0.316 | 06-25-36 | 2,543,689 | 1,661,293 | |
| New Century Home Equity Loan Trust | |||||
| Series 2005-1, Class M1 (P) | 0.616 | 03-25-35 | 3,195,000 | 3,056,749 | |
| RAMP Trust | |||||
| Series 2005-RS3, Class M1 (P) | 0.586 | 03-25-35 | 2,355,000 | 2,197,312 | |
| Renaissance Home Equity Loan Trust | |||||
| Series 2005-2, Class AF4 (P) | 4.934 | 08-25-35 | 2,680,000 | 2,587,494 | |
| Sonic Capital LLC | |||||
| Series 2011-1A, Class A2 (S) | 5.438 | 05-20-41 | 2,632,010 | 2,823,988 | |
| Soundview Home Loan Trust | |||||
| Series 2006-OPT2, Class A3 (P) | 0.346 | 05-25-36 | 1,346,888 | 1,234,970 | |
| Specialty Underwriting & Residential | |||||
| Finance Trust | |||||
| Series 2006-BC1, Class A2D (P) | 0.466 | 12-25-36 | 6,930,000 | 6,500,354 | |
| Westgate Resorts LLC | |||||
| Series 2012-2A, Class A (S) | 3.000 | 01-20-25 | 2,511,547 | 2,527,244 | |
| Series 2012-2A, Class B (S) | 4.500 | 01-20-25 | 4,529,116 | 4,531,969 | |
| Series 2012-3A, Class A (S) | 2.500 | 03-20-25 | 1,965,622 | 1,965,386 | |
| Series 2012-3A, Class B (S) | 4.500 | 03-20-25 | 580,131 | 580,404 | |
| Series 2013-1A, Class B (S) | 3.750 | 08-20-25 | 1,431,546 | 1,415,441 | |
| Shares | Value | ||||
| Preferred Securities 1.2% | $22,036,291 | ||||
| (Cost $21,476,274) | |||||
| Consumer Staples 0.1% | 2,043,094 | ||||
| Food & Staples Retailing 0.1% | |||||
| Ocean Spray Cranberries, Inc., Series A, | |||||
| 6.250% (S) | 23,250 | 2,043,094 | |||
| Financials 0.9% | 16,218,721 | ||||
| Capital Markets 0.1% | |||||
| The Goldman Sachs Group, Inc., 5.500% | 85,725 | 1,947,672 | |||
| Commercial Banks 0.6% | |||||
| FNB Corp., 7.250% | 61,350 | 1,602,769 | |||
| PNC Financial Services Group, Inc. (6.125% to | |||||
| 5-1-22, then 3 month LIBOR + 4.067%) | 106,775 | 2,731,305 | |||
| Regions Financial Corp., 6.375% | 102,790 | 2,289,133 | |||
| U.S. Bancorp (6.000% to 4-15-17, then | |||||
| 3 month LIBOR + 4.861%) | 85,150 | 2,328,001 | |||
| Wells Fargo & Company, Series L, 7.500% | 1,342 | 1,511,428 | |||
| Consumer Finance 0.1% | |||||
| Discover Financial Services, 6.500% | 60,000 | 1,399,800 | |||
| 28 | Bond Fund | Semiannual report | See notes to financial statements |
| Shares | Value | ||||
| Diversified Financial Services 0.1% | |||||
| GMAC Capital Trust I (8.125% to 2-15-16, | |||||
| then 3 month LIBOR + 5.785%) | 65,230 | $1,750,773 | |||
| Real Estate Investment Trusts 0.0% | |||||
| Weyerhaeuser Company, 6.375% | 12,000 | 657,840 | |||
| Industrials 0.2% | 3,348,761 | ||||
| Aerospace & Defense 0.1% | |||||
| United Technologies Corp., 7.500% | 31,265 | 2,043,480 | |||
| Airlines 0.1% | |||||
| Continental Airlines Finance Trust II, 6.000% | 27,300 | 1,305,281 | |||
| Materials 0.0% | 425,715 | ||||
| Metals & Mining 0.0% | |||||
| ArcelorMittal, 6.000% | 16,860 | 425,715 | |||
| Par value | Value | ||||
| Short-Term Investments 1.3% | $24,377,000 | ||||
| (Cost $24,377,000) | |||||
| Repurchase Agreement 1.3% | 24,377,000 | ||||
| Barclays Tri-Party Repurchase Agreement dated 11-29-13 at 0.070% | |||||
| to be repurchased at $24,377,142 on 12-2-13, collateralized by | |||||
| $25,235,800 U.S. Treasury Note, 0.750% due 3-31-18 (valued at | |||||
| $24,864,739, including interest) | 24,377,000 | 24,377,000 | |||
| Total investments (Cost $1,745,699,820)† 98.8% | $1,778,031,671 | ||||
| Other assets and liabilities, net 1.2% | $21,242,413 | ||||
| Total net assets 100.0% | $1,799,274,084 | ||||
The percentage shown for each investment category is the total value of that category as a percentage of the net assets applicable of the fund.
^ All par values are denominated in U.S. Dollars unless otherwise indicated.
BRL Brazilian Real
IO Interest-Only Security — (Interest Tranche of Stripped Mortgage Pool). Rate shown is the annualized yield at the end of the period.
LIBOR London Interbank Offered Rate
PIK Paid-in-kind
TBD To Be Determined
USGG U.S. Generic Government Yield Index
(M) Term loans are variable rate obligations. The coupon rate shown represents the rate at period end.
(P) Variable rate obligation. The coupon rate shown represents the rate at period end.
(Q) Perpetual bonds have no stated maturity date. Date shown as maturity date is next call date.
(S) These securities are exempt from registration under Rule 144A of the Securities Act of 1933. Such securities may be resold, normally to qualified institutional buyers, in transactions exempt from registration. Rule 144A securities amounted to $462,811,861 or 25.7% of the fund’s net assets as of 11-30-13.
(T) This position represents an unsettled loan commitment at period end. Certain details associated with this purchase are not known prior to the settlement date, including coupon rate.
† At 11-30-13, the aggregate cost of investment securities for federal income tax purposes was $1,750,943,670. Net unrealized appreciation aggregated $27,088,001, of which $57,498,681 related to appreciated investment securities and $30,410,680 related to depreciated investment securities.
| See notes to financial statements | Semiannual report | Bond Fund | 29 |
F I N A N C I A L S T A T E M E N T S
Statement of assets and liabilities 11-30-13 (unaudited)
This Statement of assets and liabilities is the fund’s balance sheet. It shows the value of what the fund owns, is due and owes. You’ll also find the net asset value and the maximum offering price per share.
| Assets | |
| Investments, at value (Cost $1,745,699,820) | $1,778,031,671 |
| Cash | 10,051,804 |
| Cash held at broker for futures contracts | 2,174,577 |
| Receivable for investments sold | 6,580,454 |
| Receivable for fund shares sold | 5,788,379 |
| Dividends and interest receivable | 18,765,649 |
| Receivable for futures variation margin | 47,375 |
| Other receivables and prepaid expenses | 172,690 |
| Total assets | 1,821,612,599 |
| Liabilities | |
| Payable for investments purchased | 17,247,960 |
| Payable for fund shares repurchased | 3,994,942 |
| Distributions payable | 565,301 |
| Payable to affiliates | |
| Accounting and legal services fees | 34,843 |
| Transfer agent fees | 193,162 |
| Distribution and service fees | 131,292 |
| Trustees’ fees | 56,633 |
| Other liabilities and accrued expenses | 114,382 |
| Total liabilities | 22,338,515 |
| Net assets | $1,799,274,084 |
| Net assets consist of | |
| Paid-in capital | $1,773,258,548 |
| Accumulated distributions in excess of net investment income | (440,677) |
| Accumulated net realized gain (loss) on investments, futures contracts and | |
| foreign currency transactions | (6,157,308) |
| Net unrealized appreciation (depreciation) on investments, futures | |
| contracts and translation of assets and liabilities in foreign currencies | 32,613,521 |
| Net assets | $1,799,274,084 |
| 30 | Bond Fund | Semiannual report | See notes to financial statements |
F I N A N C I A L S T A T E M E N T S
Statement of assets and liabilities (continued)
| Net asset value per share | |
| Based on net asset values and shares outstanding — the fund has an | |
| unlimited number of shares authorized with no par value | |
| Class A ($1,333,217,388 ÷ 83,777,734 shares)1 | $15.91 |
| Class B ($35,034,521 ÷ 2,201,712 shares)1 | $15.91 |
| Class C ($157,632,042 ÷ 9,904,737 shares)1 | $15.91 |
| Class I ($228,513,847 ÷ 14,357,971 shares) | $15.92 |
| Class R2 ($4,969,918 ÷ 312,163 shares) | $15.92 |
| Class R6 ($39,906,368 ÷ 2,505,141 shares) | $15.93 |
| Maximum offering price per share | |
| Class A (net asset value per share ÷ 95.5%)2 | $16.66 |
1 Redemption price per share is equal to the net asset value less any applicable contingent deferred sales charge.
2 On single retail sales of less than $100,000. On sales of $100,000 or more and on group sales the offering price is reduced.
| See notes to financial statements | Semiannual report | Bond Fund | 31 |
F I N A N C I A L S T A T E M E N T S
Statement of operations For the six-month period ended 11-30-13 (unaudited)
This Statement of operations summarizes the fund’s investment income earned and expenses incurred in operating the fund. It also shows net gains (losses) for the period stated.
| Investment income | |
| Interest | $42,525,155 |
| Dividends | 738,648 |
| Total investment income | 43,263,803 |
| Expenses | |
| Investment management fees | 4,313,177 |
| Distribution and service fees | 3,100,226 |
| Accounting and legal services fees | 187,004 |
| Transfer agent fees | 1,296,341 |
| Trustees’ fees | 40,836 |
| State registration fees | 96,315 |
| Printing and postage | 77,226 |
| Professional fees | 67,627 |
| Custodian fees | 96,436 |
| Registration and filing fees | 32,014 |
| Other | 28,334 |
| Total expenses | 9,335,536 |
| Less expense reductions | (509,570) |
| Net expenses | 8,825,966 |
| Net investment income | 34,437,837 |
| Realized and unrealized gain (loss) | |
| Net realized gain (loss) on | |
| Investments | (7,316,368) |
| Futures contracts | (2,694,743) |
| Foreign currency transactions | (18,361) |
| (10,029,472) | |
| Change in net unrealized appreciation (depreciation) of | |
| Investments | (41,123,485) |
| Futures contracts | 768,636 |
| Translation of assets and liabilities in foreign currencies | 4,953 |
| (40,349,896) | |
| Net realized and unrealized loss | (50,379,368) |
| Decrease in net assets from operations | ($15,941,531) |
| 32 | Bond Fund | Semiannual report | See notes to financial statements |
F I N A N C I A L S T A T E M E N T S
Statements of changes in net assets
These Statements of changes in net assets show how the value of the fund’s net assets has changed during the last two periods. The difference reflects earnings less expenses, any investment gains and losses, distributions, if any, paid to shareholders and the net of fund share transactions.
| Six months | ||
| ended | Year | |
| 11-30-13 | ended | |
| (Unaudited) | 5-31-13 | |
| Increase (decrease) in net assets | ||
| From operations | ||
| Net investment income | $34,437,837 | $63,004,435 |
| Net realized gain (loss) | (10,029,472) | 19,349,371 |
| Change in net unrealized appreciation (depreciation) | (40,349,896) | 33,911,782 |
| Increase (decrease) in net assets resulting from operations | (15,941,531) | 116,265,588 |
| Distributions to shareholders | ||
| From net investment income | ||
| Class A | (28,838,751) | (53,420,052) |
| Class B | (688,025) | (1,524,202) |
| Class C | (3,066,223) | (5,484,474) |
| Class I | (5,238,304) | (9,174,395) |
| Class R2 | (78,132) | (22,100) |
| Class R6 | (771,046) | (110,196) |
| From net realized gain | ||
| Class A | — | (2,677,938) |
| Class B | — | (92,529) |
| Class C | — | (331,835) |
| Class I | — | (432,679) |
| Class R2 | — | (228) |
| Class R6 | — | (5,437) |
| Total distributions | (38,680,481) | (73,276,065) |
| From fund share transactions | (100,080,037) | 572,779,681 |
| Total increase (decrease) | (154,702,049) | 615,769,204 |
| Net assets | ||
| Beginning of period | 1,953,976,133 | 1,338,206,929 |
| End of period | $1,799,274,084 | $1,953,976,133 |
| Undistributed (accumulated distributions in excess of) net | ||
| investment income | ($440,677) | $3,801,967 |
| See notes to financial statements | Semiannual report | Bond Fund | 33 |
Financial highlights
The Financial highlights show how the fund’s net asset value for a share has changed during the period.
| CLASS A SHARES Period ended | 11-30-131 | 5-31-13 | 5-31-12 | 5-31-11 | 5-31-10 | 5-31-09 |
| Per share operating performance | ||||||
| Net asset value, beginning of period | $16.37 | $15.86 | $15.86 | $15.00 | $12.96 | $14.31 |
| Net investment income2 | 0.30 | 0.63 | 0.72 | 0.81 | 0.97 | 0.87 |
| Net realized and unrealized gain (loss) | ||||||
| on investments | (0.42) | 0.61 | 0.08 | 0.92 | 2.05 | (1.34) |
| Total from investment operations | (0.12) | 1.24 | 0.80 | 1.73 | 3.02 | (0.47) |
| Less distributions | ||||||
| From net investment income | (0.34) | (0.70) | (0.79) | (0.87) | (0.98) | (0.88) |
| From net realized gain | — | (0.03) | (0.01) | — | — | — |
| Total distributions | (0.34) | (0.73) | (0.80) | (0.87) | (0.98) | (0.88) |
| Net asset value, end of period | $15.91 | $16.37 | $15.86 | $15.86 | $15.00 | $12.96 |
| Total return (%)3,4 | (0.71)5 | 7.93 | 5.21 | 11.78 | 23.83 | (3.02) |
| Ratios and supplemental data | ||||||
| Net assets, end of period (in millions) | $1,333 | $1,434 | $1,061 | $912 | $819 | $686 |
| Ratios (as a percentage of average net assets): | ||||||
| Expenses before reductions | 0.996 | 1.03 | 1.06 | 1.05 | 1.08 | 1.167 |
| Expenses net of fee waivers and credits | 0.936 | 0.98 | 1.02 | 1.05 | 1.07 | 1.167 |
| Net investment income | 3.796 | 3.84 | 4.63 | 5.24 | 6.71 | 6.71 |
| Portfolio turnover (%) | 42 | 72 | 76 | 73 | 88 | 90 |
1 Six months ended 11-30-13. Unaudited.
2 Based on the average daily shares outstanding.
3 Does not reflect the effect of sales charges, if any.
4 Total returns would have been lower had certain expenses not been reduced during the applicable periods.
5 Not annualized.
6 Annualized.
7 Includes the impact of proxy expenses, which amounted to 0.03% of average net assets.
| 34 | Bond Fund | Semiannual report | See notes to financial statements |
| CLASS B SHARES Period ended | 11-30-131 | 5-31-13 | 5-31-12 | 5-31-11 | 5-31-10 | 5-31-09 |
| Per share operating performance | ||||||
| Net asset value, beginning of period | $16.37 | $15.86 | $15.86 | $15.00 | $12.95 | $14.31 |
| Net investment income2 | 0.25 | 0.51 | 0.61 | 0.70 | 0.86 | 0.77 |
| Net realized and unrealized gain (loss) | ||||||
| on investments | (0.43) | 0.61 | 0.08 | 0.92 | 2.07 | (1.34) |
| Total from investment operations | (0.18) | 1.12 | 0.69 | 1.62 | 2.93 | (0.57) |
| Less distributions | ||||||
| From net investment income | (0.28) | (0.58) | (0.68) | (0.76) | (0.88) | (0.79) |
| From net realized gain | — | (0.03) | (0.01) | — | — | — |
| Total distributions | (0.28) | (0.61) | (0.69) | (0.76) | (0.88) | (0.79) |
| Net asset value, end of period | $15.91 | $16.37 | $15.86 | $15.86 | $15.00 | $12.95 |
| Total return (%)3,4 | (1.06)5 | 7.18 | 4.48 | 11.00 | 23.05 | (3.77) |
| Ratios and supplemental data | ||||||
| Net assets, end of period (in millions) | $35 | $44 | $37 | $28 | $25 | $28 |
| Ratios (as a percentage of average net assets): | ||||||
| Expenses before reductions | 1.696 | 1.73 | 1.76 | 1.75 | 1.78 | 1.867 |
| Expenses net of fee waivers and credits | 1.636 | 1.68 | 1.72 | 1.75 | 1.77 | 1.867 |
| Net investment income | 3.096 | 3.15 | 3.92 | 4.53 | 6.01 | 5.96 |
| Portfolio turnover (%) | 42 | 72 | 76 | 73 | 88 | 90 |
1 Six months ended 11-30-13. Unaudited.
2 Based on the average daily shares outstanding.
3 Does not reflect the effect of sales charges, if any.
4 Total returns would have been lower had certain expenses not been reduced during the applicable periods.
5 Not annualized.
6 Annualized.
7 Includes the impact of proxy expenses, which amounted to 0.03% of average net assets.
| CLASS C SHARES Period ended | 11-30-131 | 5-31-13 | 5-31-12 | 5-31-11 | 5-31-10 | 5-31-09 |
| Per share operating performance | ||||||
| Net asset value, beginning of period | $16.37 | $15.87 | $15.86 | $15.00 | $12.96 | $14.31 |
| Net investment income2 | 0.25 | 0.51 | 0.61 | 0.70 | 0.86 | 0.78 |
| Net realized and unrealized gain (loss) | ||||||
| on investments | (0.43) | 0.60 | 0.09 | 0.92 | 2.06 | (1.34) |
| Total from investment operations | (0.18) | 1.11 | 0.70 | 1.62 | 2.92 | (0.56) |
| Less distributions | ||||||
| From net investment income | (0.28) | (0.58) | (0.68) | (0.76) | (0.88) | (0.79) |
| From net realized gain | — | (0.03) | (0.01) | — | — | — |
| Total distributions | (0.28) | (0.61) | (0.69) | (0.76) | (0.88) | (0.79) |
| Net asset value, end of period | $15.91 | $16.37 | $15.87 | $15.86 | $15.00 | $12.96 |
| Total return (%)3,4 | (1.06)5 | 7.11 | 4.55 | 11.00 | 22.98 | (3.70) |
| Ratios and supplemental data | ||||||
| Net assets, end of period (in millions) | $158 | $195 | $116 | $71 | $40 | $26 |
| Ratios (as a percentage of average net assets): | ||||||
| Expenses before reductions | 1.696 | 1.72 | 1.77 | 1.75 | 1.78 | 1.867 |
| Expenses net of fee waivers and credits | 1.636 | 1.67 | 1.72 | 1.75 | 1.77 | 1.867 |
| Net investment income | 3.086 | 3.12 | 3.91 | 4.50 | 5.98 | 6.02 |
| Portfolio turnover (%) | 42 | 72 | 76 | 73 | 88 | 90 |
1 Six months ended 11-30-13. Unaudited.
2 Based on the average daily shares outstanding.
3 Does not reflect the effect of sales charges, if any.
4 Total returns would have been lower had certain expenses not been reduced during the applicable periods.
5 Not annualized.
6 Annualized.
7 Includes the impact of proxy expenses, which amounted to 0.03% of average net assets.
| See notes to financial statements | Semiannual report | Bond Fund | 35 |
| CLASS I SHARES Period ended | 11-30-131 | 5-31-13 | 5-31-12 | 5-31-11 | 5-31-10 | 5-31-09 |
| Per share operating performance | ||||||
| Net asset value, beginning of period | $16.37 | $15.87 | $15.86 | $14.99 | $12.96 | $14.31 |
| Net investment income2 | 0.33 | 0.68 | 0.78 | 0.88 | 1.03 | 0.93 |
| Net realized and unrealized gain (loss) | ||||||
| on investments | (0.41) | 0.61 | 0.09 | 0.92 | 2.05 | (1.35) |
| Total from investment operations | (0.08) | 1.29 | 0.87 | 1.80 | 3.08 | (0.42) |
| Less distributions | ||||||
| From net investment income | (0.37) | (0.76) | (0.85) | (0.93) | (1.05) | (0.93) |
| From net realized gain | — | (0.03) | (0.01) | — | — | — |
| Total distributions | (0.37) | (0.79) | (0.86) | (0.93) | (1.05) | (0.93) |
| Net asset value, end of period | $15.92 | $16.37 | $15.87 | $15.86 | $14.99 | $12.96 |
| Total return (%)3 | (0.49)4 | 8.27 | 5.70 | 12.33 | 24.31 | (2.60) |
| Ratios and supplemental data | ||||||
| Net assets, end of period (in millions) | $229 | $277 | $123 | $74 | $30 | $19 |
| Ratios (as a percentage of average net assets): | ||||||
| Expenses before reductions | 0.655 | 0.65 | 0.67 | 0.62 | 0.63 | 0.706 |
| Expenses net of fee waivers and credits | 0.605 | 0.60 | 0.62 | 0.62 | 0.63 | 0.706 |
| Net investment income | 4.105 | 4.19 | 4.99 | 5.64 | 7.13 | 7.22 |
| Portfolio turnover (%) | 42 | 72 | 76 | 73 | 88 | 90 |
1 Six months ended 11-30-13. Unaudited.
2 Based on the average daily shares outstanding.
3 Total returns would have been lower had certain expenses not been reduced during the applicable periods.
4 Not annualized.
5 Annualized.
6 Includes the impact of proxy expenses, which amounted to 0.03% of average net assets.
| CLASS R2 SHARES Period ended | 11-30-131 | 5-31-13 | 5-31-122 | ||||||
| Per share operating performance | |||||||||
| Net asset value, beginning of period | $16.38 | $15.87 | $15.80 | ||||||
| Net investment income3 | 0.30 | 0.62 | 0.17 | ||||||
| Net realized and unrealized gain (loss) on investments | (0.42) | 0.64 | 0.09 | ||||||
| Total from investment operations | (0.12) | 1.26 | 0.26 | ||||||
| Less distributions | |||||||||
| From net investment income | (0.34) | (0.72) | (0.19) | ||||||
| From net realized gain | — | (0.03) | — | ||||||
| Total distributions | (0.34) | (0.75) | (0.19) | ||||||
| Net asset value, end of period | $15.92 | $16.38 | $15.87 | ||||||
| Total return (%)4 | (0.69)5 | 8.09 | 1.685 | ||||||
| Ratios and supplemental data | |||||||||
| Net assets, end of period (in millions) | $5 | $2 | —6 | ||||||
| Ratios (as a percentage of average net assets): | |||||||||
| Expenses before reductions | 1.047 | 1.03 | 0.867 | ||||||
| Expenses net of fee waivers | 0.987 | 0.98 | 0.807 | ||||||
| Net investment income | 3.817 | 3.88 | 4.287 | ||||||
| Portfolio turnover (%) | 42 | 72 | 768 | ||||||
1 Six months ended 11-30-13. Unaudited.
2 The inception date for Class R2 shares is 3-1-12.
3 Based on the average daily shares outstanding.
4 Total returns would have been lower had certain expenses not been reduced during the applicable periods.
5 Not annualized.
6 Less than $500,000.
7 Annualized.
8 Portfolio turnover is shown for the period from 6-1-11 to 5-31-12.
| 36 | Bond Fund | Semiannual report | See notes to financial statements |
| CLASS R6 SHARES Period ended | 11-30-131 | 5-31-13 | 5-31-122 | |||
| Per share operating performance | ||||||
| Net asset value, beginning of period | $16.38 | $15.87 | $15.55 | |||
| Net investment income3 | 0.34 | 0.70 | 0.57 | |||
| Net realized and unrealized gain (loss) on investments | (0.42) | 0.61 | 0.40 | |||
| Total from investment operations | (0.08) | 1.31 | 0.97 | |||
| Less distributions | ||||||
| From net investment income | (0.37) | (0.77) | (0.64) | |||
| From net realized gain | — | (0.03) | (0.01) | |||
| Total distributions | (0.37) | (0.80) | (0.65) | |||
| Net asset value, end of period | $15.93 | $16.38 | $15.87 | |||
| Total return (%)4 | (0.43)5 | 8.42 | 6.385 | |||
| Ratios and supplemental data | ||||||
| Net assets, end of period (in millions) | $40 | $3 | $2 | |||
| Ratios (as a percentage of average net assets): | ||||||
| Expenses before reductions | 0.576 | 0.57 | 0.636 | |||
| Expenses net of fee waivers | 0.516 | 0.52 | 0.576 | |||
| Net investment income | 4.266 | 4.30 | 5.046 | |||
| Portfolio turnover (%) | 42 | 72 | 767 | |||
1 Six months ended 11-30-13. Unaudited.
2 The inception date for Class R6 shares is 9-1-11.
3 Based on the average daily shares outstanding.
4 Total returns would have been lower had certain expenses not been reduced during the applicable periods.
5 Not annualized.
6 Annualized.
7 Portfolio turnover is shown for the period from 6-1-11 to 5-31-12.
| See notes to financial statements | Semiannual report | Bond Fund | 37 |
Notes to financial statements
(unaudited)
Note 1 — Organization
John Hancock Bond Fund (the fund) is a series of John Hancock Sovereign Bond Fund (the Trust), an open-end management investment company organized as a Massachusetts business trust and registered under the Investment Company Act of 1940, as amended (the 1940 Act). The investment objective of the fund is to seek a high level of current income consistent with prudent investment risk.
The fund may offer multiple classes of shares. The shares currently offered are detailed in the Statement of assets and liabilities. Class A and Class C shares are offered to all investors. Class B shares are closed to new investors. Class I shares are offered to institutions and certain investors. Class R2 shares are available only to certain retirement plans. Class R6 shares are available only to certain retirement plans, institutions and other investors. Shareholders of each class have exclusive voting rights to matters that affect that class. The distribution and service fees, if any, and transfer agent fees for each class may differ. Class B shares convert to Class A shares eight years after purchase.
Note 2 — Significant accounting policies
The financial statements have been prepared in conformity with accounting principles generally accepted in the United States of America, which require management to make certain estimates and assumptions as of the date of the financial statements. Actual results could differ from those estimates and those differences could be significant. Events or transactions occurring after the end of the fiscal period through the date that the financial statements were issued have been evaluated in the preparation of the financial statements. The following summarizes the significant accounting policies of the fund:
Security valuation. Investments are stated at value as of the close of regular trading on the New York Stock Exchange (NYSE), normally at 4:00 P.M., Eastern Time. In order to value the securities, the fund uses the following valuation techniques: Equity securities held by the fund are valued at the last sale price or official closing price on the principal securities exchange on which they trade. In the event there were no sales during the day or closing prices are not available, the securities are valued using the last quoted bid or evaluated price. Debt obligations are valued based on the evaluated prices provided by an independent pricing service, which utilizes both dealer-supplied and electronic data processing techniques, taking into account factors such as institutional-size trading in similar groups of securities, yield, quality, coupon rate, maturity, type of issue, trading characteristics and other market data. Futures contracts are valued at the quoted daily settlement prices established by the exchange on which they trade. Foreign securities and currencies are valued in U.S. dollars, based on foreign currency exchange rates supplied by an independent pricing service. Certain securities traded only in the over-the-counter (OTC) market are valued at the last bid price quoted by brokers making markets in the securities at the close of trading. Certain short-term securities with maturities of 60 days or less at the time of purchase are valued at amortized cost. Other portfolio securities and assets, for which reliable market quotations are not readily available, are valued at fair value as determined in good faith by the fund’s Pricing Committee following procedures established by the Board of Trustees. The frequency with which these fair valuation procedures are used cannot be predicted and fair value of securities may differ significantly from the value that would have been used had a ready market for such securities existed.
| 38 | Bond Fund | Semiannual report |
The fund uses a three-tier hierarchy to prioritize the pricing assumptions, referred to as inputs, used in valuation techniques to measure fair value. Level 1 includes securities valued using quoted prices in active markets for identical securities. Level 2 includes securities valued using other significant observable inputs. Observable inputs may include quoted prices for similar securities, interest rates, prepayment speeds and credit risk. Prices for securities valued using these inputs are received from independent pricing vendors and brokers and are based on an evaluation of the inputs described. Level 3 includes securities valued using significant unobservable inputs when market prices are not readily available or reliable, including the fund’s own assumptions in determining the fair value of investments. Factors used in determining value may include market or issuer specific events or trends, changes in interest rates and credit quality. The inputs or methodology used for valuing securities are not necessarily an indication of the risks associated with investing in those securities. Changes in valuation techniques may result in transfers into or out of an assigned level within the disclosure hierarchy.
The following is a summary of the values by input classification of the fund’s investments as of November 30, 2013, by major security category or type:
| LEVEL 3 | ||||
| LEVEL 2 | SIGNIFICANT | |||
| TOTAL MARKET | LEVEL 1 | SIGNIFICANT | UNOBSERVABLE | |
| INVESTMENTS IN SECURITIES | VALUE AT 11-30-13 | QUOTED PRICE | OBSERVABLE INPUTS | INPUTS |
| Corporate Bonds | $881,593,307 | — | $881,435,095 | $158,212 |
| U.S. Government & Agency | ||||
| Obligations | 391,317,020 | — | 391,317,020 | — |
| Foreign Government | ||||
| Obligations | 3,320,000 | — | 3,320,000 | — |
| Convertible Bonds | 1,228,769 | — | 1,228,769 | — |
| Term Loans | 17,632,911 | — | 17,632,911 | — |
| Capital Preferred Securities | 24,892,376 | — | 24,892,376 | — |
| Collateralized Mortgage | ||||
| Obligations | 305,382,564 | — | 303,527,733 | 1,854,831 |
| Asset Backed Securities | 106,251,433 | — | 104,835,992 | 1,415,441 |
| Preferred Securities | 22,036,291 | $17,085,147 | 4,951,144 | — |
| Short-Term Investments | 24,377,000 | — | 24,377,000 | — |
| Total Investments | ||||
| in Securities | $1,778,031,671 | $17,085,147 | $1,757,518,040 | $3,428,484 |
| Other Financial Instruments | ||||
| Futures | $286,324 | $286,324 | — | — |
Repurchase agreements. The fund may enter into repurchase agreements. When the fund enters into a repurchase agreement, it receives collateral that is held in a segregated account by the fund’s custodian. The collateral amount is marked-to-market and monitored on a daily basis to ensure that the collateral held is in an amount not less than the principal amount of the repurchase agreement plus any accrued interest. Collateral for certain tri-party repurchase agreements is held at a third-party custodian bank in a segregated account for the benefit of the fund.
Repurchase agreements are typically governed by the terms and conditions of the Master Repurchase Agreement and/or Global Master Repurchase Agreement (collectively, MRA). Upon an event of default, the non-defaulting party may close out all transactions traded under the MRA and net amounts owed. Absent an event of default, the MRA does not result in an offset of the reported amounts of assets and liabilities in the Statement of assets and liabilities. In the event of a default by the counterparty, realization of the collateral proceeds could be delayed, during which time the collateral value may decline or the counterparty may have insufficient assets to pay back claims resulting from close-out of the transactions. Collateral received by the fund for repurchase agreements is disclosed in the Fund’s investments as part of the caption related to the repurchase agreement.
| Semiannual report | Bond Fund | 39 |
Security transactions and related investment income. Investment security transactions are accounted for on a trade date plus one basis for daily net asset value calculations. However, for financial reporting purposes, investment transactions are reported on trade date. Interest income is accrued as earned. Interest income includes coupon interest and amortization/accretion of premiums/discounts on debt securities. Debt obligations may be placed in a non-accrual status and related interest income may be reduced by stopping current accruals and writing off interest receivable when the collection of all or a portion of interest has become doubtful. Dividend income is recorded on the ex-date, except for dividends of foreign securities where the dividend may not be known until after the ex-date. In those cases, dividend income, net of withholding taxes, is recorded when the fund becomes aware of the dividends. Distributions received on securities that represent a return of capital or capital gain are recorded as a reduction of cost of investments and/or as a realized gain if amounts are estimable. Foreign taxes are provided for based on the fund’s understanding of the tax rules that exist in the foreign markets in which it invests. Gains and losses on securities sold are determined on the basis of identified cost and may include proceeds from litigation.
Stripped securities. Stripped securities are financial instruments structured to separate principal and interest cash flows so that one class receives principal payments from the underlying assets (PO or principal only), while the other class receives the interest cash flows (IO or interest only). Both PO and IO investments represent an interest in the cash flows of an underlying stripped security. If the underlying assets experience greater than anticipated prepayments of principal, the fund may fail to fully recover its initial investment in an IO security. The market value of these securities can be extremely volatile in response to changes in interest rates or prepayments on the underlying securities. In addition, these securities present additional credit risk such that the fund may not receive all or part of its principal or interest payments because the borrower or issuer has defaulted on its obligation.
Line of credit. The fund may borrow from banks for temporary or emergency purposes, including meeting redemption requests that otherwise might require the untimely sale of securities. Pursuant to the fund’s custodian agreement, the custodian may loan money to the fund to make properly authorized payments. The fund is obligated to repay the custodian for any overdraft, including any related costs or expenses. The custodian may have a lien, security interest or security entitlement in any fund property that is not otherwise segregated or pledged, to the maximum extent permitted by law, to the extent of any overdraft.
In addition, the fund and other affiliated funds have entered into an agreement with Citibank N.A. that enables them to potentially participate in a $300 million unsecured committed line of credit. A commitment fee, payable at the end of each calendar quarter, based on the average daily unused portion of the line of credit, is charged to each participating fund on a pro rata basis and is reflected in other expenses on the Statement of operations. Commitment fees for the six months ended November 30, 2013 were $919. For the six months ended November 30, 2013, the fund had no borrowings under the line of credit.
Expenses. Within the John Hancock funds complex, expenses that are directly attributable to an individual fund are allocated to such fund. Expenses that are not readily attributable to a specific fund are allocated among all funds in an equitable manner, taking into consideration, among other things, the nature and type of expense and the fund’s relative net assets. Expense estimates are accrued in the period to which they relate and adjustments are made when actual amounts are known.
Class allocations. Income, common expenses and realized and unrealized gains (losses) are determined at the fund level and allocated daily to each class of shares based on the net assets of the class. Class-specific expenses, such as distribution and service fees, if any, and transfer agent
| 40 | Bond Fund | Semiannual report |
fees, are calculated daily for each class, based on the net asset value of the class and the applicable specific expense rates.
Federal income taxes. The fund intends to continue to qualify as a regulated investment company by complying with the applicable provisions of the Internal Revenue Code and will not be subject to federal income tax on taxable income that is distributed to shareholders. Therefore, no federal income tax provision is required.
As of May 31, 2013, the fund had no uncertain tax positions that would require financial statement recognition, derecognition or disclosure. The fund’s federal tax returns are subject to examination by the Internal Revenue Service for a period of three years.
Distribution of income and gains. Distributions to shareholders from net investment income and net realized gains, if any, are recorded on the ex-date. The fund generally declares dividends daily and pays them monthly. Capital gain distributions, if any, are distributed annually.
Distributions paid by the fund with respect to each class of shares are calculated in the same manner, at the same time and in the same amount, except for the effect of class level expenses that may be applied differently to each class.
Such distributions, on a tax basis, are determined in conformity with income tax regulations, which may differ from accounting principles generally accepted in the United States of America.
Capital accounts within the financial statements are adjusted for permanent book-tax differences. These adjustments have no impact on net assets or the results of operations. Temporary book-tax differences, if any, will reverse in a subsequent period. Book-tax differences are primarily attributable to distributions payable and amortization and accretion on debt securities.
Note 3 — Derivative Instruments
The fund may invest in derivatives in order to meet its investment objectives. Derivatives include a variety of different instruments that may be traded in the over-the-counter market, on a regulated exchange or through a clearing facility. The risks in using derivatives vary depending upon the structure of the instruments, including the use of leverage, optionality, the liquidity or lack of liquidity of the contract, the creditworthiness of the counterparty or clearing organization and the volatility of the position. Some derivatives involve risks that are potentially greater than the risks associated with investing directly in the referenced securities or other referenced underlying instrument. Specifically, the fund is exposed to the risk that the counterparty to an OTC derivatives contract will be unable or unwilling to make timely settlement payments or otherwise honor its obligations. OTC derivatives transactions typically can only be closed out with the other party to the transaction.
Futures are traded or cleared on an exchange or central clearinghouse. Exchange-traded or cleared transactions generally present less counterparty risk to a fund than OTC transactions. The exchange or clearinghouse stands between the fund and the broker to the contract and therefore, credit risk is generally limited to the failure of the exchange or clearinghouse and the clearing member. Securities pledged by the fund for exchange-traded and cleared transactions, if any are identified in the Fund’s investments.
Futures. A futures contract is a contractual agreement to buy or sell a particular currency or financial instrument at a pre-determined price in the future. Risks related to the use of futures contracts include possible illiquidity of the futures markets, contract prices that can be highly volatile and imperfectly correlated to movements in the underlying financial instrument and potential losses in excess of the amounts recognized on the Statement of assets and liabilities. Use
| Semiannual report | Bond Fund | 41 |
of long futures contracts subjects the fund to the risk of loss up to the notional value of the futures contracts. Use of short futures contracts subjects the fund to unlimited risk of loss.
Upon entering into a futures contract, the fund is required to deposit initial margin with the broker in the form of cash or securities. The amount of required margin is generally based on a percentage of the contract value; this amount is the initial margin for the trade. The margin deposit must then be maintained at the established level over the life of the contract. Futures margin receivable/payable is included on the Statement of assets and liabilities. Futures contracts are marked-to-market daily and an appropriate payable or receivable for the change in value (variation margin) and unrealized gain or loss is recorded by the fund. When the contract is closed, the fund records a realized gain or loss equal to the difference between the value of the contract at the time it was opened and the value at the time it was closed.
During the six months ended November 30, 2013, the fund used futures contracts to manage duration of the fund. During the six months ended November 30, 2013, the fund held futures contracts with notional values ranging from $21.0 million to $56.4 million, as measured at each quarter end. The following table summarizes the contracts held at November 30, 2013.
| OPEN | NUMBER OF | EXPIRATION | UNREALIZED | |||
| CONTRACTS | CONTRACTS | POSITION | DATE | NOTIONAL BASIS | NOTIONAL VALUE | APPRECIATION |
| Ultra Long U.S. | 379 | Long | Mar 2014 | $52,442,051 | $52,728,375 | $286,324 |
| Treasury Bond Futures | ||||||
Fair value of derivative instruments by risk category
The table below summarizes the fair value of derivatives held by the fund at November 30, 2013 by risk category:
| FINANCIAL | ASSET | LIABILITY | |||
| STATEMENT OF ASSETS AND | INSTRUMENTS | DERIVATIVES | DERIVATIVES | ||
| RISK | LIABILITIES LOCATION | LOCATION | FAIR VALUE | FAIR VALUE | |
| Interest rate contracts | Receivable/payable | Future* | $286,324 | — | |
| for futures | |||||
* Reflects cumulative appreciation/depreciation of futures as disclosed herein. Only the period end variation margin is separately disclosed on the Statement of assets and liabilities.
Effect of derivative instruments on the Statement of operations
The table below summarizes the net realized gain (loss) included in the net increase (decrease) in net assets from operations, classified by derivative instrument and risk category, for the six months ended November 30, 2013:
| RISK | STATEMENT OF OPERATIONS LOCATION | FUTURES CONTRACTS |
| Interest rate contracts | Net realized gain (loss) | ($2,694,743) |
The table below summarizes the net change in unrealized appreciation (depreciation) included in the net increase (decrease) in net assets from operations, classified by derivative instrument and risk category, for the six months ended November 30, 2013:
| RISK | STATEMENT OF OPERATIONS LOCATION | FUTURES CONTRACTS |
| Interest rate contracts | Change in unrealized appreciation | $768,636 |
| (depreciation) | ||
| 42 | Bond Fund | Semiannual report |
Note 4 — Guarantees and indemnifications
Under the Trust’s organizational documents, its Officers and Trustees are indemnified against certain liabilities arising out of the performance of their duties to the Trust, including the fund. Additionally, in the normal course of business, the fund enters into contracts with service providers that contain general indemnification clauses. The fund’s maximum exposure under these arrangements is unknown, as this would involve future claims that may be made against the fund that have not yet occurred. The risk of material loss from such claims is considered remote.
Note 5 — Fees and transactions with affiliates
John Hancock Advisers, LLC (the Advisor) serves as investment advisor for the fund. John Hancock Funds, LLC (the Distributor), an affiliate of the Advisor; serves as principal underwriter of the fund. The Advisor and the Distributor are indirect, wholly owned subsidiaries of Manulife Financial Corporation (MFC).
Management fee. The fund has an investment management agreement with the Advisor under which the fund pays a daily management fee to the Advisor equivalent, on an annual basis, to the sum of: (a) 0.500% of the first $500,000,000 of the fund’s average daily net assets, (b) 0.475% of the next $500,000,000 of the fund’s average daily net assets, (c) 0.450% of the next $500,000,000 of the fund’s average daily net assets, (d) 0.450% of the next $500,000,000 of the fund’s average daily net assets, (e) 0.400% of the next $500,000,000 of the fund’s average daily net assets, and (f) 0.350% of the fund’s average daily net assets in excess of $2,500,000,000. The Advisor has a subadvisory agreement with John Hancock Asset Management a division of Manulife Asset Management (US) LLC, an indirectly owned subsidiary of MFC and an affiliate of the Advisor. The fund is not responsible for payment of the subadvisory fees.
Effective June 1, 2013, the Advisor has contractually agreed to waive a portion of its management fee and/or reimburse expenses for certain funds of the John Hancock funds complex, including the fund (the participating portfolios). The waiver equals, on an annualized basis, 0.01% of that portion of the aggregate net assets of all the participating portfolios that exceeds $75 billion but is less than or equal to $125 billion; 0.0125% of that portion of the aggregate net assets of all the participating portfolios that exceeds $125 billion but is less than or equal to $150 billion; and 0.015% of that portion of the aggregate net assets of all the participating portfolios that exceeds $150 billion. The amount of the reimbursement is calculated daily and allocated among all the participating portfolios in proportion to the daily net assets of each fund. This arrangement may be amended or terminated at any time by the Advisor upon notice to the funds with the approval of the Board of Trustees. Accordingly, these expense reductions amounted to $37,897, $1,081, $4,818, $6,382, $103 and $937, for Class A, Class B, Class C, Class I, Class R2, and Class R6 shares, respectively, for the six months ended November 30, 2013.
The Advisor has contractually agreed to waive a portion of its management fee and/or reimburse or pay operating expenses of the fund in order to reduce the total annual fund operating expenses for Class A, Class B, Class C, Class I, Class R2 and Class R6 shares by 0.05% of the fund’s average daily net assets. These fee waivers and/or reimbursements expire on September 30, 2014, unless renewed by mutual agreement of the fund and the Advisor based upon a determination that this is appropriate under the circumstances at the time. Accordingly, these expense reductions amounted to $339,107, $9,688, $43,190, $57,154, $918, and $8,295, for Class A, Class B, Class C, Class I, Class R2, and Class R6 shares, respectively, for the six months ended November 30, 2013.
The Advisor has contractually agreed to waive all or a portion of its management fee and/or reimburse or pay operating expenses of the fund to the extent necessary to maintain the fund’s total operating expenses at 0.57% for Class R6 shares, excluding certain expenses such as taxes, brokerage commissions, interest expense, litigation and indemnification expenses and other extraordinary expenses, acquired fund fees and expenses paid indirectly, and short dividend
| Semiannual report | Bond Fund | 43 |
expense. The current expense limitation expires September 30, 2014, unless renewed by mutual agreement of the fund and the Advisor based upon a determination that is appropriate under the circumstances at the time. For the six months ended November 30, 2013, there were no reductions related to this agreement.
The investment management fees, including the impact of the waivers and reimbursements described above, incurred for the six months ended November 30, 2013 were equivalent to a net annual effective rate of 0.415% of the fund’s average daily net assets.
Accounting and legal services. Pursuant to a service agreement, the fund reimburses the Advisor for all expenses associated with providing the administrative, financial, legal, accounting and recordkeeping services to the fund, including the preparation of all tax returns, periodic reports to shareholders and regulatory reports, among other services. These expenses are allocated to each share class based on its relative net assets at the time the expense was incurred. These accounting and legal services fees incurred for the six months ended November 30, 2013, amounted to an annual rate of 0.02% of the fund’s average daily net assets.
Distribution and service plans. The fund has a distribution agreement with the Distributor. The fund has adopted distribution and service plans with respect to Class A, Class B, Class C, and Class R2 shares pursuant to Rule 12b-1 under the 1940 Act, to pay the Distributor for services provided as the distributor of shares of the fund. In addition, under a service plan for Class R2 shares, the fund pays for certain other services. The fund may pay up to the following contractual rates of distribution and service fees under these arrangements, expressed as an annual percentage of average daily net assets for each class of the fund’s shares.
| CLASS | RULE 12b–1 FEE | SERVICE FEE | ||
| Class A | 0.30% | — | ||
| Class B | 1.00% | — | ||
| Class C | 1.00% | — | ||
| Class R2 | 0.25% | 0.25% | ||
Sales charges. Class A shares are assessed up-front sales charges, which resulted in payments to the Distributor amounting to $2,010,045 for the six months ended November 30, 2013. Of this amount, $253,141 was retained and used for printing prospectuses, advertising, sales literature and other purposes, $1,700,935 was paid as sales commissions to broker-dealers and $55,969 was paid as sales commissions to sales personnel of Signator Investors, Inc., a broker-dealer affiliate of the Advisor.
Class A, Class B, and Class C shares may be subject to contingent deferred sales charges (CDSCs). Certain Class A shares that are acquired through purchases of $1 million or more and are redeemed within one year of purchase are subject to a 1.00% sales charge. Class B shares that are redeemed within six years of purchase are subject to CDSCs, at declining rates, beginning at 5.00%. Class C shares that are redeemed within one year of purchase are subject to a 1.00% CDSC. CDSCs are applied to the lesser of the current market value at the time of redemption or the original purchase cost of the shares being redeemed. Proceeds from CDSCs are used to compensate the Distributor for providing distribution-related services in connection with the sale of these shares. During the six months ended November 30, 2013, CDSCs received by the Distributor amounted to $2,928, $67,312, and $41,837 for Class A, Class B, and Class C shares, respectively.
Transfer agent fees. The fund has a transfer agent agreement with John Hancock Signature Services, Inc. (Signature Services), an affiliate of the Advisor. The transfer agent fees paid to Signature Services are determined based on the cost to Signature Services (Signature Services Cost)
| 44 | Bond Fund | Semiannual report |
of providing recordkeeping services. The Signature Services Cost includes a component of allocated John Hancock corporate overhead for providing transfer agent services to the fund and to all other John Hancock affiliated funds. It also includes out-of-pocket expenses, including payments made to third-parties for recordkeeping services provided to their clients who invest in one or more John Hancock funds. In addition, Signature Services Cost may be reduced by certain fees that Signature Services receives in connection with retirement and small accounts. Signature Services Cost is calculated monthly and allocated, as applicable, to five categories of share classes: Retail Share and Institutional Classes of Non-Municipal Bond Funds, Class R6 shares, Retirement Share Classes, and Municipal Bond Share Classes. Within each of these categories, the applicable costs are allocated to the affected John Hancock affiliated funds and/or classes, based on the relative average daily net assets.
Prior to October 1, 2013, Signature Services Cost was calculated monthly and allocated, as applicable, to four categories of share classes: Institutional Share Classes, Retirement Share Classes, Municipal Bond Share Classes and all other Retail Share Classes. Within each of these categories, the applicable costs were allocated to the affected John Hancock affiliated funds and/or classes, based on the relative average daily net assets.
Class level expenses. Class level expenses for the six months ended November 30, 2013 were:
| DISTRIBUTION AND | TRANSFER | |||
| CLASS | SERVICE FEES | AGENT FEES | ||
| Class A | $2,034,559 | $1,003,960 | ||
| Class B | 193,559 | 28,714 | ||
| Class C | 863,468 | 128,113 | ||
| Class I | — | 131,124 | ||
| Class R2 | 8,640 | 435 | ||
| Class R6 | — | 3,995 | ||
| Totals | $3,100,226 | $1,296,341 | ||
Trustee expenses. The fund compensates each Trustee who is not an employee of the Advisor or its affiliates. The costs of paying Trustee compensation and expenses are allocated to each fund based on its net assets relative to other funds within the John Hancock funds complex.
Note 6 — Fund share transactions
Transactions in fund shares for the six months ended November 30, 2013 and for the year ended May 31, 2013 were as follows:
| Six months ended 11-30-13 | Year ended 5-31-13 | |||
| Shares | Amount | Shares | Amount | |
| Class A shares | ||||
| Sold | 10,348,404 | $164,466,737 | 31,359,267 | $513,399,559 |
| Distributions reinvested | 1,676,853 | 26,602,863 | 3,107,572 | 50,865,272 |
| Repurchased | (15,850,675) | (251,748,355) | (13,717,065) | (224,729,109) |
| Net increase (decrease) | (3,825,418) | ($60,678,755) | 20,749,774 | $339,535,722 |
| Class B shares | ||||
| Sold | 46,788 | $743,858 | 824,871 | $13,396,156 |
| Distributions reinvested | 33,982 | 539,066 | 75,797 | 1,240,109 |
| Repurchased | (540,831) | (8,576,851) | (552,113) | (9,033,346) |
| Net increase (decrease) | (460,061) | ($7,293,927) | 348,555 | $5,602,919 |
| Semiannual report | Bond Fund | 45 |
| Six months ended 11-30-13 | Year ended 5-31-13 | |||
| Shares | Amount | Shares | Amount | |
| Class C shares | ||||
| Sold | 1,117,962 | $17,796,554 | 6,521,506 | $106,789,726 |
| Distributions reinvested | 167,496 | 2,657,270 | 296,969 | 4,863,774 |
| Repurchased | (3,294,720) | (52,255,767) | (2,220,013) | (36,367,597) |
| Net increase (decrease) | (2,009,262) | ($31,801,943) | 4,598,462 | $75,285,903 |
| Class I shares | ||||
| Sold | 4,452,511 | $70,773,849 | 12,674,668 | $207,444,253 |
| Distributions reinvested | 277,062 | 4,396,666 | 464,023 | 7,607,505 |
| Repurchased | (7,270,709) | (115,709,067) | (3,978,496) | (65,248,968) |
| Net increase (decrease) | (2,541,136) | ($40,538,552) | 9,160,195 | $149,802,790 |
| Class R2 shares | ||||
| Sold | 243,738 | $3,866,380 | 120,858 | $1,989,037 |
| Distributions reinvested | 4,788 | 76,021 | 1,063 | 17,545 |
| Repurchased | (62,427) | (989,012) | (2,186) | (36,129) |
| Net increase | 186,099 | $2,953,389 | 119,735 | $1,970,453 |
| Class R6 shares | ||||
| Sold | 2,345,432 | $37,293,068 | 89,583 | $1,469,475 |
| Distributions reinvested | 48,432 | 769,024 | 6,742 | 110,443 |
| Repurchased | (48,871) | (782,341) | (60,952) | (998,024) |
| Net increase | 2,344,993 | $37,279,751 | 35,373 | $581,894 |
| Total net increase (decrease) | (6,304,785) | ($100,080,037) | 35,012,094 | $572,779,681 |
Affiliates of the fund owned 2.0% and 0.3% of shares of beneficial interest of Class R2 and Class R6, respectively, on November 30, 2013.
Note 7 — Purchase and sale of securities
Purchases and sales of securities, other than short-term securities and U.S. Treasury obligations, amounted to $420,113,860 and $522,928,052, respectively, for the six months ended November 30, 2013. Purchases and sales of U.S. Treasury obligations aggregated to $333,357,056 and $337,135,049, respectively, for the six months ended November 30, 2013.
| 46 | Bond Fund | Semiannual report |
More information
| Trustees | Investment advisor |
| James M. Oates, Chairperson | John Hancock Advisers, LLC |
| Steven R. Pruchansky, Vice Chairperson | |
| Charles L. Bardelis* | Subadvisor |
| James R. Boyle† | John Hancock Asset Management a division of |
| Craig Bromley† | Manulife Asset Management (US) LLC |
| Peter S. Burgess* | |
| William H. Cunningham | Principal distributor |
| Grace K. Fey | John Hancock Funds, LLC |
| Theron S. Hoffman* | |
| Deborah C. Jackson | Custodian |
| Hassell H. McClellan | State Street Bank and Trust Company |
| Gregory A. Russo | |
| Warren A. Thomson† | Transfer agent |
| John Hancock Signature Services, Inc. | |
| Officers | |
| Hugh McHaffie | Legal counsel |
| President | K&L Gates LLP |
| Andrew G. Arnott | |
| Executive Vice President | |
| Thomas M. Kinzler | |
| Secretary and Chief Legal Officer | |
| Francis V. Knox, Jr. | |
| Chief Compliance Officer | |
| Charles A. Rizzo | |
| Chief Financial Officer | |
| Salvatore Schiavone | |
| Treasurer | |
| *Member of the Audit Committee | |
| †Non-Independent Trustee | |
The fund’s proxy voting policies and procedures, as well as the fund’s proxy voting record for the most recent twelve-month period ended June 30, are available free of charge on the Securities and Exchange Commission (SEC) website at sec.gov or on our website.
The fund’s complete list of portfolio holdings, for the first and third fiscal quarters, is filed with the SEC on Form N-Q. The fund’s Form N-Q is available on our website and the SEC’s website, sec.gov, and can be reviewed and copied (for a fee) at the SEC’s Public Reference Room in Washington, DC. Call 800-SEC-0330 to receive information on the operation of the SEC’s Public Reference Room.
We make this information on your fund, as well as monthly portfolio holdings, and other fund details available on our website at jhinvestments.com or by calling 800-225-5291.
| You can also contact us: | ||
| 800-225-5291 | Regular mail: | Express mail: |
| jhinvestments.com | Investment Operations | Investment Operations |
| John Hancock Signature Services, Inc. | John Hancock Signature Services, Inc. | |
| P.O. Box 55913 | 30 Dan Road | |
| Boston, MA 02205-5913 | Canton, MA 02021 |
| Semiannual report | Bond Fund | 47 |

| 800-225-5291 |
| 800-338-8080 EASI-Line |
| jhinvestments.com |

| This report is for the information of the shareholders of John Hancock Bond Fund. | |
| It is not authorized for distribution to prospective investors unless preceded or accompanied by a prospectus. | 21SA 11/13 |
| MF167888 | 1/14 |
ITEM 2. CODE OF ETHICS.
Not applicable at this time.
ITEM 3. AUDIT COMMITTEE FINANCIAL EXPERT.
Not applicable at this time.
ITEM 4. PRINCIPAL ACCOUNTANT FEES AND SERVICES.
Not applicable at this time.
ITEM 5. AUDIT COMMITTEE OF LISTED REGISTRANTS.
Not applicable at this time.
ITEM 6. SCHEDULE OF INVESTMENTS.
(a) Not applicable.
(b) Not applicable.
ITEM 7. DISCLOSURE OF PROXY VOTING POLICIES AND PROCEDURES FOR CLOSED-END MANAGEMENT INVESTMENT COMPANIES.
Not applicable.
ITEM 8. PORTFOLIO MANAGERS OF CLOSED-END MANAGEMENT INVESTMENT COMPANIES.
Not applicable.
ITEM 9. PURCHASES OF EQUITY SECURITIES BY CLOSED-END MANAGEMENT INVESTMENT COMPANY AND AFFILIATED PURCHASERS.
Not applicable.
ITEM 10. SUBMISSION OF MATTERS TO A VOTE OF SECURITY HOLDERS.
Not applicable.
ITEM 11. CONTROLS AND PROCEDURES.
(a) Based upon their evaluation of the registrant's disclosure controls and procedures as conducted within 90 days of the filing date of this Form N-CSR, the registrant's principal executive officer and principal financial officer have concluded that those disclosure controls and procedures provide reasonable assurance that the material information required to be disclosed by the registrant on this report is recorded, processed, summarized and reported within the time periods specified in the Securities and Exchange Commission's rules and forms.
(b) There were no changes in the registrant's internal control over financial reporting that occurred during the registrant's most recent fiscal half-year (the registrant's second fiscal half-year in the case of an annual report) that have materially affected, or are reasonably likely to materially affect, the registrant's internal control over financial reporting.
ITEM 12. EXHIBITS.
(a) Separate certifications for the registrant's principal executive officer and principal financial officer, as required by Section 302 of the Sarbanes-Oxley Act of 2002 and Rule 30a-2(a) under the Investment Company Act of 1940, are attached.
(b) Separate certifications for the registrant's principal executive officer and principal financial officer, as required by 18 U.S.C. Section 1350, as adopted pursuant to Section 906 of the Sarbanes-Oxley Act of 2002, and Rule 30a-2(b) under the Investment Company Act of 1940, are attached. The certifications furnished pursuant to this paragraph are not deemed to be "filed" for purposes of Section 18 of the Securities Exchange Act of 1934, or otherwise subject to the liability of that section. Such certifications are not deemed to be incorporated by reference into any filing under the Securities Act of 1933 or the Securities Exchange Act of 1934, except to the extent that the Registrant specifically incorporates them by reference.
(c)(1) Contact person at the registrant.
| SIGNATURES |
Pursuant to the requirements of the Securities Exchange Act of 1934 and the Investment Company Act of 1940, the registrant has duly caused this report to be signed on its behalf by the undersigned, thereunto duly authorized.
| John Hancock Sovereign Bond Fund | |
| By: | /s/ Hugh McHaffie |
| Hugh McHaffie | |
| President | |
| Date: | January 24, 2014 |
Pursuant to the requirements of the Securities Exchange Act of 1934 and the Investment Company Act of 1940, this report has been signed below by the following persons on behalf of the registrant and in the capacities and on the dates indicated.
| By: | /s/ Hugh McHaffie |
| Hugh McHaffie | |
| President | |
| Date: | January 24, 2014 |
| By: | /s/ Charles A. Rizzo |
| Charles A. Rizzo | |
| Chief Financial Officer | |
| Date: | January 24, 2014 |