UNITED STATES
SECURITIES AND EXCHANGE COMMISSION
Washington, D.C. 20549
FORM N-CSR
CERTIFIED SHAREHOLDER REPORT OF REGISTERED
MANAGEMENT INVESTMENT COMPANIES
Investment Company Act file number 811-02402
John Hancock Sovereign Bond Fund
(Exact name of registrant as specified in charter)
Berkeley Street, Boston, Massachusetts 02116
(Address of principal executive offices) (Zip code)
Salvatore Schiavone
Treasurer
200 Berkeley Street
Boston, Massachusetts 02116
(Name and address of agent for service)
Registrant's telephone number, including area code: 617-663-4497
| Date of fiscal year end: | | May 31 |
| | | |
| | | |
| Date of reporting period: | | May 31, 2020 |
ITEM 1. REPORTS TO STOCKHOLDERS.
Annual report 5/31/2020
Beginning on January 1, 2021, as permitted by regulations adopted by the Securities and Exchange Commission, paper copies of the fund's shareholder reports like this one will no longer be sent by mail, unless you specifically request paper copies of the reports from the fund or from your financial intermediary. Instead, the reports will be made available on a website, and you will be notified by mail each time a report is posted and provided with a website link to access the report.
If you already elected to receive shareholder reports electronically, you will not be affected by this change, and you do not need to take any action. You may elect to receive shareholder reports and other communications electronically by calling John Hancock Investment Management at 800-225-5291 (Class A, Class B and Class C shares) or 888-972-8696 (Class I, Class R2, Class R4 and Class R6 shares) or by contacting your financial intermediary.
You may elect to receive all reports in paper, free of charge, at any time. You can inform John Hancock Investment Management or your financial intermediary that you wish to continue receiving paper copies of your shareholder reports by following the instructions listed above. Your election to receive reports in paper will apply to all funds held with John Hancock Investment Management or your financial intermediary.

A message to shareholders
Dear shareholder,
Global financial markets delivered strong returns during first half of the 12-month period ended May 31, 2020; however, heightened fears over the coronavirus (COVID-19) sent markets tumbling during the latter half of February and early March. Investors reacted by exiting higher-risk assets and moving into cash, leading to a liquidity crunch in the fixed-income markets.
In response to the sell-off, the U.S. Federal Reserve acted quickly, lowering interest rates to near zero and reinstating quantitative easing, as well as announcing its plans to shore up short-term debt. These steps, along with the passage of a $2 trillion federal economic stimulus bill, helped lift the markets during the last two months of the period, while credit spreads rebounded off their highs as liquidity concerns eased.
The continued spread of COVID-19, trade disputes, rising unemployment, and other geopolitical tensions may continue to create uncertainty among businesses and investors. Your financial professional can help position your portfolio so that it's sufficiently diversified to seek to meet your long-term objectives and to withstand the inevitable bouts of market volatility along the way.
On behalf of everyone at John Hancock Investment Management, I'd like to take this opportunity to welcome new shareholders and thank existing shareholders for the continued trust you've placed in us.
Sincerely,
Andrew G. Arnott
President and CEO,
John Hancock Investment Management
Head of Wealth and Asset Management,
United States and Europe
This commentary reflects the CEO's views as of this report's period end and are subject to change at any time. Diversification does not guarantee investment returns and does not eliminate risk of loss. All investments entail risks, including the possible loss of principal. For more up-to-date information, you can visit our website at jhinvestments.com.
Table of contents
| | | |
| 2 | | Your fund at a glance |
| 5 | | Manager's discussion of fund performance |
| 7 | | A look at performance |
| 9 | | Your expenses |
| 11 | | Fund's investments |
| 41 | | Financial statements |
| 45 | | Financial highlights |
| 53 | | Notes to financial statements |
| 64 | | Report of independent registered public accounting firm |
| 65 | | Tax information |
| 66 | | Statement regarding liquidity risk management |
| 69 | | Trustees and Officers |
| 73 | | More information |
ANNUAL REPORT | JOHN HANCOCK BOND FUND 1
INVESTMENT OBJECTIVE
The fund seeks a high level of current income consistent with prudent investment risk.
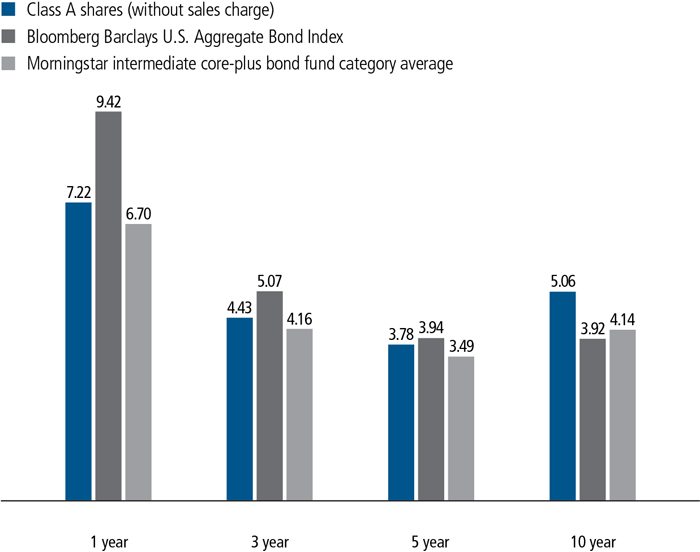
AVERAGE ANNUAL TOTAL RETURNS AS OF 5/31/2020 (%)
The Bloomberg Barclays U.S. Aggregate Bond Index is an unmanaged index of dollar-denominated and non-convertible investment-grade debt issues.
It is not possible to invest directly in an index. Index figures do not reflect expenses or sales charges, which would result in lower returns.
The fund's Morningstar category average is a group of funds with similar investment objectives and strategies and is the equal-weighted return of all funds per category. Morningstar places funds in certain categories based on their historical portfolio holdings. Figures from Morningstar, Inc. include reinvested distributions and do not take into account sales charges. Actual load-adjusted performance is lower.
The past performance shown here reflects reinvested distributions and the beneficial effect of any expense reductions, and does not guarantee future results. Performance of the other share classes will vary based on the difference in the fees and expenses of those classes. Shares will fluctuate in value and, when redeemed, may be worth more or less than their original cost. Current month-end performance may be lower or higher than the performance cited, and can be found at jhinvestments.com or by calling 800-225-5291. For further information on the fund's objectives, risks, and strategy, see the fund's prospectus.
ANNUAL REPORT | JOHN HANCOCK BOND FUND 2
PERFORMANCE HIGHLIGHTS OVER THE LAST TWELVE MONTHS
The spread of COVID-19 was the key driver of market performance
A long period of positive growth and healthy investor risk appetites ended with the emergence of coronavirus in early 2020, sparking a flight into lower-risk asset classes.
Investment-grade bonds posted strong gains during the 12-month period
Although the bond market was affected by volatility in February and March, the backdrop of slowing growth, accommodative U.S. Federal Reserve policy, and investor demand for higher-quality assets fueled positive returns.
The fund underperformed its benchmark
Asset allocation and security selection both played a role in the shortfall.
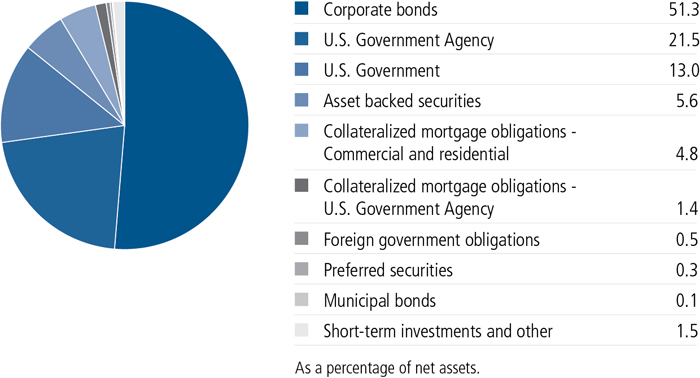
PORTFOLIO COMPOSITION AS OF 5/31/2020 (%)
ANNUAL REPORT | JOHN HANCOCK BOND FUND 3
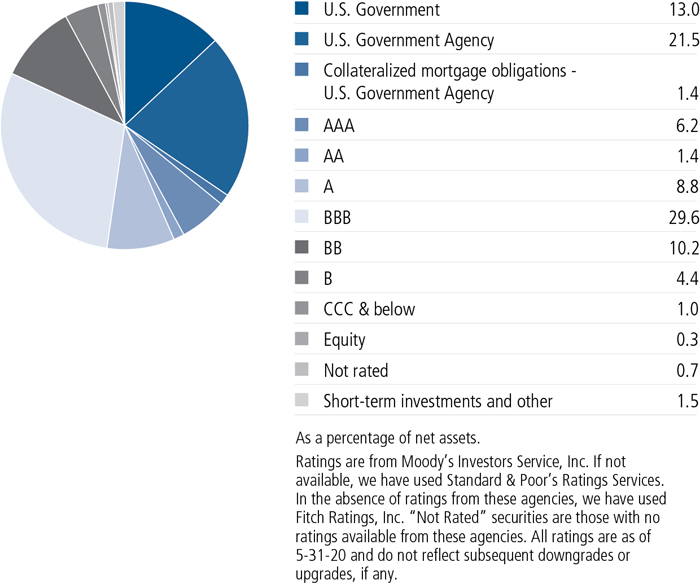
QUALITY COMPOSITION AS OF 5/31/2020 (%)
A note about risks
The fund may be subject to various risks as described in the fund's prospectus. A widespread health crisis such as a global pandemic could cause substantial market volatility, exchange trading suspensions and closures, impact the ability to complete redemptions, and affect fund performance. For example, the novel coronavirus disease (COVID-19) has resulted in significant disruptions to global business activity. The impact of a health crisis and other epidemics and pandemics that may arise in the future, could affect the global economy in ways that cannot necessarily be foreseen at the present time. A health crisis may exacerbate other pre-existing political, social, and economic risks. Any such impact could adversely affect the fund's performance, resulting in losses to your investment. For more information, please refer to the "Principal risks" section of the prospectus.
ANNUAL REPORT | JOHN HANCOCK BOND FUND 4
Manager's discussion of fund performance
How would you describe the investment backdrop during the 12 months ended May 31, 2020?
Investment-grade bonds delivered strong total returns, led by corporates and U.S. Treasuries. Yields fell dramatically as uncertainty about the economic impact of COVID-19 prompted a rotation from higher-risk assets toward those perceived to have a greater degree of safety. (Prices and yields move in opposite directions.) Bonds were also boosted by the U.S. Federal Reserve's decision to cut short-term interest rates to near zero. Corporate issues, while falling sharply in late February and most of March, posted a sizable gain thanks to their rally during the final two months of the period. High-yield (below investment-grade) bonds finished with a flat return and lagged the index by a wide margin due to their substantial underperformance in the first quarter of 2020.
What elements of the fund's positioning helped and hurt results?
Although the fund produced a strong absolute return, it underperformed its benchmark, the Bloomberg Barclays U.S. Aggregate Bond Index. The fund's allocation to high-yield bonds, which aren't represented in the benchmark, was the largest source of underperformance, due to the relative weakness in lower-quality issues. An underweight in U.S. Treasuries also detracted from relative performance, as did an overweight in commercial mortgage-backed securities.
An overweight in investment-grade corporates contributed. Security selection further detracted from results, with the fund's holding in investment-grade corporates, asset-backed securities (ABS), and mortgage-backed securities (MBS) producing returns below those of the corresponding index components. Duration and yield curve positioning was a small net positive.
COUNTRY COMPOSITION AS OF 5/31/2020 (%)
| | |
| United States | 89.2 |
| United Kingdom | 2.5 |
| Netherlands | 1.4 |
| Canada | 1.3 |
| Other countries | 5.6 |
| TOTAL | 100.0 |
| As a percentage of net assets. | |
ANNUAL REPORT | JOHN HANCOCK BOND FUND 5
What were some key aspects of your portfolio activity?
We steadily reduced risk in the portfolio in the second half of 2019 and early 2020 on the belief that valuations had become rich compared to historical levels. As part of this process, we lowered the fund's allocations to investment-grade and high-yield corporate bonds and increased its weighting in agency MBS. Additionally, we repositioned the portfolio toward the intermediate portion of the yield curve, which led to a reduction in ABS due to their shorter average maturities.
As valuations became attractive in the sell-off, we began to increase the fund's weighting in corporates and reduce its position in agency MBS. We achieved this largely though additions in high-quality issuers in the new issue market, which has seen a record level issuance so far in 2020.
Given our cautious optimism on the prospects for a gradual economic recovery, we believe corporates and high-yield bonds remain the most attractive areas of the market. At the same time, we think a cautious approach is warranted due to the unprecedented nature of market conditions in recent months. We therefore remain focused on bottom-up security selection and by robust fundamental analysis. Our primary emphasis is identifying opportunities among stable, high-quality issuers in the best position to weather economic uncertainty, while avoiding those facing above-average risks.
MANAGED BY
| |
| Howard C. Greene, CFA, Manulife IM (US) |
| Jeffrey N. Given, CFA, Manulife IM (US) |

The views expressed in this report are exclusively those of Howard C. Greene, CFA, and Jeffrey N. Given, CFA, Manulife Investment Management (US) LLC, and are subject to change. They are not meant as investment advice. Please note that the holdings discussed in this report may not have been held by the fund for the entire period. Portfolio composition is subject to review in accordance with the fund's investment strategy and may vary in the future. Current and future portfolio holdings are subject to risk.
ANNUAL REPORT | JOHN HANCOCK BOND FUND 6
TOTAL RETURNS FOR THE PERIOD ENDED MAY 31, 2020
| | | | | | | | | | | | |
Average annual
total returns (%)
with maximum sales charge | | Cumulative total
returns (%)
with maximum sales charge | | SEC 30-day
yield (%)
subsidized | | SEC 30-day
yield (%)
unsubsidized1 |
| | 1-year | 5-year | 10-year | | | 5-year | 10-year | | as of
5-31-20 | | as of
5-31-20 |
| Class A | 2.93 | 2.94 | 4.63 | | | 15.58 | 57.24 | | 2.52 | | 2.52 |
| Class B | 1.41 | 2.69 | 4.47 | | | 14.20 | 54.86 | | 1.94 | | 1.93 |
| Class C | 5.41 | 3.06 | 4.33 | | | 16.27 | 52.79 | | 1.94 | | 1.93 |
| Class I2 | 7.47 | 4.09 | 5.42 | | | 22.22 | 69.51 | | 2.92 | | 2.92 |
| Class R22,3 | 7.12 | 3.69 | 5.03 | | | 19.89 | 63.41 | | 2.55 | | 2.55 |
| Class R42,3 | 7.32 | 3.97 | 5.16 | | | 21.48 | 65.33 | | 2.81 | | 2.71 |
| Class R62,3 | 7.65 | 4.22 | 5.47 | | | 22.97 | 70.36 | | 3.05 | | 3.04 |
| Class NAV2,3 | 7.60 | 4.20 | 5.27 | | | 22.83 | 67.15 | | 3.06 | | 3.06 |
| Index† | 9.42 | 3.94 | 3.92 | | | 21.34 | 46.91 | | — | | — |
Performance figures assume all distributions have been reinvested. Figures reflect maximum sales charges on Class A shares of 4.0% and the applicable contingent deferred sales charge (CDSC) on Class B and Class C shares. The returns for Class A shares have been adjusted to reflect the reduction in the maximum sales charge from 4.5% to 4.0%, effective 2-3-14. The Class B shares' CDSC declines annually between years 1 to 6 according to the following schedule: 5%, 4%, 3%, 3%, 2%, 1%. No sales charge will be assessed after the sixth year. Class C shares sold within one year of purchase are subject to a 1% CDSC. Sales charges are not applicable to Class I, Class R2, Class R4, Class R6, and Class NAV shares.
The expense ratios of the fund, both net (including any fee waivers and/or expense limitations) and gross (excluding any fee waivers and/or expense limitations), are set forth according to the most recent publicly available prospectuses for the fund and may differ from those disclosed in the Financial highlights tables in this report. Net expenses reflect contractual expense limitations in effect until September 30, 2021 and are subject to change. Had the contractual fee waivers and expense limitations not been in place, gross expenses would apply. The expense ratios are as follows:
| | | | | | | | | |
| | Class A | Class B | Class C | Class I | Class R2 | Class R4 | Class R6 | Class NAV |
| Gross (%) | 0.79 | 1.49 | 1.49 | 0.49 | 0.89 | 0.74 | 0.39 | 0.37 |
| Net (%) | 0.78 | 1.48 | 1.48 | 0.48 | 0.88 | 0.63 | 0.38 | 0.36 |
Please refer to the most recent prospectus and annual or semiannual report for more information on expenses and any expense limitation arrangements for each class.
The returns reflect past results and should not be considered indicative of future performance. The return and principal value of an investment will fluctuate so that shares, when redeemed, may be worth more or less than their original cost. Due to market volatility and other factors, the fund's current performance may be higher or lower than the performance shown. For current to the most recent month-end performance data, please call 800-225-5291 or visit the fund's website at jhinvestments.com.
The performance table above and the chart on the next page do not reflect the deduction of taxes that a shareholder would pay on fund distributions or the redemption of fund shares. The fund's performance results reflect any applicable fee waivers or expense reductions, without which the expenses would increase and results would have been less favorable.
| † | Index is the Bloomberg Barclays U.S. Aggregate Bond Index. |
See the following page for footnotes.
ANNUAL REPORT | JOHN HANCOCK BOND FUND 7
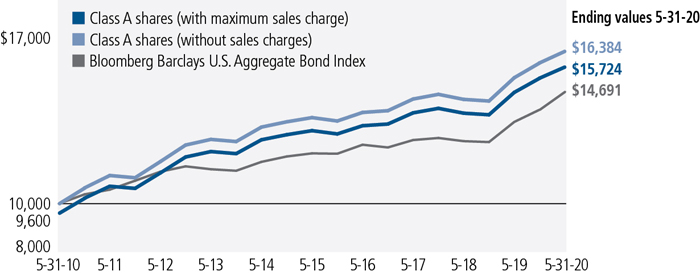
This chart and table show what happened to a hypothetical $10,000 investment in John Hancock Bond Fund for the share classes and periods indicated, assuming all distributions were reinvested. For comparison, we've shown the same investment in the Bloomberg Barclays U.S. Aggregate Bond Index.
| | | | | |
| | Start date | With maximum
sales charge ($) | Without
sales charge ($) | Index ($) |
| Class B4 | 5-31-10 | 15,486 | 15,486 | 14,691 |
| Class C4 | 5-31-10 | 15,279 | 15,279 | 14,691 |
| Class I2,3 | 5-31-10 | 16,951 | 16,951 | 14,691 |
| Class R22,3 | 5-31-10 | 16,341 | 16,341 | 14,691 |
| Class R42,3 | 5-31-10 | 16,533 | 16,533 | 14,691 |
| Class R62,3 | 5-31-10 | 17,036 | 17,036 | 14,691 |
| Class NAV2,3 | 5-31-10 | 16,715 | 16,715 | 14,691 |
The values shown in the chart for Class A shares with maximum sales charge have been adjusted to reflect the reduction in the Class A shares' maximum sales charge from 4.5% to 4.0%, which became effective on 2-3-14.
The Bloomberg Barclays U.S. Aggregate Bond Index is an unmanaged index of dollar-denominated and non-convertible investment-grade debt issues.
It is not possible to invest directly in an index. Index figures do not reflect expenses or sales charges, which would result in lower returns.
Footnotes related to performance pages
| 1 | Unsubsidized yield reflects what the yield would have been without the effect of reimbursements and waivers. |
| 2 | For certain types of investors, as described in the fund's prospectuses. |
| 3 | Class R2 shares were first offered 3-1-12; Class R4 shares were first offered 3-27-15; Class R6 shares were first offered 9-1-11; Class NAV shares were first offered 8-31-15. Returns prior to these dates are those of Class A shares that have not been adjusted for class-specific expenses; otherwise, returns would vary. |
| 4 | The contingent deferred sales charge is not applicable. |
ANNUAL REPORT | JOHN HANCOCK BOND FUND 8
These examples are intended to help you understand your ongoing operating expenses of investing in the fund so you can compare these costs with the ongoing costs of investing in other mutual funds.
Understanding fund expenses
As a shareholder of the fund, you incur two types of costs:
■Transaction costs, which include sales charges (loads) on purchases or redemptions (varies by share class), minimum account fee charge, etc.
■Ongoing operating expenses, including management fees, distribution and service fees (if applicable), and other fund expenses.
We are presenting only your ongoing operating expenses here.
Actual expenses/actual returns
The first line of each share class in the table on the following page is intended to provide information about the fund’s actual ongoing operating expenses, and is based on the fund’s actual return. It assumes an account value of $1,000.00 on December 1, 2019, with the same investment held until May 31, 2020.
Together with the value of your account, you may use this information to estimate the operating expenses that you paid over the period. Simply divide your account value at May 31, 2020, by $1,000.00, then multiply it by the “expenses paid” for your share class from the table. For example, for an account value of $8,600.00, the operating expenses should be calculated as follows:
Hypothetical example for comparison purposes
The second line of each share class in the table on the following page allows you to compare the fund’s ongoing operating expenses with those of any other fund. It provides an example of the fund’s hypothetical account values and hypothetical expenses based on each class’s actual expense ratio and an assumed 5% annualized return before expenses (which is not the class’s actual return). It assumes an account value of $1,000.00 on December 1, 2019, with the same investment held until May 31, 2020. Look in any other fund shareholder report to find its hypothetical example and you will be able to compare these expenses. Please remember that these hypothetical account values and expenses may not be used to estimate the actual ending account balance or expenses you paid for the period.
| | ANNUAL REPORT | JOHN HANCOCK BOND FUND | 9 |
Remember, these examples do not include any transaction costs, therefore, these examples will not help you to determine the relative total costs of owning different funds. If transaction costs were included, your expenses would have been higher. See the prospectuses for details regarding transaction costs.
SHAREHOLDER EXPENSE EXAMPLE CHART
| | | Account
value on
12-1-2019 | Ending
value on
5-31-2020 | Expenses
paid during
period ended
5-31-20201 | Annualized
expense
ratio |
| Class A | Actual expenses/actual returns | $1,000.00 | $1,030.60 | $3.96 | 0.78% |
| | Hypothetical example | 1,000.00 | 1,021.10 | 3.94 | 0.78% |
| Class B | Actual expenses/actual returns | 1,000.00 | 1,026.30 | 7.50 | 1.48% |
| | Hypothetical example | 1,000.00 | 1,017.60 | 7.47 | 1.48% |
| Class C | Actual expenses/actual returns | 1,000.00 | 1,027.00 | 7.50 | 1.48% |
| | Hypothetical example | 1,000.00 | 1,017.60 | 7.47 | 1.48% |
| Class I | Actual expenses/actual returns | 1,000.00 | 1,031.50 | 2.44 | 0.48% |
| | Hypothetical example | 1,000.00 | 1,022.60 | 2.43 | 0.48% |
| Class R2 | Actual expenses/actual returns | 1,000.00 | 1,030.10 | 4.42 | 0.87% |
| | Hypothetical example | 1,000.00 | 1,020.70 | 4.40 | 0.87% |
| Class R4 | Actual expenses/actual returns | 1,000.00 | 1,030.80 | 3.10 | 0.61% |
| | Hypothetical example | 1,000.00 | 1,022.00 | 3.08 | 0.61% |
| Class R6 | Actual expenses/actual returns | 1,000.00 | 1,032.70 | 1.83 | 0.36% |
| | Hypothetical example | 1,000.00 | 1,023.20 | 1.82 | 0.36% |
| Class NAV | Actual expenses/actual returns | 1,000.00 | 1,032.10 | 1.78 | 0.35% |
| | Hypothetical example | 1,000.00 | 1,023.30 | 1.77 | 0.35% |
| 1 | Expenses are equal to the annualized expense ratio, multiplied by the average account value over the period, multiplied by 183/366 (to reflect the one-half year period). |
| 10 | JOHN HANCOCK BOND FUND | ANNUAL REPORT | |
AS OF 5-31-20
| | Rate (%) | Maturity date | | Par value^ | Value |
| U.S. Government and Agency obligations 34.5% | | | | $6,303,155,425 |
| (Cost $5,880,466,395) | | | | | |
| U.S. Government 13.0% | | | | 2,371,815,973 |
| U.S. Treasury | | | | | |
| Bond | 2.000 | 02-15-50 | | 238,412,000 | 272,544,030 |
| Bond | 2.250 | 08-15-49 | | 344,407,000 | 413,126,959 |
| Bond | 2.750 | 11-15-42 | | 345,125,000 | 440,317,484 |
| Bond | 3.125 | 11-15-41 | | 319,495,000 | 431,230,887 |
| Note | 0.375 | 04-30-25 | | 213,248,000 | 213,972,711 |
| Note (A) | 0.625 | 05-15-30 | | 399,517,000 | 398,393,358 |
| Note | 1.625 | 09-30-26 | | 96,650,000 | 103,728,858 |
| Treasury Inflation Protected Security | 0.250 | 07-15-29 | | 91,767,055 | 98,501,686 |
| U.S. Government Agency 21.5% | | | | 3,931,339,452 |
| Federal Home Loan Mortgage Corp. | | | | | |
| 30 Yr Pass Thru | 3.000 | 03-01-43 | | 5,338,354 | 5,824,441 |
| 30 Yr Pass Thru | 3.000 | 12-01-45 | | 21,736,868 | 23,362,907 |
| 30 Yr Pass Thru | 3.000 | 05-01-46 | | 4,012,095 | 4,329,776 |
| 30 Yr Pass Thru | 3.000 | 10-01-46 | | 7,556,287 | 8,107,371 |
| 30 Yr Pass Thru | 3.000 | 10-01-46 | | 7,446,956 | 7,968,192 |
| 30 Yr Pass Thru | 3.000 | 10-01-46 | | 13,062,066 | 13,937,134 |
| 30 Yr Pass Thru | 3.000 | 10-01-46 | | 90,228,233 | 96,865,025 |
| 30 Yr Pass Thru | 3.000 | 12-01-46 | | 76,309,832 | 81,016,668 |
| 30 Yr Pass Thru | 3.000 | 12-01-46 | | 15,786,339 | 17,026,444 |
| 30 Yr Pass Thru | 3.000 | 04-01-47 | | 45,480,583 | 48,527,468 |
| 30 Yr Pass Thru | 3.000 | 09-01-49 | | 30,870,654 | 32,600,461 |
| 30 Yr Pass Thru | 3.000 | 10-01-49 | | 36,145,288 | 38,100,621 |
| 30 Yr Pass Thru | 3.000 | 12-01-49 | | 49,198,959 | 51,817,402 |
| 30 Yr Pass Thru | 3.000 | 02-01-50 | | 105,694,365 | 111,352,607 |
| 30 Yr Pass Thru | 3.500 | 06-01-42 | | 5,137,690 | 5,602,740 |
| 30 Yr Pass Thru | 3.500 | 04-01-44 | | 6,131,224 | 6,760,930 |
| 30 Yr Pass Thru | 3.500 | 05-01-45 | | 13,595,309 | 14,753,694 |
| 30 Yr Pass Thru | 3.500 | 08-01-46 | | 71,617,351 | 78,189,482 |
| 30 Yr Pass Thru | 3.500 | 09-01-46 | | 18,735,788 | 20,215,068 |
| 30 Yr Pass Thru | 3.500 | 10-01-46 | | 4,011,867 | 4,314,833 |
| 30 Yr Pass Thru | 3.500 | 10-01-46 | | 27,319,836 | 29,842,910 |
| 30 Yr Pass Thru | 3.500 | 11-01-46 | | 9,025,342 | 9,737,936 |
| 30 Yr Pass Thru | 3.500 | 11-01-46 | | 8,916,503 | 9,653,940 |
| 30 Yr Pass Thru | 3.500 | 12-01-46 | | 14,596,431 | 15,812,749 |
| 30 Yr Pass Thru | 3.500 | 01-01-47 | | 8,612,802 | 9,397,793 |
| 30 Yr Pass Thru | 3.500 | 02-01-47 | | 14,258,086 | 15,332,590 |
| 30 Yr Pass Thru | 3.500 | 04-01-47 | | 15,825,831 | 17,268,233 |
| 30 Yr Pass Thru | 3.500 | 09-01-47 | | 49,192,228 | 53,199,171 |
| 30 Yr Pass Thru | 3.500 | 11-01-47 | | 38,815,369 | 41,625,302 |
| SEE NOTES TO FINANCIAL STATEMENTS | ANNUAL REPORT | JOHN HANCOCK BOND FUND | 11 |
| | Rate (%) | Maturity date | | Par value^ | Value |
| U.S. Government Agency (continued) | | | | |
| 30 Yr Pass Thru | 3.500 | 11-01-47 | | 13,539,712 | $14,555,848 |
| 30 Yr Pass Thru | 4.000 | 01-01-41 | | 13,405,573 | 14,739,224 |
| 30 Yr Pass Thru | 4.000 | 03-01-42 | | 6,728,072 | 7,380,592 |
| 30 Yr Pass Thru | 4.000 | 11-01-43 | | 4,277,085 | 4,698,580 |
| 30 Yr Pass Thru | 4.000 | 01-01-47 | | 12,622,950 | 13,930,023 |
| 30 Yr Pass Thru | 4.000 | 03-01-47 | | 49,440,811 | 53,600,424 |
| 30 Yr Pass Thru | 4.000 | 04-01-47 | | 20,532,465 | 22,253,671 |
| 30 Yr Pass Thru | 4.000 | 05-01-47 | | 15,110,671 | 16,377,376 |
| 30 Yr Pass Thru | 4.000 | 10-01-47 | | 26,554,980 | 28,639,143 |
| 30 Yr Pass Thru | 4.000 | 03-01-48 | | 9,912,775 | 10,619,219 |
| 30 Yr Pass Thru | 4.000 | 07-01-48 | | 49,127,670 | 53,214,880 |
| 30 Yr Pass Thru | 4.000 | 08-01-48 | | 29,346,356 | 31,696,139 |
| 30 Yr Pass Thru | 5.500 | 11-01-39 | | 3,976,423 | 4,638,754 |
| Federal National Mortgage Association | | | | | |
| 30 Yr Pass Thru | 3.000 | 07-01-42 | | 4,009,041 | 4,310,106 |
| 30 Yr Pass Thru | 3.000 | 10-01-42 | | 7,754,760 | 8,298,342 |
| 30 Yr Pass Thru | 3.000 | 10-01-42 | | 4,006,521 | 4,287,364 |
| 30 Yr Pass Thru | 3.000 | 04-01-43 | | 2,469,811 | 2,642,936 |
| 30 Yr Pass Thru | 3.000 | 12-01-45 | | 46,287,530 | 49,083,714 |
| 30 Yr Pass Thru | 3.000 | 08-01-46 | | 51,295,724 | 54,715,045 |
| 30 Yr Pass Thru | 3.000 | 08-01-46 | | 38,065,305 | 40,626,491 |
| 30 Yr Pass Thru | 3.000 | 09-01-46 | | 4,945,846 | 5,290,369 |
| 30 Yr Pass Thru | 3.000 | 10-01-46 | | 3,844,873 | 4,112,703 |
| 30 Yr Pass Thru | 3.000 | 10-01-46 | | 32,939,527 | 34,785,260 |
| 30 Yr Pass Thru | 3.000 | 01-01-47 | | 30,437,826 | 32,466,781 |
| 30 Yr Pass Thru | 3.000 | 02-01-47 | | 16,320,234 | 17,596,827 |
| 30 Yr Pass Thru | 3.000 | 04-01-47 | | 78,695,534 | 83,105,160 |
| 30 Yr Pass Thru | 3.000 | 10-01-47 | | 35,706,455 | 38,086,612 |
| 30 Yr Pass Thru | 3.000 | 11-01-47 | | 41,857,333 | 44,647,500 |
| 30 Yr Pass Thru | 3.000 | 11-01-48 | | 96,607,762 | 102,021,081 |
| 30 Yr Pass Thru | 3.000 | 11-01-48 | | 34,572,312 | 36,617,576 |
| 30 Yr Pass Thru | 3.000 | 07-01-49 | | 44,799,174 | 47,113,455 |
| 30 Yr Pass Thru | 3.000 | 09-01-49 | | 42,639,779 | 45,029,057 |
| 30 Yr Pass Thru | 3.000 | 09-01-49 | | 49,599,653 | 53,184,915 |
| 30 Yr Pass Thru | 3.000 | 10-01-49 | | 31,660,962 | 33,338,585 |
| 30 Yr Pass Thru | 3.000 | 10-01-49 | | 60,417,849 | 63,633,378 |
| 30 Yr Pass Thru | 3.000 | 10-01-49 | | 61,263,591 | 65,213,347 |
| 30 Yr Pass Thru | 3.000 | 11-01-49 | | 34,425,959 | 36,957,437 |
| 30 Yr Pass Thru | 3.000 | 11-01-49 | | 42,432,536 | 44,969,322 |
| 30 Yr Pass Thru | 3.000 | 11-01-49 | | 37,121,582 | 39,224,854 |
| 30 Yr Pass Thru | 3.000 | 11-01-49 | | 59,845,127 | 63,030,175 |
| 30 Yr Pass Thru | 3.000 | 12-01-49 | | 46,950,441 | 49,610,606 |
| 30 Yr Pass Thru | 3.000 | 01-01-50 | | 36,921,229 | 39,003,919 |
| 30 Yr Pass Thru | 3.000 | 02-01-50 | | 54,821,255 | 57,735,498 |
| 12 | JOHN HANCOCK BOND FUND | ANNUAL REPORT | SEE NOTES TO FINANCIAL STATEMENTS |
| | Rate (%) | Maturity date | | Par value^ | Value |
| U.S. Government Agency (continued) | | | | |
| 30 Yr Pass Thru | 3.500 | 11-01-40 | | 2,928,485 | $3,198,076 |
| 30 Yr Pass Thru | 3.500 | 06-01-42 | | 2,803,387 | 3,056,205 |
| 30 Yr Pass Thru | 3.500 | 08-01-42 | | 4,998,872 | 5,446,562 |
| 30 Yr Pass Thru | 3.500 | 06-01-43 | | 17,765,107 | 19,467,150 |
| 30 Yr Pass Thru | 3.500 | 07-01-43 | | 5,123,506 | 5,614,379 |
| 30 Yr Pass Thru | 3.500 | 07-01-43 | | 5,320,920 | 5,835,696 |
| 30 Yr Pass Thru | 3.500 | 01-01-45 | | 4,230,964 | 4,644,258 |
| 30 Yr Pass Thru | 3.500 | 04-01-45 | | 13,726,309 | 14,891,270 |
| 30 Yr Pass Thru | 3.500 | 04-01-45 | | 3,635,628 | 3,944,187 |
| 30 Yr Pass Thru | 3.500 | 04-01-45 | | 14,812,115 | 16,069,229 |
| 30 Yr Pass Thru | 3.500 | 01-01-46 | | 35,722,712 | 39,167,567 |
| 30 Yr Pass Thru | 3.500 | 02-01-46 | | 25,705,521 | 27,509,616 |
| 30 Yr Pass Thru | 3.500 | 07-01-46 | | 29,796,395 | 31,738,620 |
| 30 Yr Pass Thru | 3.500 | 07-01-46 | | 9,664,702 | 10,430,588 |
| 30 Yr Pass Thru | 3.500 | 08-01-46 | | 36,650,146 | 39,691,950 |
| 30 Yr Pass Thru | 3.500 | 02-01-47 | | 41,528,633 | 44,949,375 |
| 30 Yr Pass Thru | 3.500 | 03-01-47 | | 46,227,763 | 50,425,623 |
| 30 Yr Pass Thru | 3.500 | 05-01-47 | | 31,152,388 | 34,020,221 |
| 30 Yr Pass Thru | 3.500 | 07-01-47 | | 58,519,683 | 63,833,750 |
| 30 Yr Pass Thru | 3.500 | 08-01-47 | | 44,484,792 | 48,204,642 |
| 30 Yr Pass Thru | 3.500 | 09-01-47 | | 10,416,773 | 11,056,708 |
| 30 Yr Pass Thru | 3.500 | 11-01-47 | | 55,269,919 | 59,753,454 |
| 30 Yr Pass Thru | 3.500 | 11-01-47 | | 7,310,783 | 7,759,907 |
| 30 Yr Pass Thru | 3.500 | 12-01-47 | | 27,763,238 | 29,893,947 |
| 30 Yr Pass Thru | 3.500 | 01-01-48 | | 47,189,355 | 50,810,935 |
| 30 Yr Pass Thru | 3.500 | 03-01-48 | | 9,471,738 | 10,370,328 |
| 30 Yr Pass Thru | 3.500 | 03-01-48 | | 36,489,599 | 38,662,853 |
| 30 Yr Pass Thru | 3.500 | 06-01-48 | | 23,193,408 | 25,060,378 |
| 30 Yr Pass Thru | 3.500 | 03-01-49 | | 7,361,947 | 7,926,945 |
| 30 Yr Pass Thru | 3.500 | 06-01-49 | | 49,990,416 | 53,670,745 |
| 30 Yr Pass Thru | 3.500 | 06-01-49 | | 22,170,159 | 23,414,364 |
| 30 Yr Pass Thru | 3.500 | 06-01-49 | | 39,540,845 | 42,167,670 |
| 30 Yr Pass Thru | 3.500 | 07-01-49 | | 23,144,582 | 24,557,024 |
| 30 Yr Pass Thru | 3.500 | 07-01-49 | | 87,497,476 | 92,900,069 |
| 30 Yr Pass Thru | 3.500 | 09-01-49 | | 18,466,027 | 19,473,500 |
| 30 Yr Pass Thru | 3.500 | 12-01-49 | | 108,543,480 | 115,338,856 |
| 30 Yr Pass Thru | 3.500 | 02-01-50 | | 71,298,357 | 75,204,980 |
| 30 Yr Pass Thru (6 month LIBOR + 2.122%) (B) | 3.997 | 07-01-33 | | 375 | 393 |
| 30 Yr Pass Thru | 4.000 | 09-01-40 | | 6,413,515 | 7,049,690 |
| 30 Yr Pass Thru | 4.000 | 09-01-40 | | 9,563,622 | 10,512,265 |
| 30 Yr Pass Thru | 4.000 | 11-01-40 | | 2,355,541 | 2,589,193 |
| 30 Yr Pass Thru | 4.000 | 12-01-40 | | 3,841,707 | 4,222,777 |
| 30 Yr Pass Thru | 4.000 | 01-01-41 | | 4,222,117 | 4,640,921 |
| SEE NOTES TO FINANCIAL STATEMENTS | ANNUAL REPORT | JOHN HANCOCK BOND FUND | 13 |
| | Rate (%) | Maturity date | | Par value^ | Value |
| U.S. Government Agency (continued) | | | | |
| 30 Yr Pass Thru | 4.000 | 09-01-41 | | 7,726,044 | $8,487,584 |
| 30 Yr Pass Thru | 4.000 | 09-01-41 | | 3,491,722 | 3,871,902 |
| 30 Yr Pass Thru | 4.000 | 10-01-41 | | 2,361,385 | 2,592,666 |
| 30 Yr Pass Thru | 4.000 | 01-01-42 | | 3,096,173 | 3,414,902 |
| 30 Yr Pass Thru | 4.000 | 05-01-42 | | 5,554,412 | 6,091,484 |
| 30 Yr Pass Thru | 4.000 | 09-01-43 | | 7,388,487 | 8,306,085 |
| 30 Yr Pass Thru | 4.000 | 10-01-43 | | 7,946,385 | 8,836,423 |
| 30 Yr Pass Thru | 4.000 | 10-01-43 | | 3,308,250 | 3,657,081 |
| 30 Yr Pass Thru | 4.000 | 01-01-44 | | 5,715,332 | 6,355,480 |
| 30 Yr Pass Thru | 4.000 | 12-01-45 | | 18,171,519 | 19,877,469 |
| 30 Yr Pass Thru | 4.000 | 02-01-46 | | 11,347,898 | 12,321,042 |
| 30 Yr Pass Thru | 4.000 | 04-01-46 | | 11,607,982 | 12,567,154 |
| 30 Yr Pass Thru | 4.000 | 06-01-46 | | 7,858,977 | 8,508,368 |
| 30 Yr Pass Thru | 4.000 | 07-01-46 | | 19,050,397 | 20,624,539 |
| 30 Yr Pass Thru | 4.000 | 10-01-46 | | 4,540,195 | 4,908,259 |
| 30 Yr Pass Thru | 4.000 | 01-01-47 | | 15,777,839 | 17,129,147 |
| 30 Yr Pass Thru | 4.000 | 03-01-47 | | 24,437,691 | 26,487,534 |
| 30 Yr Pass Thru | 4.000 | 04-01-47 | | 20,737,521 | 22,513,607 |
| 30 Yr Pass Thru | 4.000 | 08-01-47 | | 28,377,800 | 30,403,418 |
| 30 Yr Pass Thru | 4.000 | 11-01-47 | | 7,153,107 | 7,660,792 |
| 30 Yr Pass Thru | 4.000 | 12-01-47 | | 13,491,148 | 14,694,463 |
| 30 Yr Pass Thru | 4.000 | 12-01-47 | | 11,065,439 | 11,855,295 |
| 30 Yr Pass Thru | 4.000 | 07-01-48 | | 21,366,246 | 22,764,516 |
| 30 Yr Pass Thru | 4.000 | 10-01-48 | | 24,829,341 | 26,795,648 |
| 30 Yr Pass Thru | 4.000 | 10-01-48 | | 29,886,820 | 32,468,455 |
| 30 Yr Pass Thru | 4.000 | 01-01-49 | | 19,267,128 | 20,979,598 |
| 30 Yr Pass Thru | 4.000 | 02-01-49 | | 26,001,663 | 28,345,204 |
| 30 Yr Pass Thru | 7.000 | 09-01-31 | | 126 | 148 |
| 30 Yr Pass Thru | 7.000 | 09-01-31 | | 125 | 146 |
| 30 Yr Pass Thru | 7.000 | 09-01-31 | | 1,962 | 2,300 |
| 30 Yr Pass Thru | 7.000 | 01-01-32 | | 81 | 95 |
| 30 Yr Pass Thru | 7.000 | 05-01-32 | | 115 | 137 |
| 30 Yr Pass Thru | 7.000 | 06-01-32 | | 98 | 115 |
| 30 Yr Pass Thru | 7.500 | 09-01-29 | | 53 | 62 |
| 30 Yr Pass Thru | 7.500 | 12-01-29 | | 63 | 73 |
| 30 Yr Pass Thru | 7.500 | 12-01-30 | | 14 | 17 |
| 30 Yr Pass Thru | 7.500 | 01-01-31 | | 27 | 31 |
| 30 Yr Pass Thru | 7.500 | 05-01-31 | | 302 | 357 |
| 30 Yr Pass Thru | 7.500 | 08-01-31 | | 113 | 128 |
| Government National Mortgage Association | | | | | |
| 30 Yr Pass Thru | 5.000 | 04-15-35 | | 3,167 | 3,558 |
| 30 Yr Pass Thru | 5.000 | 04-15-35 | | 1,519 | 1,703 |
| 30 Yr Pass Thru | 5.500 | 03-15-35 | | 3,398 | 3,922 |
| 30 Yr Pass Thru | 6.000 | 03-15-33 | | 2,296 | 2,668 |
| 14 | JOHN HANCOCK BOND FUND | ANNUAL REPORT | SEE NOTES TO FINANCIAL STATEMENTS |
| | Rate (%) | Maturity date | | Par value^ | Value |
| U.S. Government Agency (continued) | | | | |
| 30 Yr Pass Thru | 6.000 | 06-15-33 | | 846 | $978 |
| 30 Yr Pass Thru | 6.500 | 09-15-28 | | 305 | 343 |
| 30 Yr Pass Thru | 6.500 | 09-15-29 | | 149 | 168 |
| 30 Yr Pass Thru | 6.500 | 08-15-31 | | 214 | 245 |
| 30 Yr Pass Thru | 7.000 | 04-15-29 | | 636 | 728 |
|
| 30 Yr Pass Thru | 8.000 | 10-15-26 | | 333 | 373 |
| Foreign government obligations 0.5% | | | | $90,730,932 |
| (Cost $82,133,789) | | | | | |
| Qatar 0.3% | | | | | 48,694,395 |
| State of Qatar | | | | | |
| Bond (C) | 3.375 | 03-14-24 | | 24,739,000 | 26,226,160 |
| Bond (C) | 5.103 | 04-23-48 | | 17,235,000 | 22,468,235 |
| Saudi Arabia 0.2% | | | | | 42,036,537 |
Kingdom of Saudi Arabia
Bond (C) | 4.375 | 04-16-29 | | 36,950,000 | 42,036,537 |
|
| Corporate bonds 51.3% | | | $9,383,457,540 |
| (Cost $9,252,693,219) | | | | | |
| Communication services 6.5% | | | 1,181,055,340 |
| Diversified telecommunication services 1.9% | | | |
| AT&T, Inc. | 2.300 | 06-01-27 | | 16,319,000 | 16,506,382 |
| AT&T, Inc. | 3.400 | 05-15-25 | | 37,878,000 | 40,841,218 |
| AT&T, Inc. | 3.800 | 02-15-27 | | 17,626,000 | 19,258,234 |
| C&W Senior Financing DAC (C) | 6.875 | 09-15-27 | | 15,850,000 | 15,639,037 |
| CenturyLink, Inc. (C) | 4.000 | 02-15-27 | | 7,709,000 | 7,687,415 |
| Cincinnati Bell, Inc. (C) | 7.000 | 07-15-24 | | 22,599,000 | 23,276,970 |
| GCI LLC (C) | 6.625 | 06-15-24 | | 7,997,000 | 8,386,854 |
| GCI LLC | 6.875 | 04-15-25 | | 10,770,000 | 11,187,338 |
| Level 3 Financing, Inc. (C) | 3.400 | 03-01-27 | | 24,679,000 | 24,956,639 |
| Liquid Telecommunications Financing PLC (C) | 8.500 | 07-13-22 | | 12,325,000 | 11,111,287 |
| Radiate Holdco LLC (C) | 6.625 | 02-15-25 | | 16,207,000 | 16,603,909 |
| Telecom Argentina SA (A)(C) | 6.500 | 06-15-21 | | 13,645,000 | 11,925,730 |
| Telecom Argentina SA (A)(C) | 8.000 | 07-18-26 | | 12,621,000 | 10,187,545 |
| Telecom Italia Capital SA | 7.200 | 07-18-36 | | 19,715,000 | 22,573,675 |
| Telecom Italia SpA (C) | 5.303 | 05-30-24 | | 14,935,000 | 15,641,874 |
| Verizon Communications, Inc. | 3.000 | 03-22-27 | | 5,157,000 | 5,616,586 |
| Verizon Communications, Inc. | 4.400 | 11-01-34 | | 16,224,000 | 19,906,654 |
| Verizon Communications, Inc. | 4.862 | 08-21-46 | | 43,995,000 | 59,025,578 |
| Entertainment 0.6% | | | |
| Activision Blizzard, Inc. | 3.400 | 09-15-26 | | 10,623,000 | 11,846,923 |
| Lions Gate Capital Holdings LLC (C) | 5.875 | 11-01-24 | | 14,513,000 | 14,077,610 |
| Lions Gate Capital Holdings LLC (C) | 6.375 | 02-01-24 | | 955,000 | 963,375 |
| Netflix, Inc. | 4.875 | 04-15-28 | | 37,762,000 | 40,310,935 |
| SEE NOTES TO FINANCIAL STATEMENTS | ANNUAL REPORT | JOHN HANCOCK BOND FUND | 15 |
| | Rate (%) | Maturity date | | Par value^ | Value |
| Communication services (continued) | | | |
| Entertainment (continued) | | | |
| Netflix, Inc. (C) | 4.875 | 06-15-30 | | 13,997,000 | $15,111,161 |
| Netflix, Inc. (C) | 5.375 | 11-15-29 | | 5,283,000 | 5,864,658 |
| Netflix, Inc. | 5.875 | 11-15-28 | | 25,458,000 | 28,967,894 |
| Interactive media and services 0.1% | | | |
| Match Group, Inc. (C) | 4.125 | 08-01-30 | | 12,092,000 | 11,850,160 |
| National CineMedia LLC (C) | 5.875 | 04-15-28 | | 8,680,000 | 6,944,000 |
| Twitter, Inc. (C) | 3.875 | 12-15-27 | | 4,401,000 | 4,384,496 |
| Media 2.7% | | | |
| Altice Financing SA (C) | 5.000 | 01-15-28 | | 6,979,000 | 7,037,885 |
| Altice France Holding SA (C) | 10.500 | 05-15-27 | | 4,417,000 | 4,891,828 |
| Charter Communications Operating LLC | 4.200 | 03-15-28 | | 35,014,000 | 38,981,049 |
| Charter Communications Operating LLC | 4.800 | 03-01-50 | | 35,191,000 | 39,186,265 |
| Charter Communications Operating LLC | 5.750 | 04-01-48 | | 41,171,000 | 50,698,084 |
| Charter Communications Operating LLC | 6.484 | 10-23-45 | | 34,584,000 | 44,669,358 |
| Comcast Corp. | 3.100 | 04-01-25 | | 16,117,000 | 17,614,474 |
| Comcast Corp. | 3.999 | 11-01-49 | | 5,054,000 | 5,998,431 |
| Comcast Corp. | 4.049 | 11-01-52 | | 26,296,000 | 31,406,761 |
| Comcast Corp. | 4.150 | 10-15-28 | | 59,960,000 | 70,930,978 |
| CSC Holdings LLC (C) | 5.375 | 02-01-28 | | 7,610,000 | 8,090,381 |
| CSC Holdings LLC (C) | 5.750 | 01-15-30 | | 20,238,000 | 21,351,090 |
| CSC Holdings LLC | 5.875 | 09-15-22 | | 11,420,000 | 12,040,106 |
| CSC Holdings LLC (C) | 7.500 | 04-01-28 | | 11,630,000 | 12,880,225 |
| Diamond Sports Group LLC (C) | 6.625 | 08-15-27 | | 18,960,000 | 11,408,232 |
| LCPR Senior Secured Financing DAC (C) | 6.750 | 10-15-27 | | 9,115,000 | 9,482,973 |
| MDC Partners, Inc. (C) | 6.500 | 05-01-24 | | 25,380,000 | 19,796,400 |
| Meredith Corp. | 6.875 | 02-01-26 | | 2,283,000 | 2,114,629 |
| Sirius XM Radio, Inc. (C) | 5.000 | 08-01-27 | | 22,791,000 | 23,816,595 |
| Sirius XM Radio, Inc. (C) | 5.375 | 07-15-26 | | 11,714,000 | 12,145,954 |
| ViacomCBS, Inc. | 4.750 | 05-15-25 | | 25,902,000 | 28,497,215 |
| WMG Acquisition Corp. (C) | 4.875 | 11-01-24 | | 6,551,000 | 6,632,888 |
| WMG Acquisition Corp. (C) | 5.500 | 04-15-26 | | 9,627,000 | 9,915,810 |
| Wireless telecommunication services 1.2% | | | |
| CC Holdings GS V LLC | 3.849 | 04-15-23 | | 18,984,000 | 20,338,886 |
| Comunicaciones Celulares SA (C) | 6.875 | 02-06-24 | | 8,530,000 | 8,658,035 |
| Millicom International Cellular SA (C) | 5.125 | 01-15-28 | | 4,100,000 | 4,079,500 |
| MTN Mauritius Investments, Ltd. (C) | 4.755 | 11-11-24 | | 12,421,000 | 12,174,486 |
| Oztel Holdings SPC, Ltd. (C) | 6.625 | 04-24-28 | | 12,515,000 | 11,332,937 |
| SoftBank Group Corp. (6.875% to 7-19-27, then 5 Year ICE Swap Rate + 4.854%) (D) | 6.875 | 07-19-27 | | 28,364,000 | 26,865,814 |
| Sprint Corp. | 7.875 | 09-15-23 | | 15,206,000 | 17,258,810 |
| Telefonica Celular del Paraguay SA (C) | 5.875 | 04-15-27 | | 13,556,000 | 13,711,894 |
| T-Mobile USA, Inc. (C) | 3.875 | 04-15-30 | | 34,229,000 | 37,106,974 |
| 16 | JOHN HANCOCK BOND FUND | ANNUAL REPORT | SEE NOTES TO FINANCIAL STATEMENTS |
| | Rate (%) | Maturity date | | Par value^ | Value |
| Communication services (continued) | | | |
| Wireless telecommunication services (continued) | | | |
| T-Mobile USA, Inc. (C) | 4.500 | 04-15-50 | | 19,195,000 | $21,581,514 |
| Vodafone Group PLC (7.000% to 1-4-29, then 5 Year U.S. Swap Rate + 4.873%) | 7.000 | 04-04-79 | | 32,561,000 | 37,704,742 |
| Consumer discretionary 4.9% | | | 889,345,702 |
| Auto components 0.0% | | | |
| Dealer Tire LLC (C) | 8.000 | 02-01-28 | | 6,281,000 | 5,430,553 |
| Automobiles 1.7% | | | |
| BMW US Capital LLC (C) | 2.950 | 04-14-22 | | 8,315,000 | 8,471,335 |
| Daimler Finance North America LLC (C) | 2.700 | 06-14-24 | | 13,695,000 | 13,711,783 |
| Daimler Finance North America LLC (C) | 3.500 | 08-03-25 | | 12,585,000 | 12,976,754 |
| Ford Motor Credit Company LLC | 4.134 | 08-04-25 | | 64,206,000 | 60,046,093 |
| Ford Motor Credit Company LLC | 5.113 | 05-03-29 | | 34,269,000 | 32,000,392 |
| Ford Motor Credit Company LLC | 5.875 | 08-02-21 | | 32,380,000 | 32,460,950 |
| General Motors Financial Company, Inc. | 4.000 | 01-15-25 | | 51,920,000 | 52,326,658 |
| General Motors Financial Company, Inc. | 4.300 | 07-13-25 | | 24,535,000 | 25,051,201 |
| General Motors Financial Company, Inc. | 5.200 | 03-20-23 | | 18,766,000 | 19,535,916 |
| JB Poindexter & Company, Inc. (C) | 7.125 | 04-15-26 | | 5,212,000 | 5,187,921 |
| Mclaren Finance PLC (C) | 5.750 | 08-01-22 | | 5,425,000 | 3,146,500 |
| Nissan Motor Acceptance Corp. (C) | 3.450 | 03-15-23 | | 13,440,000 | 12,379,071 |
| Volkswagen Group of America Finance LLC (C) | 2.900 | 05-13-22 | | 28,242,000 | 28,737,874 |
| Diversified consumer services 0.2% | | | |
| GEMS MENASA Cayman, Ltd. (C) | 7.125 | 07-31-26 | | 6,680,000 | 6,089,889 |
| Laureate Education, Inc. (C) | 8.250 | 05-01-25 | | 8,575,000 | 9,057,344 |
| Sotheby's (A)(C) | 7.375 | 10-15-27 | | 15,799,000 | 14,377,090 |
| Hotels, restaurants and leisure 0.9% | | | |
| CCM Merger, Inc. (A)(C) | 6.000 | 03-15-22 | | 10,775,000 | 10,074,625 |
| Connect Finco SARL (C) | 6.750 | 10-01-26 | | 23,202,000 | 22,505,940 |
| Eldorado Resorts, Inc. | 6.000 | 09-15-26 | | 6,670,000 | 6,970,150 |
| Eldorado Resorts, Inc. | 7.000 | 08-01-23 | | 4,535,000 | 4,569,965 |
| Hilton Domestic Operating Company, Inc. | 4.875 | 01-15-30 | | 10,028,000 | 9,977,860 |
| Hilton Domestic Operating Company, Inc. (C) | 5.750 | 05-01-28 | | 4,667,000 | 4,818,678 |
| International Game Technology PLC (C) | 6.500 | 02-15-25 | | 11,430,000 | 11,777,243 |
| Jacobs Entertainment, Inc. (C) | 7.875 | 02-01-24 | | 11,775,000 | 8,949,000 |
| Resorts World Las Vegas LLC (C) | 4.625 | 04-16-29 | | 16,090,000 | 15,167,454 |
| Starbucks Corp. | 2.250 | 03-12-30 | | 26,460,000 | 26,343,160 |
| Twin River Worldwide Holdings, Inc. (C) | 6.750 | 06-01-27 | | 17,764,000 | 16,564,930 |
| Waterford Gaming LLC (C)(E)(F) | 8.625 | 09-15-14 | | 422,977 | 0 |
| Wyndham Destinations, Inc. (C) | 4.625 | 03-01-30 | | 9,653,000 | 8,349,845 |
| Yum! Brands, Inc. (C) | 4.750 | 01-15-30 | | 12,072,000 | 12,514,077 |
| SEE NOTES TO FINANCIAL STATEMENTS | ANNUAL REPORT | JOHN HANCOCK BOND FUND | 17 |
| | Rate (%) | Maturity date | | Par value^ | Value |
| Consumer discretionary (continued) | | | |
| Internet and direct marketing retail 1.2% | | | |
| Amazon.com, Inc. | 3.150 | 08-22-27 | | 40,614,000 | $46,136,682 |
| Amazon.com, Inc. | 4.050 | 08-22-47 | | 22,762,000 | 29,923,155 |
| Expedia Group, Inc. | 3.250 | 02-15-30 | | 23,593,000 | 21,096,108 |
| Expedia Group, Inc. | 3.800 | 02-15-28 | | 38,185,000 | 35,246,321 |
| Expedia Group, Inc. | 5.000 | 02-15-26 | | 33,757,000 | 34,519,151 |
| Prosus NV (C) | 4.850 | 07-06-27 | | 4,575,000 | 5,069,809 |
| Prosus NV (C) | 5.500 | 07-21-25 | | 19,530,000 | 21,835,674 |
| QVC, Inc. | 4.375 | 03-15-23 | | 19,408,000 | 18,922,800 |
| QVC, Inc. | 5.125 | 07-02-22 | | 8,874,000 | 8,862,908 |
| QVC, Inc. | 5.450 | 08-15-34 | | 10,129,000 | 8,533,683 |
| Multiline retail 0.4% | | | |
| Dollar Tree, Inc. | 4.200 | 05-15-28 | | 45,224,000 | 51,121,685 |
| Macy's, Inc. (C) | 8.375 | 06-15-25 | | 6,259,000 | 6,345,061 |
| Nordstrom, Inc. (C) | 8.750 | 05-15-25 | | 2,499,000 | 2,683,587 |
| Target Corp. | 2.250 | 04-15-25 | | 12,632,000 | 13,463,706 |
| Specialty retail 0.4% | | | |
| Asbury Automotive Group, Inc. (C) | 4.750 | 03-01-30 | | 1,014,000 | 973,440 |
| AutoNation, Inc. | 4.750 | 06-01-30 | | 12,415,000 | 12,925,430 |
| The TJX Companies, Inc. | 3.500 | 04-15-25 | | 21,198,000 | 23,683,401 |
| The TJX Companies, Inc. | 3.875 | 04-15-30 | | 25,962,000 | 30,490,740 |
| Textiles, apparel and luxury goods 0.1% | | | |
| Hanesbrands, Inc. (C) | 5.375 | 05-15-25 | | 6,182,000 | 6,336,550 |
| Levi Strauss & Company (C) | 5.000 | 05-01-25 | | 11,378,000 | 11,605,560 |
| Consumer staples 1.5% | | | 271,938,266 |
| Beverages 0.4% | | | |
| Anheuser-Busch InBev Worldwide, Inc. | 4.600 | 04-15-48 | | 22,485,000 | 24,998,587 |
| Constellation Brands, Inc. | 2.875 | 05-01-30 | | 8,258,000 | 8,557,744 |
| Keurig Dr Pepper, Inc. | 3.200 | 05-01-30 | | 7,793,000 | 8,458,255 |
| The Coca-Cola Company | 4.200 | 03-25-50 | | 17,528,000 | 22,650,961 |
| Food and staples retailing 0.4% | | | |
| Albertsons Companies, Inc. (C) | 4.875 | 02-15-30 | | 7,584,000 | 7,858,920 |
| Alimentation Couche-Tard, Inc. (C) | 2.700 | 07-26-22 | | 15,724,000 | 16,060,676 |
| Dollar General Corp. | 3.500 | 04-03-30 | | 16,383,000 | 18,321,138 |
| Sysco Corp. | 5.950 | 04-01-30 | | 7,575,000 | 9,109,021 |
| The Kroger Company | 2.200 | 05-01-30 | | 13,549,000 | 13,877,500 |
| Food products 0.6% | | | |
| Cargill, Inc. (C) | 1.375 | 07-23-23 | | 10,816,000 | 10,999,890 |
| Cargill, Inc. (C) | 2.125 | 04-23-30 | | 10,774,000 | 10,942,479 |
| JBS Investments II GmbH (C) | 5.750 | 01-15-28 | | 27,194,000 | 27,261,985 |
| Kraft Heinz Foods Company (C) | 3.875 | 05-15-27 | | 1,601,000 | 1,672,648 |
| Kraft Heinz Foods Company (C) | 4.875 | 02-15-25 | | 13,957,000 | 14,296,843 |
| 18 | JOHN HANCOCK BOND FUND | ANNUAL REPORT | SEE NOTES TO FINANCIAL STATEMENTS |
| | Rate (%) | Maturity date | | Par value^ | Value |
| Consumer staples (continued) | | | |
| Food products (continued) | | | |
| Kraft Heinz Foods Company (C) | 5.500 | 06-01-50 | | 11,274,000 | $11,733,344 |
| Lamb Weston Holdings, Inc. (C) | 4.875 | 05-15-28 | | 1,130,000 | 1,183,336 |
| NBM US Holdings, Inc. (A)(C) | 6.625 | 08-06-29 | | 8,240,000 | 8,260,600 |
| Post Holdings, Inc. (C) | 5.500 | 12-15-29 | | 9,872,000 | 10,316,240 |
| Simmons Foods, Inc. (C) | 5.750 | 11-01-24 | | 11,320,000 | 10,584,200 |
| Household products 0.0% | | | |
| Edgewell Personal Care Company (C) | 5.500 | 06-01-28 | | 8,227,000 | 8,525,229 |
| Personal products 0.1% | | | |
| Natura Cosmeticos SA (A)(C) | 5.375 | 02-01-23 | | 19,995,000 | 19,915,020 |
| Walnut Bidco PLC (C) | 9.125 | 08-01-24 | | 6,925,000 | 6,353,650 |
| Energy 4.2% | | | 774,247,458 |
| Energy equipment and services 0.2% | | | |
| CSI Compressco LP | 7.250 | 08-15-22 | | 22,264,000 | 8,432,490 |
| CSI Compressco LP (C) | 7.500 | 04-01-25 | | 20,041,000 | 14,429,520 |
| Inkia Energy, Ltd. (C) | 5.875 | 11-09-27 | | 4,600,000 | 4,462,000 |
| Tervita Corp. (C) | 7.625 | 12-01-21 | | 13,901,000 | 10,738,523 |
| Oil, gas and consumable fuels 4.0% | | | |
| Aker BP ASA (C) | 3.000 | 01-15-25 | | 13,687,000 | 13,218,303 |
| Antero Resources Corp. (A) | 5.000 | 03-01-25 | | 11,643,000 | 6,636,510 |
| Cheniere Energy Partners LP (C) | 4.500 | 10-01-29 | | 26,578,000 | 25,979,995 |
| Cimarex Energy Company | 4.375 | 06-01-24 | | 12,404,000 | 12,569,119 |
| Colorado Interstate Gas Company LLC (C) | 4.150 | 08-15-26 | | 9,460,000 | 10,188,013 |
| DCP Midstream Operating LP | 5.125 | 05-15-29 | | 5,850,000 | 5,323,500 |
| DCP Midstream Operating LP (5.850% to 5-21-23, then 3 month LIBOR + 3.850%) (C) | 5.850 | 05-21-43 | | 13,527,000 | 8,488,193 |
| Enbridge, Inc. (5.500% to 7-15-27, then 3 month LIBOR + 3.418%) | 5.500 | 07-15-77 | | 20,627,000 | 19,014,175 |
| Enbridge, Inc. (6.250% to 3-1-28, then 3 month LIBOR + 3.641%) | 6.250 | 03-01-78 | | 19,207,000 | 18,438,720 |
| Energy Transfer Operating LP | 4.200 | 04-15-27 | | 8,447,000 | 8,644,649 |
| Energy Transfer Operating LP | 4.250 | 03-15-23 | | 27,143,000 | 28,147,175 |
| Energy Transfer Operating LP | 5.150 | 03-15-45 | | 22,139,000 | 21,288,690 |
| Energy Transfer Operating LP | 5.875 | 01-15-24 | | 17,707,000 | 19,332,114 |
| Enterprise Products Operating LLC (5.250% to 8-16-27, then 3 month LIBOR + 3.033%) | 5.250 | 08-16-77 | | 38,773,000 | 34,934,861 |
| Husky Energy, Inc. | 3.950 | 04-15-22 | | 17,036,000 | 17,162,095 |
| Kinder Morgan Energy Partners LP | 7.750 | 03-15-32 | | 14,860,000 | 20,051,783 |
| MPLX LP | 4.000 | 03-15-28 | | 20,580,000 | 21,179,322 |
| MPLX LP | 4.250 | 12-01-27 | | 7,928,000 | 8,304,427 |
| MPLX LP | 5.250 | 01-15-25 | | 11,827,000 | 12,261,872 |
| SEE NOTES TO FINANCIAL STATEMENTS | ANNUAL REPORT | JOHN HANCOCK BOND FUND | 19 |
| | Rate (%) | Maturity date | | Par value^ | Value |
| Energy (continued) | | | |
| Oil, gas and consumable fuels (continued) | | | |
| MPLX LP (6.875% to 2-15-23, then 3 month LIBOR + 4.652%) (A)(D) | 6.875 | 02-15-23 | | 48,906,000 | $41,766,702 |
| Murphy Oil Corp. (A) | 5.750 | 08-15-25 | | 9,531,000 | 8,923,399 |
| ONEOK Partners LP | 4.900 | 03-15-25 | | 8,673,000 | 9,083,758 |
| Petrobras Global Finance BV (C) | 5.093 | 01-15-30 | | 45,050,000 | 42,932,650 |
| Petrobras Global Finance BV | 6.900 | 03-19-49 | | 12,360,000 | 12,311,178 |
| Petroleos Mexicanos | 5.350 | 02-12-28 | | 20,866,000 | 16,998,487 |
| Phillips 66 | 3.700 | 04-06-23 | | 6,205,000 | 6,630,104 |
| Sabine Pass Liquefaction LLC | 4.200 | 03-15-28 | | 15,585,000 | 16,582,297 |
| Sabine Pass Liquefaction LLC | 5.000 | 03-15-27 | | 15,534,000 | 17,238,249 |
| Sabine Pass Liquefaction LLC | 5.875 | 06-30-26 | | 30,826,000 | 35,422,395 |
| Sunoco Logistics Partners Operations LP | 3.900 | 07-15-26 | | 24,214,000 | 24,409,464 |
| Sunoco Logistics Partners Operations LP | 5.400 | 10-01-47 | | 16,846,000 | 16,733,622 |
| Targa Resources Partners LP | 5.875 | 04-15-26 | | 27,952,000 | 28,441,160 |
| Teekay Offshore Partners LP (A)(C) | 8.500 | 07-15-23 | | 17,682,000 | 15,779,240 |
| The Williams Companies, Inc. | 3.750 | 06-15-27 | | 22,804,000 | 24,254,262 |
| The Williams Companies, Inc. | 4.550 | 06-24-24 | | 45,771,000 | 49,619,672 |
| The Williams Companies, Inc. | 5.750 | 06-24-44 | | 7,401,000 | 8,634,816 |
| TransCanada PipeLines, Ltd. | 4.250 | 05-15-28 | | 13,565,000 | 15,383,802 |
| WPX Energy, Inc. | 4.500 | 01-15-30 | | 13,044,000 | 11,959,652 |
| WPX Energy, Inc. | 5.250 | 09-15-24 | | 5,040,000 | 5,002,200 |
| WPX Energy, Inc. | 5.250 | 10-15-27 | | 17,348,000 | 16,914,300 |
| Financials 14.5% | | | 2,657,782,010 |
| Banks 9.0% | | | |
| Australia & New Zealand Banking Group, Ltd. (6.750% to 6-15-26, then 5 Year ICE Swap Rate + 5.168%) (A)(C)(D) | 6.750 | 06-15-26 | | 12,365,000 | 13,686,571 |
| Banco Santander SA | 4.379 | 04-12-28 | | 18,430,000 | 20,149,211 |
| Bank of America Corp. (2.592% to 4-29-30, then SOFR + 2.150%) | 2.592 | 04-29-31 | | 30,889,000 | 31,749,019 |
| Bank of America Corp. | 3.950 | 04-21-25 | | 29,823,000 | 32,584,570 |
| Bank of America Corp. | 4.200 | 08-26-24 | | 13,422,000 | 14,802,123 |
| Bank of America Corp. | 4.450 | 03-03-26 | | 33,850,000 | 38,121,252 |
| Bank of America Corp. (6.300% to 3-10-26, then 3 month LIBOR + 4.553%) (D) | 6.300 | 03-10-26 | | 36,217,000 | 39,657,615 |
| Barclays Bank PLC (C) | 10.179 | 06-12-21 | | 8,040,000 | 8,699,201 |
| Barclays PLC | 4.375 | 01-12-26 | | 15,935,000 | 17,535,081 |
| BPCE SA (C) | 4.500 | 03-15-25 | | 20,836,000 | 22,419,166 |
| BPCE SA (C) | 5.700 | 10-22-23 | | 23,245,000 | 25,502,037 |
| Citigroup, Inc. | 3.200 | 10-21-26 | | 33,754,000 | 36,117,280 |
| Citigroup, Inc. | 4.600 | 03-09-26 | | 40,223,000 | 45,044,520 |
| Citigroup, Inc. (4.700% to 1-30-25, then SOFR + 3.234%) (D) | 4.700 | 01-30-25 | | 29,338,000 | 25,524,060 |
| 20 | JOHN HANCOCK BOND FUND | ANNUAL REPORT | SEE NOTES TO FINANCIAL STATEMENTS |
| | Rate (%) | Maturity date | | Par value^ | Value |
| Financials (continued) | | | |
| Banks (continued) | | | |
| Citigroup, Inc. | 5.500 | 09-13-25 | | 10,901,000 | $12,750,789 |
| Citigroup, Inc. (6.250% to 8-15-26, then 3 month LIBOR + 4.517%) (D) | 6.250 | 08-15-26 | | 25,873,000 | 27,554,745 |
| Citizens Bank NA | 2.250 | 04-28-25 | | 21,654,000 | 22,094,240 |
| Citizens Financial Group, Inc. | 3.250 | 04-30-30 | | 30,743,000 | 31,590,478 |
| Credit Agricole SA (C) | 3.250 | 01-14-30 | | 34,359,000 | 35,612,243 |
| Credit Agricole SA (7.875% to 1-23-24, then 5 Year U.S. Swap Rate + 4.898%) (C)(D) | 7.875 | 01-23-24 | | 18,085,000 | 19,717,699 |
| Danske Bank A/S (C) | 5.000 | 01-12-22 | | 19,629,000 | 20,565,835 |
| Discover Bank | 2.450 | 09-12-24 | | 24,190,000 | 24,232,729 |
| Fifth Third Bancorp | 1.625 | 05-05-23 | | 8,107,000 | 8,254,752 |
| Fifth Third Bancorp (5.100% to 6-30-23, then 3 month LIBOR + 3.033%) (D) | 5.100 | 06-30-23 | | 18,634,000 | 16,630,845 |
| Freedom Mortgage Corp. (C) | 8.125 | 11-15-24 | | 16,277,000 | 15,056,225 |
| Freedom Mortgage Corp. (C) | 8.250 | 04-15-25 | | 5,630,000 | 5,207,750 |
| HSBC Holdings PLC (3.950% to 5-18-23, then 3 month LIBOR + 0.987%) | 3.950 | 05-18-24 | | 37,829,000 | 40,397,603 |
| HSBC Holdings PLC (6.375% to 3-30-25, then 5 Year ICE Swap Rate + 4.368%) (D) | 6.375 | 03-30-25 | | 7,004,000 | 7,069,698 |
| HSBC Holdings PLC (6.875% to 6-1-21, then 5 Year ICE Swap Rate + 5.514%) (A)(D) | 6.875 | 06-01-21 | | 22,840,000 | 23,404,833 |
| ING Bank NV (C) | 5.800 | 09-25-23 | | 1,952,000 | 2,155,837 |
| ING Groep NV | 3.550 | 04-09-24 | | 20,292,000 | 21,750,361 |
| ING Groep NV (6.500% to 4-16-25, then 5 Year U.S. Swap Rate + 4.446%) (D) | 6.500 | 04-16-25 | | 7,245,000 | 7,363,818 |
| JPMorgan Chase & Co. (2.522% to 4-22-30, then SOFR + 2.040%) | 2.522 | 04-22-31 | | 31,844,000 | 32,519,929 |
| JPMorgan Chase & Co. | 2.950 | 10-01-26 | | 37,457,000 | 40,381,685 |
| JPMorgan Chase & Co. (2.956% to 5-13-30, then SOFR + 2.515%) | 2.956 | 05-13-31 | | 30,008,000 | 30,893,119 |
| JPMorgan Chase & Co. (3.960% to 1-29-26, then 3 month LIBOR + 1.245%) | 3.960 | 01-29-27 | | 30,465,000 | 33,963,675 |
| JPMorgan Chase & Co. (4.600% to 2-1-25, then SOFR + 3.125%) (D) | 4.600 | 02-01-25 | | 29,100,000 | 25,805,880 |
| JPMorgan Chase & Co. (6.750% to 2-1-24, then 3 month LIBOR + 3.780%) (D) | 6.750 | 02-01-24 | | 30,309,000 | 32,279,085 |
| Lloyds Banking Group PLC | 4.450 | 05-08-25 | | 50,365,000 | 56,087,239 |
| Lloyds Banking Group PLC (7.500% to 6-27-24, then 5 Year U.S. Swap Rate + 4.760%) (D) | 7.500 | 06-27-24 | | 18,250,000 | 18,637,813 |
| M&T Bank Corp. (5.125% to 11-1-26, then 3 month LIBOR + 3.520%) (D) | 5.125 | 11-01-26 | | 14,920,000 | 14,920,000 |
| SEE NOTES TO FINANCIAL STATEMENTS | ANNUAL REPORT | JOHN HANCOCK BOND FUND | 21 |
| | Rate (%) | Maturity date | | Par value^ | Value |
| Financials (continued) | | | |
| Banks (continued) | | | |
| Manufacturers & Traders Trust Company (3 month LIBOR + 0.640%) (B) | 2.220 | 12-01-21 | | 9,230,000 | $9,137,700 |
| Regions Financial Corp. | 2.250 | 05-18-25 | | 54,364,000 | 55,383,927 |
| Santander Holdings USA, Inc. | 3.244 | 10-05-26 | | 43,601,000 | 43,907,918 |
| Santander Holdings USA, Inc. | 3.400 | 01-18-23 | | 20,887,000 | 21,568,966 |
| Santander Holdings USA, Inc. | 3.450 | 06-02-25 | | 37,428,000 | 37,792,327 |
| Santander Holdings USA, Inc. | 3.500 | 06-07-24 | | 41,420,000 | 43,071,542 |
| Santander Holdings USA, Inc. | 4.400 | 07-13-27 | | 9,667,000 | 10,173,234 |
| Santander UK Group Holdings PLC (C) | 4.750 | 09-15-25 | | 18,879,000 | 19,949,977 |
| Societe Generale SA (7.375% to 9-13-21, then 5 Year U.S. Swap Rate + 6.238%) (C)(D) | 7.375 | 09-13-21 | | 17,145,000 | 17,261,757 |
| The PNC Financial Services Group, Inc. | 2.200 | 11-01-24 | | 33,630,000 | 35,256,593 |
| The PNC Financial Services Group, Inc. | 3.150 | 05-19-27 | | 5,223,000 | 5,758,716 |
| The PNC Financial Services Group, Inc. | 3.500 | 01-23-24 | | 14,588,000 | 15,875,958 |
| The PNC Financial Services Group, Inc. (4.850% to 6-1-23, then 3 month LIBOR + 3.040%) (D) | 4.850 | 06-01-23 | | 15,854,000 | 15,085,398 |
| The PNC Financial Services Group, Inc. (6.750% to 8-1-21, then 3 month LIBOR + 3.678%) (D) | 6.750 | 08-01-21 | | 29,319,000 | 29,412,528 |
| The Royal Bank of Scotland Group PLC (3.754% to 11-1-24, then 5 Year CMT + 2.100%) | 3.754 | 11-01-29 | | 9,658,000 | 9,769,972 |
| The Royal Bank of Scotland Group PLC | 3.875 | 09-12-23 | | 26,092,000 | 27,628,680 |
| The Royal Bank of Scotland Group PLC (8.625% to 8-15-21, then 5 Year U.S. Swap Rate + 7.598%) (D) | 8.625 | 08-15-21 | | 37,157,000 | 38,582,343 |
| The Toronto-Dominion Bank | 3.250 | 03-11-24 | | 28,876,000 | 31,367,908 |
| Wells Fargo & Company (2.188% to 4-30-25, then SOFR + 2.000%) | 2.188 | 04-30-26 | | 52,396,000 | 53,089,665 |
| Wells Fargo & Company (2.393% to 6-2-27, then SOFR + 2.100%) | 2.393 | 06-02-28 | | 34,716,000 | 35,051,199 |
| Wells Fargo & Company (3.068% to 4-30-40, then SOFR + 2.530%) | 3.068 | 04-30-41 | | 24,469,000 | 24,492,814 |
| Wells Fargo & Company (5.875% to 6-15-25, then 3 month LIBOR + 3.990%) (D) | 5.875 | 06-15-25 | | 58,933,000 | 62,699,408 |
| Capital markets 1.8% | | | |
| Ares Capital Corp. | 4.200 | 06-10-24 | | 19,978,000 | 19,113,975 |
| Cantor Fitzgerald LP (C) | 4.875 | 05-01-24 | | 27,559,000 | 28,066,449 |
| Credit Suisse Group AG (C) | 3.574 | 01-09-23 | | 8,054,000 | 8,303,732 |
| Credit Suisse Group AG (7.500% to 7-17-23, then 5 Year U.S. Swap Rate + 4.600%) (C)(D) | 7.500 | 07-17-23 | | 19,450,000 | 19,998,490 |
| 22 | JOHN HANCOCK BOND FUND | ANNUAL REPORT | SEE NOTES TO FINANCIAL STATEMENTS |
| | Rate (%) | Maturity date | | Par value^ | Value |
| Financials (continued) | | | |
| Capital markets (continued) | | | |
| Credit Suisse Group AG (7.500% to 12-11-23, then 5 Year U.S. Swap Rate + 4.598%) (C)(D) | 7.500 | 12-11-23 | | 10,205,000 | $10,957,619 |
| Lazard Group LLC | 4.375 | 03-11-29 | | 14,025,000 | 14,991,086 |
| Macquarie Bank, Ltd. (C) | 3.624 | 06-03-30 | | 16,604,000 | 16,907,335 |
| Macquarie Bank, Ltd. (C) | 4.875 | 06-10-25 | | 21,805,000 | 23,642,069 |
| Morgan Stanley (2.188% to 4-28-25, then SOFR + 1.990%) | 2.188 | 04-28-26 | | 54,083,000 | 55,561,040 |
| Morgan Stanley | 3.875 | 01-27-26 | | 19,085,000 | 21,473,195 |
| Raymond James Financial, Inc. | 4.650 | 04-01-30 | | 8,111,000 | 9,329,433 |
| Stearns Holdings LLC (C) | 5.000 | 11-05-24 | | 63,888 | 38,333 |
| Stifel Financial Corp. | 4.250 | 07-18-24 | | 14,959,000 | 15,718,148 |
| The Bank of New York Mellon Corp. | 1.600 | 04-24-25 | | 20,479,000 | 21,194,156 |
| The Goldman Sachs Group, Inc. | 3.850 | 01-26-27 | | 51,756,000 | 57,021,670 |
| UBS Group AG (7.000% to 1-31-24, then 5 Year U.S. Swap Rate + 4.344%) (C)(D) | 7.000 | 01-31-24 | | 16,288,000 | 16,771,754 |
| Consumer finance 0.9% | | | |
| Ally Financial, Inc. | 5.125 | 09-30-24 | | 33,892,000 | 35,269,032 |
| Ally Financial, Inc. | 5.800 | 05-01-25 | | 16,524,000 | 18,064,367 |
| Capital One Financial Corp. | 2.600 | 05-11-23 | | 12,943,000 | 13,290,472 |
| Capital One Financial Corp. | 3.900 | 01-29-24 | | 15,290,000 | 16,235,701 |
| Credito Real SAB de CV (9.125% to 11-29-22, then 5 Year CMT + 7.026%) (C)(D) | 9.125 | 11-29-22 | | 9,375,000 | 7,218,844 |
| Discover Financial Services | 3.950 | 11-06-24 | | 31,439,000 | 33,302,431 |
| Discover Financial Services | 4.100 | 02-09-27 | | 8,552,000 | 8,964,927 |
| Enova International, Inc. (C) | 8.500 | 09-01-24 | | 3,051,000 | 2,585,723 |
| Enova International, Inc. (C) | 8.500 | 09-15-25 | | 15,597,000 | 13,296,443 |
| Springleaf Finance Corp. | 6.875 | 03-15-25 | | 5,750,000 | 5,676,400 |
| Springleaf Finance Corp. | 8.875 | 06-01-25 | | 7,187,000 | 7,474,480 |
| Diversified financial services 1.0% | | | |
| Allied Universal Holdco LLC (C) | 6.625 | 07-15-26 | | 7,548,000 | 7,925,400 |
| GE Capital International Funding Company Unlimited Company | 4.418 | 11-15-35 | | 36,402,000 | 36,344,965 |
| Gogo Intermediate Holdings LLC (C) | 9.875 | 05-01-24 | | 10,941,000 | 10,145,480 |
| Jefferies Financial Group, Inc. | 5.500 | 10-18-23 | | 18,076,000 | 19,455,246 |
| Jefferies Group LLC | 4.150 | 01-23-30 | | 23,760,000 | 23,867,925 |
| Jefferies Group LLC | 4.850 | 01-15-27 | | 25,592,000 | 27,415,803 |
| Operadora de Servicios Mega SA de CV (C) | 8.250 | 02-11-25 | | 10,104,000 | 8,676,810 |
| Refinitiv US Holdings, Inc. (C) | 6.250 | 05-15-26 | | 2,370,000 | 2,529,975 |
| Refinitiv US Holdings, Inc. (C) | 8.250 | 11-15-26 | | 3,750,000 | 4,096,875 |
| Trident TPI Holdings, Inc. (C) | 6.625 | 11-01-25 | | 4,032,000 | 3,588,480 |
| SEE NOTES TO FINANCIAL STATEMENTS | ANNUAL REPORT | JOHN HANCOCK BOND FUND | 23 |
| | Rate (%) | Maturity date | | Par value^ | Value |
| Financials (continued) | | | |
| Diversified financial services (continued) | | | |
| Voya Financial, Inc. (5.650% to 5-15-23, then 3 month LIBOR + 3.580%) | 5.650 | 05-15-53 | | 31,340,000 | $31,073,923 |
| Insurance 1.4% | | | |
| AXA SA | 8.600 | 12-15-30 | | 9,222,000 | 13,062,179 |
| Brighthouse Financial, Inc. | 3.700 | 06-22-27 | | 37,858,000 | 37,160,943 |
| CNO Financial Group, Inc. | 5.250 | 05-30-25 | | 10,445,000 | 11,403,168 |
| CNO Financial Group, Inc. | 5.250 | 05-30-29 | | 25,844,000 | 26,890,349 |
| Liberty Mutual Group, Inc. (C) | 3.951 | 10-15-50 | | 25,053,000 | 25,544,891 |
| MetLife, Inc. (6.400% to 12-15-36, then 3 month LIBOR + 2.205%) | 6.400 | 12-15-36 | | 21,462,000 | 24,873,170 |
| MetLife, Inc. (9.250% to 4-8-38, then 3 month LIBOR + 5.540%) (C) | 9.250 | 04-08-38 | | 6,634,000 | 9,188,090 |
| New York Life Insurance Company (C) | 3.750 | 05-15-50 | | 13,283,000 | 14,915,540 |
| Nippon Life Insurance Company (5.100% to 10-16-24, then 5 Year ICE Swap Rate + 3.650%) (C) | 5.100 | 10-16-44 | | 20,670,000 | 22,737,000 |
| Prudential Financial, Inc. (5.875% to 9-15-22, then 3 month LIBOR + 4.175%) | 5.875 | 09-15-42 | | 44,481,000 | 47,296,647 |
| Teachers Insurance & Annuity Association of America (C) | 4.270 | 05-15-47 | | 23,451,000 | 27,571,026 |
| Thrifts and mortgage finance 0.4% | | | |
| Ladder Capital Finance Holdings LLLP (C) | 5.250 | 03-15-22 | | 3,415,000 | 3,193,025 |
| Ladder Capital Finance Holdings LLLP (C) | 5.250 | 10-01-25 | | 7,705,000 | 6,549,250 |
| MGIC Investment Corp. | 5.750 | 08-15-23 | | 7,286,000 | 7,395,290 |
| Nationstar Mortgage Holdings, Inc. (C) | 6.000 | 01-15-27 | | 5,041,000 | 4,536,900 |
| Nationstar Mortgage Holdings, Inc. (C) | 8.125 | 07-15-23 | | 8,821,000 | 8,997,420 |
| Nationstar Mortgage Holdings, Inc. (C) | 9.125 | 07-15-26 | | 7,037,000 | 7,212,925 |
| Nationwide Building Society (3.622% to 4-26-22, then 3 month LIBOR + 1.181%) (C) | 3.622 | 04-26-23 | | 18,230,000 | 18,768,480 |
| Quicken Loans LLC (C) | 5.750 | 05-01-25 | | 15,960,000 | 16,279,200 |
| Radian Group, Inc. | 4.500 | 10-01-24 | | 7,901,000 | 7,809,190 |
| Health care 3.1% | | | 560,961,029 |
| Biotechnology 0.6% | | | |
| AbbVie, Inc. (C) | 3.200 | 11-21-29 | | 47,261,000 | 50,638,160 |
| AbbVie, Inc. (C) | 4.250 | 11-21-49 | | 13,743,000 | 15,744,857 |
| Shire Acquisitions Investments Ireland DAC | 3.200 | 09-23-26 | | 33,459,000 | 36,937,398 |
| Health care equipment and supplies 0.0% | | | |
| Baxter International, Inc. (C) | 3.950 | 04-01-30 | | 3,594,000 | 4,235,097 |
| Health care providers and services 2.0% | | | |
| AmerisourceBergen Corp. | 2.800 | 05-15-30 | | 23,074,000 | 23,624,626 |
| Anthem, Inc. | 2.375 | 01-15-25 | | 6,513,000 | 6,845,246 |
| 24 | JOHN HANCOCK BOND FUND | ANNUAL REPORT | SEE NOTES TO FINANCIAL STATEMENTS |
| | Rate (%) | Maturity date | | Par value^ | Value |
| Health care (continued) | | | |
| Health care providers and services (continued) | | | |
| Centene Corp. | 3.375 | 02-15-30 | | 8,535,000 | $8,594,745 |
| Centene Corp. | 4.250 | 12-15-27 | | 6,147,000 | 6,421,279 |
| Centene Corp. | 4.625 | 12-15-29 | | 6,865,000 | 7,390,173 |
| Centene Corp. (C) | 5.375 | 06-01-26 | | 16,963,000 | 17,938,373 |
| CVS Health Corp. | 3.000 | 08-15-26 | | 5,073,000 | 5,540,989 |
| CVS Health Corp. | 3.750 | 04-01-30 | | 19,223,000 | 21,514,091 |
| CVS Health Corp. | 4.300 | 03-25-28 | | 25,350,000 | 28,904,936 |
| CVS Health Corp. | 5.050 | 03-25-48 | | 26,664,000 | 34,232,642 |
| DaVita, Inc. (C) | 4.625 | 06-01-30 | | 18,547,000 | 18,500,633 |
| DaVita, Inc. | 5.000 | 05-01-25 | | 29,189,000 | 29,955,211 |
| Encompass Health Corp. | 4.500 | 02-01-28 | | 8,919,000 | 9,052,785 |
| HCA, Inc. | 4.125 | 06-15-29 | | 12,534,000 | 13,614,316 |
| HCA, Inc. | 5.250 | 04-15-25 | | 20,376,000 | 23,114,471 |
| HCA, Inc. | 5.250 | 06-15-26 | | 18,243,000 | 20,766,320 |
| MEDNAX, Inc. (A)(C) | 5.250 | 12-01-23 | | 13,806,000 | 13,529,880 |
| MEDNAX, Inc. (C) | 6.250 | 01-15-27 | | 12,515,000 | 11,701,525 |
| Rede D'or Finance Sarl (C) | 4.500 | 01-22-30 | | 16,474,000 | 13,796,975 |
| Select Medical Corp. (C) | 6.250 | 08-15-26 | | 15,024,000 | 15,793,980 |
| Team Health Holdings, Inc. (A)(C) | 6.375 | 02-01-25 | | 3,197,000 | 1,774,015 |
| Universal Health Services, Inc. (C) | 4.750 | 08-01-22 | | 17,830,000 | 17,830,000 |
| Universal Health Services, Inc. (C) | 5.000 | 06-01-26 | | 15,554,000 | 15,942,850 |
| Life sciences tools and services 0.0% | | | |
| Charles River Laboratories International, Inc. (C) | 4.250 | 05-01-28 | | 3,981,000 | 4,014,600 |
| Pharmaceuticals 0.5% | | | |
| Bausch Health Companies, Inc. (C) | 5.250 | 01-30-30 | | 9,478,000 | 9,312,135 |
| Bausch Health Companies, Inc. (C) | 6.125 | 04-15-25 | | 21,930,000 | 22,254,345 |
| Bausch Health Companies, Inc. (C) | 6.250 | 02-15-29 | | 19,740,000 | 20,233,500 |
| Catalent Pharma Solutions, Inc. (C) | 5.000 | 07-15-27 | | 3,705,000 | 3,797,625 |
| GlaxoSmithKline Capital PLC | 3.000 | 06-01-24 | | 25,294,000 | 27,413,251 |
| Industrials 5.7% | | | 1,049,278,688 |
| Aerospace and defense 1.1% | | | |
| Howmet Aerospace, Inc. | 5.125 | 10-01-24 | | 18,793,000 | 19,073,059 |
| Huntington Ingalls Industries, Inc. (C) | 3.844 | 05-01-25 | | 5,163,000 | 5,552,425 |
| Huntington Ingalls Industries, Inc. (C) | 4.200 | 05-01-30 | | 12,968,000 | 14,039,007 |
| Huntington Ingalls Industries, Inc. (C) | 5.000 | 11-15-25 | | 21,100,000 | 21,735,474 |
| Kratos Defense & Security Solutions, Inc. (C) | 6.500 | 11-30-25 | | 11,995,000 | 12,324,863 |
| The Boeing Company | 3.200 | 03-01-29 | | 38,178,000 | 36,103,614 |
| The Boeing Company | 4.875 | 05-01-25 | | 27,593,000 | 29,286,448 |
| The Boeing Company | 5.805 | 05-01-50 | | 27,011,000 | 30,574,278 |
| TransDigm, Inc. (C) | 5.500 | 11-15-27 | | 35,928,000 | 32,604,660 |
| SEE NOTES TO FINANCIAL STATEMENTS | ANNUAL REPORT | JOHN HANCOCK BOND FUND | 25 |
| | Rate (%) | Maturity date | | Par value^ | Value |
| Industrials (continued) | | | |
| Air freight and logistics 0.2% | | | |
| United Parcel Service, Inc. | 3.900 | 04-01-25 | | 17,934,000 | $20,382,421 |
| XPO Logistics, Inc. (C) | 6.250 | 05-01-25 | | 2,025,000 | 2,113,290 |
| XPO Logistics, Inc. (C) | 6.500 | 06-15-22 | | 11,266,000 | 11,280,083 |
| Airlines 1.7% | | | |
| Air Canada 2013-1 Class A Pass Through Trust (C) | 4.125 | 05-15-25 | | 10,353,252 | 9,421,460 |
| Air Canada 2017-1 Class B Pass Through Trust (C) | 3.700 | 01-15-26 | | 12,861,607 | 8,366,249 |
| America West Airlines 2000-1 Pass Through Trust | 8.057 | 07-02-20 | | 441,869 | 434,410 |
| American Airlines 2001-1 Pass Through Trust | 6.977 | 05-23-21 | | 994,675 | 968,493 |
| American Airlines 2013-2 Class A Pass Through Trust | 4.950 | 01-15-23 | | 17,725,642 | 13,826,000 |
| American Airlines 2015-1 Class A Pass Through Trust | 3.375 | 05-01-27 | | 19,563,331 | 15,164,835 |
| American Airlines 2015-1 Class B Pass Through Trust | 3.700 | 05-01-23 | | 6,236,092 | 3,585,753 |
| American Airlines 2016-1 Class A Pass Through Trust | 4.100 | 01-15-28 | | 23,834,498 | 16,088,286 |
| American Airlines 2017-1 Class A Pass Through Trust | 4.000 | 02-15-29 | | 7,600,038 | 5,244,026 |
| American Airlines 2017-1 Class AA Pass Through Trust | 3.650 | 02-15-29 | | 17,599,863 | 16,279,873 |
| American Airlines 2017-2 Class A Pass Through Trust | 3.600 | 10-15-29 | | 8,788,244 | 6,151,771 |
| American Airlines 2019-1 Class A Pass Through Trust | 3.500 | 02-15-32 | | 10,224,121 | 6,747,920 |
| American Airlines 2019-1 Class AA Pass Through Trust | 3.150 | 02-15-32 | | 17,170,497 | 15,024,185 |
| British Airways 2013-1 Class A Pass Through Trust (C) | 4.625 | 06-20-24 | | 13,319,973 | 12,121,176 |
| British Airways 2013-1 Class B Pass Through Trust (C) | 5.625 | 06-20-20 | | 191,905 | 191,687 |
| British Airways 2018-1 Class A Pass Through Trust (C) | 4.125 | 09-20-31 | | 8,784,231 | 7,011,330 |
| Continental Airlines 2007-1 Class A Pass Through Trust | 5.983 | 04-19-22 | | 7,473,270 | 6,501,745 |
| Delta Air Lines 2002-1 Class G-1 Pass Through Trust | 6.718 | 01-02-23 | | 4,482,111 | 4,258,573 |
| Delta Air Lines, Inc. | 2.900 | 10-28-24 | | 33,754,000 | 27,364,844 |
| Delta Air Lines, Inc. | 3.800 | 04-19-23 | | 20,679,000 | 18,365,400 |
| Delta Air Lines, Inc. (A) | 4.375 | 04-19-28 | | 25,250,000 | 20,515,759 |
| JetBlue 2019-1 Class AA Pass Through Trust | 2.750 | 05-15-32 | | 18,434,457 | 16,712,669 |
| United Airlines 2014-2 Class A Pass Through Trust | 3.750 | 09-03-26 | | 22,402,174 | 19,603,141 |
| 26 | JOHN HANCOCK BOND FUND | ANNUAL REPORT | SEE NOTES TO FINANCIAL STATEMENTS |
| | Rate (%) | Maturity date | | Par value^ | Value |
| Industrials (continued) | | | |
| Airlines (continued) | | | |
| United Airlines 2014-2 Class B Pass Through Trust | 4.625 | 09-03-22 | | 9,185,983 | $7,682,031 |
| United Airlines 2016-1 Class A Pass Through Trust | 3.450 | 07-07-28 | | 19,044,974 | 13,905,472 |
| United Airlines 2016-1 Class B Pass Through Trust | 3.650 | 01-07-26 | | 25,275,463 | 16,517,965 |
| United Airlines 2018-1 Class B Pass Through Trust | 4.600 | 03-01-26 | | 6,720,951 | 4,452,196 |
| United Airlines 2019-1 Class A Pass Through Trust | 4.550 | 08-25-31 | | 15,276,477 | 11,346,525 |
| US Airways 2010-1 Class A Pass Through Trust | 6.250 | 04-22-23 | | 3,898,493 | 3,177,272 |
| US Airways 2012-1 Class A Pass Through Trust | 5.900 | 10-01-24 | | 5,988,509 | 4,970,462 |
| Building products 0.4% | | | |
| Builders FirstSource, Inc. (C) | 5.000 | 03-01-30 | | 2,354,000 | 2,206,875 |
| Builders FirstSource, Inc. (C) | 6.750 | 06-01-27 | | 3,811,000 | 4,011,078 |
| Carrier Global Corp. (C) | 2.242 | 02-15-25 | | 27,457,000 | 27,499,144 |
| Carrier Global Corp. (C) | 2.493 | 02-15-27 | | 11,038,000 | 10,705,912 |
| Carrier Global Corp. (C) | 2.722 | 02-15-30 | | 11,008,000 | 10,495,845 |
| Owens Corning (A) | 3.950 | 08-15-29 | | 19,555,000 | 20,604,202 |
| Commercial services and supplies 0.3% | | | |
| APX Group, Inc. (A) | 7.625 | 09-01-23 | | 19,027,000 | 17,314,570 |
| Cimpress PLC (C) | 7.000 | 06-15-26 | | 6,781,000 | 6,543,665 |
| Clean Harbors, Inc. (C) | 4.875 | 07-15-27 | | 2,960,000 | 3,063,600 |
| Harsco Corp. (C) | 5.750 | 07-31-27 | | 5,035,000 | 4,927,704 |
| IAA, Inc. (C) | 5.500 | 06-15-27 | | 835,000 | 847,525 |
| LSC Communications, Inc. (C)(E) | 8.750 | 10-15-23 | | 19,591,000 | 1,371,370 |
| Prime Security Services Borrower LLC (C) | 6.250 | 01-15-28 | | 11,195,000 | 10,607,263 |
| Construction and engineering 0.2% | | | |
| AECOM | 5.125 | 03-15-27 | | 22,537,000 | 23,913,109 |
| Tutor Perini Corp. (A)(C) | 6.875 | 05-01-25 | | 3,182,000 | 2,800,160 |
| Industrial conglomerates 0.6% | | | |
| 3M Company | 3.250 | 02-14-24 | | 27,037,000 | 29,384,754 |
| DuPont de Nemours, Inc. | 2.169 | 05-01-23 | | 20,832,000 | 21,251,705 |
| General Electric Company | 4.350 | 05-01-50 | | 26,915,000 | 26,148,019 |
| General Electric Company | 5.550 | 01-05-26 | | 33,170,000 | 36,817,020 |
| Machinery 0.1% | | | |
| Clark Equipment Company (C) | 5.875 | 06-01-25 | | 2,336,000 | 2,409,000 |
| Otis Worldwide Corp. (C) | 2.056 | 04-05-25 | | 21,531,000 | 22,215,670 |
| Professional services 0.2% | | | |
| IHS Markit, Ltd. (C) | 4.000 | 03-01-26 | | 18,580,000 | 19,850,872 |
| IHS Markit, Ltd. (C) | 4.750 | 02-15-25 | | 8,486,000 | 9,242,527 |
| SEE NOTES TO FINANCIAL STATEMENTS | ANNUAL REPORT | JOHN HANCOCK BOND FUND | 27 |
| | Rate (%) | Maturity date | | Par value^ | Value |
| Industrials (continued) | | | |
| Professional services (continued) | | | |
| IHS Markit, Ltd. | 4.750 | 08-01-28 | | 12,135,000 | $13,910,472 |
| Road and rail 0.2% | | | |
| Uber Technologies, Inc. (C) | 7.500 | 05-15-25 | | 15,524,000 | 15,407,570 |
| Uber Technologies, Inc. (C) | 7.500 | 09-15-27 | | 26,411,000 | 26,807,165 |
| Trading companies and distributors 0.7% | | | |
| AerCap Ireland Capital DAC | 2.875 | 08-14-24 | | 26,469,000 | 22,333,595 |
| Ahern Rentals, Inc. (C) | 7.375 | 05-15-23 | | 19,991,000 | 8,696,085 |
| Air Lease Corp. | 3.625 | 12-01-27 | | 10,511,000 | 9,319,610 |
| Aircastle, Ltd. | 5.500 | 02-15-22 | | 13,545,000 | 12,731,780 |
| Ashtead Capital, Inc. (C) | 4.250 | 11-01-29 | | 8,614,000 | 8,527,860 |
| Ashtead Capital, Inc. (C) | 4.375 | 08-15-27 | | 15,640,000 | 15,796,400 |
| Avolon Holdings Funding, Ltd. (C) | 5.125 | 10-01-23 | | 15,195,000 | 12,841,770 |
| H&E Equipment Services, Inc. | 5.625 | 09-01-25 | | 7,015,000 | 6,855,689 |
| United Rentals North America, Inc. (A) | 3.875 | 11-15-27 | | 11,931,000 | 11,960,828 |
| United Rentals North America, Inc. | 4.875 | 01-15-28 | | 22,117,000 | 22,787,145 |
| Information technology 6.1% | | | 1,109,007,493 |
| Communications equipment 0.6% | | | |
| CommScope, Inc. (A)(C) | 8.250 | 03-01-27 | | 22,177,000 | 23,119,523 |
| Motorola Solutions, Inc. | 4.600 | 02-23-28 | | 36,543,000 | 40,279,373 |
| Motorola Solutions, Inc. | 4.600 | 05-23-29 | | 6,509,000 | 7,266,755 |
| Telefonaktiebolaget LM Ericsson | 4.125 | 05-15-22 | | 29,836,000 | 31,104,030 |
| Electronic equipment, instruments and components 0.1% | | | |
| Tech Data Corp. | 3.700 | 02-15-22 | | 12,352,000 | 12,384,988 |
| IT services 0.4% | | | |
| PayPal Holdings, Inc. | 2.850 | 10-01-29 | | 35,754,000 | 38,560,364 |
| Tempo Acquisition LLC (C) | 6.750 | 06-01-25 | | 6,270,000 | 6,238,650 |
| VeriSign, Inc. | 4.750 | 07-15-27 | | 8,417,000 | 8,790,546 |
| VeriSign, Inc. | 5.250 | 04-01-25 | | 9,850,000 | 10,820,619 |
| Visa, Inc. | 2.700 | 04-15-40 | | 10,595,000 | 11,233,903 |
| Semiconductors and semiconductor equipment 3.4% | | | |
| Applied Materials, Inc. | 1.750 | 06-01-30 | | 12,819,000 | 12,809,206 |
| Applied Materials, Inc. | 2.750 | 06-01-50 | | 14,855,000 | 14,802,101 |
| Broadcom Corp. | 3.125 | 01-15-25 | | 15,770,000 | 16,302,761 |
| Broadcom Corp. | 3.875 | 01-15-27 | | 54,160,000 | 56,984,748 |
| Broadcom, Inc. (C) | 4.700 | 04-15-25 | | 27,183,000 | 29,790,014 |
| Broadcom, Inc. (C) | 4.750 | 04-15-29 | | 30,967,000 | 33,925,963 |
| Broadcom, Inc. (C) | 5.000 | 04-15-30 | | 32,593,000 | 35,980,646 |
| KLA Corp. | 4.100 | 03-15-29 | | 18,142,000 | 20,963,779 |
| Lam Research Corp. | 3.750 | 03-15-26 | | 19,502,000 | 22,079,403 |
| Lam Research Corp. | 4.875 | 03-15-49 | | 17,074,000 | 22,834,951 |
| Marvell Technology Group, Ltd. | 4.875 | 06-22-28 | | 26,969,000 | 30,084,870 |
| 28 | JOHN HANCOCK BOND FUND | ANNUAL REPORT | SEE NOTES TO FINANCIAL STATEMENTS |
| | Rate (%) | Maturity date | | Par value^ | Value |
| Information technology (continued) | | | |
| Semiconductors and semiconductor equipment (continued) | | | |
| Microchip Technology, Inc. (C) | 4.250 | 09-01-25 | | 5,622,000 | $5,660,279 |
| Microchip Technology, Inc. | 4.333 | 06-01-23 | | 52,404,000 | 54,886,151 |
| Micron Technology, Inc. | 2.497 | 04-24-23 | | 29,815,000 | 30,525,440 |
| Micron Technology, Inc. | 4.185 | 02-15-27 | | 50,713,000 | 56,065,541 |
| Micron Technology, Inc. | 4.975 | 02-06-26 | | 11,033,000 | 12,390,939 |
| Micron Technology, Inc. | 5.327 | 02-06-29 | | 46,504,000 | 53,636,659 |
| NVIDIA Corp. | 2.850 | 04-01-30 | | 20,361,000 | 22,371,135 |
| NXP BV (C) | 3.400 | 05-01-30 | | 7,628,000 | 7,925,627 |
| NXP BV (C) | 3.875 | 06-18-26 | | 17,720,000 | 19,138,874 |
| NXP BV (C) | 4.625 | 06-01-23 | | 34,555,000 | 37,250,672 |
| NXP BV (C) | 4.875 | 03-01-24 | | 20,606,000 | 22,785,539 |
| Qorvo, Inc. | 5.500 | 07-15-26 | | 7,029,000 | 7,362,878 |
| Software 0.8% | | | |
| Autodesk, Inc. | 2.850 | 01-15-30 | | 10,308,000 | 10,976,051 |
| Citrix Systems, Inc. | 3.300 | 03-01-30 | | 26,793,000 | 27,581,925 |
| Microsoft Corp. | 4.450 | 11-03-45 | | 19,750,000 | 27,113,102 |
| Oracle Corp. | 2.950 | 04-01-30 | | 44,602,000 | 48,938,626 |
| PTC, Inc. (C) | 4.000 | 02-15-28 | | 3,903,000 | 3,903,000 |
| VMware, Inc. | 4.500 | 05-15-25 | | 21,304,000 | 22,912,834 |
| Technology hardware, storage and peripherals 0.8% | | | |
| Dell International LLC (C) | 4.900 | 10-01-26 | | 32,167,000 | 34,759,487 |
| Dell International LLC (C) | 5.300 | 10-01-29 | | 30,959,000 | 33,657,951 |
| Dell International LLC (C) | 5.850 | 07-15-25 | | 9,498,000 | 10,630,754 |
| Dell International LLC (C) | 8.350 | 07-15-46 | | 21,793,000 | 27,624,051 |
| Seagate HDD Cayman | 4.750 | 01-01-25 | | 22,665,000 | 24,097,447 |
| Western Digital Corp. (A) | 4.750 | 02-15-26 | | 19,435,000 | 20,455,338 |
| Materials 1.7% | | | 316,802,957 |
| Chemicals 0.6% | | | |
| Cydsa SAB de CV (A)(C) | 6.250 | 10-04-27 | | 20,300,000 | 19,412,078 |
| EI du Pont de Nemours and Company | 1.700 | 07-15-25 | | 10,649,000 | 10,911,283 |
| Methanex Corp. | 4.250 | 12-01-24 | | 16,269,000 | 14,998,666 |
| Methanex Corp. | 5.250 | 12-15-29 | | 20,868,000 | 18,220,841 |
| Orbia Advance Corp. SAB de CV (C) | 5.500 | 01-15-48 | | 17,715,000 | 17,692,856 |
| Syngenta Finance NV (C) | 4.441 | 04-24-23 | | 25,735,000 | 26,410,816 |
| Syngenta Finance NV (C) | 5.676 | 04-24-48 | | 8,210,000 | 7,739,176 |
| Construction materials 0.2% | | | |
| Cemex SAB de CV (A)(C) | 6.125 | 05-05-25 | | 15,185,000 | 15,063,520 |
| Standard Industries, Inc. (C) | 5.000 | 02-15-27 | | 3,699,000 | 3,808,379 |
| Vulcan Materials Company | 3.500 | 06-01-30 | | 16,266,000 | 17,129,554 |
| Containers and packaging 0.2% | | | |
| Ardagh Packaging Finance PLC (C) | 6.000 | 02-15-25 | | 14,410,000 | 14,855,990 |
| SEE NOTES TO FINANCIAL STATEMENTS | ANNUAL REPORT | JOHN HANCOCK BOND FUND | 29 |
| | Rate (%) | Maturity date | | Par value^ | Value |
| Materials (continued) | | | |
| Containers and packaging (continued) | | | |
| Mauser Packaging Solutions Holding Company (C) | 8.500 | 04-15-24 | | 2,721,000 | $2,748,210 |
| Owens-Brockway Glass Container, Inc. (C) | 6.625 | 05-13-27 | | 8,687,000 | 9,143,068 |
| Metals and mining 0.3% | | | |
| Anglo American Capital PLC (C) | 4.750 | 04-10-27 | | 13,375,000 | 14,266,756 |
| Arconic Corp. (C) | 6.000 | 05-15-25 | | 5,802,000 | 6,011,162 |
| Arconic Corp. (C) | 6.125 | 02-15-28 | | 2,748,000 | 2,672,430 |
| Commercial Metals Company | 5.375 | 07-15-27 | | 5,017,000 | 5,043,991 |
| First Quantum Minerals, Ltd. (C) | 6.875 | 03-01-26 | | 9,625,000 | 8,518,125 |
| First Quantum Minerals, Ltd. (C) | 7.250 | 04-01-23 | | 5,714,000 | 5,283,736 |
| First Quantum Minerals, Ltd. (C) | 7.500 | 04-01-25 | | 11,526,000 | 10,459,845 |
| Newmont Corp. | 2.800 | 10-01-29 | | 10,482,000 | 10,904,187 |
| Paper and forest products 0.4% | | | |
| Georgia-Pacific LLC (C) | 2.300 | 04-30-30 | | 53,870,000 | 55,029,278 |
| Inversiones CMPC SA (C) | 3.850 | 01-13-30 | | 8,078,000 | 8,078,000 |
| Norbord, Inc. (C) | 6.250 | 04-15-23 | | 5,540,000 | 5,595,400 |
| Suzano Austria GmbH | 6.000 | 01-15-29 | | 6,460,000 | 6,805,610 |
| Real estate 1.7% | | | 306,859,235 |
| Equity real estate investment trusts 1.7% | | | |
| American Homes 4 Rent LP | 4.250 | 02-15-28 | | 23,420,000 | 23,034,747 |
| American Tower Corp. | 2.400 | 03-15-25 | | 15,758,000 | 16,486,049 |
| American Tower Corp. | 2.950 | 01-15-25 | | 16,023,000 | 17,123,274 |
| American Tower Corp. | 3.550 | 07-15-27 | | 37,802,000 | 41,452,067 |
| American Tower Corp. | 3.800 | 08-15-29 | | 13,623,000 | 15,253,911 |
| Crown Castle International Corp. | 3.300 | 07-01-30 | | 5,834,000 | 6,310,659 |
| Crown Castle International Corp. | 4.150 | 07-01-50 | | 5,181,000 | 5,949,152 |
| CyrusOne LP | 3.450 | 11-15-29 | | 19,636,000 | 19,399,975 |
| Equinix, Inc. | 3.200 | 11-18-29 | | 30,281,000 | 32,588,109 |
| Equinix, Inc. | 5.375 | 05-15-27 | | 13,021,000 | 14,018,669 |
| GLP Capital LP | 5.375 | 04-15-26 | | 18,856,000 | 18,856,000 |
| SBA Communications Corp. (C) | 3.875 | 02-15-27 | | 20,694,000 | 21,012,688 |
| SBA Tower Trust (C) | 2.836 | 01-15-25 | | 22,481,000 | 23,128,995 |
| SBA Tower Trust (C) | 3.722 | 04-11-23 | | 26,799,000 | 27,271,129 |
| The GEO Group, Inc. | 6.000 | 04-15-26 | | 4,171,000 | 3,253,380 |
| Ventas Realty LP | 3.500 | 02-01-25 | | 19,079,000 | 18,991,831 |
| VICI Properties LP (C) | 4.625 | 12-01-29 | | 2,735,000 | 2,728,600 |
| Utilities 1.4% | | | 266,179,362 |
| Electric utilities 0.7% | | | |
| ABY Transmision Sur SA (C) | 6.875 | 04-30-43 | | 10,682,833 | 13,460,370 |
| Emera US Finance LP | 3.550 | 06-15-26 | | 12,717,000 | 13,833,186 |
| Empresa Electrica Angamos SA (C) | 4.875 | 05-25-29 | | 8,748,350 | 8,882,900 |
| 30 | JOHN HANCOCK BOND FUND | ANNUAL REPORT | SEE NOTES TO FINANCIAL STATEMENTS |
| | Rate (%) | Maturity date | | Par value^ | Value |
| Utilities (continued) | | | |
| Electric utilities (continued) | | | |
| FirstEnergy Corp. | 2.650 | 03-01-30 | | 13,221,000 | $13,782,818 |
| Instituto Costarricense de Electricidad (C) | 6.375 | 05-15-43 | | 9,810,000 | 6,425,550 |
| Israel Electric Corp., Ltd. (C) | 6.875 | 06-21-23 | | 6,630,000 | 7,506,337 |
| NRG Energy, Inc. (C) | 3.750 | 06-15-24 | | 12,190,000 | 12,640,013 |
| Vistra Operations Company LLC (C) | 3.700 | 01-30-27 | | 30,032,000 | 30,492,778 |
| Vistra Operations Company LLC (C) | 4.300 | 07-15-29 | | 27,765,000 | 28,702,796 |
| Gas utilities 0.1% | | | |
| AmeriGas Partners LP | 5.500 | 05-20-25 | | 14,057,000 | 14,619,280 |
| Independent power and renewable electricity producers 0.5% | | | |
| Greenko Dutch BV (C) | 4.875 | 07-24-22 | | 11,955,000 | 11,647,159 |
| Greenko Dutch BV (C) | 5.250 | 07-24-24 | | 7,105,000 | 6,785,275 |
| LLPL Capital Pte, Ltd. (C) | 6.875 | 02-04-39 | | 3,497,209 | 3,703,545 |
| NextEra Energy Capital Holdings, Inc. | 3.550 | 05-01-27 | | 38,727,000 | 43,479,770 |
| NextEra Energy Operating Partners LP (C) | 3.875 | 10-15-26 | | 15,359,000 | 15,704,578 |
| NextEra Energy Operating Partners LP (C) | 4.500 | 09-15-27 | | 5,100,000 | 5,406,000 |
| Multi-utilities 0.1% | | | |
| Dominion Energy, Inc. | 3.375 | 04-01-30 | | 16,145,000 | 17,668,277 |
|
| NiSource, Inc. | 3.600 | 05-01-30 | | 10,122,000 | 11,438,730 |
| Municipal bonds 0.1% | | | | | $20,058,485 |
| (Cost $22,403,006) | | | | | |
| New Jersey Transportation Trust Fund Authority | 4.081 | 06-15-39 | | 20,284,000 | 18,533,896 |
|
| New Jersey Transportation Trust Fund Authority | 4.131 | 06-15-42 | | 1,745,000 | 1,524,589 |
| Collateralized mortgage obligations 6.2% | | | | $1,124,374,535 |
| (Cost $1,168,880,672) | | | | | |
| Commercial and residential 4.8% | | | 879,654,658 |
Americold LLC
Series 2010-ARTA, Class D (C) | 7.443 | 01-14-29 | | 9,783,000 | 9,854,854 |
AOA Mortgage Trust
Series 2015-1177, Class C (C)(G) | 3.010 | 12-13-29 | | 6,896,000 | 6,894,916 |
| Arroyo Mortgage Trust | | |
| Series 2018-1, Class A1 (C)(G) | 3.763 | 04-25-48 | | 23,971,006 | 24,368,560 |
| Series 2019-2, Class A1 (C)(G) | 3.347 | 04-25-49 | | 22,465,873 | 22,895,569 |
| Series 2019-3, Class A1 (C)(G) | 2.962 | 10-25-48 | | 12,818,666 | 12,945,174 |
BAMLL Commercial Mortgage Securities Trust
Series 2019-BPR, Class ENM (C)(G) | 3.843 | 11-05-32 | | 11,565,000 | 7,180,743 |
Barclays Commercial Mortgage Trust
Series 2019-C5, Class A2 | 3.043 | 11-15-52 | | 15,448,000 | 16,261,657 |
BBCMS Mortgage Trust
Series 2018-TALL, Class E (1 month LIBOR + 2.437%) (B)(C) | 2.621 | 03-15-37 | | 9,590,000 | 7,999,565 |
| BBCMS Trust | | |
| SEE NOTES TO FINANCIAL STATEMENTS | ANNUAL REPORT | JOHN HANCOCK BOND FUND | 31 |
| | Rate (%) | Maturity date | | Par value^ | Value |
| Commercial and residential (continued) | | | |
| Series 2015-MSQ, Class D (C)(G) | 3.990 | 09-15-32 | | 7,340,000 | $7,184,916 |
| Series 2015-SRCH, Class D (C)(G) | 4.957 | 08-10-35 | | 15,371,000 | 15,098,011 |
| Series 2020-C6, Class A2 | 2.690 | 02-15-53 | | 10,593,000 | 11,098,642 |
Bear Stearns Commercial Mortgage Securities Trust
Series 2005-PWR8, Class X1 IO (C) | 0.566 | 06-11-41 | | 233,521 | 278 |
| Benchmark Mortgage Trust | | |
| Series 2019-B10, Class A2 | 3.614 | 03-15-62 | | 20,454,000 | 21,915,639 |
| Series 2019-B11, Class A2 | 3.410 | 05-15-52 | | 16,845,000 | 17,932,572 |
| Series 2019-B12, Class A2 | 3.001 | 08-15-52 | | 21,935,000 | 23,072,714 |
| Series 2019-B13, Class A2 | 2.889 | 08-15-57 | | 19,985,000 | 20,915,206 |
| Series 2019-B14, Class A2 | 2.915 | 12-15-62 | | 22,263,000 | 23,366,902 |
BRAVO Residential Funding Trust
Series 2019-NQM1, Class A1 (C)(G) | 2.666 | 07-25-59 | | 9,364,851 | 9,467,960 |
Bunker Hill Loan Depositary Trust
Series 2019-1, Class A1 (C) | 3.613 | 10-26-48 | | 2,664,827 | 2,704,980 |
BWAY Mortgage Trust
Series 2015-1740, Class XA IO (C) | 0.896 | 01-10-35 | | 123,773,000 | 1,798,744 |
BX Commercial Mortgage Trust
Series 2018-BIOA, Class D (1 month LIBOR + 1.321%) (B)(C) | 1.505 | 03-15-37 | | 12,620,000 | 11,895,743 |
CAMB Commercial Mortgage Trust
Series 2019-LIFE, Class D (1 month LIBOR + 1.750%) (B)(C) | 1.934 | 12-15-37 | | 6,315,000 | 6,050,905 |
CGDBB Commercial Mortgage Trust
Series 2017-BIOC, Class E (1 month LIBOR + 2.150%) (B)(C) | 2.334 | 07-15-32 | | 9,287,082 | 8,920,753 |
| Citigroup Commercial Mortgage Trust | | |
| Series 2019-PRM, Class A (C) | 3.341 | 05-10-36 | | 8,060,000 | 8,304,767 |
| Series 2019-SMRT, Class A (C) | 4.149 | 01-10-36 | | 6,922,000 | 7,256,445 |
| COLT Mortgage Loan Trust | | |
| Series 2019-2, Class A1 (C)(G) | 3.337 | 05-25-49 | | 7,420,864 | 7,465,579 |
| Series 2020-1, Class A1 (C)(G) | 2.488 | 02-25-50 | | 10,855,250 | 10,919,719 |
| Commercial Mortgage Trust (Cantor Fitzgerald/Deutsche Bank AG) | | |
| Series 2012-CR2, Class XA IO | 1.630 | 08-15-45 | | 66,083,515 | 1,828,286 |
| Series 2012-CR3, Class XA IO | 1.854 | 10-15-45 | | 93,994,418 | 3,154,133 |
| Series 2014-CR15, Class XA IO | 0.937 | 02-10-47 | | 66,186,344 | 1,750,046 |
| Series 2014-CR20, Class A3 | 3.326 | 11-10-47 | | 41,990,000 | 44,448,611 |
| Series 2016-CR28, Class A3 | 3.495 | 02-10-49 | | 9,285,000 | 10,040,718 |
Commercial Mortgage Trust (Citigroup/Deutsche Bank AG)
Series 2018-COR3, Class XA IO | 0.445 | 05-10-51 | | 224,884,336 | 6,646,434 |
| Commercial Mortgage Trust (Deutsche Bank AG) | | |
| Series 2013-300P, Class D (C)(G) | 4.394 | 08-10-30 | | 18,343,000 | 18,422,031 |
| Series 2017-PANW, Class A (C) | 3.244 | 10-10-29 | | 7,194,000 | 7,360,812 |
| Series 2020-CBM, Class A2 (C) | 2.896 | 02-10-37 | | 6,381,000 | 6,207,291 |
Credit Suisse First Boston Mortgage Securities Corp.
Series 2005-C1, Class AX IO (C) | 0.856 | 02-15-38 | | 222,933 | 13 |
| 32 | JOHN HANCOCK BOND FUND | ANNUAL REPORT | SEE NOTES TO FINANCIAL STATEMENTS |
| | Rate (%) | Maturity date | | Par value^ | Value |
| Commercial and residential (continued) | | | |
Credit Suisse Mortgage Capital Certificates
Series 2019-ICE4, Class D (1 month LIBOR + 1.600%) (B)(C) | 1.784 | 05-15-36 | | 23,820,000 | $22,609,101 |
| CSMC Trust | | |
| Series 2019-AFC1, Class A1 (C) | 2.573 | 07-25-49 | | 22,123,295 | 22,315,973 |
| Series 2020-AFC1, Class A1 (C)(G) | 2.240 | 02-25-50 | | 15,191,460 | 15,214,199 |
GCAT LLC
Series 2019-NQM1, Class A1 (C) | 2.985 | 02-25-59 | | 23,231,456 | 23,359,905 |
GCAT Trust
Series 2020-NQM1, Class A1 (C) | 2.247 | 01-25-60 | | 25,733,889 | 25,638,501 |
| GS Mortgage Securities Trust | | |
| Series 2005-GG4, Class XC IO (C) | 1.606 | 07-10-39 | | 7,186 | 30 |
| Series 2011-GC5, Class XA IO (C) | 1.327 | 08-10-44 | | 22,751,913 | 241,973 |
| Series 2015-590M, Class C (C)(G) | 3.805 | 10-10-35 | | 6,950,000 | 6,695,662 |
| Series 2015-GC30, Class A3 | 3.119 | 05-10-50 | | 20,359,774 | 21,595,842 |
| Series 2015-GC34, Class A4 | 3.506 | 10-10-48 | | 10,099,000 | 10,918,492 |
| Series 2016-RENT, Class D (C)(G) | 4.067 | 02-10-29 | | 13,051,000 | 12,845,350 |
| Series 2017-485L, Class C (C)(G) | 3.982 | 02-10-37 | | 6,600,000 | 6,336,541 |
| Series 2019-GC39, Class A2 | 3.457 | 05-10-52 | | 23,885,000 | 25,359,182 |
| Series 2019-GC40, Class A2 | 2.971 | 07-10-52 | | 22,410,000 | 23,618,544 |
| Series 2020-UPTN, Class A (C) | 2.751 | 02-10-37 | | 13,326,000 | 13,003,583 |
| HarborView Mortgage Loan Trust | | |
| Series 2007-3, Class ES IO (C) | 0.350 | 05-19-47 | | 28,952,917 | 424,128 |
| Series 2007-4, Class ES IO | 0.350 | 07-19-47 | | 30,740,846 | 388,045 |
| Series 2007-6, Class ES IO (C) | 0.343 | 08-19-37 | | 27,369,929 | 341,922 |
Hudsons Bay Simon JV Trust
Series 2015-HBFL, Class DFL (1 month LIBOR + 3.900%) (B)(C) | 4.882 | 08-05-34 | | 5,240,000 | 4,466,218 |
| IMT Trust | | |
| Series 2017-APTS, Class AFX (C) | 3.478 | 06-15-34 | | 7,679,000 | 7,667,350 |
| Series 2017-APTS, Class CFX (C)(G) | 3.497 | 06-15-34 | | 6,867,000 | 6,341,050 |
| Irvine Core Office Trust | | |
| Series 2013-IRV, Class A2 (C)(G) | 3.173 | 05-15-48 | | 15,265,000 | 15,487,416 |
| Series 2013-IRV, Class XA IO (C) | 1.105 | 05-15-48 | | 10,387,425 | 166,358 |
| JPMBB Commercial Mortgage Securities Trust | | |
| Series 2013-C14, Class XA IO | 0.567 | 08-15-46 | | 10,358,467 | 146,935 |
| Series 2015-C31, Class A3 | 3.801 | 08-15-48 | | 15,149,090 | 16,653,863 |
| Series 2016-C1, Class A4 | 3.311 | 03-15-49 | | 7,425,000 | 7,997,369 |
| JPMorgan Chase Commercial Mortgage Securities Trust | | |
| Series 2011-C3, Class XA IO (C) | 0.947 | 02-15-46 | | 9,126,789 | 31,269 |
| Series 2011-C4, Class XA IO (C) | 1.149 | 07-15-46 | | 2,164,391 | 15,455 |
| Series 2012-HSBC, Class XA IO (C) | 1.431 | 07-05-32 | | 82,267,203 | 2,129,314 |
| Series 2015-JP1, Class A4 | 3.650 | 01-15-49 | | 35,415,000 | 38,623,549 |
| Series 2015-JP1, Class A5 | 3.914 | 01-15-49 | | 7,913,402 | 8,731,142 |
| Series 2020-NNN, Class AFX (C) | 2.812 | 01-16-37 | | 13,410,000 | 13,535,583 |
| SEE NOTES TO FINANCIAL STATEMENTS | ANNUAL REPORT | JOHN HANCOCK BOND FUND | 33 |
| | Rate (%) | Maturity date | | Par value^ | Value |
| Commercial and residential (continued) | | | |
KNDL Mortgage Trust
Series 2019-KNSQ, Class D (1 month LIBOR + 1.350%) (B)(C) | 1.534 | 05-15-36 | | 9,440,000 | $8,922,056 |
Merrill Lynch Mortgage Trust
Series 2005-CIP1, Class XC IO (C) | 0.010 | 07-12-38 | | 285,693 | 5 |
| Morgan Stanley Bank of America Merrill Lynch Trust | | |
| Series 2012-C5, Class XA IO (C) | 1.424 | 08-15-45 | | 12,237,494 | 283,579 |
| Series 2012-C6, Class XA IO (C) | 1.610 | 11-15-45 | | 7,394,741 | 209,013 |
| Morgan Stanley Capital I Trust | | |
| Series 2011-C3, Class XA IO (C) | 0.620 | 07-15-49 | | 6,633,880 | 30,752 |
| Series 2017-CLS, Class D (1 month LIBOR + 1.400%) (B)(C) | 1.584 | 11-15-34 | | 15,867,000 | 15,174,282 |
MSCG Trust
Series 2016-SNR, Class D (C) | 6.550 | 11-15-34 | | 9,724,850 | 9,508,670 |
| Natixis Commercial Mortgage Securities Trust | | |
| Series 2018-285M, Class D (C)(G) | 3.790 | 11-15-32 | | 9,223,000 | 9,022,029 |
| Series 2018-ALXA, Class C (C)(G) | 4.316 | 01-15-43 | | 7,332,000 | 7,294,303 |
One Market Plaza Trust
Series 2017-1MKT, Class D (C) | 4.146 | 02-10-32 | | 5,035,000 | 5,012,685 |
Seasoned Credit Risk Transfer Trust
Series 2019-2, Class MA | 3.500 | 08-25-58 | | 23,316,407 | 24,997,272 |
| Starwood Mortgage Residential Trust | | |
| Series 2018-IMC1, Class A1 (C)(G) | 3.793 | 03-25-48 | | 3,429,700 | 3,451,394 |
| Series 2020-1, Class A1 (C)(G) | 2.275 | 02-25-50 | | 12,472,139 | 12,456,834 |
Wells Fargo Commercial Mortgage Trust
Series 2017-SMP, Class D (1 month LIBOR + 1.650%) (B)(C) | 1.834 | 12-15-34 | | 5,170,000 | 4,118,237 |
| WF-RBS Commercial Mortgage Trust | | |
| Series 2011-C2, Class XA IO (C) | 0.793 | 02-15-44 | | 31,669,827 | 81,087 |
| Series 2011-C3, Class XA IO (C) | 1.305 | 03-15-44 | | 20,192,454 | 161,784 |
| Series 2012-C10, Class XA IO (C) | 1.533 | 12-15-45 | | 8,496,452 | 272,224 |
| Series 2012-C9, Class XA IO (C) | 1.889 | 11-15-45 | | 55,784,688 | 1,949,351 |
| Series 2013-C16, Class XA IO | 0.699 | 09-15-46 | | 10,212,072 | 179,369 |
| U.S. Government Agency 1.4% | | | 244,719,877 |
| Federal Home Loan Mortgage Corp. | | |
| Series K006, Class BX1 IO | 5.560 | 02-25-20 | | 364,257 | 805 |
| Series K010, Class X1 IO | 0.101 | 10-25-20 | | 23,049,382 | 302 |
| Series K011, Class X1 IO | 0.174 | 11-25-20 | | 44,779,818 | 10,187 |
| Series K014, Class X1 IO | 1.149 | 04-25-21 | | 36,953,982 | 259,920 |
| Series K015, Class X1 IO | 1.571 | 07-25-21 | | 37,363,212 | 444,970 |
| Series K017, Class X1 IO | 1.286 | 12-25-21 | | 158,108,914 | 2,276,436 |
| Series K018, Class X1 IO | 1.300 | 01-25-22 | | 97,278,972 | 1,464,282 |
| Series K021, Class X1 IO | 1.417 | 06-25-22 | | 33,110,545 | 768,863 |
| Series K022, Class X1 IO | 1.194 | 07-25-22 | | 277,133,997 | 5,628,287 |
| Series K024, Class X1 IO | 0.813 | 09-25-22 | | 9,882,006 | 159,129 |
| Series K026, Class X1 IO | 0.970 | 11-25-22 | | 15,175,275 | 292,186 |
| Series K038, Class X1 IO | 1.126 | 03-25-24 | | 178,936,907 | 6,312,053 |
| 34 | JOHN HANCOCK BOND FUND | ANNUAL REPORT | SEE NOTES TO FINANCIAL STATEMENTS |
| | Rate (%) | Maturity date | | Par value^ | Value |
| U.S. Government Agency (continued) | | | |
| Series K040, Class A2 | 3.241 | 09-25-24 | | 19,525,000 | $21,448,964 |
| Series K715, Class X1 IO | 1.101 | 01-25-21 | | 13,626,336 | 68,076 |
| Series K718, Class X1 IO | 0.603 | 01-25-22 | | 13,013,556 | 93,418 |
| Series K728, Class A2 (G) | 3.064 | 08-25-24 | | 13,286,000 | 14,385,395 |
| Series KAIV, Class X1 IO | 1.228 | 06-25-21 | | 22,562,140 | 144,330 |
| Series KIR3, Class A1 | 3.038 | 08-25-27 | | 34,200,000 | 37,411,240 |
| Series KS01, Class X1 IO | 1.196 | 01-25-23 | | 38,130,814 | 887,010 |
| Series KS03, Class X IO | 0.288 | 08-25-25 | | 37,478,465 | 266,618 |
| Series T-41, Class 3A (G) | 5.317 | 07-25-32 | | 1,082 | 1,223 |
| Federal National Mortgage Association | | |
| Series 2001-50, Class BA | 7.000 | 10-25-41 | | 152 | 176 |
| Series 2012-M5, Class X IO | 0.525 | 02-25-22 | | 14,953,070 | 94,580 |
| Government National Mortgage Association | | |
| Series 2008-90, Class IO | 1.943 | 12-16-50 | | 2,357,281 | 563,805 |
| Series 2012-114, Class IO | 0.760 | 01-16-53 | | 20,625,744 | 760,814 |
| Series 2012-120, Class IO | 0.785 | 02-16-53 | | 8,655,978 | 364,473 |
| Series 2012-125, Class IO | 0.294 | 02-16-53 | | 11,920,219 | 213,962 |
| Series 2012-70, Class IO | 0.409 | 08-16-52 | | 5,248,996 | 50,091 |
| Series 2013-63, Class IO | 0.796 | 09-16-51 | | 13,518,784 | 571,013 |
| Series 2016-174, Class IO | 0.890 | 11-16-56 | | 71,449,266 | 4,611,643 |
| Series 2017-109, Class IO | 0.599 | 04-16-57 | | 133,213,482 | 6,223,254 |
| Series 2017-124, Class IO | 0.712 | 01-16-59 | | 139,145,809 | 7,473,201 |
| Series 2017-135, Class IO | 0.837 | 10-16-58 | | 79,144,494 | 4,847,672 |
| Series 2017-140, Class IO | 0.618 | 02-16-59 | | 65,252,423 | 3,489,856 |
| Series 2017-159, Class IO | 0.544 | 06-16-59 | | 99,367,594 | 4,621,835 |
| Series 2017-169, Class IO | 0.727 | 01-16-60 | | 175,149,550 | 9,388,471 |
| Series 2017-20, Class IO | 0.733 | 12-16-58 | | 225,254,901 | 11,766,325 |
| Series 2017-22, Class IO | 0.942 | 12-16-57 | | 33,842,978 | 2,369,333 |
| Series 2017-41, Class IO | 0.766 | 07-16-58 | | 109,160,115 | 6,169,020 |
| Series 2017-46, Class IO | 0.616 | 11-16-57 | | 140,563,240 | 7,092,835 |
| Series 2017-61, Class IO | 0.764 | 05-16-59 | | 54,290,862 | 3,320,353 |
| Series 2017-74, Class IO | 0.718 | 09-16-58 | | 105,148,529 | 5,017,173 |
| Series 2017-89, Class IO | 0.765 | 07-16-59 | | 121,692,093 | 7,883,895 |
| Series 2018-114, Class IO | 0.555 | 04-16-60 | | 179,830,335 | 9,813,647 |
| Series 2018-158, Class IO | 0.691 | 05-16-61 | | 121,589,355 | 8,371,938 |
| Series 2018-35, Class IO | 0.528 | 03-16-60 | | 136,017,055 | 6,746,922 |
| Series 2018-43, Class IO | 0.577 | 05-16-60 | | 196,497,431 | 10,162,140 |
| Series 2018-68, Class IO | 0.479 | 01-16-60 | | 24,295,525 | 1,080,067 |
| Series 2018-69, Class IO | 0.574 | 04-16-60 | | 91,880,492 | 5,121,014 |
| Series 2018-81, Class IO | 0.451 | 01-16-60 | | 44,406,805 | 2,185,223 |
| Series 2018-9, Class IO | 0.557 | 01-16-60 | | 105,005,883 | 5,641,588 |
| Series 2018-99, Class IO | 0.431 | 06-16-60 | | 153,959,548 | 7,634,408 |
|
| Series 2019-131, Class IO | 0.931 | 07-16-61 | | 118,126,291 | 8,745,456 |
| SEE NOTES TO FINANCIAL STATEMENTS | ANNUAL REPORT | JOHN HANCOCK BOND FUND | 35 |
| | Rate (%) | Maturity date | | Par value^ | Value |
|
| Asset backed securities 5.6% | | | | | $1,029,577,459 |
| (Cost $1,037,667,342) | | | | | |
| Asset backed securities 5.6% | | | | | 1,029,577,459 |
Amresco Residential Securities Corp. Mortgage Loan Trust
Series 1998-1, Class A6 (G) | 6.510 | 08-25-27 | | 1 | 1 |
Applebee's Funding LLC
Series 2019-1A, Class A2I (C) | 4.194 | 06-07-49 | | 29,124,000 | 23,760,233 |
Arby's Funding LLC
Series 2015-1A, Class A2 (C) | 4.969 | 10-30-45 | | 20,943,150 | 20,847,859 |
| Avis Budget Rental Car Funding AESOP LLC | | | | | |
| Series 2019-3A, Class A (C) | 2.360 | 03-20-26 | | 20,570,000 | 19,664,640 |
| Series 2020-1A, Class A (C) | 2.330 | 08-20-26 | | 17,027,000 | 15,899,167 |
BRE Grand Islander Timeshare Issuer LLC
Series 2019-A, Class A (C) | 3.280 | 09-26-33 | | 10,404,082 | 10,054,852 |
CARS-DB4 LP
Series 2020-1A, Class B1 (C) | 4.170 | 02-15-50 | | 16,887,000 | 15,717,133 |
CLI Funding LLC
Series 2018-1A, Class A (C) | 4.030 | 04-18-43 | | 17,957,399 | 17,981,441 |
Coinstar Funding LLC
Series 2017-1A, Class A2 (C) | 5.216 | 04-25-47 | | 19,438,800 | 18,694,943 |
ContiMortgage Home Equity Loan Trust
Series 1995-2, Class A5 | 8.100 | 08-15-25 | | 78,351 | 62,450 |
Corevest American Finance Trust
Series 2019-3, Class A (C) | 2.705 | 10-15-52 | | 5,139,474 | 5,102,995 |
CWABS Asset-Backed Certificates Trust
Series 2004-10, Class AF5B | 4.520 | 02-25-35 | | 863,243 | 865,023 |
| DB Master Finance LLC | | | | | |
| Series 2017-1A, Class A2I (C) | 3.629 | 11-20-47 | | 10,305,783 | 10,374,419 |
| Series 2017-1A, Class A2II (C) | 4.030 | 11-20-47 | | 8,665,538 | 8,633,562 |
| Series 2019-1A, Class A2I (C) | 3.787 | 05-20-49 | | 51,158,413 | 52,244,506 |
Domino's Pizza Master Issuer LLC
Series 2017-1A, Class A23 (C) | 4.118 | 07-25-47 | | 32,472,375 | 33,739,772 |
Driven Brands Funding LLC
Series 2015-1A, Class A2 (C) | 5.216 | 07-20-45 | | 27,838,250 | 28,040,356 |
Five Guys Funding LLC
Series 2017-1A, Class A2 (C) | 4.600 | 07-25-47 | | 16,149,960 | 15,989,967 |
FOCUS Brands Funding LLC
Series 2017-1A, Class A2I (C) | 3.857 | 04-30-47 | | 7,595,100 | 7,369,753 |
Ford Credit Auto Owner Trust
Series 2020-1, Class A (C) | 2.040 | 08-15-31 | | 26,767,000 | 26,878,578 |
Ford Credit Floorplan Master Owner Trust
Series 2019-2, Class A | 3.320 | 04-15-26 | | 36,263,000 | 36,367,064 |
GMF Floorplan Owner Revolving Trust
Series 2019-2, Class A (C) | 2.900 | 04-15-26 | | 30,125,000 | 31,099,839 |
Golden Credit Card Trust
Series 2018-4A, Class A (C) | 3.440 | 10-15-25 | | 27,572,000 | 29,375,198 |
| Hilton Grand Vacations Trust | | | | | |
| Series 2017-AA, Class A (C) | 2.660 | 12-26-28 | | 14,866,110 | 14,351,838 |
| 36 | JOHN HANCOCK BOND FUND | ANNUAL REPORT | SEE NOTES TO FINANCIAL STATEMENTS |
| | Rate (%) | Maturity date | | Par value^ | Value |
| Asset backed securities (continued) | | | | | |
| Series 2018-AA, Class A (C) | 3.540 | 02-25-32 | | 5,931,819 | $5,786,810 |
| Jack in the Box Funding LLC | | | | | |
| Series 2019-1A, Class A23 (C) | 4.970 | 08-25-49 | | 10,596,750 | 9,683,310 |
| Series 2019-1A, Class A2I (C) | 3.982 | 08-25-49 | | 12,243,475 | 11,628,608 |
Laurel Road Prime Student Loan Trust
Series 2019-A, Class A2FX (C) | 2.730 | 10-25-48 | | 9,680,000 | 9,898,020 |
MelTel Land Funding LLC
Series 2019-1A, Class A (C) | 3.768 | 04-15-49 | | 11,076,560 | 11,123,324 |
Mill City Mortgage Loan Trust
Series 2018-3, Class A1 (C)(G) | 3.500 | 08-25-58 | | 7,235,123 | 7,479,083 |
| MVW Owner Trust | | | | | |
| Series 2015-1A, Class A (C) | 2.520 | 12-20-32 | | 1,097,234 | 1,073,240 |
| Series 2018-1A, Class A (C) | 3.450 | 01-21-36 | | 14,443,984 | 14,544,474 |
Navient Private Education Loan Trust
Series 2016-AA, Class A2A (C) | 3.910 | 12-15-45 | | 7,410,310 | 7,700,377 |
Navient Private Education Refi Loan Trust
Series 2019-FA, Class A2 (C) | 2.600 | 08-15-68 | | 26,997,000 | 27,604,206 |
Nelnet Student Loan Trust
Series 2004-4, Class A5 (3 month LIBOR + 0.160%) (B) | 1.151 | 01-25-37 | | 1,031,746 | 988,364 |
| New Residential Mortgage LLC | | | | | |
| Series 2018-FNT1, Class A (C) | 3.610 | 05-25-23 | | 9,333,796 | 9,284,265 |
| Series 2018-FNT2, Class A (C) | 3.790 | 07-25-54 | | 5,557,916 | 5,366,927 |
| NRZ Excess Spread-Collateralized Notes | | | | | |
| Series 2018-PLS1, Class A (C) | 3.193 | 01-25-23 | | 4,038,440 | 4,052,712 |
| Series 2018-PLS2, Class A (C) | 3.265 | 02-25-23 | | 14,626,481 | 14,669,899 |
Oxford Finance Funding LLC
Series 2019-1A, Class A2 (C) | 4.459 | 02-15-27 | | 7,463,000 | 7,351,574 |
Progress Residential Trust
Series 2020-SFR1, Class A (C) | 1.732 | 04-17-37 | | 18,308,000 | 18,035,165 |
Renaissance Home Equity Loan Trust
Series 2005-2, Class AF4 | 4.934 | 08-25-35 | | 5,030,965 | 5,139,830 |
Santander Revolving Auto Loan Trust
Series 2019-A, Class A (C) | 2.510 | 01-26-32 | | 30,367,000 | 30,076,036 |
SCF Equipment Leasing LLC
Series 2019-1A, Class A2 (C) | 3.230 | 10-20-24 | | 8,135,000 | 7,877,858 |
Sesac Finance LLC
Series 2019-1, Class A2 (C) | 5.216 | 07-25-49 | | 20,113,013 | 20,223,232 |
| Sierra Timeshare Receivables Funding LLC | | | | | |
| Series 2018-3A, Class D (C) | 5.200 | 09-20-35 | | 3,124,414 | 2,972,779 |
| Series 2019-1A, Class A (C) | 3.200 | 01-20-36 | | 6,984,768 | 6,862,485 |
| SMB Private Education Loan Trust | | | | | |
| Series 2015-C, Class A2A (C) | 2.750 | 07-15-27 | | 4,894,911 | 4,963,703 |
| Series 2019-B, Class A2A (C) | 2.840 | 06-15-37 | | 26,747,000 | 27,457,553 |
Sonic Capital LLC
Series 2020-1A, Class A2I (C) | 3.845 | 01-20-50 | | 15,782,445 | 14,617,543 |
Sunbird Engine Finance LLC
Series 2020-1A, Class A (C) | 3.671 | 02-15-45 | | 11,674,733 | 8,740,884 |
| Taco Bell Funding LLC | | | | | |
| SEE NOTES TO FINANCIAL STATEMENTS | ANNUAL REPORT | JOHN HANCOCK BOND FUND | 37 |
| | Rate (%) | Maturity date | | Par value^ | Value |
| Asset backed securities (continued) | | | | | |
| Series 2016-1A, Class A2II (C) | 4.377 | 05-25-46 | | 2,667,500 | $2,698,736 |
| Series 2018-1A, Class A2I (C) | 4.318 | 11-25-48 | | 34,199,200 | 34,892,760 |
TAL Advantage V LLC
Series 2014-1A, Class A (C) | 3.510 | 02-22-39 | | 1,816,875 | 1,795,253 |
| Towd Point Mortgage Trust | | | | | |
| Series 2015-1, Class A5 (C)(G) | 3.907 | 10-25-53 | | 4,950,000 | 5,036,802 |
| Series 2015-2, Class 1M2 (C)(G) | 3.748 | 11-25-60 | | 10,860,000 | 11,175,349 |
| Series 2017-1, Class A1 (C)(G) | 2.750 | 10-25-56 | | 4,900,417 | 4,971,043 |
| Series 2017-2, Class A1 (C)(G) | 2.750 | 04-25-57 | | 2,546,777 | 2,583,170 |
| Series 2018-1, Class A1 (C)(G) | 3.000 | 01-25-58 | | 6,393,351 | 6,573,905 |
| Series 2018-3, Class A1 (C)(G) | 3.750 | 05-25-58 | | 10,128,823 | 10,646,959 |
| Series 2018-4, Class A1 (C)(G) | 3.000 | 06-25-58 | | 24,135,848 | 25,042,426 |
| Series 2018-5, Class A1A (C)(G) | 3.250 | 07-25-58 | | 4,129,296 | 4,260,816 |
| Series 2018-6, Class A1A (C)(G) | 3.750 | 03-25-58 | | 27,167,736 | 28,355,811 |
| Series 2019-1, Class A1 (C)(G) | 3.750 | 03-25-58 | | 14,924,239 | 15,830,530 |
| Series 2019-4, Class A1 (C)(G) | 2.900 | 10-25-59 | | 16,125,291 | 16,670,439 |
Toyota Auto Loan Extended Note Trust
Series 2019-1A, Class A (C) | 2.560 | 11-25-31 | | 60,504,000 | 62,653,937 |
Triton Container Finance V LLC
Series 2018-1A, Class A (C) | 3.950 | 03-20-43 | | 15,435,583 | 15,269,910 |
Vantage Data Centers Issuer LLC
Series 2018-1A, Class A2 (C) | 4.072 | 02-16-43 | | 12,409,363 | 12,547,891 |
VSE VOI Mortgage LLC
Series 2017-A, Class A (C) | 2.330 | 03-20-35 | | 8,099,258 | 7,726,896 |
| Westgate Resorts LLC | | | | | |
| Series 2016-1A, Class A (C) | 3.500 | 12-20-28 | | 779,276 | 775,499 |
| Series 2017-1A, Class A (C) | 3.050 | 12-20-30 | | 2,801,094 | 2,746,701 |
Westlake Automobile Receivables Trust
Series 2019-1A, Class C (C) | 3.450 | 03-15-24 | | 12,788,000 | 13,027,876 |
Willis Engine Structured Trust V
Series 2020-A, Class A (C) | 3.228 | 03-15-45 | | 8,420,296 | 5,976,900 |
|
| | | | | Shares | Value |
| Preferred securities 0.3% | | | | | $49,042,861 |
| (Cost $50,570,030) | | | | | |
| Consumer staples 0.0% | | | | | 2,234,436 |
| Food products 0.0% | | | |
| Ocean Spray Cranberries, Inc., 6.250% (C) | | 28,284 | 2,234,436 |
| Financials 0.1% | | | | | 11,426,263 |
| Banks 0.1% | | | |
| GMAC Capital Trust I (3 month LIBOR + 5.785%), 6.177% (B) | | 377,982 | 8,538,613 |
| Wells Fargo & Company, 7.500% | | 2,139 | 2,887,650 |
| 38 | JOHN HANCOCK BOND FUND | ANNUAL REPORT | SEE NOTES TO FINANCIAL STATEMENTS |
| | | | | Shares | Value |
| Information technology 0.1% | | | | | $17,257,917 |
| Semiconductors and semiconductor equipment 0.1% | | | |
| Broadcom, Inc., 8.000% | | 15,892 | 17,257,917 |
| Utilities 0.1% | | | | | 18,124,245 |
| Electric utilities 0.1% | | | |
| NextEra Energy, Inc., 5.279% | | 275,700 | 12,257,622 |
| The Southern Company, 6.750% | | 38,814 | 1,860,355 |
| Multi-utilities 0.0% | | | |
| Dominion Energy, Inc., 7.250% | | 24,838 | 2,602,526 |
| DTE Energy Company, 6.250% | | 33,037 | 1,403,742 |
|
| | Rate (%) | Maturity date | | Par value^ | Value |
| Escrow certificates 0.0% | | | | | $279,948 |
| (Cost $0) | | | | | |
| Stearns Holdings LLC (C)(F)(H) | 9.375 | 08-15-20 | | 2,428,000 | 279,948 |
|
| | Yield* (%) | Maturity date | | Par value^ | Value |
| Short-term investments 1.6% | | | | | $301,002,069 |
| (Cost $300,850,092) | | | | | |
| Commercial paper 0.1% | | | | | 12,298,678 |
| American Honda Finance Corp. | 1.650 | 06-03-20 | | 12,300,000 | 12,298,678 |
| U.S. Government Agency 0.0% | | | | | 7,665,000 |
| Federal Agricultural Mortgage Corp. Discount Note | 0.010 | 06-01-20 | | 7,665,000 | 7,665,000 |
| | | Yield (%) | | Shares | Value |
| Short-term funds 0.6% | | | | | 117,872,391 |
| John Hancock Collateral Trust (I) | 0.3653(J) | | 11,773,464 | 117,872,391 |
| | | | | Par value^ | Value |
| Repurchase agreement 0.9% | | | | | 163,166,000 |
| Barclays Tri-Party Repurchase Agreement dated 5-29-20 at 0.050% to be repurchased at $157,797,657 on 6-1-20, collateralized by $149,882,900 U.S. Treasury Notes, 2.125% due 3-31-24 (valued at $160,953,633) | | | | 157,797,000 | 157,797,000 |
| Repurchase Agreement with State Street Corp. dated 5-29-20 at 0.000% to be repurchased at $5,369,000 on 6-1-20, collateralized by $5,195,000 U.S. Treasury Notes, 2.000% due 11-30-22 (valued at $5,478,585) | | | | 5,369,000 | 5,369,000 |
|
| Total investments (Cost $17,795,664,545) 100.1% | | | $18,301,679,254 |
| Other assets and liabilities, net (0.1%) | | | | (23,444,220) |
| Total net assets 100.0% | | | | | $18,278,235,034 |
| SEE NOTES TO FINANCIAL STATEMENTS | ANNUAL REPORT | JOHN HANCOCK BOND FUND | 39 |
| The percentage shown for each investment category is the total value of the category as a percentage of the net assets of the fund. |
| ^All par values are denominated in U.S. dollars unless otherwise indicated. |
| Security Abbreviations and Legend |
| CMT | Constant Maturity Treasury |
| ICE | Intercontinental Exchange |
| IO | Interest-Only Security - (Interest Tranche of Stripped Mortgage Pool). Rate shown is the annualized yield at the end of the period. |
| LIBOR | London Interbank Offered Rate |
| SOFR | Secured Overnight Financing Rate |
| (A) | All or a portion of this security is on loan as of 5-31-20. |
| (B) | Variable rate obligation. The coupon rate shown represents the rate at period end. |
| (C) | These securities are exempt from registration under Rule 144A of the Securities Act of 1933. Such securities may be resold, normally to qualified institutional buyers, in transactions exempt from registration. Rule 144A securities amounted to $4,602,872,680 or 25.2% of the fund's net assets as of 5-31-20. |
| (D) | Perpetual bonds have no stated maturity date. Date shown as maturity date is next call date. |
| (E) | Non-income producing - Issuer is in default. |
| (F) | Security is valued using significant unobservable inputs and is classified as Level 3 in the fair value hierarchy. Refer to Note 2 to the financial statements. |
| (G) | Variable or floating rate security, the interest rate of which adjusts periodically based on a weighted average of interest rates and prepayments on the underlying pool of assets. The interest rate shown is the current rate as of period end. |
| (H) | Non-income producing security. |
| (I) | Investment is an affiliate of the fund, the advisor and/or subadvisor. This security represents the investment of cash collateral received for securities lending. |
| (J) | The rate shown is the annualized seven-day yield as of 5-31-20. |
| * | Yield represents either the annualized yield at the date of purchase, the stated coupon rate or, for floating rate securities, the rate at period end. |
At 5-31-20, the aggregate cost of investments for federal income tax purposes was $17,840,168,269. Net unrealized appreciation aggregated to $461,510,985, of which $848,806,322 related to gross unrealized appreciation and $387,295,337 related to gross unrealized depreciation.
| 40 | JOHN HANCOCK BOND FUND | ANNUAL REPORT | SEE NOTES TO FINANCIAL STATEMENTS |
STATEMENT OF ASSETS AND LIABILITIES 5-31-20
| Assets | |
| Unaffiliated investments, at value (Cost $17,677,944,326) including $115,237,997 of securities loaned | $18,183,806,863 |
| Affiliated investments, at value (Cost $117,720,219) | 117,872,391 |
| Total investments, at value (Cost $17,795,664,545) | 18,301,679,254 |
| Cash | 466,105 |
| Collateral held at broker for futures contracts | 4,724,987 |
| Dividends and interest receivable | 127,599,457 |
| Receivable for fund shares sold | 60,250,586 |
| Receivable for investments sold | 45,098,686 |
| Receivable for securities lending income | 108,022 |
| Other assets | 470,647 |
| Total assets | 18,540,397,744 |
| Liabilities | |
| Distributions payable | 1,128,881 |
| Payable for investments purchased | 121,285,038 |
| Payable for fund shares repurchased | 18,412,883 |
| Payable upon return of securities loaned | 117,800,611 |
| Payable to affiliates | |
| Accounting and legal services fees | 1,202,082 |
| Transfer agent fees | 842,040 |
| Distribution and service fees | 258,323 |
| Trustees' fees | 10,073 |
| Other liabilities and accrued expenses | 1,222,779 |
| Total liabilities | 262,162,710 |
| Net assets | $18,278,235,034 |
| Net assets consist of | |
| Paid-in capital | $17,617,549,800 |
| Total distributable earnings (loss) | 660,685,234 |
| Net assets | $18,278,235,034 |
| |
| SEE NOTES TO FINANCIAL STATEMENTS | ANNUAL REPORT | JOHN HANCOCK Bond Fund | 41 |
STATEMENT OF ASSETS AND LIABILITIES (continued)
| Net asset value per share | |
| Based on net asset value and shares outstanding - the fund has an unlimited number of shares authorized with no par value | |
| Class A ($2,100,062,868 ÷ 128,316,787 shares)1 | $16.37 |
| Class B ($3,085,619 ÷ 188,575 shares)1 | $16.36 |
| Class C ($277,824,176 ÷ 16,974,426 shares)1 | $16.37 |
| Class I ($4,693,403,367 ÷ 286,738,474 shares) | $16.37 |
| Class R2 ($105,333,190 ÷ 6,428,387 shares) | $16.39 |
| Class R4 ($55,025,209 ÷ 3,357,060 shares) | $16.39 |
| Class R6 ($7,304,870,527 ÷ 445,528,003 shares) | $16.40 |
| Class NAV ($3,738,630,078 ÷ 228,099,354 shares) | $16.39 |
| Maximum offering price per share | |
| Class A (net asset value per share ÷ 96%)2 | $17.05 |
| 1 | Redemption price per share is equal to net asset value less any applicable contingent deferred sales charge. |
| 2 | On single retail sales of less than $100,000. On sales of $100,000 or more and on group sales the offering price is reduced. |
| 42 | JOHN HANCOCK Bond Fund | ANNUAL REPORT | SEE NOTES TO FINANCIAL STATEMENTS |
STATEMENT OF OPERATIONS For the year ended 5-31-20
| Investment income | |
| Interest | $625,903,169 |
| Dividends | 2,436,952 |
| Securities lending | 2,018,665 |
| Less foreign taxes withheld | 53,843 |
| Total investment income | 630,412,629 |
| Expenses | |
| Investment management fees | 55,324,352 |
| Distribution and service fees | 9,130,360 |
| Accounting and legal services fees | 3,128,751 |
| Transfer agent fees | 8,519,435 |
| Trustees' fees | 291,517 |
| Custodian fees | 2,085,613 |
| State registration fees | 493,594 |
| Printing and postage | 719,856 |
| Professional fees | 486,986 |
| Other | 989,786 |
| Total expenses | 81,170,250 |
| Less expense reductions | (1,308,037) |
| Net expenses | 79,862,213 |
| Net investment income | 550,550,416 |
| Realized and unrealized gain (loss) | |
| Net realized gain (loss) on | |
| Unaffiliated investments | 408,867,935 |
| Affiliated investments | (73,720) |
| Futures contracts | 9,802,778 |
| | 418,596,993 |
| Change in net unrealized appreciation (depreciation) of | |
| Unaffiliated investments and translation of assets and liabilities in foreign currencies | 262,490,417 |
| Affiliated investments | 122,952 |
| | 262,613,369 |
| Net realized and unrealized gain | 681,210,362 |
| Increase in net assets from operations | $1,231,760,778 |
| SEE NOTES TO FINANCIAL STATEMENTS | ANNUAL REPORT | JOHN HANCOCK Bond Fund | 43 |
STATEMENTS OF CHANGES IN NET ASSETS
| | Year ended
5-31-20 | Year ended
5-31-19 |
| Increase (decrease) in net assets | | |
| From operations | | |
| Net investment income | $550,550,416 | $472,691,700 |
| Net realized gain | 418,596,993 | 39,483,787 |
| Change in net unrealized appreciation (depreciation) | 262,613,369 | 442,582,432 |
| Increase in net assets resulting from operations | 1,231,760,778 | 954,757,919 |
| Distributions to shareholders | | |
| From earnings | | |
| Class A | (69,961,436) | (51,559,846) |
| Class B | (145,931) | (230,390) |
| Class C | (7,784,005) | (6,855,193) |
| Class I | (151,367,503) | (87,367,701) |
| Class R2 | (3,443,142) | (2,632,937) |
| Class R4 | (1,915,296) | (1,436,288) |
| Class R6 | (290,596,250) | (233,167,054) |
| Class NAV | (171,586,313) | (123,286,684) |
| Total distributions | (696,799,876) | (506,536,093) |
| From fund share transactions | 1,717,196,319 | 3,548,411,057 |
| Total increase | 2,252,157,221 | 3,996,632,883 |
| Net assets | | |
| Beginning of year | 16,026,077,813 | 12,029,444,930 |
| End of year | $18,278,235,034 | $16,026,077,813 |
| 44 | JOHN HANCOCK Bond Fund | ANNUAL REPORT | SEE NOTES TO FINANCIAL STATEMENTS |
| CLASS A SHARES Period ended | 5-31-20 | 5-31-19 | 5-31-18 | 5-31-17 | 5-31-16 |
| Per share operating performance | | | | | |
| Net asset value, beginning of period | $15.83 | $15.41 | $15.93 | $15.79 | $16.06 |
| Net investment income1 | 0.45 | 0.49 | 0.46 | 0.45 | 0.47 |
| Net realized and unrealized gain (loss) on investments | 0.68 | 0.46 | (0.47) | 0.18 | (0.23) |
| Total from investment operations | 1.13 | 0.95 | (0.01) | 0.63 | 0.24 |
| Less distributions | | | | | |
| From net investment income | (0.49) | (0.53) | (0.51) | (0.49) | (0.51) |
| From net realized gain | (0.10) | — | — | — | — |
| Total distributions | (0.59) | (0.53) | (0.51) | (0.49) | (0.51) |
| Net asset value, end of period | $16.37 | $15.83 | $15.41 | $15.93 | $15.79 |
| Total return (%)2,3 | 7.22 | 6.33 | (0.11) | 4.07 | 1.59 |
| Ratios and supplemental data | | | | | |
| Net assets, end of period (in millions) | $2,100 | $1,688 | $1,488 | $1,492 | $1,904 |
| Ratios (as a percentage of average net assets): | | | | | |
| Expenses before reductions | 0.79 | 0.78 | 0.81 | 0.89 | 0.93 |
| Expenses including reductions | 0.78 | 0.78 | 0.79 | 0.83 | 0.87 |
| Net investment income | 2.82 | 3.21 | 2.93 | 2.83 | 3.01 |
| Portfolio turnover (%) | 125 | 106 | 74 | 98 4 | 56 |
| 1 | Based on average daily shares outstanding. |
| 2 | Total returns would have been lower had certain expenses not been reduced during the applicable periods. |
| 3 | Does not reflect the effect of sales charges, if any. |
| 4 | Excludes merger activity. |
| SEE NOTES TO FINANCIAL STATEMENTS | ANNUAL REPORT | JOHN HANCOCK Bond Fund | 45 |
| CLASS B SHARES Period ended | 5-31-20 | 5-31-19 | 5-31-18 | 5-31-17 | 5-31-16 |
| Per share operating performance | | | | | |
| Net asset value, beginning of period | $15.83 | $15.40 | $15.93 | $15.79 | $16.06 |
| Net investment income1 | 0.34 | 0.39 | 0.35 | 0.34 | 0.36 |
| Net realized and unrealized gain (loss) on investments | 0.66 | 0.46 | (0.48) | 0.18 | (0.23) |
| Total from investment operations | 1.00 | 0.85 | (0.13) | 0.52 | 0.13 |
| Less distributions | | | | | |
| From net investment income | (0.37) | (0.42) | (0.40) | (0.38) | (0.40) |
| From net realized gain | (0.10) | — | — | — | — |
| Total distributions | (0.47) | (0.42) | (0.40) | (0.38) | (0.40) |
| Net asset value, end of period | $16.36 | $15.83 | $15.40 | $15.93 | $15.79 |
| Total return (%)2,3 | 6.41 | 5.66 | (0.87) | 3.35 | 0.88 |
| Ratios and supplemental data | | | | | |
| Net assets, end of period (in millions) | $3 | $7 | $11 | $16 | $23 |
| Ratios (as a percentage of average net assets): | | | | | |
| Expenses before reductions | 1.49 | 1.48 | 1.51 | 1.59 | 1.63 |
| Expenses including reductions | 1.48 | 1.48 | 1.49 | 1.53 | 1.57 |
| Net investment income | 2.10 | 2.51 | 2.22 | 2.14 | 2.32 |
| Portfolio turnover (%) | 125 | 106 | 74 | 98 4 | 56 |
| 1 | Based on average daily shares outstanding. |
| 2 | Total returns would have been lower had certain expenses not been reduced during the applicable periods. |
| 3 | Does not reflect the effect of sales charges, if any. |
| 4 | Excludes merger activity. |
| 46 | JOHN HANCOCK Bond Fund | ANNUAL REPORT | SEE NOTES TO FINANCIAL STATEMENTS |
| CLASS C SHARES Period ended | 5-31-20 | 5-31-19 | 5-31-18 | 5-31-17 | 5-31-16 |
| Per share operating performance | | | | | |
| Net asset value, beginning of period | $15.84 | $15.41 | $15.93 | $15.79 | $16.06 |
| Net investment income1 | 0.34 | 0.39 | 0.35 | 0.34 | 0.36 |
| Net realized and unrealized gain (loss) on investments | 0.66 | 0.46 | (0.47) | 0.18 | (0.23) |
| Total from investment operations | 1.00 | 0.85 | (0.12) | 0.52 | 0.13 |
| Less distributions | | | | | |
| From net investment income | (0.37) | (0.42) | (0.40) | (0.38) | (0.40) |
| From net realized gain | (0.10) | — | — | — | — |
| Total distributions | (0.47) | (0.42) | (0.40) | (0.38) | (0.40) |
| Net asset value, end of period | $16.37 | $15.84 | $15.41 | $15.93 | $15.79 |
| Total return (%)2,3 | 6.41 | 5.66 | (0.80) | 3.35 | 0.88 |
| Ratios and supplemental data | | | | | |
| Net assets, end of period (in millions) | $278 | $252 | $269 | $299 | $310 |
| Ratios (as a percentage of average net assets): | | | | | |
| Expenses before reductions | 1.49 | 1.48 | 1.51 | 1.59 | 1.63 |
| Expenses including reductions | 1.48 | 1.48 | 1.49 | 1.53 | 1.57 |
| Net investment income | 2.11 | 2.51 | 2.23 | 2.14 | 2.31 |
| Portfolio turnover (%) | 125 | 106 | 74 | 98 4 | 56 |
| 1 | Based on average daily shares outstanding. |
| 2 | Total returns would have been lower had certain expenses not been reduced during the applicable periods. |
| 3 | Does not reflect the effect of sales charges, if any. |
| 4 | Excludes merger activity. |
| SEE NOTES TO FINANCIAL STATEMENTS | ANNUAL REPORT | JOHN HANCOCK Bond Fund | 47 |
| CLASS I SHARES Period ended | 5-31-20 | 5-31-19 | 5-31-18 | 5-31-17 | 5-31-16 |
| Per share operating performance | | | | | |
| Net asset value, beginning of period | $15.84 | $15.41 | $15.93 | $15.80 | $16.06 |
| Net investment income1 | 0.50 | 0.53 | 0.50 | 0.50 | 0.52 |
| Net realized and unrealized gain (loss) on investments | 0.67 | 0.47 | (0.47) | 0.17 | (0.22) |
| Total from investment operations | 1.17 | 1.00 | 0.03 | 0.67 | 0.30 |
| Less distributions | | | | | |
| From net investment income | (0.54) | (0.57) | (0.55) | (0.54) | (0.56) |
| From net realized gain | (0.10) | — | — | — | — |
| Total distributions | (0.64) | (0.57) | (0.55) | (0.54) | (0.56) |
| Net asset value, end of period | $16.37 | $15.84 | $15.41 | $15.93 | $15.80 |
| Total return (%)2 | 7.47 | 6.70 | 0.19 | 4.33 | 1.97 |
| Ratios and supplemental data | | | | | |
| Net assets, end of period (in millions) | $4,693 | $2,928 | $2,236 | $5,385 | $1,367 |
| Ratios (as a percentage of average net assets): | | | | | |
| Expenses before reductions | 0.49 | 0.50 | 0.51 | 0.57 | 0.61 |
| Expenses including reductions | 0.48 | 0.49 | 0.49 | 0.51 | 0.56 |
| Net investment income | 3.11 | 3.48 | 3.19 | 3.15 | 3.32 |
| Portfolio turnover (%) | 125 | 106 | 74 | 98 3 | 56 |
| 1 | Based on average daily shares outstanding. |
| 2 | Total returns would have been lower had certain expenses not been reduced during the applicable periods. |
| 3 | Excludes merger activity. |
| 48 | JOHN HANCOCK Bond Fund | ANNUAL REPORT | SEE NOTES TO FINANCIAL STATEMENTS |
| CLASS R2 SHARES Period ended | 5-31-20 | 5-31-19 | 5-31-18 | 5-31-17 | 5-31-16 |
| Per share operating performance | | | | | |
| Net asset value, beginning of period | $15.85 | $15.42 | $15.95 | $15.81 | $16.08 |
| Net investment income1 | 0.44 | 0.48 | 0.45 | 0.44 | 0.46 |
| Net realized and unrealized gain (loss) on investments | 0.67 | 0.47 | (0.49) | 0.18 | (0.23) |
| Total from investment operations | 1.11 | 0.95 | (0.04) | 0.62 | 0.23 |
| Less distributions | | | | | |
| From net investment income | (0.47) | (0.52) | (0.49) | (0.48) | (0.50) |
| From net realized gain | (0.10) | — | — | — | — |
| Total distributions | (0.57) | (0.52) | (0.49) | (0.48) | (0.50) |
| Net asset value, end of period | $16.39 | $15.85 | $15.42 | $15.95 | $15.81 |
| Total return (%)2 | 7.12 | 6.29 | (0.27) | 3.97 | 1.55 |
| Ratios and supplemental data | | | | | |
| Net assets, end of period (in millions) | $105 | $86 | $83 | $56 | $56 |
| Ratios (as a percentage of average net assets): | | | | | |
| Expenses before reductions | 0.87 | 0.88 | 0.92 | 0.98 | 1.03 |
| Expenses including reductions | 0.87 | 0.88 | 0.89 | 0.92 | 0.97 |
| Net investment income | 2.73 | 3.11 | 2.84 | 2.75 | 2.92 |
| Portfolio turnover (%) | 125 | 106 | 74 | 98 3 | 56 |
| 1 | Based on average daily shares outstanding. |
| 2 | Total returns would have been lower had certain expenses not been reduced during the applicable periods. |
| 3 | Excludes merger activity. |
| SEE NOTES TO FINANCIAL STATEMENTS | ANNUAL REPORT | JOHN HANCOCK Bond Fund | 49 |
| CLASS R4 SHARES Period ended | 5-31-20 | 5-31-19 | 5-31-18 | 5-31-17 | 5-31-16 |
| Per share operating performance | | | | | |
| Net asset value, beginning of period | $15.86 | $15.43 | $15.95 | $15.81 | $16.08 |
| Net investment income1 | 0.48 | 0.52 | 0.49 | 0.49 | 0.51 |
| Net realized and unrealized gain (loss) on investments | 0.66 | 0.47 | (0.48) | 0.17 | (0.22) |
| Total from investment operations | 1.14 | 0.99 | 0.01 | 0.66 | 0.29 |
| Less distributions | | | | | |
| From net investment income | (0.51) | (0.56) | (0.53) | (0.52) | (0.56) |
| From net realized gain | (0.10) | — | — | — | — |
| Total distributions | (0.61) | (0.56) | (0.53) | (0.52) | (0.56) |
| Net asset value, end of period | $16.39 | $15.86 | $15.43 | $15.95 | $15.81 |
| Total return (%)2 | 7.32 | 6.55 | 0.05 | 4.25 | 1.86 |
| Ratios and supplemental data | | | | | |
| Net assets, end of period (in millions) | $55 | $44 | $39 | $29 | $— 3 |
| Ratios (as a percentage of average net assets): | | | | | |
| Expenses before reductions | 0.72 | 0.74 | 0.76 | 0.82 | 0.82 |
| Expenses including reductions | 0.62 | 0.63 | 0.64 | 0.66 | 0.66 |
| Net investment income | 2.99 | 3.36 | 3.09 | 3.09 | 3.24 |
| Portfolio turnover (%) | 125 | 106 | 74 | 98 4 | 56 |
| 1 | Based on average daily shares outstanding. |
| 2 | Total returns would have been lower had certain expenses not been reduced during the applicable periods. |
| 3 | Less than $500,000. |
| 4 | Excludes merger activity. |
| 50 | JOHN HANCOCK Bond Fund | ANNUAL REPORT | SEE NOTES TO FINANCIAL STATEMENTS |
| CLASS R6 SHARES Period ended | 5-31-20 | 5-31-19 | 5-31-18 | 5-31-17 | 5-31-16 |
| Per share operating performance | | | | | |
| Net asset value, beginning of period | $15.86 | $15.43 | $15.96 | $15.81 | $16.08 |
| Net investment income1 | 0.52 | 0.55 | 0.53 | 0.52 | 0.54 |
| Net realized and unrealized gain (loss) on investments | 0.67 | 0.47 | (0.49) | 0.19 | (0.23) |
| Total from investment operations | 1.19 | 1.02 | 0.04 | 0.71 | 0.31 |
| Less distributions | | | | | |
| From net investment income | (0.55) | (0.59) | (0.57) | (0.56) | (0.58) |
| From net realized gain | (0.10) | — | — | — | — |
| Total distributions | (0.65) | (0.59) | (0.57) | (0.56) | (0.58) |
| Net asset value, end of period | $16.40 | $15.86 | $15.43 | $15.96 | $15.81 |
| Total return (%)2 | 7.65 | 6.81 | 0.23 | 4.58 | 2.02 |
| Ratios and supplemental data | | | | | |
| Net assets, end of period (in millions) | $7,305 | $6,560 | $5,944 | $529 | $118 |
| Ratios (as a percentage of average net assets): | | | | | |
| Expenses before reductions | 0.37 | 0.39 | 0.42 | 0.48 | 0.52 |
| Expenses including reductions | 0.37 | 0.38 | 0.39 | 0.41 | 0.44 |
| Net investment income | 3.22 | 3.61 | 3.37 | 3.27 | 3.45 |
| Portfolio turnover (%) | 125 | 106 | 74 | 98 3 | 56 |
| 1 | Based on average daily shares outstanding. |
| 2 | Total returns would have been lower had certain expenses not been reduced during the applicable periods. |
| 3 | Excludes merger activity. |
| SEE NOTES TO FINANCIAL STATEMENTS | ANNUAL REPORT | JOHN HANCOCK Bond Fund | 51 |
| CLASS NAV SHARES Period ended | 5-31-20 | 5-31-19 | 5-31-18 | 5-31-17 | 5-31-16 1 |
| Per share operating performance | | | | | |
| Net asset value, beginning of period | $15.86 | $15.43 | $15.95 | $15.81 | $15.78 |
| Net investment income2 | 0.52 | 0.56 | 0.53 | 0.51 | 0.41 |
| Net realized and unrealized gain (loss) on investments | 0.67 | 0.47 | (0.48) | 0.19 | 0.06 |
| Total from investment operations | 1.19 | 1.03 | 0.05 | 0.70 | 0.47 |
| Less distributions | | | | | |
| From net investment income | (0.56) | (0.60) | (0.57) | (0.56) | (0.44) |
| From net realized gain | (0.10) | — | — | — | — |
| Total distributions | (0.66) | (0.60) | (0.57) | (0.56) | (0.44) |
| Net asset value, end of period | $16.39 | $15.86 | $15.43 | $15.95 | $15.81 |
| Total return (%)3 | 7.60 | 6.83 | 0.30 | 4.51 | 3.03 4 |
| Ratios and supplemental data | | | | | |
| Net assets, end of period (in millions) | $3,739 | $4,461 | $1,959 | $1,862 | $2 |
| Ratios (as a percentage of average net assets): | | | | | |
| Expenses before reductions | 0.36 | 0.37 | 0.40 | 0.46 | 0.50 5 |
| Expenses including reductions | 0.35 | 0.37 | 0.38 | 0.41 | 0.44 5 |
| Net investment income | 3.23 | 3.63 | 3.34 | 3.28 | 3.44 5 |
| Portfolio turnover (%) | 125 | 106 | 74 | 98 6 | 56 7 |
| 1 | The inception date for Class NAV shares is 8-31-15. |
| 2 | Based on average daily shares outstanding. |
| 3 | Total returns would have been lower had certain expenses not been reduced during the applicable periods. |
| 4 | Not annualized. |
| 5 | Annualized. |
| 6 | Excludes merger activity. |
| 7 | The portfolio turnover is shown for the period from 6-1-15 to 5-31-16. |
| 52 | JOHN HANCOCK Bond Fund | ANNUAL REPORT | SEE NOTES TO FINANCIAL STATEMENTS |
Notes to financial statements
Note 1—Organization
John Hancock Bond Fund (the fund) is a series of John Hancock Sovereign Bond Fund (the Trust), an open-end management investment company organized as a Massachusetts business trust and registered under the Investment Company Act of 1940, as amended (the 1940 Act). The investment objective of the fund is to seek a high level of current income consistent with prudent investment risk.
The fund may offer multiple classes of shares. The shares currently outstanding are detailed in the Statement of assets and liabilities. Class A and Class C shares are offered to all investors. Class B shares are closed to new investors. Class I shares are offered to institutions and certain investors. Class R2 and Class R4 shares are available only to certain retirement and 529 plans. Class R6 shares are only available to certain retirement plans, institutions and other investors. Class NAV shares are offered to John Hancock affiliated funds of funds, retirement plans for employees of John Hancock and/or Manulife Financial Corporation, and certain 529 plans. Class B shares convert to Class A shares eight years after purchase. Class C shares convert to Class A shares ten years after purchase (certain exclusions may apply). Shareholders of each class have exclusive voting rights to matters that affect that class. The distribution and service fees, if any, and transfer agent fees for each class may differ.
Note 2—Significant accounting policies
The financial statements have been prepared in conformity with accounting principles generally accepted in the United States of America (US GAAP), which require management to make certain estimates and assumptions as of the date of the financial statements. Actual results could differ from those estimates and those differences could be significant. The fund qualifies as an investment company under Topic 946 of Accounting Standards Codification of US GAAP.
Events or transactions occurring after the end of the fiscal period through the date that the financial statements were issued have been evaluated in the preparation of the financial statements. The following summarizes the significant accounting policies of the fund:
Security valuation. Investments are stated at value as of the scheduled close of regular trading on the New York Stock Exchange (NYSE), normally at 4:00 P.M., Eastern Time. In case of emergency or other disruption resulting in the NYSE not opening for trading or the NYSE closing at a time other than the regularly scheduled close, the net asset value (NAV) may be determined as of the regularly scheduled close of the NYSE pursuant to the fund's Valuation Policies and Procedures.
In order to value the securities, the fund uses the following valuation techniques: Debt obligations are typically valued based on evaluated prices provided by an independent pricing vendor. Independent pricing vendors utilize matrix pricing, which takes into account factors such as institutional-size trading in similar groups of securities, yield, quality, coupon rate, maturity, type of issue, trading characteristics and other market data, as well as broker supplied prices. Equity securities, including exchange-traded or closed-end funds, are typically valued at the last sale price or official closing price on the exchange or principal market where the security trades. In the event there were no sales during the day or closing prices are not available, the securities are valued using the last available bid price. Investments by the fund in open-end mutual funds, including John Hancock Collateral Trust (JHCT), are valued at their respective NAVs each business day.
In certain instances, the Pricing Committee may determine to value equity securities using prices obtained from another exchange or market if trading on the exchange or market on which prices are typically obtained did not open for trading as scheduled, or if trading closed earlier than scheduled, and trading occurred as normal on another exchange or market.
Other portfolio securities and assets, for which reliable market quotations are not readily available, are valued at fair value as determined in good faith by the fund's Pricing Committee following procedures established by the Board of Trustees. The frequency with which these fair valuation procedures are used cannot be predicted and fair value of securities may differ significantly from the value that would have been used had a ready market for such securities existed.
| | ANNUAL REPORT | JOHN HANCOCK Bond Fund | 53 |
The fund uses a three-tier hierarchy to prioritize the pricing assumptions, referred to as inputs, used in valuation techniques to measure fair value. Level 1 includes securities valued using quoted prices in active markets for identical securities, including registered investment companies. Level 2 includes securities valued using other significant observable inputs. Observable inputs may include quoted prices for similar securities, interest rates, prepayment speeds and credit risk. Prices for securities valued using these inputs are received from independent pricing vendors and brokers and are based on an evaluation of the inputs described. Level 3 includes securities valued using significant unobservable inputs when market prices are not readily available or reliable, including the fund's own assumptions in determining the fair value of investments. Factors used in determining value may include market or issuer specific events or trends, changes in interest rates and credit quality. The inputs or methodology used for valuing securities are not necessarily an indication of the risks associated with investing in those securities. Changes in valuation techniques and related inputs may result in transfers into or out of an assigned level within the disclosure hierarchy.
The following is a summary of the values by input classification of the fund's investments as of May 31, 2020, by major security category or type:
| | Total
value at
5-31-20 | Level 1
quoted
price | Level 2
significant
observable
inputs | Level 3
significant
unobservable
inputs |
| Investments in securities: | | | | |
| Assets | | | | |
| U.S. Government and Agency obligations | $6,303,155,425 | — | $6,303,155,425 | — |
| Foreign government obligations | 90,730,932 | — | 90,730,932 | — |
| Corporate bonds | 9,383,457,540 | — | 9,383,457,540 | — |
| Municipal bonds | 20,058,485 | — | 20,058,485 | — |
| Collateralized mortgage obligations | 1,124,374,535 | — | 1,124,374,535 | — |
| Asset backed securities | 1,029,577,459 | — | 1,029,577,459 | — |
| Preferred securities | 49,042,861 | $46,808,425 | 2,234,436 | — |
| Escrow certificates | 279,948 | — | — | $279,948 |
| Short-term investments | 301,002,069 | 117,872,391 | 183,129,678 | — |
| Total investments in securities | $18,301,679,254 | $164,680,816 | $18,136,718,490 | $279,948 |
Repurchase agreements. The fund may enter into repurchase agreements. When the fund enters into a repurchase agreement, it receives collateral that is held in a segregated account by the fund's custodian, or for tri-party repurchase agreements, collateral is held at a third-party custodian bank in a segregated account for the benefit of the fund. The collateral amount is marked-to-market and monitored on a daily basis to ensure that the collateral held is in an amount not less than the principal amount of the repurchase agreement plus any accrued interest. Collateral received by the fund for repurchase agreements is disclosed in the Fund's investments as part of the caption related to the repurchase agreement.
Repurchase agreements are typically governed by the terms and conditions of the Master Repurchase Agreement and/or Global Master Repurchase Agreement (collectively, MRA). Upon an event of default, the non-defaulting party may close out all transactions traded under the MRA and net amounts owed. Absent an event of default, assets and liabilities resulting from repurchase agreements are not offset in the Statement of assets and liabilities. In the event of a default by the counterparty, realization of the collateral proceeds could be delayed, during which time the collateral value may decline or the counterparty may have insufficient assets to pay claims resulting from close-out of the transactions.
| 54 | JOHN HANCOCK Bond Fund | ANNUAL REPORT | |
Mortgage and asset backed securities. The fund may invest in mortgage-related securities, such as mortgage-backed securities, and other asset-backed securities, which are debt obligations that represent interests in pools of mortgages or other income-bearing assets, such as consumer loans or receivables. Such securities often involve risks that are different from the risks associated with investing in other types of debt securities. Mortgage-backed and other asset-backed securities are subject to changes in the payment patterns of borrowers of the underlying debt. When interest rates fall, borrowers are more likely to refinance or prepay their debt before its stated maturity. This may result in the fund having to reinvest the proceeds in lower yielding securities, effectively reducing the fund's income. Conversely, if interest rates rise and borrowers repay their debt more slowly than expected, the time in which the mortgage-backed and other asset-backed securities are paid off could be extended, reducing the fund's cash available for reinvestment in higher yielding securities. The timely payment of principal and interest of certain mortgage-related securities is guaranteed with the full faith and credit of the U.S. Government. Pools created and guaranteed by non-governmental issuers, including government-sponsored corporations (e.g. FNMA), may be supported by various forms of insurance or guarantees, but there can be no assurance that private insurers or guarantors can meet their obligations under the insurance policies or guarantee arrangements. The fund is also subject to risks associated with securities with contractual cash flows including asset-backed and mortgage related securities such as collateralized mortgage obligations, mortgage pass-through securities and commercial mortgage-backed securities. The value, liquidity and related income of these securities are sensitive to changes in economic conditions, including real estate value, pre-payments, delinquencies and/or defaults, and may be adversely affected by shifts in the market’s perception of the issuers and changes in interest rates.
Security transactions and related investment income. Investment security transactions are accounted for on a trade date plus one basis for daily NAV calculations. However, for financial reporting purposes, investment transactions are reported on trade date. Interest income is accrued as earned. Interest income includes coupon interest and amortization/accretion of premiums/discounts on debt securities. Debt obligations may be placed in a non-accrual status and related interest income may be reduced by stopping current accruals and writing off interest receivable when the collection of all or a portion of interest has become doubtful. Dividend income is recorded on the ex-date, except for dividends of certain foreign securities where the dividend may not be known until after the ex-date. In those cases, dividend income, net of withholding taxes, is recorded when the fund becomes aware of the dividends. Non-cash dividends, if any, are recorded at the fair market value of the securities received. Gains and losses on securities sold are determined on the basis of identified cost and may include proceeds from litigation.
Securities lending. The fund may lend its securities to earn additional income. The fund receives collateral from the borrower in an amount not less than the market value of the loaned securities. The fund will invest its cash collateral in JHCT, an affiliate of the fund, which has a floating NAV and is registered with the Securities and Exchange Commission (SEC) as an investment company. JHCT invests in short-term money market investments. The fund will receive the benefit of any gains and bear any losses generated by JHCT with respect to the cash collateral.
The fund has the right to recall loaned securities on demand. If a borrower fails to return loaned securities when due, then the lending agent is responsible and indemnifies the fund for the lent securities. The lending agent uses the collateral received from the borrower to purchase replacement securities of the same issue, type, class and series of the loaned securities. If the value of the collateral is less than the purchase cost of replacement securities, the lending agent is responsible for satisfying the shortfall but only to the extent that the shortfall is not due to any decrease in the value of JHCT.
Although the risk of loss on securities lent is mitigated by receiving collateral from the borrower and through lending agent indemnification, the fund could experience a delay in recovering securities or could experience a lower than expected return if the borrower fails to return the securities on a timely basis. The fund receives compensation for lending its securities by retaining a portion of the return on the investment of the collateral and
| | ANNUAL REPORT | JOHN HANCOCK Bond Fund | 55 |
compensation from fees earned from borrowers of the securities. Securities lending income received by the fund is net of fees retained by the securities lending agent. Net income received from JHCT is a component of securities lending income as recorded on the Statement of operations.
Obligations to repay collateral received by the fund are shown on the Statement of assets and liabilities as Payable upon return of securities loaned and are secured by the loaned securities. As of May 31, 2020, the fund loaned securities valued at $115,237,997 and received $117,800,611 of cash collateral.
Foreign taxes. The fund may be subject to withholding tax on income, capital gains or repatriation taxes imposed by certain countries, a portion of which may be recoverable. Foreign taxes are accrued based upon the fund's understanding of the tax rules and rates that exist in the foreign markets in which it invests. Taxes are accrued based on gains realized by the fund as a result of certain foreign security sales. In certain circumstances, estimated taxes are accrued based on unrealized appreciation of such securities. Investment income is recorded net of foreign withholding taxes.
Overdraft. The fund may have the ability to borrow from banks for temporary or emergency purposes, including meeting redemption requests that otherwise might require the untimely sale of securities. Pursuant to the fund's custodian agreement, the custodian may loan money to the fund to make properly authorized payments. The fund is obligated to repay the custodian for any overdraft, including any related costs or expenses. The custodian may have a lien, security interest or security entitlement in any fund property that is not otherwise segregated or pledged, to the extent of any overdraft, and to the maximum extent permitted by law.
Line of credit. The fund and other affiliated funds have entered into a syndicated line of credit agreement with Citibank, N.A. as the administrative agent that enables them to participate in a $750 million unsecured committed line of credit. Excluding commitments designated for a certain fund and subject to the needs of all other affiliated funds, the fund can borrow up to an aggregate commitment amount of $500 million, subject to asset coverage and other limitations as specified in the agreement. A commitment fee payable at the end of each calendar quarter, based on the average daily unused portion of the line of credit, is charged to each participating fund based on a combination of fixed and asset based allocations and is reflected in Other expenses on the Statement of operations. For the year ended May 31, 2020, the fund had no borrowings under the line of credit. Commitment fees for the year ended May 31, 2020 were $47,334.
Expenses. Within the John Hancock group of funds complex, expenses that are directly attributable to an individual fund are allocated to such fund. Expenses that are not readily attributable to a specific fund are allocated among all funds in an equitable manner, taking into consideration, among other things, the nature and type of expense and the fund’s relative net assets. Expense estimates are accrued in the period to which they relate and adjustments are made when actual amounts are known.
Class allocations. Income, common expenses and realized and unrealized gains (losses) are determined at the fund level and allocated daily to each class of shares based on the net assets of the class. Class-specific expenses, such as distribution and service fees, if any, and transfer agent fees, for all classes, are charged daily at the class level based on the net assets of each class and the specific expense rates applicable to each class.
Change in accounting principle. Accounting Standards Update (ASU) 2017-08, Premium Amortization on Purchased Callable Debt Securities, shortens the premium amortization period for purchased non contingently callable debt securities and is effective for public companies with fiscal years beginning after December 15, 2018. Adoption of the ASU did not have a material impact to the fund.
Federal income taxes. The fund intends to continue to qualify as a regulated investment company by complying with the applicable provisions of the Internal Revenue Code and will not be subject to federal income tax on taxable income that is distributed to shareholders. Therefore, no federal income tax provision is required.
| 56 | JOHN HANCOCK Bond Fund | ANNUAL REPORT | |
As of May 31, 2020, the fund had no uncertain tax positions that would require financial statement recognition, derecognition or disclosure. The fund's federal tax returns are subject to examination by the Internal Revenue Service for a period of three years.
Distribution of income and gains. Distributions to shareholders from net investment income and net realized gains, if any, are recorded on the ex-date. The fund generally declares dividends daily and pays them monthly. Capital gain distributions, if any, are typically distributed annually.
The tax character of distributions for the years ended May 31, 2020 and 2019 was as follows:
| | May 31, 2020 | May 31, 2019 |
| Ordinary income | $696,799,876 | $506,536,093 |
Distributions paid by the fund with respect to each class of shares are calculated in the same manner, at the same time and in the same amount, except for the effect of class level expenses that may be applied differently to each class. As of May 31, 2020, the components of distributable earnings on a tax basis consisted of $200,303,130 of undistributed ordinary income.
Such distributions and distributable earnings, on a tax basis, are determined in conformity with income tax regulations, which may differ from US GAAP. Distributions in excess of tax basis earnings and profits, if any, are reported in the fund's financial statements as a return of capital.
Capital accounts within the financial statements are adjusted for permanent book-tax differences. These adjustments have no impact on net assets or the results of operations. Temporary book-tax differences, if any, will reverse in a subsequent period. Book-tax differences are primarily attributable to amortization and accretion on debt securities.
Note 3—Derivative instruments
The fund may invest in derivatives in order to meet its investment objective. Derivatives include a variety of different instruments that may be traded in the over-the-counter (OTC) market, on a regulated exchange or through a clearing facility. The risks in using derivatives vary depending upon the structure of the instruments, including the use of leverage, optionality, the liquidity or lack of liquidity of the contract, the creditworthiness of the counterparty or clearing organization and the volatility of the position. Some derivatives involve risks that are potentially greater than the risks associated with investing directly in the referenced securities or other referenced underlying instrument. Specifically, the fund is exposed to the risk that the counterparty to an OTC derivatives contract will be unable or unwilling to make timely settlement payments or otherwise honor its obligations. OTC derivatives transactions typically can only be closed out with the other party to the transaction.
Certain derivatives are traded or cleared on an exchange or central clearinghouse. Exchange-traded or centrally-cleared transactions generally present less counterparty risk to a fund than OTC transactions. The exchange or clearinghouse stands between the fund and the broker to the contract and therefore, credit risk is generally limited to the failure of the exchange or clearinghouse and the clearing member.
Futures. A futures contract is a contractual agreement to buy or sell a particular currency or financial instrument at a pre-determined price in the future. Futures are traded on an exchange and cleared through a central clearinghouse. Risks related to the use of futures contracts include possible illiquidity of the futures markets and contract prices that can be highly volatile and imperfectly correlated to movements in the underlying financial instrument and potential losses in excess of the amounts recognized on the Statement of assets and liabilities. Use of long futures contracts subjects the fund to the risk of loss up to the notional value of the futures contracts. Use of short futures contracts subjects the fund to unlimited risk of loss.
Upon entering into a futures contract, the fund is required to deposit initial margin with the broker in the form of cash or securities. The amount of required margin is set by the broker and is generally based on a percentage of
| | ANNUAL REPORT | JOHN HANCOCK Bond Fund | 57 |
the contract value. The margin deposit must then be maintained at the established level over the life of the contract. Cash that has been pledged by the fund is detailed in the Statement of assets and liabilities as Collateral held at broker for futures contracts. Securities pledged by the fund, if any, are identified in the Fund's investments. Subsequent payments, referred to as variation margin, are made or received by the fund periodically and are based on changes in the market value of open futures contracts. Futures contracts are marked-to-market daily and unrealized gain or loss is recorded by the fund. When the contract is closed, the fund records a realized gain or loss equal to the difference between the value of the contract at the time it was opened and the value at the time it was closed.
During the year ended May 31, 2020, the fund used futures contracts to manage the duration of the fund. The fund held futures contracts with USD notional values ranging up to $212.2 million as measured at each quarter end. There were no open futures contracts as of May 31, 2020.
Effect of derivative instruments on the Statement of operations
The table below summarizes the net realized gain (loss) included in the net increase (decrease) in net assets from operations, classified by derivative instrument and risk category, for the year ended May 31, 2020:
| | Statement of operations location - Net realized gain (loss) on: |
| Risk | Futures contracts |
| Interest rate | $9,802,778 |
Note 4—Guarantees and indemnifications
Under the Trust's organizational documents, its Officers and Trustees are indemnified against certain liabilities arising out of the performance of their duties to the Trust, including the fund. Additionally, in the normal course of business, the fund enters into contracts with service providers that contain general indemnification clauses. The fund's maximum exposure under these arrangements is unknown, as this would involve future claims that may be made against the fund that have not yet occurred. The risk of material loss from such claims is considered remote.
Note 5—Fees and transactions with affiliates
John Hancock Investment Management LLC (the Advisor) serves as investment advisor for the fund. John Hancock Investment Management Distributors LLC (the Distributor), an affiliate of the Advisor, serves as principal underwriter of the fund. The Advisor and the Distributor are indirect, wholly owned subsidiaries of Manulife Financial Corporation. Prior to June 28, 2019, the Advisor was known as John Hancock Advisers, LLC and the Distributor was known as John Hancock Funds, LLC.
Management fee. The fund has an investment management agreement with the Advisor under which the fund pays a daily management fee to the Advisor, equivalent on an annual basis, to the sum of: (a) 0.450% of the first $500 million of the fund’s aggregate average daily net assets, (b) 0.425% of the next $500 million of the fund’s aggregate average daily net assets, (c) 0.400% of the next $1 billion of the fund’s aggregate average daily net assets, (d) 0.350% of the next $500 million of the fund’s aggregate average daily net assets; and (e) 0.300% of the fund’s aggregate average daily net assets in excess of $2.5 billion. Aggregate net assets include the net assets of the fund and certain assets of Multi-Asset High Income Fund, a series of John Hancock Funds II, as defined in the advisory agreement. The Advisor has a subadvisory agreement with Manulife Investment Management (US) LLC, an indirectly owned subsidiary of Manulife Financial Corporation and an affiliate of the Advisor. The fund is not responsible for payment of the subadvisory fees.
The Advisor has contractually agreed to waive a portion of its management fee and/or reimburse expenses for certain funds of the John Hancock group of funds complex, including the fund (the participating portfolios). This waiver is based upon aggregate net assets of all the participating portfolios. The amount of the reimbursement is calculated daily and allocated among all the participating portfolios in proportion to the daily net assets of each
| 58 | JOHN HANCOCK Bond Fund | ANNUAL REPORT | |
fund. During the year ended May 31, 2020, this waiver amounted to 0.01% of the fund’s average daily net assets. This arrangement expires on July 31, 2022, unless renewed by mutual agreement of the fund and the Advisor based upon a determination that this is appropriate under the circumstances at that time.
For the year ended May 31, 2020, the expense reductions described above amounted to the following:
| Class | Expense reduction |
| Class A | $137,243 |
| Class B | 364 |
| Class C | 19,029 |
| Class I | 273,533 |
| Class R2 | 6,958 |
| Class | Expense reduction |
| Class R4 | $3,600 |
| Class R6 | 513,637 |
| Class NAV | 303,309 |
| Total | $1,257,673 |
Expenses waived or reimbursed in the current fiscal period are not subject to recapture in future fiscal periods.
The investment management fees, including the impact of the waivers and reimbursements as described above, incurred for the year ended May 31, 2020, were equivalent to a net annual effective rate of 0.31% of the fund's average daily net assets.
Accounting and legal services. Pursuant to a service agreement, the fund reimburses the Advisor for all expenses associated with providing the administrative, financial, legal, compliance, accounting and recordkeeping services to the fund, including the preparation of all tax returns, periodic reports to shareholders and regulatory reports, among other services. These expenses are allocated to each share class based on its relative net assets at the time the expense was incurred. These accounting and legal services fees incurred for the year ended May 31, 2020 amounted to an annual rate of 0.02% of the fund's average daily net assets.
Distribution and service plans. The fund has a distribution agreement with the Distributor. The fund has adopted distribution and service plans for certain classes as detailed below pursuant to Rule 12b-1 under the 1940 Act, to pay the Distributor for services provided as the distributor of shares of the fund. In addition, under a service plan for certain classes as detailed below, the fund pays for certain other services. The fund may pay up to the following contractual rates of distribution and service fees under these arrangements, expressed as an annual percentage of average daily net assets for each class of the fund's shares:
| Class | Rule 12b-1 Fee | Service fee |
| Class A | 0.30% | — |
| Class B | 1.00% | — |
| Class C | 1.00% | — |
| Class R2 | 0.25% | 0.25% |
| Class R4 | 0.25% | 0.10% |
The fund's Distributor has contractually agreed to waive 0.10% of Rule12b-1 fees for Class R4 shares. The current waiver agreement expires on September 30, 2021, unless renewed by mutual agreement of the fund and the Distributor based upon a determination that this is appropriate under the circumstances at the time. This contractual waiver amounted to $50,364 for Class R4 shares for the year ended May 31, 2020.
Sales charges. Class A shares are assessed up-front sales charges, which resulted in payments to the Distributor amounting to $2,820,276 for the year ended May 31, 2020. Of this amount, $393,693 was retained and used for printing prospectuses, advertising, sales literature and other purposes and $2,426,583 was paid as sales commissions to broker-dealers.
Class A, Class B and Class C shares may be subject to contingent deferred sales charges (CDSCs). Certain Class A shares that are acquired through purchases of $1 million or more and are redeemed within one year of purchase are subject to a 1.00% sales charge. Class B shares that are redeemed within six years of purchase are subject to
| | ANNUAL REPORT | JOHN HANCOCK Bond Fund | 59 |
CDSCs, at declining rates, beginning at 5.00%. Class C shares that are redeemed within one year of purchase are subject to a 1.00% CDSC. CDSCs are applied to the lesser of the current market value at the time of redemption or the original purchase cost of the shares being redeemed. Proceeds from CDSCs are used to compensate the Distributor for providing distribution-related services in connection with the sale of these shares. During the year ended May 31, 2020, CDSCs received by the Distributor amounted to $43,296 and $22,828 for Class A and Class C shares, respectively. During the year ended May 31, 2020, there were no CDSCs received by the Distributor for Class B shares.
Transfer agent fees. The John Hancock group of funds has a complex-wide transfer agent agreement with John Hancock Signature Services, Inc. (Signature Services), an affiliate of the Advisor. The transfer agent fees paid to Signature Services are determined based on the cost to Signature Services (Signature Services Cost) of providing recordkeeping services. It also includes out-of-pocket expenses, including payments made to third-parties for recordkeeping services provided to their clients who invest in one or more John Hancock funds. In addition, Signature Services Cost may be reduced by certain fees that Signature Services receives in connection with retirement and small accounts. Signature Services Cost is calculated monthly and allocated, as applicable, to five categories of share classes: Retail Share and Institutional Share Classes of Non-Municipal Bond Funds, Class R6 Shares, Retirement Share Classes and Municipal Bond Share Classes. Within each of these categories, the applicable costs are allocated to the affected John Hancock affiliated funds and/or classes, based on the relative average daily net assets.
Class level expenses. Class level expenses for the year ended May 31, 2020 were as follows:
| Class | Distribution and service fees | Transfer agent fees |
| Class A | $5,758,596 | $2,400,319 |
| Class B | 50,317 | 6,234 |
| Class C | 2,659,985 | 332,171 |
| Class I | — | 4,816,926 |
| Class R2 | 486,419 | 12,835 |
| Class R4 | 175,043 | 6,642 |
| Class R6 | — | 944,308 |
| Total | $9,130,360 | $8,519,435 |
Trustee expenses. The fund compensates each Trustee who is not an employee of the Advisor or its affiliates. The costs of paying Trustee compensation and expenses are allocated to the fund based on its net assets relative to other funds within the John Hancock group of funds complex.
Interfund lending program. Pursuant to an Exemptive Order issued by the SEC, the fund, along with certain other funds advised by the Advisor or its affiliates, may participate in an interfund lending program. This program provides an alternative credit facility allowing the fund to borrow from, or lend money to, other participating affiliated funds. At period end, no interfund loans were outstanding. The fund's activity in this program during the period for which loans were outstanding was as follows:
Borrower
or Lender | Weighted Average
Loan Balance | Days
Outstanding | Weighted Average
Interest Rate | Interest Income
(Expense) |
| Lender | $16,627,614 | 3 | 0.814% | $1,128 |
| 60 | JOHN HANCOCK Bond Fund | ANNUAL REPORT | |
Note 6—Fund share transactions
Transactions in fund shares for the years ended May 31, 2020 and 2019 were as follows:
| | Year Ended 5-31-20 | Year Ended 5-31-19 |
| | Shares | Amount | Shares | Amount |
| Class A shares | | | | |
| Sold | 41,005,801 | $662,731,784 | 26,954,829 | $416,858,752 |
| Distributions reinvested | 4,172,520 | 67,539,928 | 3,200,787 | 49,262,981 |
| Repurchased | (23,461,921) | (376,812,820) | (20,121,476) | (308,683,359) |
| Net increase | 21,716,400 | $353,458,892 | 10,034,140 | $157,438,374 |
| Class B shares | | | | |
| Sold | 6,768 | $110,103 | 4,653 | $70,739 |
| Distributions reinvested | 8,541 | 138,132 | 14,133 | 217,216 |
| Repurchased | (249,934) | (4,037,416) | (281,557) | (4,322,775) |
| Net decrease | (234,625) | $(3,789,181) | (262,771) | $(4,034,820) |
| Class C shares | | | | |
| Sold | 4,252,213 | $68,713,068 | 2,701,117 | $41,576,151 |
| Distributions reinvested | 455,710 | 7,373,911 | 426,403 | 6,560,181 |
| Repurchased | (3,674,490) | (59,119,885) | (4,654,352) | (71,339,295) |
| Net increase (decrease) | 1,033,433 | $16,967,094 | (1,526,832) | $(23,202,963) |
| Class I shares | | | | |
| Sold | 177,627,763 | $2,867,598,280 | 96,960,267 | $1,496,504,211 |
| Distributions reinvested | 8,777,670 | 142,128,546 | 5,258,651 | 81,006,463 |
| Repurchased | (84,570,992) | (1,357,062,414) | (62,450,126) | (957,926,278) |
| Net increase | 101,834,441 | $1,652,664,412 | 39,768,792 | $619,584,396 |
| Class R2 shares | | | | |
| Sold | 2,997,214 | $48,532,943 | 1,768,277 | $27,269,421 |
| Distributions reinvested | 181,253 | 2,937,041 | 151,590 | 2,335,814 |
| Repurchased | (2,159,089) | (34,743,089) | (1,912,822) | (29,407,872) |
| Net increase | 1,019,378 | $16,726,895 | 7,045 | $197,363 |
| Class R4 shares | | | | |
| Sold | 1,271,936 | $20,533,594 | 622,397 | $9,616,684 |
| Distributions reinvested | 118,132 | 1,914,858 | 93,146 | 1,435,800 |
| Repurchased | (787,885) | (12,627,785) | (505,533) | (7,766,948) |
| Net increase | 602,183 | $9,820,667 | 210,010 | $3,285,536 |
| | ANNUAL REPORT | JOHN HANCOCK Bond Fund | 61 |
| | Year Ended 5-31-20 | Year Ended 5-31-19 |
| | Shares | Amount | Shares | Amount |
| Class R6 shares | | | | |
| Sold | 142,587,889 | $2,308,830,647 | 101,956,557 | $1,572,817,631 |
| Distributions reinvested | 17,865,771 | 289,744,933 | 15,084,491 | 232,593,564 |
| Repurchased | (128,475,759) | (2,080,653,650) | (88,632,863) | (1,360,912,144) |
| Net increase | 31,977,901 | $517,921,930 | 28,408,185 | $444,499,051 |
| Class NAV shares | | | | |
| Sold | 14,828,777 | $240,437,607 | 190,488,426 | $2,904,904,253 |
| Distributions reinvested | 10,585,871 | 171,586,313 | 7,984,258 | 123,286,684 |
| Repurchased | (78,637,849) | (1,258,598,310) | (44,157,186) | (677,546,817) |
| Net increase (decrease) | (53,223,201) | $(846,574,390) | 154,315,498 | $2,350,644,120 |
| Total net increase | 104,725,910 | $1,717,196,319 | 230,954,067 | $3,548,411,057 |
Affiliates of the fund owned 100% of shares of Class NAV on May 31, 2020. Such concentration of shareholders’ capital could have a material effect on the fund if such shareholders redeem from the fund.
Note 7—Purchase and sale of securities
Purchases and sales of securities, other than short-term investments and U.S. Treasury obligations, amounted to $11,230,451,748 and $8,619,366,810, respectively, for the year ended May 31, 2020. Purchases and sales of U.S. Treasury obligations aggregated $12,184,563,939 and $13,065,425,136, respectively, for the year ended May 31, 2020.
Note 8—Investment by affiliated funds
Certain investors in the fund are affiliated funds that are managed by the Advisor and its affiliates. The affiliated funds do not invest in the fund for the purpose of exercising management or control; however, this investment may represent a significant portion of the fund's net assets. At May 31, 2020, funds within the John Hancock group of funds complex held 20.5% of the fund's net assets. There were no affiliated funds with an ownership of 5% or more of the fund's net assets.
Note 9—Investment in affiliated underlying funds
The fund may invest in affiliated underlying funds that are managed by the Advisor and its affiliates. Information regarding the fund's fiscal year to date purchases and sales of the affiliated underlying funds as well as income and capital gains earned by the fund, if any, is as follows:
| | | | | | | | Dividends and distributions |
| Affiliate | Ending
share
amount | Beginning
value | Cost of
purchases | Proceeds
from shares
sold | Realized
gain
(loss) | Change in
unrealized
appreciation
(depreciation) | Income
distributions
received | Capital gain
distributions
received | Ending
value |
| John Hancock Collateral Trust* | 11,773,464 | $163,520,202 | $4,561,003,878 | $(4,606,700,921) | $(73,720) | $122,952 | $2,018,665 | — | $117,872,391 |
| * | Refer to the Securities lending note within Note 2 for details regarding this investment. |
| 62 | JOHN HANCOCK Bond Fund | ANNUAL REPORT | |
Note 10—Interfund trading
The fund is permitted to purchase or sell securities from or to certain other affiliated funds, as set forth in Rule 17a-7 of the 1940 Act, under specified conditions outlined in procedures adopted by the Board of Trustees of the Trust. The procedures have been designed to ensure that any purchase or sale of securities by the fund from or to another fund that is or could be considered an affiliate complies with Rule 17a-7 of the 1940 Act. Further, as defined under the procedures, each transaction is effected at the current market price. Pursuant to these procedures, for the year ended May 31, 2020, the fund engaged in securities purchases amounting to $295,981,399.
Note 11—LIBOR discontinuation risk
LIBOR (London Interbank Offered Rate) is a measure of the average interest rate at which major global banks can borrow from one another. Following allegations of rate manipulation and concerns regarding its thin liquidity, in July 2017, the U.K. Financial Conduct Authority, which regulates LIBOR, announced that it will stop encouraging banks to provide the quotations needed to sustain LIBOR after 2021. This event will likely cause LIBOR to cease to be published. Before then, it is expected that market participants will transition to the use of different reference or benchmark rates. However, although regulators have suggested alternative rates, there is currently no definitive information regarding the future utilization of LIBOR or of any replacement rate.
It is uncertain what impact the discontinuation of LIBOR will have on the use of LIBOR as a reference rate for securities in which the fund invests. It is expected that market participants will amend financial instruments referencing LIBOR to include fallback provisions and other measures that contemplate the discontinuation of LIBOR or other similar market disruption events, but neither the effect of the transition process nor the viability of such measures is known. In addition, there are obstacles to converting certain longer term securities and transactions to a new benchmark or benchmarks and the effectiveness of one alternative reference rate versus multiple alternative reference rates in new or existing financial instruments and products has not been determined. As market participants transition away from LIBOR, LIBOR's usefulness may deteriorate, which could occur prior to the end of 2021. The transition process may lead to increased volatility and illiquidity in markets that currently rely on LIBOR to determine interest rates. LIBOR's deterioration may adversely affect the liquidity and/or market value of securities that use LIBOR as a benchmark interest rate.
Note 12—Coronavirus (COVID-19) pandemic
The novel COVID-19 disease has resulted in significant disruptions to global business activity. A widespread health crisis such as a global pandemic could cause substantial market volatility, exchange trading suspensions and closures, impact the ability to complete redemptions, and affect fund performance.
| | ANNUAL REPORT | JOHN HANCOCK Bond Fund | 63 |
Report of Independent Registered Public Accounting Firm
To the Board of Trustees of John Hancock Sovereign Bond Fund and Shareholders of John Hancock Bond Fund
Opinion on the Financial Statements
We have audited the accompanying statement of assets and liabilities, including the Fund’s investments, of John Hancock Bond Fund (the “Fund”) as of May 31, 2020, the related statement of operations for the year ended May 31, 2020, the statements of changes in net assets for each of the two years in the period ended May 31, 2020, including the related notes, and the financial highlights for each of the periods indicated therein (collectively referred to as the “financial statements”). In our opinion, the financial statements present fairly, in all material respects, the financial position of the Fund as of May 31, 2020, the results of its operations for the year then ended, the changes in its net assets for each of the two years in the period ended May 31, 2020 and the financial highlights for each of the periods indicated therein in conformity with accounting principles generally accepted in the United States of America.
Basis for Opinion
These financial statements are the responsibility of the Fund's management. Our responsibility is to express an opinion on the Fund’s financial statements based on our audits. We are a public accounting firm registered with the Public Company Accounting Oversight Board (United States) (“PCAOB”) and are required to be independent with respect to the Fund in accordance with the U.S. federal securities laws and the applicable rules and regulations of the Securities and Exchange Commission and the PCAOB.
We conducted our audits of these financial statements in accordance with the standards of the PCAOB. Those standards require that we plan and perform the audit to obtain reasonable assurance about whether the financial statements are free of material misstatement, whether due to error or fraud.
Our audits included performing procedures to assess the risks of material misstatement of the financial statements, whether due to error or fraud, and performing procedures that respond to those risks. Such procedures included examining, on a test basis, evidence regarding the amounts and disclosures in the financial statements. Our audits also included evaluating the accounting principles used and significant estimates made by management, as well as evaluating the overall presentation of the financial statements. Our procedures included confirmation of securities owned as of May 31, 2020 by correspondence with the custodian, transfer agent and brokers; when replies were not received from brokers, we performed other auditing procedures. We believe that our audits provide a reasonable basis for our opinion.
/s/ PricewaterhouseCoopers LLP
Boston, Massachusetts
July 13, 2020
We have served as the auditor of one or more investment companies in the John Hancock group of funds since 1988.
| 64 | JOHN HANCOCK Bond Fund | ANNUAL REPORT | |
Tax information (Unaudited)
For federal income tax purposes, the following information is furnished with respect to the distributions of the fund, if any, paid during its taxable year ended May 31, 2020.
The fund reports the maximum amount allowable of its net taxable income as eligible for the corporate dividends-received deduction.
The fund reports the maximum amount allowable of its net taxable income as qualified dividend income as provided in the Jobs and Growth Tax Relief Reconciliation Act of 2003.
The fund reports the maximum amount allowable of its Section 199A dividends as defined in Proposed Treasury Regulation §1.199A-3(d).
Eligible shareholders will be mailed a 2020 Form 1099-DIV in early 2021. This will reflect the tax character of all distributions paid in calendar year 2020.
Please consult a tax advisor regarding the tax consequences of your investment in the fund.
| | ANNUAL REPORT | JOHN HANCOCK BOND FUND | 65 |
STATEMENT REGARDING LIQUIDITY RISK MANAGEMENT
Operation of the Liquidity Risk Management Program
This section describes operation and effectiveness of the Liquidity Risk Management Program (LRMP) established in accordance with Rule 22e-4 under the Investment Company Act of 1940, as amended (the Liquidity Rule). The Board of Trustees (the Board) of each Fund in the John Hancock Group of Funds (each a Fund and collectively, the Funds) that is subject to the requirements of the Liquidity Rule has appointed John Hancock Investment Management LLC and John Hancock Variable Trust Advisers LLC (together, the Advisor) to serve as Administrator of the LRMP with respect to each of the Funds, including John Hancock Bond Fund, subject to the oversight of the Board. In order to provide a mechanism and process to perform the functions necessary to administer the LRMP, the Advisor established the Liquidity Risk Management Committee (the Committee). The Fund's subadvisor, Manulife Investment Management (US) LLC (the Subadvisor) executes the day-to-day investment management and security-level activities of the Fund in accordance with the requirements of the LRMP, subject to the supervision of the Advisor and the Board.
The Committee holds monthly meetings to: (1) review the day-to-day operations of the LRMP; (2) review and approve month end liquidity classifications; (3) review quarterly testing and determinations, as applicable; and (4) review other LRMP related material. The Committee also conducts daily, monthly, quarterly, and annual quantitative and qualitative assessments of each subadvisor to a Fund that is subject to the requirements of the Liquidity Rule and is a part of the LRMP to monitor investment performance issues, risks and trends. In addition, the Committee may conduct ad-hoc reviews and meetings with subadvisors as issues and trends are identified, including potential liquidity and valuation issues.
The Committee provided the Board at a meeting held on March 15-17, 2020 with a written report which addressed the Committee's assessment of the adequacy and effectiveness of the implementation and operation of the LRMP and any material changes to the LRMP. The report, which covered the period December 1, 2018 through December 31, 2019, included an assessment of important aspects of the LRMP including, but not limited to:
| • | Operation of the Fund's Redemption-In-Kind Procedures; |
| • | Highly Liquid Investment Minimum (HLIM) determination; |
| • | Compliance with the 15% limit on illiquid investments; |
| • | Reasonably Anticipated Trade Size (RATS) determination; |
| • | Security-level liquidity classifications; and |
| • | Liquidity risk assessment. |
The report also covered material liquidity matters which occurred or were reported during this period applicable to the Fund, if any, and the Committee's actions to address such matters.
Redemption-In-Kind Procedures
Rule 22e-4 requires any fund that engages in or reserves the right to engage in in-kind redemptions to adopt and implement written policies and procedures regarding in-kind redemptions as part of the management of its liquidity risk. These procedures address the process for redeeming in kind, as well as the circumstances under which the Fund would consider redeeming in kind. Anticipated large redemption activity will be evaluated to identify situations where redeeming in securities instead of cash may be appropriate.
ANNUAL REPORT | JOHN HANCOCK BOND FUND 66
As part of its annual assessment of the LRMP, the Committee reviewed the implementation and operation of the Redemption-In-Kind Procedures and determined they are operating in a manner that such procedures are adequate and effective to manage in-kind redemptions on behalf of the Fund as part of the LRMP.
Highly Liquid Investment Minimum determination
The Committee uses an HLIM model to determine a Fund's HLIM. This process incorporates the Fund's investment strategy, historical redemptions, liquidity classification rollup percentages and cash balances, redemption policy, access to funding sources, distribution channels and client concentrations. If the Fund falls below its established HLIM for a period greater than 7 consecutive calendar days, the Committee prepares a report to the Board within one business day following the seventh consecutive calendar day with an explanation of how the Fund plans to restore its HLIM within a reasonable period of time.
Based on the HLIM model, the Committee has determined that the Fund qualifies as a Primarily Highly Liquid Fund (PHLF). It is therefore not required to establish a HLIM. The Fund is tested quarterly to confirm its PHLF status.
As part of its annual assessment of the LRMP, the Committee reviewed the policies and procedures in place with respect to HLIM and PHLF determinations, and determined that such policies and procedures are operating in a manner that is adequate and effective as part of the LRMP.
Compliance with the 15% limit on illiquid investments
Rule 22e-4 sets an aggregate illiquid investment limit of 15% for a fund. Funds are prohibited from acquiring an illiquid investment if this results in greater than 15% of its net assets being classified as illiquid. When applying this limit, the Committee defines "illiquid investment" to mean any investment that the Fund reasonably expects cannot be sold or disposed of in current market conditions in seven calendar days or less without the sale or disposition significantly changing the market value of the investment. If a 15% illiquid investment limit breach occurs for longer than 1 business day, the Fund is required to notify the Board and provide a plan on how to bring illiquid investments within the 15% threshold, and after 7 days confidentially notify the Securities and Exchange Commission (the SEC).
In February 2019, as a result of extended security markets closures in connection with the Chinese New Year in certain countries, the SEC released guidance, and the Committee approved and adopted an Extended Market Holiday Policy to plan for and monitor known Extended Market Holidays (defined as all expected market holiday closures spanning four or more calendar days).
As part of its annual assessment of the LRMP, the Committee reviewed the policies and procedures in place with respect to the 15% illiquid investment limit and determined such policies and procedures are operating in a manner that is adequate and effective as part of the LMRP.
Reasonably Anticipated Trade Size determination
In order to assess the liquidity risk of a Fund, the Committee considers the impact on the Fund that redemptions of a RATS would have under both normal and reasonably foreseeable stressed conditions. Modelling the Fund's RATS requires quantifying cash flow volatility and analyzing distribution channel concentration and redemption risk. The model is designed to estimate the amount of assets that the Fund could reasonably anticipate trading on a given day, during both normal and reasonably foreseeable stressed conditions, to satisfy redemption requests.
ANNUAL REPORT | JOHN HANCOCK BOND FUND 67
As part of its annual assessment of the LRMP, the Committee reviewed the policies and procedures in place with respect to RATS determinations and determined that such policies and procedures are operating in a manner that is adequate and effective at making RATS determinations as part of the LRMP.
Security-level liquidity classifications
When classifying the liquidity of portfolio securities, the Fund adheres to the liquidity classification procedures established by the Advisor. In assigning a liquidity classification to Fund portfolio holdings, the following key inputs, among others, are considered: the Fund's RATS, feedback from the applicable Subadvisor on market-, trading- and investment-specific considerations, an assessment of current market conditions and fund portfolio holdings, and a value impact standard. The Subadvisor also provides position-level data to the Committee for use in monthly classification reconciliation in order to identify any classifications that may need to be changed as a result of the above considerations.
As part of its annual assessment of the LRMP, the Committee reviewed the policies and procedures in place with respect to security-level liquidity classifications and determined that such policies and procedures are operating in a manner that is adequate and effective as part of the LRMP.
Liquidity risk assessment
The Committee periodically reviews and assesses, the Fund's liquidity risk, including its investment strategy and liquidity of portfolio investments during both normal and reasonably foreseeable stressed conditions (including whether the investment strategy is appropriate for an open-end fund, the extent to which the strategy involves a relatively concentrated portfolio or large positions in particular issuers, and the use of borrowings for investment purposes and derivatives), cash flow analysis during both normal and reasonably foreseeable stressed conditions, and holdings of cash and cash equivalents, as well as borrowing arrangements and other funding sources.
The Committee also monitors global events, such as the COVID-19 Coronavirus, that could impact the markets and liquidity of portfolio investments and their classifications.
As part of its annual assessment of the LRMP, the Committee reviewed Fund-Level Liquidity Risk Assessment Reports for each of the Funds and determined that the investment strategy for each Fund continues to be appropriate for an open-ended structure.
Adequacy and Effectiveness
Based on the review and assessment conducted by the Committee, the Committee has determined that the LRMP has been implemented, and is operating in a manner that is adequate and effective at assessing and managing the liquidity risk of each Fund.
ANNUAL REPORT | JOHN HANCOCK BOND FUND 68
This chart provides information about the Trustees and Officers who oversee your John Hancock fund. Officers elected by the Trustees manage the day-to-day operations of the fund and execute policies formulated by the Trustees.
Independent Trustees
| | | |
Name, year of birth
Position(s) held with Trust
Principal occupation(s) and other
directorships during past 5 years | Trustee
of the
Trust
since1 | Number of John
Hancock funds
overseen by
Trustee |
| Hassell H. McClellan, Born: 1945 | 2012 | 195 |
Trustee and Chairperson of the Board
Director/Trustee, Virtus Funds (since 2008); Director, The Barnes Group (since 2010); Associate Professor, The Wallace E. Carroll School of Management, Boston College (retired 2013). Trustee (since 2005) and Chairperson of the Board (since 2017) of various trusts within the John Hancock Fund Complex. |
| | | |
| Charles L. Bardelis,2 Born: 1941 | 2012 | 195 |
Trustee
Director, Island Commuter Corp. (marine transport). Trustee of various trusts within the John Hancock Fund Complex (since 1988). |
| | | |
| James R. Boyle, Born: 1959 | 2015 | 195 |
Trustee
Chief Executive Officer, Foresters Financial (since 2018); Chairman and Chief Executive Officer, Zillion Group, Inc. (formerly HealthFleet, Inc.) (healthcare) (2014-2018); Executive Vice President and Chief Executive Officer, U.S. Life Insurance Division of Genworth Financial, Inc. (insurance) (January 2014-July 2014); Senior Executive Vice President, Manulife Financial, President and Chief Executive Officer, John Hancock (1999-2012); Chairman and Director, John Hancock Investment Management LLC, John Hancock Investment Management Distributors LLC, and John Hancock Variable Trust Advisers LLC (2005-2010). Trustee of various trusts within the John Hancock Fund Complex (2005-2014 and since 2015). |
| | | |
| Peter S. Burgess,2 Born: 1942 | 2012 | 195 |
Trustee
Consultant (financial, accounting, and auditing matters) (since 1999); Certified Public Accountant; Partner, Arthur Andersen (independent public accounting firm) (prior to 1999); Director, Lincoln Educational Services Corporation (since 2004); Director, Symetra Financial Corporation (2010-2016); Director, PMA Capital Corporation (2004-2010). Trustee of various trusts within the John Hancock Fund Complex (since 2005). |
| | | |
| William H. Cunningham, Born: 1944 | 2005 | 195 |
Trustee
Professor, University of Texas, Austin, Texas (since 1971); former Chancellor, University of Texas System and former President of the University of Texas, Austin, Texas; Chairman (since 2009) and Director (since 2006), Lincoln National Corporation (insurance); Director, Southwest Airlines (since 2000); former Director, LIN Television (2009-2014). Trustee of various trusts within the John Hancock Fund Complex (since 1986). |
| | | |
| Grace K. Fey, Born: 1946 | 2012 | 195 |
Trustee
Chief Executive Officer, Grace Fey Advisors (since 2007); Director and Executive Vice President, Frontier Capital Management Company (1988-2007); Director, Fiduciary Trust (since 2009). Trustee of various trusts within the John Hancock Fund Complex (since 2008). |
ANNUAL REPORT | JOHN HANCOCK BOND FUND 69
Independent Trustees (continued)
| | | |
Name, year of birth
Position(s) held with Trust
Principal occupation(s) and other
directorships during past 5 years | Trustee
of the
Trust
since1 | Number of John
Hancock funds
overseen by
Trustee |
| Deborah C. Jackson, Born: 1952 | 2008 | 195 |
Trustee
President, Cambridge College, Cambridge, Massachusetts (since 2011); Board of Directors, Massachusetts Women's Forum (since 2018); Board of Directors, National Association of Corporate Directors/New England (since 2015); Board of Directors, Association of Independent Colleges and Universities of Massachusetts (2014-2017); Chief Executive Officer, American Red Cross of Massachusetts Bay (2002-2011); Board of Directors of Eastern Bank Corporation (since 2001); Board of Directors of Eastern Bank Charitable Foundation (since 2001); Board of Directors of American Student Assistance Corporation (1996-2009); Board of Directors of Boston Stock Exchange (2002-2008); Board of Directors of Harvard Pilgrim Healthcare (health benefits company) (2007-2011). Trustee of various trusts within the John Hancock Fund Complex (since 2008). |
| | | |
| James M. Oates,2 Born: 1946 | 2012 | 195 |
Trustee
Managing Director, Wydown Group (financial consulting firm) (since 1994); Chairman and Director, Emerson Investment Management, Inc. (2000-2015); Independent Chairman, Hudson Castle Group, Inc. (formerly IBEX Capital Markets, Inc.) (financial services company) (1997-2011); Director, Stifel Financial (since 1996); Director, Investor Financial Services Corporation (1995-2007); Director, Connecticut River Bancorp (1998-2014); Director/Trustee, Virtus Funds (since 1988). Trustee (since 2004) and Chairperson of the Board (2005-2016) of various trusts within the John Hancock Fund Complex. |
| | | |
| Steven R. Pruchansky, Born: 1944 | 2005 | 195 |
Trustee and Vice Chairperson of the Board
Managing Director, Pru Realty (since 2017); Chairman and Chief Executive Officer, Greenscapes of Southwest Florida, Inc. (2014-2020); Director and President, Greenscapes of Southwest Florida, Inc. (until 2000); Member, Board of Advisors, First American Bank (until 2010); Managing Director, Jon James, LLC (real estate) (since 2000); Partner, Right Funding, LLC (2014-2017); Director, First Signature Bank & Trust Company (until 1991); Director, Mast Realty Trust (until 1994); President, Maxwell Building Corp. (until 1991). Trustee (since 1992), Chairperson of the Board (2011-2012), and Vice Chairperson of the Board (since 2012) of various trusts within the John Hancock Fund Complex. |
| | | |
| Gregory A. Russo, Born: 1949 | 2009 | 195 |
Trustee
Director and Audit Committee Chairman (2012-2020), and Member, Audit Committee and Finance Committee (2011-2020), NCH Healthcare System, Inc. (holding company for multi-entity healthcare system); Director and Member (2012-2018) and Finance Committee Chairman (2014-2018), The Moorings, Inc. (nonprofit continuing care community); Vice Chairman, Risk & Regulatory Matters, KPMG LLP (KPMG) (2002-2006); Vice Chairman, Industrial Markets, KPMG (1998-2002); Chairman and Treasurer, Westchester County, New York, Chamber of Commerce (1986-1992); Director, Treasurer, and Chairman of Audit and Finance Committees, Putnam Hospital Center (1989-1995); Director and Chairman of Fundraising Campaign, United Way of Westchester and Putnam Counties, New York (1990-1995). Trustee of various trusts within the John Hancock Fund Complex (since 2008). |
ANNUAL REPORT | JOHN HANCOCK BOND FUND 70
Non-Independent Trustees3
| | | |
Name, year of birth
Position(s) held with Trust
Principal occupation(s) and other
directorships during past 5 years | Trustee
of the
Trust
since1 | Number of John
Hancock funds
overseen by
Trustee |
| Andrew G. Arnott, Born: 1971 | 2017 | 195 |
President and Non-Independent Trustee
Head of Wealth and Asset Management, United States and Europe, for John Hancock and Manulife (since 2018); Executive Vice President, John Hancock Financial Services (since 2009, including prior positions); Director and Executive Vice President, John Hancock Investment Management LLC (since 2005, including prior positions); Director and Executive Vice President, John Hancock Variable Trust Advisers LLC (since 2006, including prior positions); President, John Hancock Investment Management Distributors LLC (since 2004, including prior positions); President of various trusts within the John Hancock Fund Complex (since 2007, including prior positions). Trustee of various trusts within the John Hancock Fund Complex (since 2017). |
| | | |
| Marianne Harrison, Born: 1963 | 2018 | 195 |
Non-Independent Trustee
President and CEO, John Hancock (since 2017); President and CEO, Manulife Canadian Division (2013-2017); Member, Board of Directors, CAE Inc. (since 2019); Member, Board of Directors, MA Competitive Partnership Board (since 2018); Member, Board of Directors, American Council of Life Insurers (ACLI) (since 2018); Member, Board of Directors, Communitech, an industry-led innovation center that fosters technology companies in Canada (2017-2019); Member, Board of Directors, Manulife Assurance Canada (2015-2017); Board Member, St. Mary's General Hospital Foundation (2014-2017); Member, Board of Directors, Manulife Bank of Canada (2013-2017); Member, Standing Committee of the Canadian Life & Health Assurance Association (2013-2017); Member, Board of Directors, John Hancock USA, John Hancock Life & Health, John Hancock New York (2012-2013). Trustee of various trusts within the John Hancock Fund Complex (since 2018). |
Principal officers who are not Trustees
| | |
Name, year of birth
Position(s) held with Trust
Principal occupation(s)
during past 5 years | Officer
of the
Trust
since |
| Francis V. Knox, Jr., Born: 1947 | 2005 |
Chief Compliance Officer
Vice President, John Hancock Financial Services (since 2005); Chief Compliance Officer, various trusts within the John Hancock Fund Complex, John Hancock Investment Management LLC, and John Hancock Variable Trust Advisers LLC (since 2005). |
| | |
| Charles A. Rizzo, Born: 1957 | 2007 |
Chief Financial Officer
Vice President, John Hancock Financial Services (since 2008); Senior Vice President, John Hancock Investment Management LLC and John Hancock Variable Trust Advisers LLC (since 2008); Chief Financial Officer of various trusts within the John Hancock Fund Complex (since 2007). |
| | |
| Salvatore Schiavone, Born: 1965 | 2010 |
Treasurer
Assistant Vice President, John Hancock Financial Services (since 2007); Vice President, John Hancock Investment Management LLC and John Hancock Variable Trust Advisers LLC (since 2007); Treasurer of various trusts within the John Hancock Fund Complex (since 2007, including prior positions). |
ANNUAL REPORT | JOHN HANCOCK BOND FUND 71
Principal officers who are not Trustees (continued)
| | |
Name, year of birth
Position(s) held with Trust
Principal occupation(s)
during past 5 years | Officer
of the
Trust
since |
| Christopher (Kit) Sechler, Born: 1973 | 2018 |
Chief Legal Officer and Secretary
Vice President and Deputy Chief Counsel, John Hancock Investments (since 2015); Assistant Vice President and Senior Counsel (2009-2015), John Hancock Investment Management; Chief Legal Officer and Secretary of various trusts within the John Hancock Fund Complex (since 2018); Assistant Secretary of John Hancock Investment Management LLC and John Hancock Variable Trust Advisers LLC (since 2009). |
The business address for all Trustees and Officers is 200 Berkeley Street, Boston, Massachusetts 02116-5023.
The Statement of Additional Information of the fund includes additional information about members of the Board of Trustees of the Trust and is available without charge, upon request, by calling 800-225-5291.
| 1 | Each Trustee holds office until his or her successor is elected and qualified, or until the Trustee's death, retirement, resignation, or removal. Mr. Boyle has served as Trustee at various times prior to the date listed in the table. |
| 2 | Member of the Audit Committee. |
| 3 | The Trustee is a Non-Independent Trustee due to current or former positions with the Advisor and certain affiliates. |
ANNUAL REPORT | JOHN HANCOCK BOND FUND 72
| | |
Trustees
Hassell H. McClellan, Chairperson
Steven R. Pruchansky, Vice Chairperson
Andrew G. Arnott†
Charles L. Bardelis*
James R. Boyle
Peter S. Burgess*
William H. Cunningham
Grace K. Fey
Marianne Harrison†
Deborah C. Jackson
James M. Oates*
Gregory A. Russo
Officers
Andrew G. Arnott
President
Francis V. Knox, Jr.
Chief Compliance Officer
Charles A. Rizzo
Chief Financial Officer
Salvatore Schiavone
Treasurer
Christopher (Kit) Sechler
Secretary and Chief Legal Officer
| Investment advisor
John Hancock Investment Management LLC
Subadvisor
Manulife Investment Management (US) LLC
Portfolio Managers
Jeffrey N. Given, CFA
Howard C. Greene, CFA
Principal distributor
John Hancock Investment Management Distributors LLC
Custodian
State Street Bank and Trust Company
Transfer agent
John Hancock Signature Services, Inc.
Legal counsel
K&L Gates LLP
Independent registered public accounting firm
PricewaterhouseCoopers LLP
|
* Member of the Audit Committee
† Non-Independent Trustee
The fund's proxy voting policies and procedures, as well as the fund proxy voting record for the most recent twelve-month period ended June 30, are available free of charge on the Securities and Exchange Commission (SEC) website at sec.gov or on our website.
All of the fund's holdings as of the end of the third month of every fiscal quarter are filed with the SEC on Form N-PORT within 60 days of the end of the fiscal quarter. The fund's Form N-PORT filings are available on our website and the SEC's website, sec.gov.
We make this information on your fund, as well as monthly portfolio holdings, and other fund details available on our website at jhinvestments.com or by calling 800-225-5291.
| | | | |
| | You can also contact us: |
| | 800-225-5291
jhinvestments.com | Regular mail:
John Hancock Signature Services, Inc.
PO Box 219909
Kansas City, MO 64121-9909
| Express mail:
John Hancock Signature Services, Inc.
430 W 7th Street
Suite 219909
Kansas City, MO 64105-1407
|
ANNUAL REPORT | JOHN HANCOCK BOND FUND 73
John Hancock family of funds
| | | |
DOMESTIC EQUITY FUNDS
Blue Chip Growth
Classic Value
Disciplined Value
Disciplined Value Mid Cap
Equity Income
Financial Industries
Fundamental All Cap Core
Fundamental Large Cap Core
New Opportunities
Regional Bank
Small Cap Core
Small Cap Growth
Small Cap Value
U.S. Global Leaders Growth
U.S. Quality Growth
GLOBAL AND INTERNATIONAL EQUITY FUNDS
Disciplined Value International
Emerging Markets
Emerging Markets Equity
Fundamental Global Franchise
Global Equity
Global Shareholder Yield
Global Thematic Opportunities
International Dynamic Growth
International Growth
International Small Company
| | INCOME FUNDS
Bond
California Tax-Free Income
Emerging Markets Debt
Floating Rate Income
Government Income
High Yield
High Yield Municipal Bond
Income
Investment Grade Bond
Money Market
Short Duration Bond
Short Duration Credit Opportunities
Strategic Income Opportunities
Tax-Free Bond
ALTERNATIVE AND SPECIALTY FUNDS
Absolute Return Currency
Alternative Asset Allocation
Alternative Risk Premia
Diversified Macro
Infrastructure
Multi-Asset Absolute Return
Seaport Long/Short
|
A fund's investment objectives, risks, charges, and expenses should be considered carefully before investing. The prospectus contains this and other important information about the fund. To obtain a prospectus, contact your financial professional, call John Hancock Investment Management at 800-225-5291, or visit our website at jhinvestments.com. Please read the prospectus carefully before investing or sending money.
| | | |
ASSET ALLOCATION
Balanced
Multi-Asset High Income
Multi-Index Lifetime Portfolios
Multi-Index Preservation Portfolios
Multimanager Lifestyle Portfolios
Multimanager Lifetime Portfolios
Retirement Income 2040
EXCHANGE-TRADED FUNDS
John Hancock Multifactor Consumer Discretionary ETF
John Hancock Multifactor Consumer Staples ETF
John Hancock Multifactor Developed International ETF
John Hancock Multifactor Emerging Markets ETF
John Hancock Multifactor Energy ETF
John Hancock Multifactor Financials ETF
John Hancock Multifactor Healthcare ETF
John Hancock Multifactor Industrials ETF
John Hancock Multifactor Large Cap ETF
John Hancock Multifactor Materials ETF
John Hancock Multifactor Media and
Communications ETF
John Hancock Multifactor Mid Cap ETF
John Hancock Multifactor Small Cap ETF
John Hancock Multifactor Technology ETF
John Hancock Multifactor Utilities ETF
| | ENVIRONMENTAL, SOCIAL, AND
GOVERNANCE FUNDS
ESG All Cap Core
ESG Core Bond
ESG International Equity
ESG Large Cap Core
CLOSED-END FUNDS
Financial Opportunities
Hedged Equity & Income
Income Securities Trust
Investors Trust
Preferred Income
Preferred Income II
Preferred Income III
Premium Dividend
Tax-Advantaged Dividend Income
Tax-Advantaged Global Shareholder Yield
|
John Hancock Multifactor ETF shares are bought and sold at market price (not NAV), and are not individually redeemed
from the fund. Brokerage commissions will reduce returns.
John Hancock ETFs are distributed by Foreside Fund Services, LLC, and are subadvised by Dimensional Fund Advisors LP.
Foreside is not affiliated with John Hancock Investment Management Distributors LLC or Dimensional Fund Advisors LP.
Dimensional Fund Advisors LP receives compensation from John Hancock in connection with licensing rights to the
John Hancock Dimensional indexes. Dimensional Fund Advisors LP does not sponsor, endorse, or sell, and makes no
representation as to the advisability of investing in, John Hancock Multifactor ETFs.
John Hancock Investment Management
A trusted brand
John Hancock Investment Management is a premier asset manager
representing one of America's most trusted brands, with a heritage of
financial stewardship dating back to 1862. Helping our shareholders
pursue their financial goals is at the core of everything we do. It's why
we support the role of professional financial advice and operate with
the highest standards of conduct and integrity.
A better way to invest
We serve investors globally through a unique multimanager approach:
We search the world to find proven portfolio teams with specialized
expertise for every strategy we offer, then we apply robust investment
oversight to ensure they continue to meet our uncompromising
standards and serve the best interests of our shareholders.
Results for investors
Our unique approach to asset management enables us to provide
a diverse set of investments backed by some of the world's best
managers, along with strong risk-adjusted returns across asset classes.
John Hancock Investment Management Distributors LLC n Member FINRA, SIPC
200 Berkeley Street n Boston, MA 02116-5010 n 800-225-5291 n jhinvestments.com
This report is for the information of the shareholders of John Hancock Bond Fund. It is not authorized for distribution to prospective investors unless preceded or accompanied by a prospectus.
ITEM 2. CODE OF ETHICS.
As of the end of the year, May 31, 2020, the registrant has adopted a code of ethics, as defined in Item 2 of Form N-CSR, that applies to its Chief Executive Officer, Chief Financial Officer and Treasurer (respectively, the principal executive officer, the principal financial officer and the principal accounting officer, the “Covered Officers”). A copy of the code of ethics is filed as an exhibit to this Form N-CSR.
ITEM 3. AUDIT COMMITTEE FINANCIAL EXPERT.
Peter S. Burgess is the audit committee financial expert and is “independent”, pursuant to general instructions on Form N-CSR Item 3.
ITEM 4. PRINCIPAL ACCOUNTANT FEES AND SERVICES.
(a) Audit Fees
The aggregate fees billed for professional services rendered by the principal accountant for the audits of the registrant’s annual financial statements or services that are normally provided by the accountant in connection with statutory and regulatory filings or engagements amounted to the following for the fiscal years ended May 31, 2020 and 2019. These fees were billed to the registrant and were approved by the registrant’s audit committee.
| Fund | May 31, 2020 | May 31, 2019 |
| John Hancock Bond Fund | $ | 65,907 | $ | 59,487 |
(b) Audit-Related Services
Audit-related fees for assurance and related services by the principal accountant are billed to the registrant or to the registrant’s investment adviser (not including any sub-adviser whose role is primarily portfolio management and is subcontracted with or overseen by another investment adviser), and any entity controlling, controlled by, or under common control with the adviser ("control affiliates") that provides ongoing services to the registrant. The nature of the services provided was affiliated service provider internal controls reviews. Additionally, amounts billed to control affiliates were $116,467 and $113,000 for the fiscal years ended May 31, 2020 and 2019, respectively.
| Fund | May 31, 2020 | May 31, 2019 |
| John Hancock Bond Fund | $ | 591 | $ | 571 |
(c) Tax Fees
The aggregate fees billed for professional services rendered by the principal accountant for tax compliance, tax advice and tax planning (“tax fees”) amounted to the following for the fiscal years ended May 31, 2020 and 2019. The nature of the services comprising the tax fees was the review of the registrant’s tax returns and tax distribution requirements. These fees were billed to the registrant and were approved by the registrant’s audit committee.
| Fund | May 31, 2020 | May 31, 2019 |
| John Hancock Bond Fund | $ | 3,837 | $ | 3,725 |
(d) All Other Fees
Other fees billed for professional services rendered by the principal accountant to the registrant or to the control affiliates for the fiscal years ended May 31, 2020 and 2019 amounted to the following:
| Fund | May 31, 2020 | May 31, 2019 |
| John Hancock Bond Fund | $ | 89 | $ | 89 |
(e)(1) Audit Committee Pre-Approval Policies and Procedures:
The trust’s Audit Committee must pre-approve all audit and non-audit services provided by the independent registered public accounting firm (the “Auditor”) relating to the operations or financial reporting of the funds. Prior to the commencement of any audit or non-audit services to a fund, the Audit Committee reviews the services to determine whether they are appropriate and permissible under applicable law.
The trust’s Audit Committee has adopted policies and procedures to, among other purposes, provide a framework for the Committee’s consideration of audit-related and non-audit services by the Auditor. The policies and procedures require that any audit-related and non-audit service provided by the Auditor and any non-audit service provided by the Auditor to a fund service provider that relates directly to the operations and financial reporting of a fund are subject to approval by the Audit Committee before such service is provided. Audit-related services provided by the Auditor that are expected to exceed $25,000 per year/per fund are subject to specific pre-approval by the Audit Committee. Tax services provided by the Auditor that are expected to exceed $30,000 per year/per fund are subject to specific pre-approval by the Audit Committee.
All audit services, as well as the audit-related and non-audit services that are expected to exceed the amounts stated above, must be approved in advance of provision of the service by formal resolution of the Audit Committee. At the regularly scheduled Audit Committee meetings, the Committee reviews a report summarizing the services, including fees, provided by the Auditor.
(e)(2) Services approved pursuant to paragraph (c)(7)(i)(C) of Rule 2-01 of Regulation S-X:
Audit-Related Fees, Tax Fees and All Other Fees:
There were no amounts that were approved by the Audit Committee pursuant to the de minimis exception under Rule 2-01 of Regulation S-X.
(f) According to the registrant’s principal accountant for the fiscal year ended May 31, 2019, the percentage of hours spent on the audit of the registrant's financial statements for the most recent fiscal year that were attributed to work performed by persons who were not full-time, permanent employees of principal accountant was less than 50%.
(g) The aggregate non-audit fees billed by the registrant’s principal accountant for non-audit services rendered to the registrant and rendered to the registrant's control affiliates for the fiscal years ended May 31, 2020 and 2019 amounted to the following:
| Trust | May 31, 2020 | May 31, 2019 |
| John Hancock Sovereign Bond Fund | $ | 1,016,925 | $ | 919,444 |
(h) The audit committee of the registrant has considered the non-audit services provided by the registrant’s principal accountant to the control affiliates and has determined that the services that were not pre-approved are compatible with maintaining the principal accountant’s independence.
ITEM 5. AUDIT COMMITTEE OF LISTED REGISTRANTS.
The registrant has a separately-designated standing audit committee comprised of independent trustees. The members of the audit committee are as follows:
Peter S. Burgess - Chairman
Charles L. Bardelis
Theron S. Hoffman
ITEM 6. SCHEDULE OF INVESTMENTS.
(a) Not applicable.
(b) Not applicable.
ITEM 7. DISCLOSURE OF PROXY VOTING POLICIES AND PROCEDURES FOR CLOSED-END MANAGEMENT INVESTMENT COMPANIES.
Not applicable.
ITEM 8. PORTFOLIO MANAGERS OF CLOSED-END MANAGEMENT INVESTMENT COMPANIES.
Not applicable.
ITEM 9. PURCHASES OF EQUITY SECURITIES BY CLOSED-END MANAGEMENT INVESTMENT COMPANY AND AFFILIATED PURCHASERS.
Not applicable.
ITEM 10. SUBMISSION OF MATTERS TO A VOTE OF SECURITY HOLDERS.
The registrant has adopted procedures by which shareholders may recommend nominees to the registrant's Board of Trustees. A copy of the procedures is filed as an exhibit to this Form N-CSR. See attached “John Hancock Funds – Nominating, Governance and Administration Committee Charter”.
ITEM 11. CONTROLS AND PROCEDURES.
(a) Based upon their evaluation of the registrant's disclosure controls and procedures as conducted within 90 days of the filing date of this Form N-CSR, the registrant's principal executive officer and principal financial officer have concluded that those disclosure controls and procedures provide reasonable assurance that the material information required to be disclosed by the registrant on this report is recorded, processed, summarized and reported within the time periods specified in the Securities and Exchange Commission's rules and forms.
(b) There were no changes in the registrant's internal control over financial reporting that occurred during the period covered by this report that have materially affected, or are reasonably likely to materially affect, the registrant's internal control over financial reporting.
ITEM 12. DISCLOSURE OF SECURITIES LENDING ACTIVITIES FOR CLOSED-END MANAGEMENT INVESTMENT COMPANIES.: Not applicable.
ITEM 13. EXHIBITS.
(a)(1) Code of Ethics for Covered Officers is attached.
(a)(2) Separate certifications for the registrant's principal executive officer and principal financial officer, as required by Section 302 of the Sarbanes-Oxley Act of 2002 and Rule 30a-2(a) under the Investment Company Act of 1940, are attached.
(b)(1) Separate certifications for the registrant's principal executive officer and principal financial officer, as required by 18 U.S.C. Section 1350, as adopted pursuant to Section 906 of the Sarbanes-Oxley Act of 2002, and Rule 30a-2(b) under the Investment Company Act of 1940, are attached. The certifications furnished pursuant to this paragraph are not deemed to be "filed" for purposes of Section 18 of the Securities Exchange Act of 1934, or otherwise subject to the liability of that section. Such certifications are not deemed to be incorporated by reference into any filing under the Securities Act of 1933 or the Securities Exchange Act of 1934, except to the extent that the Registrant specifically incorporates them by reference.
(c)(1) Submission of Matters to a Vote of Security Holders is attached. See attached “John Hancock Funds – Nominating, Governance and Administration Committee Charter”.
SIGNATURES
Pursuant to the requirements of the Securities Exchange Act of 1934 and the Investment Company Act of 1940, the registrant has duly caused this report to be signed on its behalf by the undersigned, thereunto duly authorized.
John Hancock Sovereign Bond Fund
| By: | /s/ Andrew Arnott | |
| Andrew Arnott | |
| President | |
| | |
| | |
| Date: | July 14, 2020 |
| |
| |
| Pursuant to the requirements of the Securities Exchange Act of 1934 and the Investment Company Act of 1940, this report has been signed below by the following persons on behalf of the registrant and in the capacities and on the dates indicated. |
| |
| |
| By: | /s/ Andrew Arnott | |
| Andrew Arnott | |
| President | |
| |
| |
| Date: | July 14, 2020 |
| |
| |
| By: | /s/ Charles A. Rizzo | |
| Charles A. Rizzo | |
| Chief Financial Officer | |
| |
| | |
| Date: | July 14, 2020 |