UNITED STATES
SECURITIES AND EXCHANGE COMMISSION
Washington, D.C. 20549
FORM N-CSR
CERTIFIED SHAREHOLDER REPORT OF REGISTERED
MANAGEMENT INVESTMENT COMPANIES
Investment Company Act file number811- 1677
John Hancock Capital Series
(Exact name of registrant as specified in charter)
200 Berkeley Street, Boston, Massachusetts 02116
(Address of principal executive offices) (Zip code)
Salvatore Schiavone
Treasurer
200 Berkeley Street
Boston, Massachusetts 02116
(Name and address of agent for service)
Registrant's telephone number, including area code:617-663-4497
| Date of fiscal year end: | October 31 | |
| Date of reporting period: | April 30, 2020 |
ITEM 1. REPORTS TO STOCKHOLDERS.
John Hancock
U.S. Global Leaders Growth Fund
Semiannual report 4/30/2020
Beginning on January 1, 2021, as permitted by regulations adopted by the Securities and Exchange Commission, paper copies of the fund's shareholder reports like this one will no longer be sent by mail, unless you specifically request paper copies of the reports from the fund or from your financial intermediary. Instead, the reports will be made available on a website, and you will be notified by mail each time a report is posted and provided with a website link to access the report.
If you already elected to receive shareholder reports electronically, you will not be affected by this change, and you do not need to take any action. You may elect to receive shareholder reports and other communications electronically by calling John Hancock Investment Management at 800-225-5291 (Class A, Class B and Class C shares) or 888-972-8696 (Class I, Class R2 and Class R6 shares) or by contacting your financial intermediary.
You may elect to receive all reports in paper, free of charge, at any time. You can inform John Hancock Investment Management or your financial intermediary that you wish to continue receiving paper copies of your shareholder reports by following the instructions listed above. Your election to receive reports in paper will apply to all funds held with John Hancock Investment Management or your financial intermediary.


A message to shareholders
Dear shareholder,
The U.S. financial markets were on pace to deliver strong returns during the 6 months ended April 30, 2020, until heightened fears over the coronavirus (COVID-19) sent markets tumbling during the latter half of February and early March.
In response to the sell-off, the U.S. Federal Reserve acted quickly with a broad array of actions to limit the economic damage from the pandemic, including up to $2.3 trillion in lending to support households, employers, financial markets, and state and local governments. These steps, along with the passage of an estimated $2 trillion federal economic stimulus bill, helped lift the markets during the final month of the period.
The continued spread of COVID-19, trade disputes, rising unemployment, and other geopolitical tensions may continue to create uncertainty among businesses and investors. Your financial professional can helpposition your portfolio so that it's sufficiently diversified to seek to meet your long-term objectives and to withstand the inevitable bouts of market volatility along the way.
On behalf of everyone at John Hancock Investment Management, I'd like to take this opportunity to welcome new shareholders and thank existing shareholders for the continued trust you've placed in us.
Sincerely,

Andrew G. Arnott
President and CEO,
John Hancock Investment Management
Head of Wealth and Asset Management,
United States and Europe
This commentary reflects the CEO's views as of this report's period end and are subject to change at any time. Diversification does not guarantee investment returns and does not eliminate risk of loss. All investments entail risks, including the possible loss of principal. For more up-to-date information, you can visit our website at jhinvestments.com.
John Hancock
U.S. Global Leaders Growth Fund
INVESTMENT OBJECTIVE
The fund seeks long-term growth of capital.
AVERAGE ANNUAL TOTAL RETURNS AS OF 4/30/2020 (%)
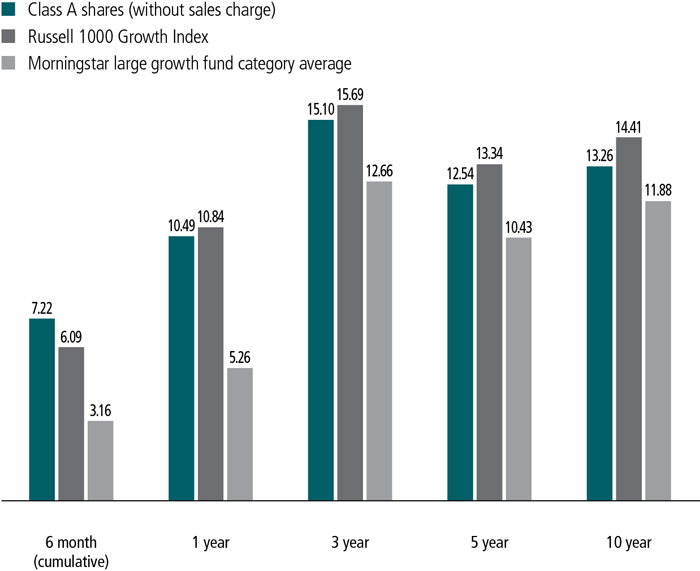
The Russell 1000 Growth Index is an unmanaged index of companies in the Russell 1000 Index (the 1,000 largest U.S. publicly traded companies) with high price-to-book ratios and higher forecasted growth values.
It is not possible to invest directly in an index. Index figures do not reflect expenses or sales charges, which would result in lower returns.
Figures from Morningstar, Inc. include reinvested distributions and do not take into account sales charges. Actual load-adjusted performance is lower.
The past performance shown here reflects reinvested distributions and the beneficial effect of any expense reductions, and does not guarantee future results. Returns for periods shorter than one year are cumulative. Performance of the other share classes will vary based on the difference in the fees and expenses of those classes. Shares will fluctuate in value and, when redeemed, may be worth more or less than their original cost. Current month-end performance may be lower or higher than the performance cited, and can be found at jhinvestments.com or by calling 800-225-5291. For further information on the fund's objectives, risks, and strategy, see the fund's prospectus. The fund recently experienced negative short-term performance due to market volatility associated with the COVID-19 pandemic.
SECTOR COMPOSITION AS OF 4/30/2020 (%)
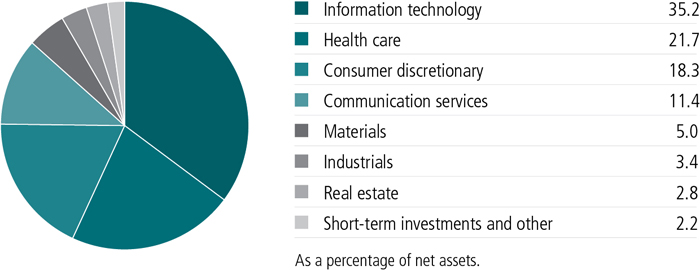
TOP 10 HOLDINGS AS OF 4/30/2020 (%)
| Amazon.com, Inc. | 5.5 |
| Microsoft Corp. | 5.1 |
| Alphabet, Inc., Class C | 5.0 |
| Visa, Inc., Class A | 4.7 |
| Facebook, Inc., Class A | 4.4 |
| PayPal Holdings, Inc. | 4.3 |
| Autodesk, Inc. | 4.1 |
| UnitedHealth Group, Inc. | 4.0 |
| NIKE, Inc., Class B | 3.6 |
| salesforce.com, Inc. | 3.4 |
| TOTAL | 44.1 |
| As a percentage of net assets. | |
| Cash and cash equivalents are not included. | |
A note about risks
The fund may be subject to various risks as described in the fund's prospectus. A widespread health crisis such as a global pandemic could cause substantial market volatility, exchange trading suspensions and closures, impact the ability to complete redemptions, and affect fund performance. For example, the novel coronavirus disease (COVID-19) has resulted in significant disruptions to global business activity. The impact of a health crisis and other epidemics and pandemics that may arise in the future, could affect the global economy in ways that cannot necessarily be foreseen at the present time. A health crisis may exacerbate other pre-existing political, social, and economic risks. Any such impact could adversely affect the funds' performance, resulting in losses to your investment. For more information, please refer to the "Principal risks" section of the prospectus.
TOTAL RETURNS FOR THE PERIOD ENDED APRIL 30, 2020
| Average annual total returns (%) with maximum sales charge | Cumulative total returns (%) with maximum sales charge | ||||||
| 1-year | 5-year | 10-year | 6-month | 5-year | 10-year | ||
| Class A | 4.97 | 11.39 | 12.68 | 1.87 | 71.50 | 229.94 | |
| Class B | 4.65 | 11.45 | 12.58 | 1.91 | 71.95 | 227.05 | |
| Class C | 8.65 | 11.70 | 12.41 | 5.84 | 73.90 | 222.28 | |
| Class I1 | 10.76 | 12.83 | 13.60 | 7.35 | 82.84 | 257.83 | |
| Class R21,2 | 10.34 | 12.39 | 13.17 | 7.16 | 79.31 | 244.58 | |
| Class R61,2 | 10.89 | 12.95 | 13.63 | 7.42 | 83.87 | 258.92 | |
| Index 1† | 10.84 | 13.34 | 14.41 | 6.09 | 87.00 | 284.27 | |
| Index 2† | 0.86 | 9.12 | 11.69 | -3.16 | 54.74 | 202.21 | |
Performance figures assume all distributions have been reinvested. Figures reflect maximum sales charges on Class A shares of 5% and the applicable contingent deferred sales charge (CDSC) on Class B and Class C shares. The Class B shares' CDSC declines annually between years 1 to 6 according to the following schedule: 5%, 4%, 3%, 3%, 2%, 1%. No sales charge will be assessed after the sixth year. Class C shares sold within one year of purchase are subject to a 1% CDSC. Sales charges are not applicable to Class I, Class R2, and Class R6 shares.
The expense ratios of the fund, both net (including any fee waivers and/or expense limitations) and gross (excluding any fee waivers and/or expense limitations), are set forth according to the most recent publicly available prospectus for the fund and may differ from those disclosed in the Financial highlights tables in this report. Net expenses reflect contractual expense limitations in effect until July 31, 2021 and are subject to change. Had the contractual fee waivers and expense limitations not been in place, gross expenses would apply. The expense ratios are as follows:
| Class A | Class B | Class C | Class I | Class R2 | Class R6 | ||
| Gross | 1.16 | 1.91 | 1.91 | 0.91 | 1.31 | 0.81 | |
| Net (%) | 1.15 | 1.90 | 1.90 | 0.90 | 1.30 | 0.80 |
Please refer to the most recent prospectus and annual or semiannual report for more information on expenses and any expense limitation arrangements for each class.
The returns reflect past results and should not be considered indicative of future performance. The return and principal value of an investment will fluctuate so that shares, when redeemed, may be worth more or less than their original cost. Due to market volatility and other factors, the fund's current performance may be higher or lower than the performance shown. For current to the most recent month-end performance data, please call 800-225-5291 or visit the fund's website at jhinvestments.com.
The performance table above and the chart on the next page do not reflect the deduction of taxes that a shareholder would pay on fund distributions or the redemption of fund shares. The fund's performance results reflect any applicable fee waivers or expense reductions, without which the expenses would increase and results would have been less favorable.
| † | Index 1 is the Russell 1000 Growth Index; Index 2 is the S&P 500 Index. |
See the following page for footnotes.
This chart and table show what happened to a hypothetical $10,000 investment in John Hancock U.S. Global Leaders Growth Fund for the share classes and periods indicated, assuming all distributions were reinvested. For comparison, we've shown the same investment in two separate indexes.
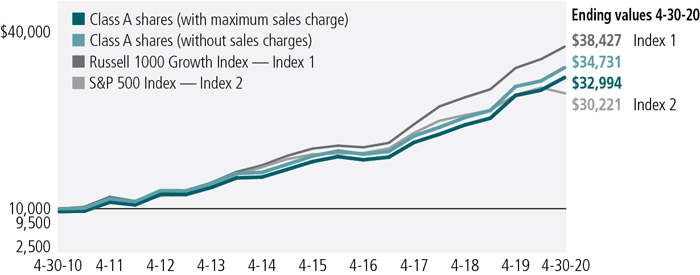
| Start date | With maximum sales charge ($) | Without sales charge ($) | Index 1 ($) | Index 2 ($) | |
| Class B3 | 4-30-10 | 32,705 | 32,705 | 38,427 | 30,221 |
| Class C3 | 4-30-10 | 32,228 | 32,228 | 38,427 | 30,221 |
| Class I1 | 4-30-10 | 35,783 | 35,783 | 38,427 | 30,221 |
| Class R21,2 | 4-30-10 | 34,458 | 34,458 | 38,427 | 30,221 |
| Class R61,2 | 4-30-10 | 35,892 | 35,892 | 38,427 | 30,221 |
The Russell 1000 Growth Index is an unmanaged index of companies in the Russell 1000 Index (the 1,000 largest U.S. publicly traded companies) with high price-to-book ratios and higher forecasted growth values.
The S&P 500 Index is an unmanaged index that includes 500 widely traded common stocks.
It is not possible to invest directly in an index. Index figures do not reflect expenses or sales charges, which would result in lower returns.
Footnotes related to performance pages
| 1 | For certain types of investors, as described in the fund's prospectus. |
| 2 | Class R2 and Class R6 shares were first offered on 3-1-12 and 9-1-11, respectively. Returns prior to these dates are those of Class A shares that have not been adjusted for class-specific expenses; otherwise, returns would vary. |
| 3 | The contingent deferred sales charge is not applicable. |
| Your expenses |

| SEMIANNUAL REPORT | JOHN HANCOCK U.S. GLOBAL LEADERS GROWTH FUND | 6 |
| Account value on 11-1-2019 | Ending value on 4-30-2020 | Expenses paid during period ended 4-30-20201 | Annualized expense ratio | ||
| Class A | Actual expenses/actual returns | $1,000.00 | $1,072.20 | $5.93 | 1.15% |
| Hypothetical example | 1,000.00 | 1,019.10 | 5.77 | 1.15% | |
| Class B | Actual expenses/actual returns | 1,000.00 | 1,068.30 | 9.77 | 1.90% |
| Hypothetical example | 1,000.00 | 1,015.40 | 9.52 | 1.90% | |
| Class C | Actual expenses/actual returns | 1,000.00 | 1,068.20 | 9.77 | 1.90% |
| Hypothetical example | 1,000.00 | 1,015.40 | 9.52 | 1.90% | |
| Class I | Actual expenses/actual returns | 1,000.00 | 1,073.50 | 4.64 | 0.90% |
| Hypothetical example | 1,000.00 | 1,020.40 | 4.52 | 0.90% | |
| Class R2 | Actual expenses/actual returns | 1,000.00 | 1,071.60 | 6.59 | 1.28% |
| Hypothetical example | 1,000.00 | 1,018.50 | 6.42 | 1.28% | |
| Class R6 | Actual expenses/actual returns | 1,000.00 | 1,074.20 | 4.07 | 0.79% |
| Hypothetical example | 1,000.00 | 1,020.90 | 3.97 | 0.79% |
| 1 | Expenses are equal to the annualized expense ratio, multiplied by the average account value over the period, multiplied by 182/366 (to reflect the one-half year period). |
| 7 | JOHN HANCOCK U.S. GLOBAL LEADERS GROWTH FUND | SEMIANNUAL REPORT |
| Fund’s investments |
| Shares | Value | ||||
| Common stocks 97.8% | $1,568,948,668 | ||||
| (Cost $1,021,897,906) | |||||
| Communication services 11.4% | 183,307,837 | ||||
| Interactive media and services 11.4% | |||||
| Alphabet, Inc., Class C (A) | 59,265 | 79,928,335 | |||
| Facebook, Inc., Class A (A) | 344,668 | 70,556,986 | |||
| Match Group, Inc. (A)(B) | 426,488 | 32,822,516 | |||
| Consumer discretionary 18.3% | 292,857,178 | ||||
| Hotels, restaurants and leisure 3.4% | |||||
| Yum! Brands, Inc. | 630,122 | 54,461,444 | |||
| Internet and direct marketing retail 7.5% | |||||
| Amazon.com, Inc. (A) | 35,956 | 88,955,144 | |||
| Booking Holdings, Inc. (A) | 21,030 | 31,136,387 | |||
| Specialty retail 3.8% | |||||
| The TJX Companies, Inc. | 607,876 | 29,816,318 | |||
| Ulta Beauty, Inc. (A) | 140,573 | 30,633,668 | |||
| Textiles, apparel and luxury goods 3.6% | |||||
| NIKE, Inc., Class B | 663,618 | 57,854,217 | |||
| Health care 21.7% | 348,340,566 | ||||
| Biotechnology 2.5% | |||||
| Regeneron Pharmaceuticals, Inc. (A) | 75,290 | 39,593,505 | |||
| Health care equipment and supplies 11.9% | |||||
| Abbott Laboratories | 576,832 | 53,120,458 | |||
| Becton, Dickinson and Company | 184,588 | 46,614,008 | |||
| Danaher Corp. | 298,765 | 48,836,127 | |||
| Intuitive Surgical, Inc. (A) | 82,967 | 42,386,181 | |||
| Health care providers and services 4.0% | |||||
| UnitedHealth Group, Inc. | 218,086 | 63,783,612 | |||
| Life sciences tools and services 3.3% | |||||
| Illumina, Inc. (A) | 169,284 | 54,006,675 | |||
| Industrials 3.4% | 54,016,124 | ||||
| Professional services 3.4% | |||||
| IHS Markit, Ltd. | 802,617 | 54,016,124 | |||
| Information technology 35.2% | 565,069,410 | ||||
| IT services 12.4% | |||||
| FleetCor Technologies, Inc. (A) | 228,660 | 55,164,225 | |||
| PayPal Holdings, Inc. (A) | 560,854 | 68,985,042 | |||
| Visa, Inc., Class A | 418,266 | 74,752,500 | |||
| SEE NOTES TO FINANCIAL STATEMENTS | SEMIANNUAL REPORT | JOHN HANCOCK U.S. GLOBAL LEADERS GROWTH FUND | 8 |
| Shares | Value | ||||
| Information technology (continued) | |||||
| Semiconductors and semiconductor equipment 2.1% | |||||
| Xilinx, Inc. | 384,344 | $33,591,666 | |||
| Software 20.7% | |||||
| Adobe, Inc. (A) | 88,421 | 31,269,202 | |||
| Autodesk, Inc. (A) | 355,634 | 66,549,790 | |||
| Intuit, Inc. | 175,358 | 47,313,342 | |||
| Microsoft Corp. | 459,761 | 82,393,769 | |||
| salesforce.com, Inc. (A) | 341,453 | 55,298,313 | |||
| Workday, Inc., Class A (A) | 323,272 | 49,751,561 | |||
| Materials 5.0% | 79,553,335 | ||||
| Chemicals 5.0% | |||||
| Ecolab, Inc. | 262,724 | 50,837,094 | |||
| Linde PLC | 156,075 | 28,716,241 | |||
| Real estate 2.8% | 45,804,218 | ||||
| Equity real estate investment trusts 2.8% | |||||
| Equinix, Inc. | 67,838 | 45,804,218 | |||
| Yield (%) | Shares | Value | |||
| Short-term investments 4.2% | $67,913,315 | ||||
| (Cost $67,875,391) | |||||
| Short-term funds 4.2% | 67,913,315 | ||||
| John Hancock Collateral Trust (C) | 0.6614(D) | 3,428,540 | 34,314,203 | ||
| State Street Institutional U.S. Government Money Market Fund, Premier Class | 0.2162(D) | 33,599,112 | 33,599,112 | ||
| Total investments (Cost $1,089,773,297) 102.0% | $1,636,861,983 | ||||
| Other assets and liabilities, net (2.0%) | (32,773,589) | ||||
| Total net assets 100.0% | $1,604,088,394 | ||||
| The percentage shown for each investment category is the total value of the category as a percentage of the net assets of the fund. | |
| Security Abbreviations and Legend | |
| (A) | Non-income producing security. |
| (B) | All or a portion of this security is on loan as of 4-30-20. |
| (C) | Investment is an affiliate of the fund, the advisor and/or subadvisor. This security represents the investment of cash collateral received for securities lending. |
| (D) | The rate shown is the annualized seven-day yield as of 4-30-20. |
| 9 | JOHN HANCOCK U.S. GLOBAL LEADERS GROWTH FUND | SEMIANNUAL REPORT | SEE NOTES TO FINANCIAL STATEMENTS |
| Financial statements |
| Assets | |
| Unaffiliated investments, at value (Cost $1,055,497,018) including $33,604,490 of securities loaned | $1,602,547,780 |
| Affiliated investments, at value (Cost $34,276,279) | 34,314,203 |
| Total investments, at value (Cost $1,089,773,297) | 1,636,861,983 |
| Dividends and interest receivable | 733,009 |
| Receivable for fund shares sold | 4,126,549 |
| Receivable for securities lending income | 214,760 |
| Other assets | 138,854 |
| Total assets | 1,642,075,155 |
| Liabilities | |
| Payable for fund shares repurchased | 2,208,338 |
| Payable upon return of securities loaned | 34,283,705 |
| Payable to affiliates | |
| Investment management fees | 886,741 |
| Accounting and legal services fees | 81,493 |
| Transfer agent fees | 135,976 |
| Distribution and service fees | 201,087 |
| Trustees' fees | 2,410 |
| Other liabilities and accrued expenses | 187,011 |
| Total liabilities | 37,986,761 |
| Net assets | $1,604,088,394 |
| Net assets consist of | |
| Paid-in capital | $942,542,695 |
| Total distributable earnings (loss) | 661,545,699 |
| Net assets | $1,604,088,394 |
| Net asset value per share | |
| Based on net asset value and shares outstanding - the fund has an unlimited number of shares authorized with no par value | |
| Class A ($749,756,686 ÷ 14,439,430 shares)1 | $51.92 |
| Class B ($6,311,813 ÷ 151,704 shares)1 | $41.61 |
| Class C ($71,355,304 ÷ 1,713,959 shares)1 | $41.63 |
| Class I ($538,143,972 ÷ 9,483,886 shares) | $56.74 |
| Class R2 ($1,691,436 ÷ 30,724 shares) | $55.05 |
| Class R6 ($236,829,183 ÷ 4,138,400 shares) | $57.23 |
| Maximum offering price per share | |
| Class A (net asset value per share ÷ 95%)2 | $54.65 |
| 1 | Redemption price per share is equal to net asset value less any applicable contingent deferred sales charge. |
| 2 | On single retail sales of less than $50,000. On sales of $50,000 or more and on group sales the offering price is reduced. |
| SEE NOTES TO FINANCIAL STATEMENTS | SEMIANNUAL REPORT | JOHN HANCOCK U.S. Global Leaders Growth Fund | 10 |
| Investment income | |
| Dividends | $5,862,741 |
| Securities lending | 339,126 |
| Interest | 180,606 |
| Less foreign taxes withheld | (591) |
| Total investment income | 6,381,882 |
| Expenses | |
| Investment management fees | 5,749,472 |
| Distribution and service fees | 1,292,873 |
| Accounting and legal services fees | 141,930 |
| Transfer agent fees | 868,792 |
| Trustees' fees | 13,685 |
| Custodian fees | 93,261 |
| State registration fees | 65,881 |
| Printing and postage | 33,597 |
| Professional fees | 32,349 |
| Other | 33,439 |
| Total expenses | 8,325,279 |
| Less expense reductions | (56,561) |
| Net expenses | 8,268,718 |
| Net investment loss | (1,886,836) |
| Realized and unrealized gain (loss) | |
| Net realized gain (loss) on | |
| Unaffiliated investments | 118,145,473 |
| Affiliated investments | (9,113) |
| 118,136,360 | |
| Change in net unrealized appreciation (depreciation) of | |
| Unaffiliated investments | (7,464,574) |
| Affiliated investments | 37,924 |
| (7,426,650) | |
| Net realized and unrealized gain | 110,709,710 |
| Increase in net assets from operations | $108,822,874 |
| 11 | JOHN HANCOCK U.S. Global Leaders Growth Fund | SEMIANNUAL REPORT | SEE NOTES TO FINANCIAL STATEMENTS |
| Six months ended 4-30-20 (unaudited) | Year ended 10-31-19 | |
| Increase (decrease) in net assets | ||
| From operations | ||
| Net investment loss | $(1,886,836) | $(95,491) |
| Net realized gain | 118,136,360 | 111,541,170 |
| Change in net unrealized appreciation (depreciation) | (7,426,650) | 125,623,184 |
| Increase in net assets resulting from operations | 108,822,874 | 237,068,863 |
| Distributions to shareholders | ||
| From earnings | ||
| Class A | (47,750,249) | (69,118,650) |
| Class B | (685,984) | (1,675,246) |
| Class C | (5,665,021) | (9,327,579) |
| Class I | (35,525,171) | (72,648,617) |
| Class R2 | (91,843) | (169,763) |
| Class R6 | (12,538,401) | (15,029,985) |
| Total distributions | (102,256,669) | (167,969,840) |
| From fund share transactions | 40,461,931 | (46,191,535) |
| Total increase | 47,028,136 | 22,907,488 |
| Net assets | ||
| Beginning of period | 1,557,060,258 | 1,534,152,770 |
| End of period | $1,604,088,394 | $1,557,060,258 |
| SEE NOTES TO FINANCIAL STATEMENTS | SEMIANNUAL REPORT | JOHN HANCOCK U.S. Global Leaders Growth Fund | 12 |
| Financial highlights |
| CLASS A SHARES Period ended | 4-30-201 | 10-31-19 | 10-31-18 | 10-31-17 | 10-31-16 | 10-31-15 |
| Per share operating performance | ||||||
| Net asset value, beginning of period | $51.76 | $49.26 | $47.15 | $41.00 | $43.87 | $45.02 |
| Net investment income (loss)2 | (0.09) | (0.05) | (0.07) | (0.05) | (0.03) | 0.07 |
| Net realized and unrealized gain (loss) on investments | 3.75 | 8.18 | 5.51 | 8.31 | (0.13) | 4.98 |
| Total from investment operations | 3.66 | 8.13 | 5.44 | 8.26 | (0.16) | 5.05 |
| Less distributions | ||||||
| From net investment income | — | — | — | — | (0.04) | (0.10) |
| From net realized gain | (3.50) | (5.63) | (3.33) | (2.11) | (2.67) | (6.10) |
| Total distributions | (3.50) | (5.63) | (3.33) | (2.11) | (2.71) | (6.20) |
| Net asset value, end of period | $51.92 | $51.76 | $49.26 | $47.15 | $41.00 | $43.87 |
| Total return (%)3,4 | 7.225 | 18.96 | 12.11 | 21.12 | (0.42) | 13.19 |
| Ratios and supplemental data | ||||||
| Net assets, end of period (in millions) | $750 | $707 | $612 | $577 | $608 | $660 |
| Ratios (as a percentage of average net assets): | ||||||
| Expenses before reductions | 1.166 | 1.16 | 1.16 | 1.17 | 1.18 | 1.18 |
| Expenses including reductions | 1.156 | 1.15 | 1.15 | 1.16 | 1.17 | 1.17 |
| Net investment income (loss) | (0.34)6 | (0.11) | (0.14) | (0.12) | (0.07) | 0.16 |
| Portfolio turnover (%) | 24 | 32 | 42 | 41 | 44 | 30 |
| 1 | Six months ended 4-30-20. Unaudited. |
| 2 | Based on average daily shares outstanding. |
| 3 | Total returns would have been lower had certain expenses not been reduced during the applicable periods. |
| 4 | Does not reflect the effect of sales charges, if any. |
| 5 | Not annualized. |
| 6 | Annualized. |
| 13 | JOHN HANCOCK U.S. Global Leaders Growth Fund | SEMIANNUAL REPORT | SEE NOTES TO FINANCIAL STATEMENTS |
| CLASS B SHARES Period ended | 4-30-201 | 10-31-19 | 10-31-18 | 10-31-17 | 10-31-16 | 10-31-15 |
| Per share operating performance | ||||||
| Net asset value, beginning of period | $42.29 | $41.57 | $40.57 | $35.82 | $38.90 | $40.80 |
| Net investment loss2 | (0.22) | (0.33) | (0.37) | (0.32) | (0.29) | (0.22) |
| Net realized and unrealized gain (loss) on investments | 3.04 | 6.68 | 4.70 | 7.18 | (0.12) | 4.42 |
| Total from investment operations | 2.82 | 6.35 | 4.33 | 6.86 | (0.41) | 4.20 |
| Less distributions | ||||||
| From net realized gain | (3.50) | (5.63) | (3.33) | (2.11) | (2.67) | (6.10) |
| Net asset value, end of period | $41.61 | $42.29 | $41.57 | $40.57 | $35.82 | $38.90 |
| Total return (%)3,4 | 6.835 | 18.08 | 11.28 | 20.22 | (1.16) | 12.33 |
| Ratios and supplemental data | ||||||
| Net assets, end of period (in millions) | $6 | $9 | $13 | $16 | $19 | $24 |
| Ratios (as a percentage of average net assets): | ||||||
| Expenses before reductions | 1.916 | 1.91 | 1.91 | 1.92 | 1.93 | 1.93 |
| Expenses including reductions | 1.906 | 1.90 | 1.90 | 1.91 | 1.92 | 1.92 |
| Net investment loss | (1.08)6 | (0.83) | (0.89) | (0.86) | (0.82) | (0.60) |
| Portfolio turnover (%) | 24 | 32 | 42 | 41 | 44 | 30 |
| 1 | Six months ended 4-30-20. Unaudited. |
| 2 | Based on average daily shares outstanding. |
| 3 | Total returns would have been lower had certain expenses not been reduced during the applicable periods. |
| 4 | Does not reflect the effect of sales charges, if any. |
| 5 | Not annualized. |
| 6 | Annualized. |
| SEE NOTES TO FINANCIAL STATEMENTS | SEMIANNUAL REPORT | JOHN HANCOCK U.S. Global Leaders Growth Fund | 14 |
| CLASS C SHARES Period ended | 4-30-201 | 10-31-19 | 10-31-18 | 10-31-17 | 10-31-16 | 10-31-15 |
| Per share operating performance | ||||||
| Net asset value, beginning of period | $42.31 | $41.59 | $40.59 | $35.84 | $38.92 | $40.81 |
| Net investment loss2 | (0.22) | (0.34) | (0.37) | (0.32) | (0.29) | (0.22) |
| Net realized and unrealized gain (loss) on investments | 3.04 | 6.69 | 4.70 | 7.18 | (0.12) | 4.43 |
| Total from investment operations | 2.82 | 6.35 | 4.33 | 6.86 | (0.41) | 4.21 |
| Less distributions | ||||||
| From net realized gain | (3.50) | (5.63) | (3.33) | (2.11) | (2.67) | (6.10) |
| Net asset value, end of period | $41.63 | $42.31 | $41.59 | $40.59 | $35.84 | $38.92 |
| Total return (%)3,4 | 6.825 | 18.07 | 11.28 | 20.21 | (1.16) | 12.36 |
| Ratios and supplemental data | ||||||
| Net assets, end of period (in millions) | $71 | $69 | $70 | $102 | $117 | $136 |
| Ratios (as a percentage of average net assets): | ||||||
| Expenses before reductions | 1.916 | 1.91 | 1.91 | 1.92 | 1.93 | 1.93 |
| Expenses including reductions | 1.906 | 1.90 | 1.90 | 1.91 | 1.92 | 1.92 |
| Net investment loss | (1.09)6 | (0.85) | (0.91) | (0.86) | (0.82) | (0.59) |
| Portfolio turnover (%) | 24 | 32 | 42 | 41 | 44 | 30 |
| 1 | Six months ended 4-30-20. Unaudited. |
| 2 | Based on average daily shares outstanding. |
| 3 | Total returns would have been lower had certain expenses not been reduced during the applicable periods. |
| 4 | Does not reflect the effect of sales charges, if any. |
| 5 | Not annualized. |
| 6 | Annualized. |
| 15 | JOHN HANCOCK U.S. Global Leaders Growth Fund | SEMIANNUAL REPORT | SEE NOTES TO FINANCIAL STATEMENTS |
| CLASS I SHARES Period ended | 4-30-201 | 10-31-19 | 10-31-18 | 10-31-17 | 10-31-16 | 10-31-15 |
| Per share operating performance | ||||||
| Net asset value, beginning of period | $56.19 | $52.86 | $50.25 | $43.45 | $46.27 | $47.12 |
| Net investment income (loss)2 | (0.02) | 0.09 | 0.05 | 0.06 | 0.08 | 0.18 |
| Net realized and unrealized gain (loss) on investments | 4.07 | 8.87 | 5.89 | 8.85 | (0.13) | 5.25 |
| Total from investment operations | 4.05 | 8.96 | 5.94 | 8.91 | (0.05) | 5.43 |
| Less distributions | ||||||
| From net investment income | — | — | — | — | (0.10) | (0.18) |
| From net realized gain | (3.50) | (5.63) | (3.33) | (2.11) | (2.67) | (6.10) |
| Total distributions | (3.50) | (5.63) | (3.33) | (2.11) | (2.77) | (6.28) |
| Net asset value, end of period | $56.74 | $56.19 | $52.86 | $50.25 | $43.45 | $46.27 |
| Total return (%)3 | 7.354 | 19.26 | 12.37 | 21.44 | (0.14) | 13.48 |
| Ratios and supplemental data | ||||||
| Net assets, end of period (in millions) | $538 | $572 | $694 | $751 | $313 | $293 |
| Ratios (as a percentage of average net assets): | ||||||
| Expenses before reductions | 0.915 | 0.92 | 0.92 | 0.91 | 0.92 | 0.91 |
| Expenses including reductions | 0.905 | 0.91 | 0.91 | 0.90 | 0.91 | 0.91 |
| Net investment income (loss) | (0.09)5 | 0.17 | 0.09 | 0.13 | 0.19 | 0.41 |
| Portfolio turnover (%) | 24 | 32 | 42 | 41 | 44 | 30 |
| 1 | Six months ended 4-30-20. Unaudited. |
| 2 | Based on average daily shares outstanding. |
| 3 | Total returns would have been lower had certain expenses not been reduced during the applicable periods. |
| 4 | Not annualized. |
| 5 | Annualized. |
| SEE NOTES TO FINANCIAL STATEMENTS | SEMIANNUAL REPORT | JOHN HANCOCK U.S. Global Leaders Growth Fund | 16 |
| CLASS R2 SHARES Period ended | 4-30-201 | 10-31-19 | 10-31-18 | 10-31-17 | 10-31-16 | 10-31-15 |
| Per share operating performance | ||||||
| Net asset value, beginning of period | $54.71 | $51.80 | $49.48 | $42.99 | $45.89 | $46.82 |
| Net investment loss2 | (0.13) | (0.12) | (0.14) | (0.12) | (0.09) | (0.05) |
| Net realized and unrealized gain (loss) on investments | 3.97 | 8.66 | 5.79 | 8.72 | (0.13) | 5.27 |
| Total from investment operations | 3.84 | 8.54 | 5.65 | 8.60 | (0.22) | 5.22 |
| Less distributions | ||||||
| From net investment income | — | — | — | — | (0.01) | (0.05) |
| From net realized gain | (3.50) | (5.63) | (3.33) | (2.11) | (2.67) | (6.10) |
| Total distributions | (3.50) | (5.63) | (3.33) | (2.11) | (2.68) | (6.15) |
| Net asset value, end of period | $55.05 | $54.71 | $51.80 | $49.48 | $42.99 | $45.89 |
| Total return (%)3 | 7.164 | 18.81 | 11.95 | 20.93 | (0.54) | 13.01 |
| Ratios and supplemental data | ||||||
| Net assets, end of period (in millions) | $2 | $1 | $2 | $5 | $6 | $8 |
| Ratios (as a percentage of average net assets): | ||||||
| Expenses before reductions | 1.285 | 1.29 | 1.30 | 1.31 | 1.32 | 1.30 |
| Expenses including reductions | 1.285 | 1.28 | 1.29 | 1.30 | 1.32 | 1.29 |
| Net investment loss | (0.47)5 | (0.23) | (0.28) | (0.26) | (0.21) | (0.11) |
| Portfolio turnover (%) | 24 | 32 | 42 | 41 | 44 | 30 |
| 1 | Six months ended 4-30-20. Unaudited. |
| 2 | Based on average daily shares outstanding. |
| 3 | Total returns would have been lower had certain expenses not been reduced during the applicable periods. |
| 4 | Not annualized. |
| 5 | Annualized. |
| 17 | JOHN HANCOCK U.S. Global Leaders Growth Fund | SEMIANNUAL REPORT | SEE NOTES TO FINANCIAL STATEMENTS |
| CLASS R6 SHARES Period ended | 4-30-201 | 10-31-19 | 10-31-18 | 10-31-17 | 10-31-16 | 10-31-15 |
| Per share operating performance | ||||||
| Net asset value, beginning of period | $56.61 | $53.17 | $50.47 | $43.59 | $46.39 | $47.23 |
| Net investment income2 | 0.01 | 0.13 | 0.11 | 0.11 | 0.13 | 0.24 |
| Net realized and unrealized gain (loss) on investments | 4.11 | 8.94 | 5.92 | 8.88 | (0.13) | 5.25 |
| Total from investment operations | 4.12 | 9.07 | 6.03 | 8.99 | — | 5.49 |
| Less distributions | ||||||
| From net investment income | — | — | — | — | (0.13) | (0.23) |
| From net realized gain | (3.50) | (5.63) | (3.33) | (2.11) | (2.67) | (6.10) |
| Total distributions | (3.50) | (5.63) | (3.33) | (2.11) | (2.80) | (6.33) |
| Net asset value, end of period | $57.23 | $56.61 | $53.17 | $50.47 | $43.59 | $46.39 |
| Total return (%)3 | 7.424 | 19.37 | 12.50 | 21.56 | (0.03) | 13.61 |
| Ratios and supplemental data | ||||||
| Net assets, end of period (in millions) | $237 | $199 | $143 | $6 | $5 | $6 |
| Ratios (as a percentage of average net assets): | ||||||
| Expenses before reductions | 0.795 | 0.81 | 0.81 | 0.82 | 0.82 | 0.82 |
| Expenses including reductions | 0.795 | 0.80 | 0.80 | 0.80 | 0.80 | 0.80 |
| Net investment income | 0.025 | 0.24 | 0.21 | 0.23 | 0.30 | 0.55 |
| Portfolio turnover (%) | 24 | 32 | 42 | 41 | 44 | 30 |
| 1 | Six months ended 4-30-20. Unaudited. |
| 2 | Based on average daily shares outstanding. |
| 3 | Total returns would have been lower had certain expenses not been reduced during the applicable periods. |
| 4 | Not annualized. |
| 5 | Annualized. |
| SEE NOTES TO FINANCIAL STATEMENTS | SEMIANNUAL REPORT | JOHN HANCOCK U.S. Global Leaders Growth Fund | 18 |
| Notes to financial statements (unaudited) |
| 19 | JOHN HANCOCK U.S. Global Leaders Growth Fund | SEMIANNUAL REPORT |
| SEMIANNUAL REPORT | JOHN HANCOCK U.S. Global Leaders Growth Fund | 20 |
| 21 | JOHN HANCOCK U.S. Global Leaders Growth Fund | SEMIANNUAL REPORT |
| Class | Expense reduction |
| Class A | $25,907 |
| Class B | 277 |
| Class C | 2,484 |
| Class I | 20,187 |
| Class | Expense reduction |
| Class R2 | $55 |
| Class R6 | 7,651 |
| Total | $56,561 |
| SEMIANNUAL REPORT | JOHN HANCOCK U.S. Global Leaders Growth Fund | 22 |
| Class | Rule 12b-1 Fee | Service fee |
| Class A | 0.25% | — |
| Class B | 1.00% | — |
| Class C | 1.00% | — |
| Class R2 | 0.25% | 0.25% |
| 23 | JOHN HANCOCK U.S. Global Leaders Growth Fund | SEMIANNUAL REPORT |
| Class | Distribution and service fees | Transfer agent fees |
| Class A | $904,273 | $453,981 |
| Class B | 38,419 | 4,817 |
| Class C | 346,447 | 43,477 |
| Class I | — | 352,322 |
| Class R2 | 3,734 | 101 |
| Class R6 | — | 14,094 |
| Total | $1,292,873 | $868,792 |
| Six Months Ended 4-30-20 | Year Ended 10-31-19 | |||
| Shares | Amount | Shares | Amount | |
| Class A shares | ||||
| Sold | 1,358,045 | $68,082,650 | 2,040,596 | $98,162,511 |
| Distributions reinvested | 906,107 | 46,003,012 | 1,555,898 | 66,312,369 |
| Repurchased | (1,490,543) | (73,724,699) | (2,356,982) | (113,435,549) |
| Net increase | 773,609 | $40,360,963 | 1,239,512 | $51,039,331 |
| Class B shares | ||||
| Sold | 1,556 | $64,971 | 4,107 | $153,671 |
| Distributions reinvested | 15,375 | 627,298 | 43,715 | 1,532,211 |
| Repurchased | (69,907) | (2,709,455) | (152,674) | (6,062,816) |
| Net decrease | (52,976) | $(2,017,186) | (104,852) | $(4,376,934) |
| Class C shares | ||||
| Sold | 186,512 | $7,336,240 | 293,780 | $11,487,433 |
| Distributions reinvested | 130,283 | 5,319,456 | 249,890 | 8,763,643 |
| Repurchased | (233,478) | (9,184,574) | (590,125) | (23,279,807) |
| Net increase (decrease) | 83,317 | $3,471,122 | (46,455) | $(3,028,731) |
| Class I shares | ||||
| Sold | 1,586,148 | $85,722,674 | 3,675,754 | $192,856,193 |
| Distributions reinvested | 616,231 | 34,157,667 | 1,521,468 | 70,246,195 |
| Repurchased | (2,897,348) | (156,865,882) | (8,153,014) | (394,597,753) |
| Net decrease | (694,969) | $(36,985,541) | (2,955,792) | $(131,495,365) |
| SEMIANNUAL REPORT | JOHN HANCOCK U.S. Global Leaders Growth Fund | 24 |
| Six Months Ended 4-30-20 | Year Ended 10-31-19 | |||
| Shares | Amount | Shares | Amount | |
| Class R2 shares | ||||
| Sold | 4,936 | $253,283 | 7,700 | $393,159 |
| Distributions reinvested | 1,623 | 87,417 | 3,706 | 167,161 |
| Repurchased | (3,222) | (171,089) | (27,804) | (1,433,687) |
| Net increase (decrease) | 3,337 | $169,611 | (16,398) | $(873,367) |
| Class R6 shares | ||||
| Sold | 892,199 | $49,570,827 | 1,233,926 | $66,218,577 |
| Distributions reinvested | 223,943 | 12,513,939 | 323,400 | 15,028,390 |
| Repurchased | (486,706) | (26,621,804) | (734,039) | (38,703,436) |
| Net increase | 629,436 | $35,462,962 | 823,287 | $42,543,531 |
| Total net increase (decrease) | 741,754 | $40,461,931 | (1,060,698) | $(46,191,535) |
| Dividends and distributions | |||||||||
| Affiliate | Ending share amount | Beginning value | Cost of purchases | Proceeds from shares sold | Realized gain (loss) | Change in unrealized appreciation (depreciation) | Income distributions received | Capital gain distributions received | Ending value |
| John Hancock Collateral Trust* | 3,428,540 | — | $95,002,741 | $(60,717,349) | $(9,113) | $37,924 | $339,126 | — | $34,314,203 |
| * | Refer to the Securities lending note within Note 2 for details regarding this investment. |
| 25 | JOHN HANCOCK U.S. Global Leaders Growth Fund | SEMIANNUAL REPORT |
STATEMENT REGARDING LIQUIDITY RISK MANAGEMENT
Operation of the Liquidity Risk Management Program
This section describes operation and effectiveness of the Liquidity Risk Management Program (LRMP) established in accordance with Rule 22e-4 under the Investment Company Act of 1940, as amended (the Liquidity Rule). The Board of Trustees (the Board) of each Fund in the John Hancock Group of Funds (each a Fund and collectively, the Funds) that is subject to the requirements of the Liquidity Rule has appointed John Hancock Investment Management LLC and John Hancock Variable Trust Advisers LLC (together, the Advisor) to serve as Administrator of the LRMP with respect to each of the Funds, including John Hancock U.S. Global Leaders Growth Fund, subject to the oversight of the Board. In order to provide a mechanism and process to perform the functions necessary to administer the LRMP, the Advisor established the Liquidity Risk Management Committee (the Committee). The Fund's subadvisor, Sustainable Growth Advisers, LP (the Subadvisor) executes the day-to-day investment management and security-level activities of the Fund in accordance with the requirements of the LRMP, subject to the supervision of the Advisor and the Board.
The Committee holds monthly meetings to: (1) review the day-to-day operations of the LRMP; (2) review and approve month end liquidity classifications; (3) review quarterly testing and determinations, as applicable; and (4) review other LRMP related material. The Committee also conducts daily, monthly, quarterly, and annual quantitative and qualitative assessments of each subadvisor to a Fund that is subject to the requirements of the Liquidity Rule and is a part of the LRMP to monitor investment performance issues, risks and trends. In addition, the Committee may conduct ad-hoc reviews and meetings with subadvisors as issues and trends are identified, including potential liquidity and valuation issues.
The Committee provided the Board at a meeting held on March 15-17, 2020 with a written report which addressed the Committee's assessment of the adequacy and effectiveness of the implementation and operation of the LRMP and any material changes to the LRMP. The report, which covered the period December 1, 2018 through December 31, 2019, included an assessment of important aspects of the LRMP including, but not limited to:
• Operation of the Fund's Redemption-In-Kind Procedures;
• Highly Liquid Investment Minimum (HLIM) determination;
• Compliance with the 15% limit on illiquid investments;
• Reasonably Anticipated Trade Size (RATS) determination;
• Security-level liquidity classifications; and
• Liquidity risk assessment.
The report also covered material liquidity matters which occurred or were reported during this period applicable to the Fund, if any, and the Committee's actions to address such matters.
Redemption-In-Kind Procedures
Rule 22e-4 requires any fund that engages in or reserves the right to engage in in-kind redemptions to adopt and implement written policies and procedures regarding in-kind redemptions as part of the management of its liquidity risk. These procedures address the process for redeeming in kind, as well as the circumstances under which the Fund would consider redeeming in kind. Anticipated large redemption activity will be evaluated to identify situations where redeeming in securities instead of cash may be appropriate.
As part of its annual assessment of the LRMP, the Committee reviewed the implementation and operation of the Redemption-In-Kind Procedures and determined they are operating in a manner that such procedures are adequate and effective to manage in-kind redemptions on behalf of the Fund as part of the LRMP.
Highly Liquid Investment Minimum determination
The Committee uses an HLIM model to determine a Fund's HLIM. This process incorporates the Fund's investment strategy, historical redemptions, liquidity classification rollup percentages and cash balances, redemption policy, access to funding sources, distribution channels and client concentrations. If the Fund falls below its established HLIM for a period greater than 7 consecutive calendar days, the Committee prepares a report to the Board within one business day following the seventh consecutive calendar day with an explanation of how the Fund plans to restore its HLIM within a reasonable period of time.
Based on the HLIM model, the Committee has determined that the Fund qualifies as a Primarily Highly Liquid Fund (PHLF). It is therefore not required to establish a HLIM. The Fund is tested quarterly to confirm its PHLF status.
As part of its annual assessment of the LRMP, the Committee reviewed the policies and procedures in place with respect to HLIM and PHLF determinations, and determined that such policies and procedures are operating in a manner that is adequate and effective as part of the LRMP.
Compliance with the 15% limit on illiquid investments
Rule 22e-4 sets an aggregate illiquid investment limit of 15% for a fund. Funds are prohibited from acquiring an illiquid investment if this results in greater than 15% of its net assets being classified as illiquid. When applying this limit, the Committee defines "illiquid investment" to mean any investment that the Fund reasonably expects cannot be sold or disposed of in current market conditions in seven calendar days or less without the sale or disposition significantly changing the market value of the investment. If a 15% illiquid investment limit breach occurs for longer than 1 business day, the Fund is required to notify the Board and provide a plan on how to bring illiquid investments within the 15% threshold, and after 7 days confidentially notify the Securities and Exchange Commission (the SEC).
In February 2019, as a result of extended security markets closures in connection with the Chinese New Year in certain countries, the SEC released guidance, and the Committee approved and adopted an Extended Market Holiday Policy to plan for and monitor known Extended Market Holidays (defined as all expected market holiday closures spanning four or more calendar days).
As part of its annual assessment of the LRMP, the Committee reviewed the policies and procedures in place with respect to the 15% illiquid investment limit and determined such policies and procedures are operating in a manner that is adequate and effective as part of the LMRP.
Reasonably Anticipated Trade Size determination
In order to assess the liquidity risk of a Fund, the Committee considers the impact on the Fund that redemptions of a RATS would have under both normal and reasonably foreseeable stressed conditions. Modelling the Fund's RATS requires quantifying cash flow volatility and analyzing distribution channel concentration and redemption risk. The model is designed to estimate the amount of assets that the Fund could reasonably anticipate trading on a given day, during both normal and reasonably foreseeable stressed conditions, to satisfy redemption requests.
As part of its annual assessment of the LRMP, the Committee reviewed the policies and procedures in place with respect to RATS determinations and determined that such policies and procedures are operating in a manner that is adequate and effective at making RATS determinations as part of the LRMP.
Security-level liquidity classifications
When classifying the liquidity of portfolio securities, the Fund adheres to the liquidity classification procedures established by the Advisor. In assigning a liquidity classification to Fund portfolio holdings, the following key inputs, among others, are considered: the Fund's RATS, feedback from the applicable Subadvisor on market-, trading- and investment-specific considerations, an assessment of current market conditions and fund portfolio holdings, and a value impact standard. The Subadvisor also provides position-level data to the Committee for use in monthly classification reconciliation in order to identify any classifications that may need to be changed as a result of the above considerations.
As part of its annual assessment of the LRMP, the Committee reviewed the policies and procedures in place with respect to security-level liquidity classifications and determined that such policies and procedures are operating in a manner that is adequate and effective as part of the LRMP.
Liquidity risk assessment
The Committee periodically reviews and assesses, the Fund's liquidity risk, including its investment strategy and liquidity of portfolio investments during both normal and reasonably foreseeable stressed conditions (including whether the investment strategy is appropriate for an open-end fund, the extent to which the strategy involves a relatively concentrated portfolio or large positions in particular issuers, and the use of borrowings for investment purposes and derivatives), cash flow analysis during both normal and reasonably foreseeable stressed conditions, and holdings of cash and cash equivalents, as well as borrowing arrangements and other funding sources.
The Committee also monitors global events, such as the COVID-19 Coronavirus, that could impact the markets and liquidity of portfolio investments and their classifications.
As part of its annual assessment of the LRMP, the Committee reviewed Fund-Level Liquidity Risk Assessment Reports for each of the Funds and determined that the investment strategy for each Fund continues to be appropriate for an open-ended structure.
Adequacy and Effectiveness
Based on the review and assessment conducted by the Committee, the Committee has determined that the LRMP has been implemented, and is operating in a manner that is adequate and effective at assessing and managing the liquidity risk of each Fund.
Trustees Hassell H. McClellan,Chairperson Officers Andrew G. Arnott Francis V. Knox, Jr. Charles A. Rizzo Salvatore Schiavone Christopher (Kit) Sechler | Investment advisor John Hancock Investment Management LLC Subadvisor Sustainable Growth Advisers, LP (SGA) Portfolio Managers Gordon M. Marchand, CFA, CPA, CIC Principal distributor John Hancock Investment Management Distributors LLC Custodian State Street Bank and Trust Company Transfer agent John Hancock Signature Services, Inc. Legal counsel K&L Gates LLP |
* Member of the Audit Committee
† Non-Independent Trustee
The fund's proxy voting policies and procedures, as well as the fund proxy voting record for the most recent twelve-month period ended June 30, are available free of charge on the Securities and Exchange Commission (SEC) website at sec.gov or on our website.
All of the fund's holdings as of the end of the third month of every fiscal quarter are filed with the SEC on Form N-PORT within 60 days of the end of the fiscal quarter. The fund's Form N-PORT filings are available on our website and the SEC's website, sec.gov.
We make this information on your fund, as well asmonthly portfolio holdings, and other fund details available on our website at jhinvestments.com or by calling 800-225-5291.
| You can also contact us: | |||
| 800-225-5291 jhinvestments.com | Regular mail: John Hancock Signature Services, Inc. | Express mail: John Hancock Signature Services, Inc. | |
John Hancock family of funds
DOMESTIC EQUITY FUNDS Blue Chip Growth Classic Value Disciplined Value Disciplined Value Mid Cap Equity Income Financial Industries Fundamental All Cap Core Fundamental Large Cap Core New Opportunities Regional Bank Small Cap Core Small Cap Growth Small Cap Value U.S. Global Leaders Growth U.S. Quality Growth GLOBAL AND INTERNATIONAL EQUITY FUNDS Disciplined Value International Emerging Markets Emerging Markets Equity Fundamental Global Franchise Global Equity Global Shareholder Yield Global Thematic Opportunities International Dynamic Growth International Growth International Small Company | INCOME FUNDS Bond California Tax-Free Income Emerging Markets Debt Floating Rate Income Government Income High Yield High Yield Municipal Bond Income Investment Grade Bond Money Market Short Duration Bond Short Duration Credit Opportunities Strategic Income Opportunities Tax-Free Bond ALTERNATIVE AND SPECIALTY FUNDS Absolute Return Currency Alternative Asset Allocation Alternative Risk Premia Diversified Macro Infrastructure Multi-Asset Absolute Return Seaport Long/Short |
A fund's investment objectives, risks, charges, and expenses should be considered carefully before investing. The prospectus contains this and other important information about the fund. To obtain a prospectus, contact your financial professional, call John Hancock Investment Management at 800-225-5291, or visit our website at jhinvestments.com. Please read the prospectus carefully before investing or sending money.
ASSET ALLOCATION Balanced Multi-Asset High Income Multi-Index Lifetime Portfolios Multi-Index Preservation Portfolios Multimanager Lifestyle Portfolios Multimanager Lifetime Portfolios Retirement Income 2040 EXCHANGE-TRADED FUNDS John Hancock Multifactor Consumer Discretionary ETF John Hancock Multifactor Consumer Staples ETF John Hancock Multifactor Developed International ETF John Hancock Multifactor Emerging Markets ETF John Hancock Multifactor Energy ETF John Hancock Multifactor Financials ETF John Hancock Multifactor Healthcare ETF John Hancock Multifactor Industrials ETF John Hancock Multifactor Large Cap ETF John Hancock Multifactor Materials ETF John Hancock Multifactor Media and John Hancock Multifactor Mid Cap ETF John Hancock Multifactor Small Cap ETF John Hancock Multifactor Technology ETF John Hancock Multifactor Utilities ETF | ENVIRONMENTAL, SOCIAL, AND ESG All Cap Core ESG Core Bond ESG International Equity ESG Large Cap Core CLOSED-END FUNDS Financial Opportunities Hedged Equity & Income Income Securities Trust Investors Trust Preferred Income Preferred Income II Preferred Income III Premium Dividend Tax-Advantaged Dividend Income Tax-Advantaged Global Shareholder Yield |
John Hancock Multifactor ETF shares are bought and sold at market price (not NAV), and are not individually redeemed
from the fund. Brokerage commissions will reduce returns.
John Hancock ETFs are distributed by Foreside Fund Services, LLC, and are subadvised by Dimensional Fund Advisors LP.
Foreside is not affiliated with John Hancock Investment Management Distributors LLC or Dimensional Fund Advisors LP.
Dimensional Fund Advisors LP receives compensation from John Hancock in connection with licensing rights to the
John Hancock Dimensional indexes. Dimensional Fund Advisors LP does not sponsor, endorse, or sell, and makes no
representation as to the advisability of investing in, John Hancock Multifactor ETFs.
John Hancock Investment Management
A trusted brand
John Hancock Investment Management is a premier asset manager
representing one of America's most trusted brands, with a heritage of
financial stewardship dating back to 1862. Helping our shareholders
pursue their financial goals is at the core of everything we do. It's why
we support the role of professional financial advice and operate with
the highest standards of conduct and integrity.
A better way to invest
We serve investors globally through a unique multimanager approach:
We search the world to find proven portfolio teams with specialized
expertise for every strategy we offer, then we apply robust investment
oversight to ensure they continue to meet our uncompromising
standards and serve the best interests of our shareholders.
Results for investors
Our unique approach to asset management enables us to provide
a diverse set of investments backed by some of the world's best
managers, along with strong risk-adjusted returns across asset classes.
![]()
John Hancock Investment Management Distributors LLC n Member FINRA, SIPC
200 Berkeley Street n Boston, MA 02116-5010 n 800-225-5291 n jhinvestments.com
This report is for the information of the shareholders of John Hancock U.S. Global Leaders Growth Fund. It is not authorized for distribution to prospective investors unless preceded or accompanied by a prospectus.

| MF1182644 | 26SA 4/20 6/2020 |
John Hancock
Classic Value Fund
Semiannual report 4/30/2020
Beginning on January 1, 2021, as permitted by regulations adopted by the Securities and Exchange Commission, paper copies of the fund's shareholder reports like this one will no longer be sent by mail, unless you specifically request paper copies of the reports from the fund or from your financial intermediary. Instead, the reports will be made available on a website, and you will be notified by mail each time a report is posted and provided with a website link to access the report.
If you already elected to receive shareholder reports electronically, you will not be affected by this change, and you do not need to take any action. You may elect to receive shareholder reports and other communications electronically by calling John Hancock Investment Management at 800-225-5291 (Class A, Class B and Class C shares) or 888-972-8696 (Class I, Class R1, Class R2, Class R3, Class R5 and Class R6 shares) or by contacting your financial intermediary.
You may elect to receive all reports in paper, free of charge, at any time. You can inform John Hancock Investment Management or your financial intermediary that you wish to continue receiving paper copies of your shareholder reports by following the instructions listed above. Your election to receive reports in paper will apply to all funds held with John Hancock Investment Management or your financial intermediary.
A message to shareholders
Dear shareholder,
The U.S. financial markets were on pace to deliver strong returns during the 6 months ended April 30, 2020, until heightened fears over the coronavirus (COVID-19) sent markets tumbling during the latter half of February and early March.
In response to the sell-off, the U.S. Federal Reserve acted quickly with a broad array of actions to limit the economic damage from the pandemic, including up to $2.3 trillion in lending to support households, employers, financial markets, and state and local governments. These steps, along with the passage of an estimated $2 trillion federal economic stimulus bill, helped lift the markets during the final month of the period.
The continued spread of COVID-19, trade disputes, rising unemployment, and other geopolitical tensions may continue to create uncertainty among businesses and investors. Your financial professional can helpposition your portfolio so that it's sufficiently diversified to seek to meet your long-term objectives and to withstand the inevitable bouts of market volatility along the way.
On behalf of everyone at John Hancock Investment Management, I'd like to take this opportunity to welcome new shareholders and thank existing shareholders for the continued trust you've placed in us.
Sincerely,
Andrew G. Arnott
President and CEO,
John Hancock Investment Management
Head of Wealth and Asset Management,
United States and Europe
This commentary reflects the CEO's views as of this report's period end and are subject to change at any time. Diversification does not guarantee investment returns and does not eliminate risk of loss. All investments entail risks, including the possible loss of principal. For more up-to-date information, you can visit our website at jhinvestments.com.
John Hancock
Classic Value Fund
INVESTMENT OBJECTIVE
The fund seeks long-term growth of capital.
AVERAGE ANNUAL TOTAL RETURNS AS OF 4/30/2020 (%)
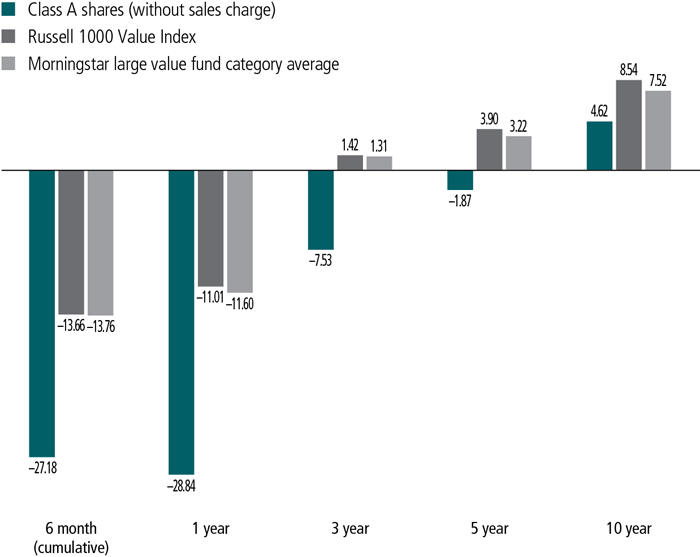
The Russell 1000 Value Index is an unmanaged index containing those securities in the Russell 1000 Index with a less-than-average growth orientation.
It is not possible to invest directly in an index. Index figures do not reflect expenses or sales charges, which would result in lower returns.
Figures from Morningstar, Inc. include reinvested distributions and do not take into account sales charges. Actual load-adjusted performance is lower.
The past performance shown here reflects reinvested distributions and the beneficial effect of any expense reductions, and does not guarantee future results. Returns for periods shorter than one year are cumulative. Performance of the other share classes will vary based on the difference in the fees and expenses of those classes. Shares will fluctuate in value and, when redeemed, may be worth more or less than their original cost. Current month-end performance may be lower or higher than the performance cited, and can be found at jhinvestments.com or by calling 800-225-5291. For further information on the fund's objectives, risks, and strategy, see the fund's prospectus. The fund recently experienced negative short-term performance due to market volatility associated with the COVID-19 pandemic.
SECTOR COMPOSITION AS OF 4/30/2020 (%)
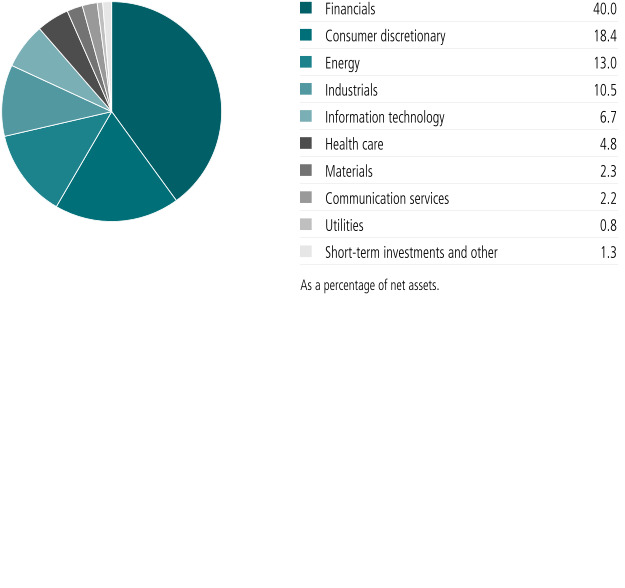
TOP 10 HOLDINGS AS OF 4/30/2020 (%)
| General Electric Company | 4.6 |
| American International Group, Inc. | 4.4 |
| Lear Corp. | 4.2 |
| Citigroup, Inc. | 4.2 |
| Capital One Financial Corp. | 3.9 |
| Halliburton Company | 3.7 |
| Hewlett Packard Enterprise Company | 3.6 |
| Equitable Holdings, Inc. | 3.5 |
| Wells Fargo & Company | 3.4 |
| National Oilwell Varco, Inc. | 3.3 |
| TOTAL | 38.8 |
| As a percentage of net assets. | |
| Cash and cash equivalents are not included. | |
A note about risks
The fund may be subject to various risks as described in the fund's prospectus. A widespread health crisis such as a global pandemic could cause substantial market volatility, exchange trading suspensions and closures, impact the ability to complete redemptions, and affect fund performance. For example, the novel coronavirus disease (COVID-19) has resulted in significant disruptions to global business activity. The impact of a health crisis and other epidemics and pandemics that may arise in the future, could affect the global economy in ways that cannot necessarily be foreseen at the present time. A health crisis may exacerbate other pre-existing political, social, and economic risks. Any such impact could adversely affect the funds' performance, resulting in losses to your investment. For more information, please refer to the "Principal risks" section of the prospectus.
TOTAL RETURNS FOR THE PERIOD ENDED APRIL 30, 2020
| Average annual total returns (%) with maximum sales charge | Cumulative total returns (%) with maximum sales charge | ||||||
| 1-year | 5-year | 10-year | 6-month | 5-year | 10-year | ||
| Class A | -32.41 | -2.87 | 4.08 | -30.83 | -13.55 | 49.15 | |
| Class B | -32.79 | -2.96 | 3.99 | -30.95 | -13.97 | 47.92 | |
| Class C | -30.06 | -2.60 | 3.83 | -28.17 | -12.34 | 45.69 | |
| Class I1 | -28.67 | -1.62 | 4.92 | -27.10 | -7.84 | 61.64 | |
| Class R11 | -29.14 | -2.24 | 4.25 | -27.33 | -10.72 | 51.66 | |
| Class R21,2 | -28.96 | -2.00 | 4.56 | -27.23 | -9.63 | 56.26 | |
| Class R31,2 | -29.03 | -2.13 | 4.36 | -27.27 | -10.19 | 53.19 | |
| Class R51,2 | -28.61 | -1.55 | 4.98 | -27.04 | -7.51 | 62.54 | |
| Class R61,2 | -28.58 | -1.50 | 4.95 | -27.03 | -7.30 | 62.16 | |
| Index† | -11.01 | 3.90 | 8.54 | -13.66 | 21.11 | 126.97 | |
Performance figures assume all distributions have been reinvested. Figures reflect maximum sales charges on Class A shares of 5% and the applicable contingent deferred sales charge (CDSC) on Class B and Class C shares. The Class B shares' CDSC declines annually between years 1 to 6 according to the following schedule: 5%, 4%, 3%, 3%, 2%, 1%. No sales charge will be assessed after the sixth year. Class C shares held for less than one year are subject to a 1% CDSC. Sales charges are not applicable to Class I, Class R1, Class R2, Class R3, Class R5, and Class R6 shares.
The expense ratios of the fund, both net (including any fee waivers and/or expense limitations) and gross (excluding any fee waivers and/or expense limitations), are set forth according to the most recent publicly available prospectuses for the fund and may differ from those disclosed in the Financial highlights tables in this report. Net expenses reflect contractual expense limitations in effect until July 31, 2021 and are subject to change. Had the contractual fee waivers and expense limitations not been in place, gross expenses would apply. The expense ratios are as follows:
| Class A | Class B | Class C | Class I | Class R1 | Class R2 | Class R3 | Class R5 | Class R6 | |
| Gross (%) | 1.18 | 1.93 | 1.93 | 0.93 | 1.58 | 1.33 | 1.48 | 0.88 | 0.83 |
| Net (%) | 1.17 | 1.92 | 1.92 | 0.92 | 1.57 | 1.32 | 1.47 | 0.87 | 0.82 |
Please refer to the most recent prospectus and annual or semiannual report for more information on expenses and any expense limitation arrangements for each class.
The returns reflect past results and should not be considered indicative of future performance. The return and principal value of an investment will fluctuate so that shares, when redeemed, may be worth more or less than their original cost. Due to market volatility and other factors, the fund's current performance may be higher or lower than the performance shown. For current to the most recent month-end performance data, please call 800-225-5291 or visit the fund's website at jhinvestments.com.
The performance table above and the chart on the next page do not reflect the deduction of taxes that a shareholder would pay on fund distributions or the redemption of fund shares. The fund's performance results reflect any applicable fee waivers or expense reductions, without which the expenses would increase and results would have been less favorable.
| † | Index is the Russell 1000 Value Index. |
See the following page for footnotes.
This chart and table show what happened to a hypothetical $10,000 investment in John Hancock Classic Value Fund for the share classes and periods indicated, assuming all distributions were reinvested. For comparison, we've shown the same investment in the Russell 1000 Value Index.
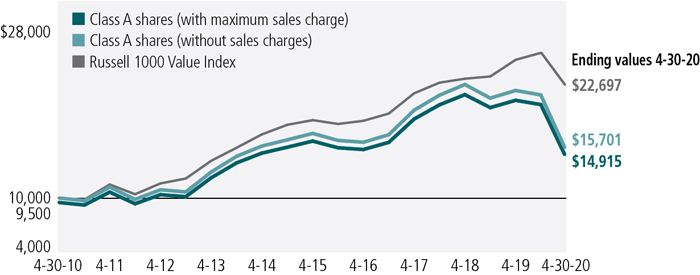
| Start date | With maximum sales charge ($) | Without sales charge ($) | Index ($) | |
| Class B3 | 4-30-10 | 14,792 | 14,792 | 22,697 |
| Class C3 | 4-30-10 | 14,569 | 14,569 | 22,697 |
| Class I1 | 4-30-10 | 16,164 | 16,164 | 22,697 |
| Class R11 | 4-30-10 | 15,166 | 15,166 | 22,697 |
| Class R21,2 | 4-30-10 | 15,626 | 15,626 | 22,697 |
| Class R31,2 | 4-30-10 | 15,319 | 15,319 | 22,697 |
| Class R51,2 | 4-30-10 | 16,254 | 16,254 | 22,697 |
| Class R61,2 | 4-30-10 | 16,216 | 16,216 | 22,697 |
The Russell 1000 Value Index is an unmanaged index containing those securities in the Russell 1000 Index with a less-than-average growth orientation.
It is not possible to invest directly in an index. Index figures do not reflect expenses or sales charges, which would result in lower returns.
Footnotes related to performance pages
| 1 | For certain types of investors, as described in the fund's prospectus. |
| 2 | Class R2 shares were first offered on 3-1-12; Class R6 shares were first offered on 9-1-11. Returns prior to these dates are those of Class A shares and have not been adjusted for expenses; otherwise, returns would vary. |
| 3 | The contingent deferred sales charge is not applicable. |
| Your expenses |

| SEMIANNUAL REPORT | JOHN HANCOCK CLASSIC VALUE FUND | 6 |
| Account value on 11-1-2019 | Ending value on 4-30-2020 | Expenses paid during period ended 4-30-20201 | Annualized expense ratio | ||
| Class A | Actual expenses/actual returns | $1,000.00 | $728.20 | $5.03 | 1.17% |
| Hypothetical example | 1,000.00 | 1,019.00 | 5.87 | 1.17% | |
| Class B | Actual expenses/actual returns | 1,000.00 | 725.30 | 8.24 | 1.92% |
| Hypothetical example | 1,000.00 | 1,015.30 | 9.62 | 1.92% | |
| Class C | Actual expenses/actual returns | 1,000.00 | 725.20 | 8.24 | 1.92% |
| Hypothetical example | 1,000.00 | 1,015.30 | 9.62 | 1.92% | |
| Class I | Actual expenses/actual returns | 1,000.00 | 729.00 | 3.95 | 0.92% |
| Hypothetical example | 1,000.00 | 1,020.30 | 4.62 | 0.92% | |
| Class R1 | Actual expenses/actual returns | 1,000.00 | 726.70 | 6.70 | 1.56% |
| Hypothetical example | 1,000.00 | 1,017.10 | 7.82 | 1.56% | |
| Class R2 | Actual expenses/actual returns | 1,000.00 | 727.70 | 5.63 | 1.31% |
| Hypothetical example | 1,000.00 | 1,018.30 | 6.57 | 1.31% | |
| Class R3 | Actual expenses/actual returns | 1,000.00 | 727.30 | 6.10 | 1.42% |
| Hypothetical example | 1,000.00 | 1,017.80 | 7.12 | 1.42% | |
| Class R5 | Actual expenses/actual returns | 1,000.00 | 729.60 | 3.70 | 0.86% |
| Hypothetical example | 1,000.00 | 1,020.60 | 4.32 | 0.86% | |
| Class R6 | Actual expenses/actual returns | 1,000.00 | 729.70 | 3.48 | 0.81% |
| Hypothetical example | 1,000.00 | 1,020.80 | 4.07 | 0.81% |
| 1 | Expenses are equal to the annualized expense ratio, multiplied by the average account value over the period, multiplied by 182/366 (to reflect the one-half year period). |
| 7 | JOHN HANCOCK CLASSIC VALUE FUND | SEMIANNUAL REPORT |
| Fund’s investments |
| Shares | Value | ||||
| Common stocks 98.7% | $1,649,664,207 | ||||
| (Cost $2,069,978,779) | |||||
| Communication services 2.2% | 36,201,734 | ||||
| Media 2.2% | |||||
| The Interpublic Group of Companies, Inc. | 2,132,022 | 36,201,734 | |||
| Consumer discretionary 18.4% | 307,705,986 | ||||
| Auto components 4.2% | |||||
| Lear Corp. | 715,716 | 69,889,667 | |||
| Automobiles 3.1% | |||||
| Ford Motor Company | 10,166,981 | 51,749,933 | |||
| Hotels, restaurants and leisure 0.3% | |||||
| Carnival Corp. (A) | 313,749 | 4,988,609 | |||
| Household durables 5.5% | |||||
| Mohawk Industries, Inc. (B) | 486,678 | 42,691,394 | |||
| Newell Brands, Inc. | 3,583,738 | 49,742,283 | |||
| Textiles, apparel and luxury goods 5.3% | |||||
| Gildan Activewear, Inc. (A) | 3,326,777 | 46,375,271 | |||
| PVH Corp. | 858,599 | 42,268,829 | |||
| Energy 13.0% | 217,112,715 | ||||
| Energy equipment and services 10.2% | |||||
| Baker Hughes Company | 3,814,561 | 53,213,126 | |||
| Halliburton Company | 5,903,239 | 61,984,010 | |||
| National Oilwell Varco, Inc. | 4,365,263 | 55,176,924 | |||
| Oil, gas and consumable fuels 2.8% | |||||
| Cenovus Energy, Inc. (A) | 4,454,588 | 16,214,700 | |||
| Exxon Mobil Corp. | 189,747 | 8,817,543 | |||
| Royal Dutch Shell PLC, ADR, Class A (A) | 655,189 | 21,706,412 | |||
| Financials 40.0% | 668,478,110 | ||||
| Banks 12.8% | |||||
| Bank of America Corp. | 1,899,889 | 45,692,330 | |||
| Citigroup, Inc. | 1,439,127 | 69,884,007 | |||
| JPMorgan Chase & Co. | 437,018 | 41,848,844 | |||
| Wells Fargo & Company | 1,937,271 | 56,277,723 | |||
| Capital markets 8.3% | |||||
| KKR & Company, Inc., Class A | 681,862 | 17,189,741 | |||
| Morgan Stanley | 1,214,300 | 47,879,849 | |||
| The Goldman Sachs Group, Inc. | 258,146 | 47,349,139 | |||
| UBS Group AG (A)(B) | 2,425,319 | 26,096,432 | |||
| SEE NOTES TO FINANCIAL STATEMENTS | SEMIANNUAL REPORT | JOHN HANCOCK CLASSIC VALUE FUND | 8 |
| Shares | Value | ||||
| Financials (continued) | |||||
| Consumer finance 3.9% | |||||
| Capital One Financial Corp. | 1,010,980 | $65,471,065 | |||
| Diversified financial services 5.5% | |||||
| Equitable Holdings, Inc. | 3,235,354 | 59,271,685 | |||
| Voya Financial, Inc. | 727,261 | 32,850,379 | |||
| Insurance 9.5% | |||||
| American International Group, Inc. | 2,909,396 | 73,985,940 | |||
| Axis Capital Holdings, Ltd. | 852,023 | 31,184,042 | |||
| MetLife, Inc. | 1,482,731 | 53,496,934 | |||
| Health care 4.8% | 80,836,306 | ||||
| Health care providers and services 3.8% | |||||
| Cardinal Health, Inc. | 492,754 | 24,381,468 | |||
| McKesson Corp. | 282,319 | 39,877,559 | |||
| Pharmaceuticals 1.0% | |||||
| Mylan NV (B) | 988,508 | 16,577,279 | |||
| Industrials 10.5% | 176,345,532 | ||||
| Industrial conglomerates 4.6% | |||||
| General Electric Company | 11,422,825 | 77,675,213 | |||
| Machinery 5.9% | |||||
| Stanley Black & Decker, Inc. | 424,377 | 46,766,345 | |||
| Wabtec Corp. | 919,957 | 51,903,974 | |||
| Information technology 6.7% | 111,181,631 | ||||
| IT services 3.1% | |||||
| Cognizant Technology Solutions Corp., Class A | 879,945 | 51,054,409 | |||
| Technology hardware, storage and peripherals 3.6% | |||||
| Hewlett Packard Enterprise Company | 5,976,861 | 60,127,222 | |||
| Materials 2.3% | 38,731,175 | ||||
| Chemicals 2.3% | |||||
| Dow, Inc. | 1,055,633 | 38,731,175 | |||
| Utilities 0.8% | 13,071,018 | ||||
| Electric utilities 0.8% | |||||
| Edison International | 222,637 | 13,071,018 | |||
| Yield (%) | Shares | Value | |||
| Short-term investments 4.1% | $68,266,406 | ||||
| (Cost $68,209,335) | |||||
| Short-term funds 4.1% | 68,266,406 | ||||
| John Hancock Collateral Trust (C) | 0.6614(D) | 6,074,988 | 60,800,906 | ||
| State Street Institutional Treasury Money Market Fund, Premier Class | 0.2521(D) | 7,465,500 | 7,465,500 | ||
| 9 | JOHN HANCOCK CLASSIC VALUE FUND | SEMIANNUAL REPORT | SEE NOTES TO FINANCIAL STATEMENTS |
| Total investments (Cost $2,138,188,114) 102.8% | $1,717,930,613 | ||||
| Other assets and liabilities, net (2.8%) | (46,381,761) | ||||
| Total net assets 100.0% | $1,671,548,852 | ||||
| The percentage shown for each investment category is the total value of the category as a percentage of the net assets of the fund. | |
| Security Abbreviations and Legend | |
| ADR | American Depositary Receipt |
| (A) | All or a portion of this security is on loan as of 4-30-20. |
| (B) | Non-income producing security. |
| (C) | Investment is an affiliate of the fund, the advisor and/or subadvisor. This security represents the investment of cash collateral received for securities lending. |
| (D) | The rate shown is the annualized seven-day yield as of 4-30-20. |
| SEE NOTES TO FINANCIAL STATEMENTS | SEMIANNUAL REPORT | JOHN HANCOCK CLASSIC VALUE FUND | 10 |
| Financial statements |
| Assets | |
| Unaffiliated investments, at value (Cost $2,077,444,279) including $60,054,909 of securities loaned | $1,657,129,707 |
| Affiliated investments, at value (Cost $60,743,835) | 60,800,906 |
| Total investments, at value (Cost $2,138,188,114) | 1,717,930,613 |
| Cash | 141,931 |
| Dividends and interest receivable | 430,345 |
| Receivable for fund shares sold | 2,784,654 |
| Receivable for investments sold | 17,366,002 |
| Receivable for securities lending income | 39,445 |
| Other assets | 171,065 |
| Total assets | 1,738,864,055 |
| Liabilities | |
| Payable for fund shares repurchased | 5,043,928 |
| Payable upon return of securities loaned | 60,725,331 |
| Payable to affiliates | |
| Investment management fees | 1,005,397 |
| Accounting and legal services fees | 83,109 |
| Transfer agent fees | 147,560 |
| Distribution and service fees | 64,203 |
| Trustees' fees | 3,660 |
| Other liabilities and accrued expenses | 242,015 |
| Total liabilities | 67,315,203 |
| Net assets | $1,671,548,852 |
| Net assets consist of | |
| Paid-in capital | $2,099,298,121 |
| Total distributable earnings (loss) | (427,749,269) |
| Net assets | $1,671,548,852 |
| 11 | JOHN HANCOCK Classic Value Fund | SEMIANNUAL REPORT | SEE NOTES TO FINANCIAL STATEMENTS |
| Net asset value per share | |
| Based on net asset value and shares outstanding - the fund has an unlimited number of shares authorized with no par value | |
| Class A ($235,781,699 ÷ 10,818,240 shares)1 | $21.79 |
| Class B ($658,064 ÷ 30,681 shares)1 | $21.45 |
| Class C ($12,145,201 ÷ 566,558 shares)1 | $21.44 |
| Class I ($1,131,212,155 ÷ 51,804,370 shares) | $21.84 |
| Class R1 ($1,558,162 ÷ 71,350 shares) | $21.84 |
| Class R2 ($325,697 ÷ 14,971 shares) | $21.76 |
| Class R3 ($285,985 ÷ 13,151 shares) | $21.75 |
| Class R5 ($68,335 ÷ 3,127 shares) | $21.85 |
| Class R6 ($289,513,554 ÷ 13,247,866 shares) | $21.85 |
| Maximum offering price per share | |
| Class A (net asset value per share ÷ 95%)2 | $22.94 |
| 1 | Redemption price per share is equal to net asset value less any applicable contingent deferred sales charge. |
| 2 | On single retail sales of less than $50,000. On sales of $50,000 or more and on group sales the offering price is reduced. |
| SEE NOTES TO FINANCIAL STATEMENTS | SEMIANNUAL REPORT | JOHN HANCOCK Classic Value Fund | 12 |
| Investment income | |
| Dividends | $25,327,160 |
| Securities lending | 405,829 |
| Interest | 173,881 |
| Less foreign taxes withheld | (335,193) |
| Total investment income | 25,571,677 |
| Expenses | |
| Investment management fees | 7,679,425 |
| Distribution and service fees | 510,757 |
| Accounting and legal services fees | 173,841 |
| Transfer agent fees | 1,095,211 |
| Trustees' fees | 18,811 |
| Custodian fees | 126,044 |
| State registration fees | 93,449 |
| Printing and postage | 67,108 |
| Professional fees | 45,662 |
| Other | 50,462 |
| Total expenses | 9,860,770 |
| Less expense reductions | (74,095) |
| Net expenses | 9,786,675 |
| Net investment income | 15,785,002 |
| Realized and unrealized gain (loss) | |
| Net realized gain (loss) on | |
| Unaffiliated investments and foreign currency transactions | (6,189,829) |
| Affiliated investments | (4,090) |
| (6,193,919) | |
| Change in net unrealized appreciation (depreciation) of | |
| Unaffiliated investments | (575,652,308) |
| Affiliated investments | 57,071 |
| (575,595,237) | |
| Net realized and unrealized loss | (581,789,156) |
| Decrease in net assets from operations | $(566,004,154) |
| 13 | JOHN HANCOCK Classic Value Fund | SEMIANNUAL REPORT | SEE NOTES TO FINANCIAL STATEMENTS |
| Six months ended 4-30-20 (unaudited) | Year ended 10-31-19 | |
| Increase (decrease) in net assets | ||
| From operations | ||
| Net investment income | $15,785,002 | $49,237,273 |
| Net realized gain (loss) | (6,193,919) | 46,467,484 |
| Change in net unrealized appreciation (depreciation) | (575,595,237) | (48,665,815) |
| Increase (decrease) in net assets resulting from operations | (566,004,154) | 47,038,942 |
| Distributions to shareholders | ||
| From earnings | ||
| Class A | (15,791,415) | (7,360,607) |
| Class B | (54,234) | (34,706) |
| Class C | (799,388) | (352,002) |
| Class I | (70,961,501) | (35,683,141) |
| Class R1 | (100,041) | (51,460) |
| Class R2 | (22,226) | (170,439) |
| Class R3 | (17,405) | (27,551) |
| Class R41 | — | (1,632) |
| Class R5 | (4,464) | (1,701) |
| Class R6 | (17,939,030) | (9,493,876) |
| Total distributions | (105,689,704) | (53,177,115) |
| From fund share transactions | 195,217,487 | (139,528,741) |
| Total decrease | (476,476,371) | (145,666,914) |
| Net assets | ||
| Beginning of period | 2,148,025,223 | 2,293,692,137 |
| End of period | $1,671,548,852 | $2,148,025,223 |
| 1 | Class R4 shares were fully redeemed on 10-29-19. |
| SEE NOTES TO FINANCIAL STATEMENTS | SEMIANNUAL REPORT | JOHN HANCOCK Classic Value Fund | 14 |
| Financial highlights |
| CLASS A SHARES Period ended | 4-30-201 | 10-31-19 | 10-31-18 | 10-31-17 | 10-31-16 | 10-31-15 |
| Per share operating performance | ||||||
| Net asset value, beginning of period | $31.31 | $31.52 | $32.32 | $26.12 | $25.49 | $25.82 |
| Net investment income2 | 0.19 | 0.61 | 0.46 | 0.34 | 0.43 | 0.28 |
| Net realized and unrealized gain (loss) on investments | (8.22) | (0.15) | (0.94) | 6.38 | 0.54 | (0.39) |
| Total from investment operations | (8.03) | 0.46 | (0.48) | 6.72 | 0.97 | (0.11) |
| Less distributions | ||||||
| From net investment income | (0.78) | (0.39) | (0.32) | (0.52) | (0.34) | (0.22) |
| From net realized gain | (0.71) | (0.28) | — | — | — | — |
| Total distributions | (1.49) | (0.67) | (0.32) | (0.52) | (0.34) | (0.22) |
| Net asset value, end of period | $21.79 | $31.31 | $31.52 | $32.32 | $26.12 | $25.49 |
| Total return (%)3,4 | (27.18)5 | 1.67 | (1.53) | 25.91 | 3.90 | (0.42) |
| Ratios and supplemental data | ||||||
| Net assets, end of period (in millions) | $236 | $334 | $348 | $354 | $308 | $351 |
| Ratios (as a percentage of average net assets): | ||||||
| Expenses before reductions | 1.186 | 1.18 | 1.17 | 1.18 | 1.19 | 1.19 |
| Expenses including reductions | 1.176 | 1.17 | 1.16 | 1.17 | 1.18 | 1.18 |
| Net investment income | 1.346 | 2.00 | 1.37 | 1.12 | 1.76 | 1.07 |
| Portfolio turnover (%) | 17 | 35 | 28 | 45 | 21 | 17 |
| 1 | Six months ended 4-30-20. Unaudited. |
| 2 | Based on average daily shares outstanding. |
| 3 | Total returns would have been lower had certain expenses not been reduced during the applicable periods. |
| 4 | Does not reflect the effect of sales charges, if any. |
| 5 | Not annualized. |
| 6 | Annualized. |
| 15 | JOHN HANCOCK Classic Value Fund | SEMIANNUAL REPORT | SEE NOTES TO FINANCIAL STATEMENTS |
| CLASS B SHARES Period ended | 4-30-201 | 10-31-19 | 10-31-18 | 10-31-17 | 10-31-16 | 10-31-15 |
| Per share operating performance | ||||||
| Net asset value, beginning of period | $30.73 | $30.91 | $31.70 | $25.66 | $25.04 | $25.37 |
| Net investment income2 | 0.09 | 0.42 | 0.22 | 0.12 | 0.25 | 0.08 |
| Net realized and unrealized gain (loss) on investments | (8.11) | (0.19) | (0.92) | 6.26 | 0.52 | (0.38) |
| Total from investment operations | (8.02) | 0.23 | (0.70) | 6.38 | 0.77 | (0.30) |
| Less distributions | ||||||
| From net investment income | (0.55) | (0.13) | (0.09) | (0.34) | (0.15) | (0.03) |
| From net realized gain | (0.71) | (0.28) | — | — | — | — |
| Total distributions | (1.26) | (0.41) | (0.09) | (0.34) | (0.15) | (0.03) |
| Net asset value, end of period | $21.45 | $30.73 | $30.91 | $31.70 | $25.66 | $25.04 |
| Total return (%)3,4 | (27.47)5 | 0.87 | (2.22) | 24.96 | 3.10 | (1.18) |
| Ratios and supplemental data | ||||||
| Net assets, end of period (in millions) | $1 | $1 | $3 | $4 | $6 | $8 |
| Ratios (as a percentage of average net assets): | ||||||
| Expenses before reductions | 1.936 | 1.93 | 1.92 | 1.93 | 1.94 | 1.93 |
| Expenses including reductions | 1.926 | 1.92 | 1.91 | 1.92 | 1.93 | 1.93 |
| Net investment income | 0.646 | 1.41 | 0.65 | 0.40 | 1.03 | 0.32 |
| Portfolio turnover (%) | 17 | 35 | 28 | 45 | 21 | 17 |
| 1 | Six months ended 4-30-20. Unaudited. |
| 2 | Based on average daily shares outstanding. |
| 3 | Total returns would have been lower had certain expenses not been reduced during the applicable periods. |
| 4 | Does not reflect the effect of sales charges, if any. |
| 5 | Not annualized. |
| 6 | Annualized. |
| SEE NOTES TO FINANCIAL STATEMENTS | SEMIANNUAL REPORT | JOHN HANCOCK Classic Value Fund | 16 |
| CLASS C SHARES Period ended | 4-30-201 | 10-31-19 | 10-31-18 | 10-31-17 | 10-31-16 | 10-31-15 |
| Per share operating performance | ||||||
| Net asset value, beginning of period | $30.72 | $30.89 | $31.69 | $25.65 | $25.03 | $25.36 |
| Net investment income2 | 0.09 | 0.39 | 0.26 | 0.11 | 0.24 | 0.08 |
| Net realized and unrealized gain (loss) on investments | (8.11) | (0.14) | (0.97) | 6.27 | 0.53 | (0.38) |
| Total from investment operations | (8.02) | 0.25 | (0.71) | 6.38 | 0.77 | (0.30) |
| Less distributions | ||||||
| From net investment income | (0.55) | (0.14) | (0.09) | (0.34) | (0.15) | (0.03) |
| From net realized gain | (0.71) | (0.28) | — | — | — | — |
| Total distributions | (1.26) | (0.42) | (0.09) | (0.34) | (0.15) | (0.03) |
| Net asset value, end of period | $21.44 | $30.72 | $30.89 | $31.69 | $25.65 | $25.03 |
| Total return (%)3,4 | (27.48)5 | 0.92 | (2.25) | 24.96 | 3.11 | (1.18) |
| Ratios and supplemental data | ||||||
| Net assets, end of period (in millions) | $12 | $20 | $26 | $75 | $76 | $88 |
| Ratios (as a percentage of average net assets): | ||||||
| Expenses before reductions | 1.936 | 1.93 | 1.92 | 1.93 | 1.94 | 1.94 |
| Expenses including reductions | 1.926 | 1.92 | 1.91 | 1.92 | 1.93 | 1.93 |
| Net investment income | 0.616 | 1.31 | 0.76 | 0.38 | 1.01 | 0.32 |
| Portfolio turnover (%) | 17 | 35 | 28 | 45 | 21 | 17 |
| 1 | Six months ended 4-30-20. Unaudited. |
| 2 | Based on average daily shares outstanding. |
| 3 | Total returns would have been lower had certain expenses not been reduced during the applicable periods. |
| 4 | Does not reflect the effect of sales charges, if any. |
| 5 | Not annualized. |
| 6 | Annualized. |
| 17 | JOHN HANCOCK Classic Value Fund | SEMIANNUAL REPORT | SEE NOTES TO FINANCIAL STATEMENTS |
| CLASS I SHARES Period ended | 4-30-201 | 10-31-19 | 10-31-18 | 10-31-17 | 10-31-16 | 10-31-15 |
| Per share operating performance | ||||||
| Net asset value, beginning of period | $31.40 | $31.62 | $32.42 | $26.19 | $25.56 | $25.90 |
| Net investment income2 | 0.22 | 0.69 | 0.55 | 0.41 | 0.51 | 0.35 |
| Net realized and unrealized gain (loss) on investments | (8.21) | (0.16) | (0.95) | 6.41 | 0.53 | (0.40) |
| Total from investment operations | (7.99) | 0.53 | (0.40) | 6.82 | 1.04 | (0.05) |
| Less distributions | ||||||
| From net investment income | (0.86) | (0.47) | (0.40) | (0.59) | (0.41) | (0.29) |
| From net realized gain | (0.71) | (0.28) | — | — | — | — |
| Total distributions | (1.57) | (0.75) | (0.40) | (0.59) | (0.41) | (0.29) |
| Net asset value, end of period | $21.84 | $31.40 | $31.62 | $32.42 | $26.19 | $25.56 |
| Total return (%)3 | (27.10)4 | 1.93 | (1.29) | 26.24 | 4.18 | (0.19) |
| Ratios and supplemental data | ||||||
| Net assets, end of period (in millions) | $1,131 | $1,429 | $1,518 | $1,767 | $1,146 | $1,591 |
| Ratios (as a percentage of average net assets): | ||||||
| Expenses before reductions | 0.935 | 0.94 | 0.93 | 0.92 | 0.93 | 0.92 |
| Expenses including reductions | 0.925 | 0.93 | 0.92 | 0.91 | 0.92 | 0.91 |
| Net investment income | 1.575 | 2.24 | 1.62 | 1.35 | 2.07 | 1.34 |
| Portfolio turnover (%) | 17 | 35 | 28 | 45 | 21 | 17 |
| 1 | Six months ended 4-30-20. Unaudited. |
| 2 | Based on average daily shares outstanding. |
| 3 | Total returns would have been lower had certain expenses not been reduced during the applicable periods. |
| 4 | Not annualized. |
| 5 | Annualized. |
| SEE NOTES TO FINANCIAL STATEMENTS | SEMIANNUAL REPORT | JOHN HANCOCK Classic Value Fund | 18 |
| CLASS R1 SHARES Period ended | 4-30-201 | 10-31-19 | 10-31-18 | 10-31-17 | 10-31-16 | 10-31-15 |
| Per share operating performance | ||||||
| Net asset value, beginning of period | $31.31 | $31.50 | $32.31 | $26.13 | $25.49 | $25.83 |
| Net investment income2 | 0.14 | 0.51 | 0.33 | 0.21 | 0.34 | 0.17 |
| Net realized and unrealized gain (loss) on investments | (8.24) | (0.16) | (0.94) | 6.40 | 0.55 | (0.38) |
| Total from investment operations | (8.10) | 0.35 | (0.61) | 6.61 | 0.89 | (0.21) |
| Less distributions | ||||||
| From net investment income | (0.66) | (0.26) | (0.20) | (0.43) | (0.25) | (0.13) |
| From net realized gain | (0.71) | (0.28) | — | — | — | — |
| Total distributions | (1.37) | (0.54) | (0.20) | (0.43) | (0.25) | (0.13) |
| Net asset value, end of period | $21.84 | $31.31 | $31.50 | $32.31 | $26.13 | $25.49 |
| Total return (%)3 | (27.33)4 | 1.27 | (1.92) | 25.43 | 3.53 | (0.82) |
| Ratios and supplemental data | ||||||
| Net assets, end of period (in millions) | $2 | $2 | $3 | $4 | $3 | $3 |
| Ratios (as a percentage of average net assets): | ||||||
| Expenses before reductions | 1.565 | 1.57 | 1.56 | 1.57 | 1.55 | 1.57 |
| Expenses including reductions | 1.565 | 1.56 | 1.56 | 1.56 | 1.55 | 1.57 |
| Net investment income | 0.955 | 1.66 | 0.99 | 0.71 | 1.40 | 0.64 |
| Portfolio turnover (%) | 17 | 35 | 28 | 45 | 21 | 17 |
| 1 | Six months ended 4-30-20. Unaudited. |
| 2 | Based on average daily shares outstanding. |
| 3 | Total returns would have been lower had certain expenses not been reduced during the applicable periods. |
| 4 | Not annualized. |
| 5 | Annualized. |
| 19 | JOHN HANCOCK Classic Value Fund | SEMIANNUAL REPORT | SEE NOTES TO FINANCIAL STATEMENTS |
| CLASS R2 SHARES Period ended | 4-30-201 | 10-31-19 | 10-31-18 | 10-31-17 | 10-31-16 | 10-31-15 |
| Per share operating performance | ||||||
| Net asset value, beginning of period | $31.23 | $31.44 | $32.24 | $26.07 | $25.46 | $25.85 |
| Net investment income2 | 0.17 | 0.47 | 0.40 | 0.25 | 0.36 | 0.26 |
| Net realized and unrealized gain (loss) on investments | (8.19) | (0.06) | (0.92) | 6.41 | 0.58 | (0.41) |
| Total from investment operations | (8.02) | 0.41 | (0.52) | 6.66 | 0.94 | (0.15) |
| Less distributions | ||||||
| From net investment income | (0.74) | (0.34) | (0.28) | (0.49) | (0.33) | (0.24) |
| From net realized gain | (0.71) | (0.28) | — | — | — | — |
| Total distributions | (1.45) | (0.62) | (0.28) | (0.49) | (0.33) | (0.24) |
| Net asset value, end of period | $21.76 | $31.23 | $31.44 | $32.24 | $26.07 | $25.46 |
| Total return (%)3 | (27.23)4 | 1.50 | (1.66) | 25.71 | 3.76 | (0.56) |
| Ratios and supplemental data | ||||||
| Net assets, end of period (in millions) | $—5 | $—5 | $9 | $7 | $1 | $—5 |
| Ratios (as a percentage of average net assets): | ||||||
| Expenses before reductions | 1.326 | 1.30 | 1.32 | 1.33 | 1.33 | 1.26 |
| Expenses including reductions | 1.316 | 1.29 | 1.31 | 1.32 | 1.32 | 1.26 |
| Net investment income | 1.206 | 1.50 | 1.21 | 0.84 | 1.47 | 0.99 |
| Portfolio turnover (%) | 17 | 35 | 28 | 45 | 21 | 17 |
| 1 | Six months ended 4-30-20. Unaudited. |
| 2 | Based on average daily shares outstanding. |
| 3 | Total returns would have been lower had certain expenses not been reduced during the applicable periods. |
| 4 | Not annualized. |
| 5 | Less than $500,000. |
| 6 | Annualized. |
| SEE NOTES TO FINANCIAL STATEMENTS | SEMIANNUAL REPORT | JOHN HANCOCK Classic Value Fund | 20 |
| CLASS R3 SHARES Period ended | 4-30-201 | 10-31-19 | 10-31-18 | 10-31-17 | 10-31-16 | 10-31-15 |
| Per share operating performance | ||||||
| Net asset value, beginning of period | $31.21 | $31.42 | $32.20 | $26.03 | $25.41 | $25.75 |
| Net investment income2 | 0.16 | 0.64 | 0.39 | 0.24 | 0.36 | 0.20 |
| Net realized and unrealized gain (loss) on investments | (8.20) | (0.27) | (0.94) | 6.38 | 0.53 | (0.39) |
| Total from investment operations | (8.04) | 0.37 | (0.55) | 6.62 | 0.89 | (0.19) |
| Less distributions | ||||||
| From net investment income | (0.71) | (0.30) | (0.23) | (0.45) | (0.27) | (0.15) |
| From net realized gain | (0.71) | (0.28) | — | — | — | — |
| Total distributions | (1.42) | (0.58) | (0.23) | (0.45) | (0.27) | (0.15) |
| Net asset value, end of period | $21.75 | $31.21 | $31.42 | $32.20 | $26.03 | $25.41 |
| Total return (%)3 | (27.27)4 | 1.38 | (1.74) | 25.58 | 3.57 | (0.73) |
| Ratios and supplemental data | ||||||
| Net assets, end of period (in millions) | $—5 | $1 | $1 | $1 | $1 | $1 |
| Ratios (as a percentage of average net assets): | ||||||
| Expenses before reductions | 1.426 | 1.45 | 1.40 | 1.47 | 1.48 | 1.48 |
| Expenses including reductions | 1.426 | 1.44 | 1.40 | 1.47 | 1.47 | 1.47 |
| Net investment income | 1.146 | 2.08 | 1.17 | 0.79 | 1.48 | 0.78 |
| Portfolio turnover (%) | 17 | 35 | 28 | 45 | 21 | 17 |
| 1 | Six months ended 4-30-20. Unaudited. |
| 2 | Based on average daily shares outstanding. |
| 3 | Total returns would have been lower had certain expenses not been reduced during the applicable periods. |
| 4 | Not annualized. |
| 5 | Less than $500,000. |
| 6 | Annualized. |
| 21 | JOHN HANCOCK Classic Value Fund | SEMIANNUAL REPORT | SEE NOTES TO FINANCIAL STATEMENTS |
| CLASS R5 SHARES Period ended | 4-30-201 | 10-31-19 | 10-31-18 | 10-31-17 | 10-31-16 | 10-31-15 |
| Per share operating performance | ||||||
| Net asset value, beginning of period | $31.42 | $31.65 | $32.44 | $26.21 | $25.57 | $25.92 |
| Net investment income2 | 0.23 | 0.66 | 0.57 | 0.43 | 0.54 | 0.37 |
| Net realized and unrealized gain (loss) on investments | (8.22) | (0.12) | (0.94) | 6.40 | 0.52 | (0.40) |
| Total from investment operations | (7.99) | 0.54 | (0.37) | 6.83 | 1.06 | (0.03) |
| Less distributions | ||||||
| From net investment income | (0.87) | (0.49) | (0.42) | (0.60) | (0.42) | (0.32) |
| From net realized gain | (0.71) | (0.28) | — | — | — | — |
| Total distributions | (1.58) | (0.77) | (0.42) | (0.60) | (0.42) | (0.32) |
| Net asset value, end of period | $21.85 | $31.42 | $31.65 | $32.44 | $26.21 | $25.57 |
| Total return (%)3 | (27.04)4 | 1.97 | (1.22) | 26.27 | 4.27 | (0.11) |
| Ratios and supplemental data | ||||||
| Net assets, end of period (in millions) | $—5 | $—5 | $—5 | $—5 | $—5 | $—5 |
| Ratios (as a percentage of average net assets): | ||||||
| Expenses before reductions | 0.876 | 0.88 | 0.87 | 0.88 | 0.86 | 0.85 |
| Expenses including reductions | 0.866 | 0.87 | 0.87 | 0.87 | 0.86 | 0.84 |
| Net investment income | 1.656 | 2.17 | 1.68 | 1.40 | 2.22 | 1.40 |
| Portfolio turnover (%) | 17 | 35 | 28 | 45 | 21 | 17 |
| 1 | Six months ended 4-30-20. Unaudited. |
| 2 | Based on average daily shares outstanding. |
| 3 | Total returns would have been lower had certain expenses not been reduced during the applicable periods. |
| 4 | Not annualized. |
| 5 | Less than $500,000. |
| 6 | Annualized. |
| SEE NOTES TO FINANCIAL STATEMENTS | SEMIANNUAL REPORT | JOHN HANCOCK Classic Value Fund | 22 |
| CLASS R6 SHARES Period ended | 4-30-201 | 10-31-19 | 10-31-18 | 10-31-17 | 10-31-16 | 10-31-15 |
| Per share operating performance | ||||||
| Net asset value, beginning of period | $31.43 | $31.67 | $32.46 | $26.21 | $25.59 | $25.94 |
| Net investment income2 | 0.24 | 0.72 | 0.57 | 0.47 | 0.52 | 0.39 |
| Net realized and unrealized gain (loss) on investments | (8.22) | (0.17) | (0.93) | 6.39 | 0.54 | (0.42) |
| Total from investment operations | (7.98) | 0.55 | (0.36) | 6.86 | 1.06 | (0.03) |
| Less distributions | ||||||
| From net investment income | (0.89) | (0.51) | (0.43) | (0.61) | (0.44) | (0.32) |
| From net realized gain | (0.71) | (0.28) | — | — | — | — |
| Total distributions | (1.60) | (0.79) | (0.43) | (0.61) | (0.44) | (0.32) |
| Net asset value, end of period | $21.85 | $31.43 | $31.67 | $32.46 | $26.21 | $25.59 |
| Total return (%)3 | (27.03)4 | 1.99 | (1.17) | 26.41 | 4.26 | (0.09) |
| Ratios and supplemental data | ||||||
| Net assets, end of period (in millions) | $290 | $360 | $384 | $1 | $1 | $1 |
| Ratios (as a percentage of average net assets): | ||||||
| Expenses before reductions | 0.825 | 0.83 | 0.82 | 0.83 | 0.83 | 0.83 |
| Expenses including reductions | 0.815 | 0.82 | 0.81 | 0.81 | 0.81 | 0.81 |
| Net investment income | 1.685 | 2.36 | 1.71 | 1.53 | 2.11 | 1.51 |
| Portfolio turnover (%) | 17 | 35 | 28 | 45 | 21 | 17 |
| 1 | Six months ended 4-30-20. Unaudited. |
| 2 | Based on average daily shares outstanding. |
| 3 | Total returns would have been lower had certain expenses not been reduced during the applicable periods. |
| 4 | Not annualized. |
| 5 | Annualized. |
| 23 | JOHN HANCOCK Classic Value Fund | SEMIANNUAL REPORT | SEE NOTES TO FINANCIAL STATEMENTS |
| Notes to financial statements (unaudited) |
| SEMIANNUAL REPORT | JOHN HANCOCK Classic Value Fund | 24 |
| 25 | JOHN HANCOCK Classic Value Fund | SEMIANNUAL REPORT |
| SEMIANNUAL REPORT | JOHN HANCOCK Classic Value Fund | 26 |
| Class | Expense reduction |
| Class A | $11,734 |
| Class B | 41 |
| Class C | 639 |
| Class I | 49,437 |
| Class R1 | 75 |
| Class | Expense reduction |
| Class R2 | $16 |
| Class R3 | 14 |
| Class R5 | 3 |
| Class R6 | 12,136 |
| Total | $74,095 |
| 27 | JOHN HANCOCK Classic Value Fund | SEMIANNUAL REPORT |
| Class | Rule 12b-1 Fee | Service fee |
| Class A | 0.25% | — |
| Class B | 1.00% | — |
| Class C | 1.00% | — |
| Class R1 | 0.50% | 0.25% |
| Class R2 | 0.25% | 0.25% |
| Class R3 | 0.50% | 0.15% |
| Class R5 | — | 0.05% |
| SEMIANNUAL REPORT | JOHN HANCOCK Classic Value Fund | 28 |
| Class | Distribution and service fees | Transfer agent fees |
| Class A | $407,558 | $204,406 |
| Class B | 5,586 | 699 |
| Class C | 87,683 | 10,994 |
| Class I | — | 856,851 |
| Class R1 | 7,684 | 136 |
| Class R2 | 1,092 | 29 |
| Class R3 | 1,133 | 25 |
| Class R5 | 21 | 6 |
| Class R6 | — | 22,065 |
| Total | $510,757 | $1,095,211 |
| Borrower or Lender | Weighted Average Loan Balance | Days Outstanding | Weighted Average Interest Rate | Interest Income (Expense) |
| Borrower | $82,287,239 | 2 | 0.525% | $(2,400) |
| Six Months Ended 4-30-20 | Year Ended 10-31-19 | |||
| Shares | Amount | Shares | Amount | |
| Class A shares | ||||
| Sold | 6,266,776 | $156,080,954 | 1,518,751 | $45,251,769 |
| Distributions reinvested | 457,126 | 14,724,039 | 243,463 | 6,892,431 |
| Repurchased | (6,576,772) | (144,557,082) | (2,142,480) | (64,846,582) |
| Net increase (decrease) | 147,130 | $26,247,911 | (380,266) | $(12,702,382) |
| 29 | JOHN HANCOCK Classic Value Fund | SEMIANNUAL REPORT |
| Six Months Ended 4-30-20 | Year Ended 10-31-19 | |||
| Shares | Amount | Shares | Amount | |
| Class B shares | ||||
| Sold | 27 | $854 | 1,652 | $45,991 |
| Distributions reinvested | 1,669 | 53,073 | 1,163 | 32,533 |
| Repurchased | (16,088) | (422,449) | (46,097) | (1,391,416) |
| Net decrease | (14,392) | $(368,522) | (43,282) | $(1,312,892) |
| Class C shares | ||||
| Sold | 25,148 | $630,367 | 126,750 | $3,582,339 |
| Distributions reinvested | 22,256 | 707,291 | 11,105 | 310,501 |
| Repurchased | (134,293) | (3,509,041) | (337,290) | (10,102,625) |
| Net decrease | (86,889) | $(2,171,383) | (199,435) | $(6,209,785) |
| Class I shares | ||||
| Sold | 15,020,424 | $326,905,513 | 10,963,873 | $328,918,979 |
| Distributions reinvested | 2,117,770 | 68,276,892 | 1,206,310 | 34,174,754 |
| Repurchased | (10,858,466) | (259,302,148) | (14,654,268) | (449,986,617) |
| Net increase (decrease) | 6,279,728 | $135,880,257 | (2,484,085) | $(86,892,884) |
| Class R1 shares | ||||
| Sold | 5,232 | $126,348 | 8,279 | $246,084 |
| Distributions reinvested | 2,910 | 94,039 | 1,488 | 42,283 |
| Repurchased | (9,727) | (305,798) | (38,697) | (1,165,919) |
| Net decrease | (1,585) | $(85,411) | (28,930) | $(877,552) |
| Class R2 shares | ||||
| Sold | 795 | $22,924 | 12,466 | $372,079 |
| Distributions reinvested | 676 | 21,749 | 6,014 | 170,086 |
| Repurchased | (1,834) | (53,449) | (289,761) | (9,017,971) |
| Net decrease | (363) | $(8,776) | (271,281) | $(8,475,806) |
| Class R3 shares | ||||
| Sold | 396 | $10,339 | 5,592 | $172,258 |
| Distributions reinvested | 541 | 17,405 | 974 | 27,552 |
| Repurchased | (6,103) | (201,176) | (31,379) | (982,788) |
| Net decrease | (5,166) | $(173,432) | (24,813) | $(782,978) |
| Class R4 shares1 | ||||
| Repurchased | — | — | (2,224) | $(70,815) |
| Net decrease | — | — | (2,224) | $(70,815) |
| SEMIANNUAL REPORT | JOHN HANCOCK Classic Value Fund | 30 |
| Six Months Ended 4-30-20 | Year Ended 10-31-19 | |||
| Shares | Amount | Shares | Amount | |
| Class R5 shares | ||||
| Sold | 267 | $6,970 | 1,418 | $43,434 |
| Distributions reinvested | 138 | 4,464 | 60 | 1,701 |
| Repurchased | (51) | (1,625) | (868) | (26,785) |
| Net increase | 354 | $9,809 | 610 | $18,350 |
| Class R6 shares | ||||
| Sold | 2,996,329 | $65,817,145 | 1,798,177 | $54,768,972 |
| Distributions reinvested | 555,220 | 17,905,834 | 334,673 | 9,484,641 |
| Repurchased | (1,747,377) | (47,835,945) | (2,825,502) | (86,475,610) |
| Net increase (decrease) | 1,804,172 | $35,887,034 | (692,652) | $(22,221,997) |
| Total net increase (decrease) | 8,122,989 | $195,217,487 | (4,126,358) | $(139,528,741) |
| 1 | Class R4 shares were fully redeemed on 10-29-19. |
| Dividends and distributions | |||||||||
| Affiliate | Ending share amount | Beginning value | Cost of purchases | Proceeds from shares sold | Realized gain (loss) | Change in unrealized appreciation (depreciation) | Income distributions received | Capital gain distributions received | Ending value |
| John Hancock Collateral Trust* | 6,074,988 | — | $190,179,432 | $(129,431,507) | $(4,090) | $57,071 | $405,829 | — | $60,800,906 |
| * | Refer to the Securities lending note within Note 2 for details regarding this investment. |
| 31 | JOHN HANCOCK Classic Value Fund | SEMIANNUAL REPORT |
STATEMENT REGARDING LIQUIDITY RISK MANAGEMENT
Operation of the Liquidity Risk Management Program
This section describes operation and effectiveness of the Liquidity Risk Management Program (LRMP) established in accordance with Rule 22e-4 under the Investment Company Act of 1940, as amended (the Liquidity Rule). The Board of Trustees (the Board) of each Fund in the John Hancock Group of Funds (each a Fund and collectively, the Funds) that is subject to the requirements of the Liquidity Rule has appointed John Hancock Investment Management LLC and John Hancock Variable Trust Advisers LLC (together, the Advisor) to serve as Administrator of the LRMP with respect to each of the Funds, including John Hancock Classic Value Fund, subject to the oversight of the Board. In order to provide a mechanism and process to perform the functions necessary to administer the LRMP, the Advisor established the Liquidity Risk Management Committee (the Committee). The Fund's subadvisor, Pzena Investment Management, LLC (the Subadvisor) executes the day-to-day investment management and security-level activities of the Fund in accordance with the requirements of the LRMP, subject to the supervision of the Advisor and the Board.
The Committee holds monthly meetings to: (1) review the day-to-day operations of the LRMP; (2) review and approve month end liquidity classifications; (3) review quarterly testing and determinations, as applicable; and (4) review other LRMP related material. The Committee also conducts daily, monthly, quarterly, and annual quantitative and qualitative assessments of each subadvisor to a Fund that is subject to the requirements of the Liquidity Rule and is a part of the LRMP to monitor investment performance issues, risks and trends. In addition, the Committee may conduct ad-hoc reviews and meetings with subadvisors as issues and trends are identified, including potential liquidity and valuation issues.
The Committee provided the Board at a meeting held on March 15-17, 2020 with a written report which addressed the Committee's assessment of the adequacy and effectiveness of the implementation and operation of the LRMP and any material changes to the LRMP. The report, which covered the period December 1, 2018 through December 31, 2019, included an assessment of important aspects of the LRMP including, but not limited to:
• Operation of the Fund's Redemption-In-Kind Procedures;
• Highly Liquid Investment Minimum (HLIM) determination;
• Compliance with the 15% limit on illiquid investments;
• Reasonably Anticipated Trade Size (RATS) determination;
• Security-level liquidity classifications; and
• Liquidity risk assessment.
The report also covered material liquidity matters which occurred or were reported during this period applicable to the Fund, if any, and the Committee's actions to address such matters.
Redemption-In-Kind Procedures
Rule 22e-4 requires any fund that engages in or reserves the right to engage in in-kind redemptions to adopt and implement written policies and procedures regarding in-kind redemptions as part of the management of its liquidity risk. These procedures address the process for redeeming in kind, as well as the circumstances under which the Fund would consider redeeming in kind. Anticipated large redemption activity will be evaluated to identify situations where redeeming in securities instead of cash may be appropriate.
As part of its annual assessment of the LRMP, the Committee reviewed the implementation and operation of the Redemption-In-Kind Procedures and determined they are operating in a manner that such procedures are adequate and effective to manage in-kind redemptions on behalf of the Fund as part of the LRMP.
Highly Liquid Investment Minimum determination
The Committee uses an HLIM model to determine a Fund's HLIM. This process incorporates the Fund's investment strategy, historical redemptions, liquidity classification rollup percentages and cash balances, redemption policy, access to funding sources, distribution channels and client concentrations. If the Fund falls below its established HLIM for a period greater than 7 consecutive calendar days, the Committee prepares a report to the Board within one business day following the seventh consecutive calendar day with an explanation of how the Fund plans to restore its HLIM within a reasonable period of time.
Based on the HLIM model, the Committee has determined that the Fund qualifies as a Primarily Highly Liquid Fund (PHLF). It is therefore not required to establish a HLIM. The Fund is tested quarterly to confirm its PHLF status.
As part of its annual assessment of the LRMP, the Committee reviewed the policies and procedures in place with respect to HLIM and PHLF determinations, and determined that such policies and procedures are operating in a manner that is adequate and effective as part of the LRMP.
Compliance with the 15% limit on illiquid investments
Rule 22e-4 sets an aggregate illiquid investment limit of 15% for a fund. Funds are prohibited from acquiring an illiquid investment if this results in greater than 15% of its net assets being classified as illiquid. When applying this limit, the Committee defines "illiquid investment" to mean any investment that the Fund reasonably expects cannot be sold or disposed of in current market conditions in seven calendar days or less without the sale or disposition significantly changing the market value of the investment. If a 15% illiquid investment limit breach occurs for longer than 1 business day, the Fund is required to notify the Board and provide a plan on how to bring illiquid investments within the 15% threshold, and after 7 days confidentially notify the Securities and Exchange Commission (the SEC).
In February 2019, as a result of extended security markets closures in connection with the Chinese New Year in certain countries, the SEC released guidance, and the Committee approved and adopted an Extended Market Holiday Policy to plan for and monitor known Extended Market Holidays (defined as all expected market holiday closures spanning four or more calendar days).
As part of its annual assessment of the LRMP, the Committee reviewed the policies and procedures in place with respect to the 15% illiquid investment limit and determined such policies and procedures are operating in a manner that is adequate and effective as part of the LMRP.
Reasonably Anticipated Trade Size determination
In order to assess the liquidity risk of a Fund, the Committee considers the impact on the Fund that redemptions of a RATS would have under both normal and reasonably foreseeable stressed conditions. Modelling the Fund's RATS requires quantifying cash flow volatility and analyzing distribution channel concentration and redemption risk. The model is designed to estimate the amount of assets that the Fund could reasonably anticipate trading on a given day, during both normal and reasonably foreseeable stressed conditions, to satisfy redemption requests.
As part of its annual assessment of the LRMP, the Committee reviewed the policies and procedures in place with respect to RATS determinations and determined that such policies and procedures are operating in a manner that is adequate and effective at making RATS determinations as part of the LRMP.
Security-level liquidity classifications
When classifying the liquidity of portfolio securities, the Fund adheres to the liquidity classification procedures established by the Advisor. In assigning a liquidity classification to Fund portfolio holdings, the following key inputs, among others, are considered: the Fund's RATS, feedback from the applicable Subadvisor on market-, trading- and investment-specific considerations, an assessment of current market conditions and fund portfolio holdings, and a value impact standard. The Subadvisor also provides position-level data to the Committee for use in monthly classification reconciliation in order to identify any classifications that may need to be changed as a result of the above considerations.
As part of its annual assessment of the LRMP, the Committee reviewed the policies and procedures in place with respect to security-level liquidity classifications and determined that such policies and procedures are operating in a manner that is adequate and effective as part of the LRMP.
Liquidity risk assessment
The Committee periodically reviews and assesses, the Fund's liquidity risk, including its investment strategy and liquidity of portfolio investments during both normal and reasonably foreseeable stressed conditions (including whether the investment strategy is appropriate for an open-end fund, the extent to which the strategy involves a relatively concentrated portfolio or large positions in particular issuers, and the use of borrowings for investment purposes and derivatives), cash flow analysis during both normal and reasonably foreseeable stressed conditions, and holdings of cash and cash equivalents, as well as borrowing arrangements and other funding sources.
The Committee also monitors global events, such as the COVID-19 Coronavirus, that could impact the markets and liquidity of portfolio investments and their classifications.
As part of its annual assessment of the LRMP, the Committee reviewed Fund-Level Liquidity Risk Assessment Reports for each of the Funds and determined that the investment strategy for each Fund continues to be appropriate for an open-ended structure.
Adequacy and Effectiveness
Based on the review and assessment conducted by the Committee, the Committee has determined that the LRMP has been implemented, and is operating in a manner that is adequate and effective at assessing and managing the liquidity risk of each Fund.
Trustees Hassell H. McClellan,Chairperson Officers Andrew G. Arnott Francis V. Knox, Jr. Charles A. Rizzo Salvatore Schiavone Christopher (Kit) Sechler | Investment advisor John Hancock Investment Management LLC Subadvisor Pzena Investment Management, LLC Portfolio Managers John J. Flynn Principal distributor John Hancock Investment Management Distributors LLC Custodian State Street Bank and Trust Company Transfer agent John Hancock Signature Services, Inc. Legal counsel K&L Gates LLP |
* Member of the Audit Committee
† Non-Independent Trustee
The fund's proxy voting policies and procedures, as well as the fund proxy voting record for the most recent twelve-month period ended June 30, are available free of charge on the Securities and Exchange Commission (SEC) website at sec.gov or on our website.
All of the fund's holdings as of the end of the third month of every fiscal quarter are filed with the SEC on Form N-PORT within 60 days of the end of the fiscal quarter. The fund's Form N-PORT filings are available on our website and the SEC's website, sec.gov.
We make this information on your fund, as well asmonthly portfolio holdings, and other fund details available on our website at jhinvestments.com or by calling 800-225-5291.
| You can also contact us: | |||
| 800-225-5291 jhinvestments.com | Regular mail: John Hancock Signature Services, Inc. | Express mail: John Hancock Signature Services, Inc. | |
John Hancock family of funds
DOMESTIC EQUITY FUNDS Blue Chip Growth Classic Value Disciplined Value Disciplined Value Mid Cap Equity Income Financial Industries Fundamental All Cap Core Fundamental Large Cap Core New Opportunities Regional Bank Small Cap Core Small Cap Growth Small Cap Value U.S. Global Leaders Growth U.S. Quality Growth GLOBAL AND INTERNATIONAL EQUITY FUNDS Disciplined Value International Emerging Markets Emerging Markets Equity Fundamental Global Franchise Global Equity Global Shareholder Yield Global Thematic Opportunities International Dynamic Growth International Growth International Small Company | INCOME FUNDS Bond California Tax-Free Income Emerging Markets Debt Floating Rate Income Government Income High Yield High Yield Municipal Bond Income Investment Grade Bond Money Market Short Duration Bond Short Duration Credit Opportunities Strategic Income Opportunities Tax-Free Bond ALTERNATIVE AND SPECIALTY FUNDS Absolute Return Currency Alternative Asset Allocation Alternative Risk Premia Diversified Macro Infrastructure Multi-Asset Absolute Return Seaport Long/Short |
A fund's investment objectives, risks, charges, and expenses should be considered carefully before investing. The prospectus contains this and other important information about the fund. To obtain a prospectus, contact your financial professional, call John Hancock Investment Management at 800-225-5291, or visit our website at jhinvestments.com. Please read the prospectus carefully before investing or sending money.
ASSET ALLOCATION Balanced Multi-Asset High Income Multi-Index Lifetime Portfolios Multi-Index Preservation Portfolios Multimanager Lifestyle Portfolios Multimanager Lifetime Portfolios Retirement Income 2040 EXCHANGE-TRADED FUNDS John Hancock Multifactor Consumer Discretionary ETF John Hancock Multifactor Consumer Staples ETF John Hancock Multifactor Developed International ETF John Hancock Multifactor Emerging Markets ETF John Hancock Multifactor Energy ETF John Hancock Multifactor Financials ETF John Hancock Multifactor Healthcare ETF John Hancock Multifactor Industrials ETF John Hancock Multifactor Large Cap ETF John Hancock Multifactor Materials ETF John Hancock Multifactor Media and John Hancock Multifactor Mid Cap ETF John Hancock Multifactor Small Cap ETF John Hancock Multifactor Technology ETF John Hancock Multifactor Utilities ETF | ENVIRONMENTAL, SOCIAL, AND ESG All Cap Core ESG Core Bond ESG International Equity ESG Large Cap Core CLOSED-END FUNDS Financial Opportunities Hedged Equity & Income Income Securities Trust Investors Trust Preferred Income Preferred Income II Preferred Income III Premium Dividend Tax-Advantaged Dividend Income Tax-Advantaged Global Shareholder Yield |
John Hancock Multifactor ETF shares are bought and sold at market price (not NAV), and are not individually redeemed
from the fund. Brokerage commissions will reduce returns.
John Hancock ETFs are distributed by Foreside Fund Services, LLC, and are subadvised by Dimensional Fund Advisors LP.
Foreside is not affiliated with John Hancock Investment Management Distributors LLC or Dimensional Fund Advisors LP.
Dimensional Fund Advisors LP receives compensation from John Hancock in connection with licensing rights to the
John Hancock Dimensional indexes. Dimensional Fund Advisors LP does not sponsor, endorse, or sell, and makes no
representation as to the advisability of investing in, John Hancock Multifactor ETFs.
John Hancock Investment Management
A trusted brand
John Hancock Investment Management is a premier asset manager
representing one of America's most trusted brands, with a heritage of
financial stewardship dating back to 1862. Helping our shareholders
pursue their financial goals is at the core of everything we do. It's why
we support the role of professional financial advice and operate with
the highest standards of conduct and integrity.
A better way to invest
We serve investors globally through a unique multimanager approach:
We search the world to find proven portfolio teams with specialized
expertise for every strategy we offer, then we apply robust investment
oversight to ensure they continue to meet our uncompromising
standards and serve the best interests of our shareholders.
Results for investors
Our unique approach to asset management enables us to provide
a diverse set of investments backed by some of the world's best
managers, along with strong risk-adjusted returns across asset classes.
![]()
John Hancock Investment Management Distributors LLC n Member FINRA, SIPC
200 Berkeley Street n Boston, MA 02116-5010 n 800-225-5291 n jhinvestments.com
This report is for the information of the shareholders of John Hancock Classic Value Fund. It is not authorized for distribution to prospective investors unless preceded or accompanied by a prospectus.
| MF1182586 | 38SA 4/20 6/2020 |
ITEM 2. CODE OF ETHICS.
Not applicable.
ITEM 3. AUDIT COMMITTEE FINANCIAL EXPERT.
Not applicable at this time.
ITEM 4. PRINCIPAL ACCOUNTANT FEES AND SERVICES.
Not applicable at this time.
ITEM 5. AUDIT COMMITTEE OF LISTED REGISTRANTS.
Not applicable at this time.
ITEM 6. SCHEDULE OF INVESTMENTS.
(a) Not applicable.
(b) Not applicable.
ITEM 7. DISCLOSURE OF PROXY VOTING POLICIES AND PROCEDURES FOR CLOSED-END MANAGEMENT INVESTMENT COMPANIES.
Not applicable.
ITEM 8. PORTFOLIO MANAGERS OF CLOSED-END MANAGEMENT INVESTMENT COMPANIES.
Not applicable.
ITEM 9. PURCHASES OF EQUITY SECURITIES BY CLOSED-END MANAGEMENT INVESTMENT COMPANY AND AFFILIATED PURCHASERS.
Not applicable.
ITEM 10. SUBMISSION OF MATTERS TO A VOTE OF SECURITY HOLDERS.
The registrant has adopted procedures by which shareholders may recommend nominees to the registrant’s Board of Trustees. A copy of the procedures is filed as an exhibit to this Form N-CSR. See attached “John Hancock Funds – Nominating, Governance and Administration Committee Charter.”
ITEM 11. CONTROLS AND PROCEDURES.
(a) Based upon their evaluation of the registrant's disclosure controls and procedures as conducted within 90 days of the filing date of this Form N-CSR, the registrant's principal executive officer and principal financial officer have concluded that those disclosure controls and procedures provide reasonable assurance that the material information required to be disclosed by the registrant on this report is recorded, processed, summarized and reported within the time periods specified in the Securities and Exchange Commission's rules and forms.
(b) There were no changes in the registrant's internal control over financial reporting that occurred during the period covered by this report that have materially affected, or are reasonably likely to materially affect, the registrant's internal control over financial reporting.
ITEM 12. DISCLOSURE OF SECURITIES LENDING ACTIVITIES FOR CLOSED-END MANAGEMENT INVESTMENT COMPANIES.: Not applicable.
ITEM 13. EXHIBITS.
(a) Separate certifications for the registrant'sprincipal executive officer andprincipal financial officer, as required by Section 302 of the Sarbanes-Oxley Act of 2002 and Rule 30a-2(a) under the Investment Company Act of 1940, are attached.
(c)(1) Submission of Matters to a Vote of Security Holders is attached. See attached “John Hancock Funds – Nominating, Governance and Administration Committee Charter.”
SIGNATURES
Pursuant to the requirements of the Securities Exchange Act of 1934 and the Investment Company Act of 1940, the registrant has duly caused this report to be signed on its behalf by the undersigned, thereunto duly authorized.
John Hancock Capital Series
| By: | /s/ Andrew Arnott | |
| Andrew Arnott | ||
| President | ||
| Date: | June 11, 2020 | |
| Pursuant to the requirements of the Securities Exchange Act of 1934 and the Investment Company Act of 1940, this report has been signed below by the following persons on behalf of the registrant and in the capacities and on the dates indicated. | ||
| By: | /s/ Andrew Arnott | |
| Andrew Arnott | ||
| President | ||
| Date: | June 11, 2020 | |
| By: | /s/ Charles A. Rizzo | |
| Charles A. Rizzo | ||
| Chief Financial Officer | ||
| Date: | June 11, 2020 | |