UNITED STATES
SECURITIES AND EXCHANGE COMMISSION
Washington, D.C. 20549
FORM N-CSR
Certified Shareholder Report of
Registered Management Investment Companies
Investment Company Act File Number: 811-00066
American Balanced Fund
(Exact Name of Registrant as Specified in Charter)
One Market, Steuart Tower
Suite 2000
San Francisco, California 94105
(Address of Principal Executive Offices)
Registrant's telephone number, including area code: (415) 421-9360
Date of fiscal year end: December 31
Date of reporting period: June 30, 2013
Patrick F. Quan
American Balanced Fund
One Market, Steuart Tower
Suite 2000
San Francisco, California 94105
(Name and Address of Agent for Service)
Copies to:
Michael Glazer
Bingham McCutchen LLP
355 South Grand Avenue, Suite 4400
Los Angeles, California 90071
(Counsel for the Registrant)
ITEM 1 – Reports to Stockholders

American Balanced Fund®
Semi-annual report for the six months ended June 30, 2013
American Balanced Fund seeks conservation of capital, current income, and long-term growth of both capital and income.
This fund is one of more than 40 offered by one of the nation’s largest mutual fund families, American Funds, from Capital Group. For more than 80 years, Capital has invested with a long-term focus based on thorough research and attention to risk.
Fund results shown in this report, unless otherwise indicated, are for Class A shares at net asset value. If a sales charge (maximum 5.75%) had been deducted, the results would have been lower. Results are for past periods and are not predictive of results for future periods. Current and future results may be lower or higher than those shown. Share prices and returns will vary, so investors may lose money. Investing for short periods makes losses more likely. Investments are not FDIC-insured, nor are they deposits of or guaranteed by a bank or any other entity, so they may lose value. For current information and month-end results, visit americanfunds.com.
Here are the average annual total returns on a $1,000 investment with all distributions reinvested for periods ended June 30, 2013:
| Class A shares | | 1 year | | | 5 years | | | 10 years | |
| | | | | | | | | | | | | |
| Reflecting 5.75% maximum sales charge | | | 9.18% | | | | 6.27% | | | | 6.36% | |
For other share class results, visit americanfunds.com and americanfundsretirement.com.
The total annual fund operating expense ratio was 0.63% for Class A shares as of the prospectus dated March 1, 2013.
Investment results assume all distributions are reinvested and reflect applicable fees and expenses. When applicable, investment results reflect fee waivers, without which results would have been lower. Visit americanfunds.com for more information.
The fund’s 30-day yield for Class A shares as of July 31, 2013, calculated in accordance with the U.S. Securities and Exchange Commission (SEC) formula, was 1.40%. The fund’s 12-month distribution rate for Class A shares as of that date was 1.57%. Both reflect the 5.75% maximum sales charge. The SEC yield reflects the rate at which the fund is earning income on its current portfolio of securities while the distribution rate reflects the fund’s past dividends paid to shareholders. Accordingly, the fund’s SEC yield and distribution rate may differ.
The return of principal for bond funds and for funds with significant underlying bond holdings is not guaranteed. Fund shares are subject to the same interest rate, inflation and credit risks associated with the underlying bond holdings. Refer to the fund prospectus and the Risk Factors section of this report for more information on these and other risks associated with investing in the fund.

Fellow investors:
U.S. equities posted strong results for the first six months of 2013, despite rising U.S. interest rates, a continuing recession in the euro zone and deteriorating economic data from China. Equities, as measured by the unmanaged Standard & Poor’s 500 Composite Index, rose 13.8%.
U.S. investment-grade fixed-income securities, as measured by the unmanaged Barclays U.S. Aggregate Index, fell 2.4% over concerns of a potential reduction of monetary stimulus by the Federal Reserve as a result of an improving U.S. economy.
In a period that favored equities over fixed income, American Balanced Fund gained 9.2% for the six months ended June 30, 2013, exceeding the 5.5% return of the Lipper Balanced Funds Index, a measure of the fund’s peer group. Over the past 12 months the fund posted a return of 15.8%, outpacing the Lipper index, which returned 11.7%.
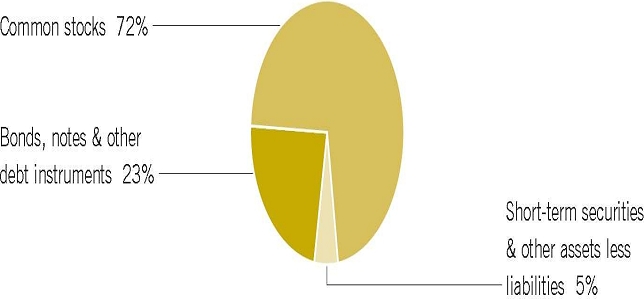
The percentage of the fund invested in equities was relatively high compared with its historical average allocation of 65% stocks and 35% bonds and cash. As of June 30, 2013, the portfolio held 72% in stocks and 28% in bonds and cash — reflecting the portfolio managers’ decision to invest more heavily than usual in equity markets.
A low concentration of international companies aided the fund on a relative basis as U.S.-based investments did quite well while stocks in certain European markets lost ground.
Over longer term periods, American Balanced Fund has also outpaced its peers. For the five years ended June 30, the fund posted an average annual total return of 7.5%, exceeding the 5.3% return of the Lipper Balanced Funds Index. For the 10 years, the fund’s average annual total return of 7.0% beat the 6.2% of the Lipper index. For the 37 years that Capital Research and Management Company has been its investment adviser, the fund realized an average annual total return of 10.8%, compared with 10.0% for the Lipper index.
During the six months, most of the fund’s top 10 holdings produced results that surpassed market returns. American Express (30.1%), Berkshire Hathaway (25.8%) and Wells Fargo (20.7%) were significant contributors. The financial sector’s rise was aided by improved
earnings and approvals for dividend increases and share repurchases for large banking groups. Also supporting results were Home Depot (25.2%), Boeing (35.9%) and Microsoft (29.2%), all sizable fund holdings.
Housing market data, as reported by the S&P/Case-Shiller index, signaled that home prices increased in March and April at their fastest pace since 2006. Automakers and auto-related stocks also improved. We are reasonably optimistic that the U.S. economy will continue to strengthen.
Bond markets struggled during May and June, as rising interest rates and talk of the Fed curtailing its monthly asset purchases sparked the biggest quarterly selloff in U.S. Treasuries since 2010. Yields (which move inversely to prices) on the benchmark 10-year note rose 74 basis points to 2.5%. Corporate bonds declined 3.4% and Treasuries fell 2.1%.
At period-end, the fund’s bond portfolio (23% of fund assets overall) consisted of 8.2% corporate bonds, 7.8% Treasuries, and 6.6% mortgage-backed and federal agency bonds and notes. We feel that we may be facing a period of more volatile interest rates. As a result, we trimmed our holdings in mortgage-backed securities slightly over the six months as historically they have not done well in these situations.
We believe that fixed-income investing is an important part of our balanced fund approach. The fund’s bond portfolio, which holds a broad spectrum of high-quality fixed-income investments, is designed to act as an anchor to protect against volatility in equity markets and to provide a steady stream of income to investors over the long term.
We would like to take this opportunity to welcome our many new shareholders to the fund. We will continue to follow the prudent, research-driven approach to investing that has characterized American Balanced Fund throughout its long history. We appreciate your support and look forward to reporting to you again in six months’ time.
Cordially,

Gregory D. Johnson
Vice Chairman of the Board
and President
August 12, 2013
For current information about the fund, visit americanfunds.com.
| Summary investment portfolio June 30, 2013 | unaudited |
The following summary investment portfolio is designed to streamline the report and help investors better focus on the fund’s principal holdings. See page 35 for details on how to obtain a complete schedule of portfolio holdings.
| Investment mix by security type | Percent of net assets |
| Common stocks — 72.40% | | Shares | | | Value
(000) | | | Percent of
net assets | |
| Financials — 14.26% | | | | | | | | | | | | |
| Wells Fargo & Co. | | | 33,215,000 | | | $ | 1,370,783 | | | | 2.20 | % |
| Berkshire Hathaway Inc., Class A1 | | | 8,000 | | | | 1,348,800 | | | | 2.17 | |
| American Express Co. | | | 16,224,000 | | | | 1,212,906 | | | | 1.95 | |
| Goldman Sachs Group, Inc. | | | 6,481,700 | | | | 980,357 | | | | 1.58 | |
| ACE Ltd. | | | 5,650,000 | | | | 505,562 | | | | .81 | |
| JPMorgan Chase & Co. | | | 9,121,000 | | | | 481,498 | | | | .77 | |
| Citigroup Inc. | | | 9,500,000 | | | | 455,715 | | | | .73 | |
| Weyerhaeuser Co.1 | | | 12,815,242 | | | | 365,106 | | | | .59 | |
| SunTrust Banks, Inc. | | | 9,500,000 | | | | 299,915 | | | | .48 | |
| Other securities | | | | | | | 1,851,197 | | | | 2.98 | |
| | | | | | | | 8,871,839 | | | | 14.26 | |
| | | | | | | | | | | | | |
| Consumer discretionary — 10.58% | | | | | | | | | | | | |
| Home Depot, Inc. | | | 25,925,000 | | | | 2,008,410 | | | | 3.23 | |
| Amazon.com, Inc.1 | | | 5,168,000 | | | | 1,435,102 | | | | 2.30 | |
| Comcast Corp., Class A | | | 20,310,000 | | | | 850,583 | | | | 1.37 | |
| Walt Disney Co. | | | 7,000,000 | | | | 442,050 | | | | .71 | |
| VF Corp. | | | 1,750,000 | | | | 337,855 | | | | .54 | |
| Other securities | | | | | | | 1,511,932 | | | | 2.43 | |
| | | | | | | | 6,585,932 | | | | 10.58 | |
| Common stocks | | Shares | | | Value
(000) | | | Percent of
net assets | |
| Industrials — 10.26% | | | | | | | | | | | | |
| Boeing Co. | | | 15,525,000 | | | $ | 1,590,381 | | | | 2.56 | % |
| Union Pacific Corp. | | | 7,793,187 | | | | 1,202,333 | | | | 1.93 | |
| Lockheed Martin Corp. | | | 6,392,037 | | | | 693,280 | | | | 1.11 | |
| General Electric Co. | | | 29,600,000 | | | | 686,424 | | | | 1.10 | |
| Deere & Co. | | | 5,640,000 | | | | 458,250 | | | | .74 | |
| Parker-Hannifin Corp. | | | 4,100,000 | | | | 391,140 | | | | .63 | |
| United Technologies Corp. | | | 3,630,000 | | | | 337,372 | | | | .54 | |
| Cummins Inc. | | | 2,695,000 | | | | 292,300 | | | | .47 | |
| Other securities | | | | | | | 732,024 | | | | 1.18 | |
| | | | | | | | 6,383,504 | | | | 10.26 | |
| | | | | | | | | | | | | |
| Health care — 7.58% | | | | | | | | | | | | |
| Merck & Co., Inc. | | | 23,540,000 | | | | 1,093,433 | | | | 1.76 | |
| Bristol-Myers Squibb Co. | | | 17,676,149 | | | | 789,947 | | | | 1.27 | |
| UnitedHealth Group Inc. | | | 9,295,000 | | | | 608,637 | | | | .98 | |
| Gilead Sciences, Inc.1 | | | 10,268,100 | | | | 525,829 | | | | .84 | |
| Pfizer Inc. | | | 18,550,000 | | | | 519,585 | | | | .83 | |
| Baxter International Inc. | | | 5,610,000 | | | | 388,605 | | | | .62 | |
| Johnson & Johnson | | | 4,100,000 | | | | 352,026 | | | | .57 | |
| Other securities | | | | | | | 439,204 | | | | .71 | |
| | | | | | | | 4,717,266 | | | | 7.58 | |
| | | | | | | | | | | | | |
| Information technology — 7.40% | | | | | | | | | | | | |
| Microsoft Corp. | | | 29,740,000 | | | | 1,026,922 | | | | 1.65 | |
| Taiwan Semiconductor Manufacturing Co. Ltd. (ADR) | | | 45,100,000 | | | | 826,232 | | | | 1.33 | |
| Texas Instruments Inc. | | | 23,605,000 | | | | 823,106 | | | | 1.32 | |
| ASML Holding NV (New York registered) | | | 3,812,080 | | | | 301,535 | | | | | |
| ASML Holding NV | | | 1,470,405 | | | | 116,024 | | | | .67 | |
| Google Inc., Class A1 | | | 415,000 | | | | 365,354 | | | | .59 | |
| TE Connectivity Ltd. | | | 6,360,000 | | | | 289,634 | | | | .46 | |
| Other securities | | | | | | | 859,395 | | | | 1.38 | |
| | | | | | | | 4,608,202 | | | | 7.40 | |
| | | Shares | | | Value
(000) | | | Percent of
net assets | |
| Consumer staples — 7.06% | | | | | | | | | | | | |
| Philip Morris International Inc. | | | 11,300,000 | | | $ | 978,806 | | | | 1.57 | % |
| PepsiCo, Inc. | | | 9,853,357 | | | | 805,906 | | | | 1.30 | |
| Procter & Gamble Co. | | | 8,730,000 | | | | 672,123 | | | | 1.08 | |
| Costco Wholesale Corp. | | | 5,677,326 | | | | 627,742 | | | | 1.01 | |
| Nestlé SA | | | 7,470,000 | | | | 489,933 | | | | | |
| Nestlé SA (ADR) | | | 1,000,000 | | | | 65,780 | | | | .89 | |
| Other securities | | | | | | | 754,517 | | | | 1.21 | |
| | | | | | | | 4,394,807 | | | | 7.06 | |
| | | | | | | | | | | | | |
| Energy — 6.95% | | | | | | | | | | | | |
| Chevron Corp. | | | 11,687,000 | | | | 1,383,040 | | | | 2.22 | |
| Royal Dutch Shell PLC, Class B (ADR) | | | 8,958,000 | | | | 593,647 | | | | .96 | |
| Transocean Ltd. | | | 6,500,000 | | | | 311,675 | | | | .50 | |
| Other securities | | | | | | | 2,034,284 | | | | 3.27 | |
| | | | | | | | 4,322,646 | | | | 6.95 | |
| | | | | | | | | | | | | |
| Materials — 2.86% | | | | | | | | | | | | |
| E.I. du Pont de Nemours and Co. | | | 6,750,000 | | | | 354,375 | | | | .57 | |
| Dow Chemical Co. | | | 10,980,000 | | | | 353,227 | | | | .57 | |
| Other securities | | | | | | | 1,072,963 | | | | 1.72 | |
| | | | | | | | 1,780,565 | | | | 2.86 | |
| | | | | | | | | | | | | |
| Utilities — 1.24% | | | | | | | | | | | | |
| PG&E Corp. | | | 6,810,000 | | | | 311,421 | | | | .50 | |
| Other securities | | | | | | | 457,171 | | | | .74 | |
| | | | | | | | 768,592 | | | | 1.24 | |
| | | | | | | | | | | | | |
| Telecommunication services — 0.51% | | | | | | | | | | | | |
| Other securities | | | | | | | 317,718 | | | | .51 | |
| | | | | | | | | | | | | |
| Miscellaneous — 3.70% | | | | | | | | | | | | |
| Other common stocks in initial period of acquisition | | | | | | | 2,300,372 | | | | 3.70 | |
| | | | | | | | | | | | | |
| Total common stocks (cost: $30,055,630,000) | | | | | | | 45,051,443 | | | | 72.40 | |
Bonds, notes & other debt
instruments — 22.95% | | Principal amount
(000) | | | Value
(000) | | | Percent of
net assets | |
| Corporate bonds & notes — 8.19% | | | | | | | | | | | | |
| Financials — 2.54% | | | | | | | | | | | | |
| Goldman Sachs Group, Inc. 2.375%–5.75% 2016–2023 | | $ | 142,080 | | | $ | 146,217 | | | | .24 | % |
| Wells Fargo & Co. 3.676%–4.60% 2016–2021 | | | 44,000 | | | | 47,585 | | | | .08 | |
| Berkshire Hathaway Finance Corp. 1.30%–2.20% 2016–2018 | | | 33,195 | | | | 33,629 | | | | .05 | |
| American Express Co. 6.15% 2017 | | | 22,800 | | | | 26,437 | | | | .04 | |
| Other securities | | | | | | | 1,329,370 | | | | 2.13 | |
| | | | | | | | 1,583,238 | | | | 2.54 | |
| | | | | | | | | | | | | |
| Consumer staples — 0.99% | | | | | | | | | | | | |
| PepsiCo, Inc. 2.50%–7.90% 2015–2018 | | | 47,000 | | | | 52,485 | | | | .09 | |
| Philip Morris International Inc. 2.625% 2023 | | | 16,000 | | | | 14,833 | | | | .02 | |
| Procter & Gamble Co. 1.45% 2016 | | | 13,460 | | | | 13,635 | | | | .02 | |
| Other securities | | | | | | | 533,865 | | | | .86 | |
| | | | | | | | 614,818 | | | | .99 | |
| Industrials — 0.86% | | | | | | | | | | | | |
| General Electric Capital Corp. 0.91%–3.10% 2014–20232 | | | 185,605 | | | | 187,359 | | | | | |
| General Electric Co. 0.85%–4.125% 2015–2042 | | | 30,500 | | | | 29,780 | | | | .35 | |
| Union Pacific Corp. 5.70%–5.75% 2017–2018 | | | 33,475 | | | | 38,987 | | | | .06 | |
| Boeing Co. 0.95% 2018 | | | 12,000 | | | | 11,491 | | | | .02 | |
| Other securities | | | | | | | 264,586 | | | | .43 | |
| | | | | | | | 532,203 | | | | .86 | |
| | | | | | | | | | | | | |
| Health care — 0.77% | | | | | | | | | | | | |
| UnitedHealth Group Inc. 6.00% 2017–2018 | | | 57,170 | | | | 66,705 | | | | .11 | |
| Other securities | | | | | | | 412,764 | | | | .66 | |
| | | | | | | | 479,469 | | | | .77 | |
| | | | | | | | | | | | | |
| Consumer discretionary — 0.76% | | | | | | | | | | | | |
| Comcast Corp. 5.30%–6.95% 2014–2037 | | | 71,000 | | | | 83,837 | | | | .13 | |
| Home Depot, Inc. 4.40%–5.95% 2021–2041 | | | 30,000 | | | | 34,439 | | | | .06 | |
| Other securities | | | | | | | 355,627 | | | | .57 | |
| | | | | | | | 473,903 | | | | .76 | |
| | | | | | | | | | | | | |
| Other corporate bonds & notes — 2.27% | | | | | | | | | | | | |
| Other securities | | | | | | | 1,413,098 | | | | 2.27 | |
| | | | | | | | | | | | | |
| Total corporate bonds & notes | | | | | | | 5,096,729 | | | | 8.19 | |
| | | Principal amount
(000) | | | Value
(000) | | | Percent of
net assets | |
| U.S. Treasury bonds & notes — 7.80% | | | | | | | | | | | | |
| U.S. Treasury — 6.37% | | | | | | | | | | | | |
| 1.625% 2022 | | $ | 419,000 | | | $ | 390,722 | | | | | |
| 1.125%–6.375% 2013–2043 | | | 3,356,817 | | | | 3,571,213 | | | | 6.37 | % |
| | | | | | | | 3,961,935 | | | | 6.37 | |
| | | | | | | | | | | | | |
| U.S. Treasury inflation-protected securities3 — 1.43% | | | | | | | | | | | | |
| 0.125%–2.375% 2013–2043 | | | 883,319 | | | | 886,707 | | | | 1.43 | |
| | | | | | | | | | | | | |
| Total U.S. Treasury bonds & notes | | | | | | | 4,848,642 | | | | 7.80 | |
| | | | | | | | | | | | | |
| Mortgage-backed obligations4 — 6.15% | | | | | | | | | | | | |
| Fannie Mae 0%–11.012% 2018–20472 | | | 2,405,282 | | | | 2,487,216 | | | | 4.00 | |
| Freddie Mac 0%–6.705% 2019–20412 | | | 317,854 | | | | 322,044 | | | | .52 | |
| Other securities | | | | | | | 1,016,549 | | | | 1.63 | |
| | | | | | | | 3,825,809 | | | | 6.15 | |
| | | | | | | | | | | | | |
| Federal agency bonds & notes — 0.47% | | | | | | | | | | | | |
| Freddie Mac 0.75%–2.50% 2016–2020 | | | 263,000 | | | | 261,727 | | | | .42 | |
| Fannie Mae 6.25% 2029 | | | 8,000 | | | | 10,549 | | | | .02 | |
| Other securities | | | | | | | 21,235 | | | | .03 | |
| | | | | | | | 293,511 | | | | .47 | |
| | | | | | | | | | | | | |
| Other — 0.25% | | | | | | | | | | | | |
| Other securities | �� | | | | | | 157,476 | | | | .25 | |
| | | | | | | | | | | | | |
| Miscellaneous — 0.09% | | | | | | | | | | | | |
| Other bonds, notes & other debt instruments in initial period of acquisition | | | | | | | 54,926 | | | | .09 | |
Total bonds, notes & other debt instruments
(cost: $14,080,213,000) | | | | | | | 14,277,093 | | | | 22.95 | |
| Short-term securities — 4.74% | | Principal amount
(000) | | | Value
(000) | | | Percent of
net assets | |
| Freddie Mac 0.10%–0.17% due 7/30/2013–5/13/2014 | | $ | 712,310 | | | $ | 711,745 | | | | 1.14 | % |
| Fannie Mae 0.09%–0.16% due 7/1/2013–5/5/2014 | | | 576,500 | | | | 576,183 | | | | .93 | |
| Federal Home Loan Bank 0.082%–0.16% due 7/5/2013–6/17/2014 | | | 518,900 | | | | 518,650 | | | | .83 | |
| U.S. Treasury Bills 0.158%–0.17% due 8/22–11/14/2013 | | | 171,400 | | | | 171,365 | | | | .28 | |
| General Electric Capital Corp. 0.11% due 9/24/2013 | | | 83,000 | | | | 82,974 | | | | .13 | |
| Procter & Gamble Co. 0.10% due 8/20–8/26/20135 | | | 70,000 | | | | 69,992 | | | | .11 | |
| Wells Fargo & Co. 0.15% due 8/14/2013 | | | 66,500 | | | | 66,483 | | | | .11 | |
| Merck & Co. Inc. 0.085% due 7/19/20135 | | | 37,900 | | | | 37,898 | | | | .06 | |
| Other securities | | | | | | | 717,085 | | | | 1.15 | |
| | | | | | | | | | | | | |
| Total short-term securities (cost: $2,952,365,000) | | | | | | | 2,952,375 | | | | 4.74 | |
| Total investment securities (cost: $47,088,208,000) | | | | | | | 62,280,911 | | | | 100.09 | |
| Other assets less liabilities | | | | | | | (57,248 | ) | | | (.09 | ) |
| | | | | | | | | | | | | |
| Net assets | | | | | | $ | 62,223,663 | | | | 100.00 | % |
As permitted by U.S. Securities and Exchange Commission regulations, “Miscellaneous” securities include holdings in their first year of acquisition that have not previously been publicly disclosed.
“Other securities” includes all issues that are not disclosed separately in the summary investment portfolio.
The following footnotes apply to either the individual securities noted or one or more of the securities aggregated and listed as a single line item.
| 1 | Security did not produce income during the last 12 months. |
| 2 | Coupon rate may change periodically. |
| 3 | Index-linked bond whose principal amount moves with a government price index. |
| 4 | Principal payments may be made periodically. Therefore, the effective maturity date may be earlier than the stated maturity date. |
| 5 | Acquired in a transaction exempt from registration under Rule 144A or section 4(2) of the Securities Act of 1933. May be resold in the U.S. in transactions exempt from registration, normally to qualified institutional buyers. The total value of all such securities, including those in “Other securities,” was $1,528,622,000, which represented 2.46% of the net assets of the fund. |
Key to abbreviation
ADR = American Depositary Receipts
See Notes to Financial Statements
Financial statements
| Statement of assets and liabilities | | unaudited | |
| at June 30, 2013 | | (dollars in thousands) | |
| | | | | | | | | |
| Assets: | | | | | | | | |
| Investment securities, at value (cost: $47,088,208) | | | | | | $ | 62,280,911 | |
| Cash | | | | | | 9,796 | |
| Receivables for: | | | | | | | | |
| Sales of investments | | $ | 978,377 | | | | | |
| Sales of fund’s shares | | | 101,411 | | | | | |
| Dividends and interest | | | 169,433 | | | | 1,249,221 | |
| | | | | | | | 63,539,928 | |
| Liabilities: | | | | | | | | |
| Payables for: | | | | | | | | |
| Purchases of investments | | | 1,179,647 | | | | | |
| Repurchases of fund’s shares | | | 95,904 | | | | | |
| Investment advisory services | | | 12,153 | | | | | |
| Services provided by related parties | | | 24,076 | | | | | |
| Trustees’ deferred compensation | | | 3,616 | | | | | |
| Other | | | 869 | | | | 1,316,265 | |
| Net assets at June 30, 2013 | | | | | | $ | 62,223,663 | |
| | | | | | | | | |
| Net assets consist of: | | | | | | | | |
| Capital paid in on shares of beneficial interest | | | | | | $ | 47,929,560 | |
| Undistributed net investment income | | | | | | | 27,885 | |
| Accumulated net realized loss | | | | | | | (926,362 | ) |
| Net unrealized appreciation | | | | | | | 15,192,580 | |
| Net assets at June 30, 2013 | | | | | | $ | 62,223,663 | |
(dollars and shares in thousands, except per-share amounts)
Shares of beneficial interest issued and outstanding (no stated par value) —
unlimited shares authorized (2,820,674 total shares outstanding)
| | | Net assets | | | Shares
outstanding | | | Net asset
value per share | |
| Class A | | $ | 37,828,006 | | | | 1,713,376 | | | $ | 22.08 | |
| Class B | | | 915,451 | | | | 41,564 | | | | 22.03 | |
| Class C | | | 4,693,307 | | | | 213,560 | | | | 21.98 | |
| Class F-1 | | | 1,886,931 | | | | 85,501 | | | | 22.07 | |
| Class F-2 | | | 563,742 | | | | 25,543 | | | | 22.07 | |
| Class 529-A | | | 2,333,868 | | | | 105,846 | | | | 22.05 | |
| Class 529-B | | | 119,507 | | | | 5,416 | | | | 22.07 | |
| Class 529-C | | | 763,785 | | | | 34,654 | | | | 22.04 | |
| Class 529-E | | | 123,200 | | | | 5,590 | | | | 22.04 | |
| Class 529-F-1 | | | 89,139 | | | | 4,045 | | | | 22.04 | |
| Class R-1 | | | 139,362 | | | | 6,347 | | | | 21.96 | |
| Class R-2 | | | 1,232,001 | | | | 56,080 | | | | 21.97 | |
| Class R-3 | | | 2,881,440 | | | | 131,039 | | | | 21.99 | |
| Class R-4 | | | 3,586,055 | | | | 162,649 | | | | 22.05 | |
| Class R-5 | | | 2,252,366 | | | | 101,956 | | | | 22.09 | |
| Class R-6 | | | 2,815,503 | | | | 127,508 | | | | 22.08 | |
See Notes to Financial Statements
| Statement of operations | unaudited | |
| for the six months ended June 30, 2013 | (dollars in thousands) | |
| | | | | | | | | |
| Investment income: | | | | | | | | |
| Income: | | | | | | | | |
| Dividends (net of non-U.S. taxes of $7,508) | | $ | 479,933 | | | | | |
| Interest | | | 185,485 | | | $ | 665,418 | |
| Fees and expenses*: | | | | | | | | |
| Investment advisory services | | | 70,994 | | | | | |
| Distribution services | | | 97,697 | | | | | |
| Transfer agent services | | | 35,629 | | | | | |
| Administrative services | | | 7,428 | | | | | |
| Reports to shareholders | | | 1,416 | | | | | |
| Registration statement and prospectus | | | 547 | | | | | |
| Trustees’ compensation | | | 589 | | | | | |
| Auditing and legal | | | 29 | | | | | |
| Custodian | | | 194 | | | | | |
| Other | | | 1,819 | | | | 216,342 | |
| Net investment income | | | | | | | 449,076 | |
| | | | | | | | | |
| Net realized gain and unrealized appreciation on investments and currency: | | | | | | | | |
| Net realized gain (loss) on: | | | | | | | | |
| Investments | | | 991,524 | | | | | |
| Currency transactions | | | (1,141 | ) | | | 990,383 | |
| Net unrealized appreciation (depreciation) on: | | | | | | | | |
| Investments | | | 3,685,195 | | | | | |
| Currency translations | | | (161 | ) | | | 3,685,034 | |
| Net realized gain and unrealized appreciation on investments and currency | | | | | | | 4,675,417 | |
| | | | | | | | | |
| Net increase in net assets resulting from operations | | | | | | $ | 5,124,493 | |
* Additional information related to class-specific fees and expenses is included in the Notes to Financial Statements.
See Notes to Financial Statements
Statements of changes in net assets
(dollars in thousands)
| | | Six months | | | Year ended | |
| | | ended June 30,
2013* | | | December 31,
2012 | |
| Operations: | | | | | | | | |
| Net investment income | | $ | 449,076 | | | $ | 978,422 | |
| Net realized gain on investments and currency transactions | | | 990,383 | | | | 2,101,912 | |
| Net unrealized appreciation on investments and currency translations | | | 3,685,034 | | | | 3,852,666 | |
| Net increase in net assets resulting from operations | | | 5,124,493 | | | | 6,933,000 | |
| | | | | | | | | |
| Dividends paid to shareholders from net investment income | | | (500,974 | ) | | | (977,344 | ) |
| | | | | | | | | |
| Net capital share transactions | | | 1,726,364 | | | | 503,635 | |
| | | | | | | | | |
| Total increase in net assets | | | 6,349,883 | | | | 6,459,291 | |
| | | | | | | | | |
| Net assets: | | | | | | | | |
| Beginning of period | | | 55,873,780 | | | | 49,414,489 | |
| End of period (including undistributed net investment income: $27,885 and $79,783, respectively) | | $ | 62,223,663 | | | $ | 55,873,780 | |
* Unaudited.
See Notes to Financial Statements
| Notes to financial statements | unaudited |
1. Organization
American Balanced Fund (the “fund”) is registered under the Investment Company Act of 1940 as an open-end, diversified management investment company. The fund seeks conservation of capital, current income and long-term growth of both capital and income.
The fund has 16 share classes consisting of five retail share classes (Classes A, B and C, as well as two F share classes, F-1 and F-2), five 529 college savings plan share classes (Classes 529-A, 529-B, 529-C, 529-E and 529-F-1) and six retirement plan share classes (Classes R-1, R-2, R-3, R-4, R-5 and R-6). The 529 college savings plan share classes can be used to save for college education. The retirement plan share classes are generally offered only through eligible employer-sponsored retirement plans. The fund’s share classes are further described below:
| Share class | | Initial sales charge | Contingent deferred sales
charge upon redemption | | Conversion feature |
| Classes A and 529-A | | Up to 5.75% | None (except 1% for certain redemptions within one year of purchase without an initial sales charge) | | None |
| Classes B and 529-B* | | None | Declines from 5% to 0% for redemptions within six years of purchase | | Classes B and 529-B convert to Classes A and 529-A, respectively, after eight years |
| Class C | | None | 1% for redemptions within one year of purchase | | Class C converts to Class F-1 after 10 years |
| Class 529-C | | None | 1% for redemptions within one year of purchase | | None |
| Class 529-E | | None | None | | None |
Classes F-1, F-2 and
529-F-1 | | None | None | | None |
Classes R-1, R-2, R-3,
R-4, R-5 and R-6 | | None | None | | None |
* Class B and 529-B shares of the fund are not available for purchase.
Holders of all share classes have equal pro rata rights to assets, dividends and liquidation proceeds. Each share class has identical voting rights, except for the exclusive right to vote on matters affecting only its class. Share classes have different fees and expenses (“class-specific fees and expenses”), primarily due to different arrangements for distribution, administrative and shareholder services. Differences in class-specific fees and expenses will result in differences in net investment income and, therefore, the payment of different per-share dividends by each share class.
2. Significant accounting policies
The financial statements have been prepared to comply with accounting principles generally accepted in the United States of America. These principles require management to make estimates and assumptions that affect reported amounts and disclosures. Actual results could differ from those estimates. The fund follows the significant accounting policies described below, as well as the valuation policies described in the next section on valuation.
Security transactions and related investment income — Security transactions are recorded by the fund as of the date the trades are executed with brokers. Realized gains and losses from security transactions are determined based on the specific identified cost of the securities. In the event a security is purchased with a delayed payment date, the fund will segregate liquid assets sufficient to meet its payment obligations. Dividend income is recognized on the ex-dividend date and interest income is recognized on an accrual basis. Market discounts, premiums and original issue discounts on fixed-income securities are amortized daily over the expected life of the security.
Class allocations — Income, fees and expenses (other than class-specific fees and expenses) and realized and unrealized gains and losses are allocated daily among the various share classes based on their relative net assets. Class-specific fees and expenses, such as distribution, administrative and shareholder services, are charged directly to the respective share class.
Dividends and distributions to shareholders — Dividends and distributions to shareholders are recorded on the ex-dividend date.
Currency translation — Assets and liabilities, including investment securities, denominated in currencies other than U.S. dollars are translated into U.S. dollars at the exchange rates supplied by one or more pricing vendors on the valuation date. Purchases and sales of investment securities and income and expenses are translated into U.S. dollars at the exchange rates on the dates of such transactions. On the accompanying financial statements, the effects of changes in exchange rates on investment securities are included with the net realized gain or loss and net unrealized appreciation or depreciation on investments. The realized gain or loss and unrealized appreciation or depreciation resulting from all other transactions denominated in currencies other than U.S. dollars are disclosed separately.
3. Valuation
Capital Research and Management Company (“CRMC”), the fund’s investment adviser, values the fund’s investments at fair value as defined by accounting principles generally accepted in the United States of America. The net asset value of each share class of the fund is generally determined as of approximately 4:00 p.m. New York time each day the New York Stock Exchange is open.
Methods and inputs — The fund’s investment adviser uses the following methods and inputs to establish the fair value of the fund’s assets and liabilities. Use of particular methods and inputs may vary over time based on availability and relevance as market and economic conditions evolve.
Equity securities are generally valued at the official closing price of, or the last reported sale price on, the exchange or market on which such securities are traded, as of the close of business on the day the securities are being valued or, lacking any sales, at the last available bid price. Prices for each security are taken from the principal exchange or market on which the security trades.
Fixed-income securities, including short-term securities purchased with more than 60 days left to maturity, are generally valued at prices obtained from one or more pricing vendors. Vendors value such securities based on one or more of the inputs described in the following table. The table provides examples of inputs that are commonly relevant for valuing particular classes of fixed-income securities in which the fund is authorized to invest. However, these classifications are not exclusive, and any of the inputs may be used to value any other class of fixed-income security.
| Fixed-income class | Examples of standard inputs |
| All | Benchmark yields, transactions, bids, offers, quotations from dealers and trading systems, new issues, spreads and other relationships observed in the markets among comparable securities; and proprietary pricing models such as yield measures calculated using factors such as cash flows, financial or collateral performance and other reference data (collectively referred to as “standard inputs”) |
Corporate bonds & notes;
convertible securities | Standard inputs and underlying equity of the issuer |
| Bonds & notes of governments & government agencies | Standard inputs and interest rate volatilities |
| Mortgage-backed; asset-backed obligations | Standard inputs and cash flows, prepayment information, default rates, delinquency and loss assumptions, collateral characteristics, credit enhancements and specific deal information |
| Municipal securities | Standard inputs and, for certain distressed securities, cash flows or liquidation values using a net present value calculation based on inputs that include, but are not limited to, financial statements and debt contracts |
When the fund’s investment adviser deems it appropriate to do so (such as when vendor prices are unavailable or not deemed to be representative), fixed-income securities will be valued in good faith at the mean quoted bid and ask prices that are reasonably and timely available (or bid prices, if ask prices are not available) or at prices for securities of comparable maturity, quality and type.
Securities with both fixed-income and equity characteristics, or equity securities traded principally among fixed-income dealers, are generally valued in the manner described above for either equity or fixed-income securities, depending on which method is deemed most appropriate by the fund’s investment adviser. Short-term securities purchased within 60 days to maturity are valued at amortized cost, which approximates fair value. The value of short-term securities originally purchased with maturities greater than 60 days is determined based on an amortized value to par when they reach 60 days.
Securities and other assets for which representative market quotations are not readily available or are considered unreliable by the fund’s investment adviser are fair valued as determined in good faith under fair valuation guidelines adopted by authority of the fund’s board of trustees as further described below. The investment adviser follows fair valuation guidelines, consistent with U.S. Securities and Exchange Commission rules and guidance, to consider relevant principles and factors when making fair value determinations. The investment adviser considers relevant indications of value that are reasonably and timely available to it in determining the fair value to be assigned to a particular security, such as the type and cost of the security; contractual or legal restrictions on resale of the security; relevant financial or business developments of the issuer; actively traded similar or related securities; conversion or exchange rights on the security; related corporate actions; significant events occurring after the close of trading in the security; and changes in overall market conditions. In addition, the closing prices of equity securities that trade in markets outside U.S. time zones may be adjusted to reflect significant events that occur after the close of local trading but before the net asset value of each share class of the fund is determined. Fair valuations and valuations of investments that are not actively trading involve judgment and may differ materially from valuations that would have been used had greater market activity occurred.
Processes and structure — The fund’s board of trustees has delegated authority to the fund’s investment adviser to make fair value determinations, subject to board oversight. The investment adviser has established a Joint Fair Valuation Committee (the “Fair Valuation Committee”) to administer, implement and oversee the fair valuation process, and to make fair value decisions. The Fair Valuation Committee regularly reviews its own fair value decisions, as well as decisions made under its standing instructions to the investment adviser’s valuation teams. The Fair Valuation Committee reviews changes in fair value measurements from period to period and may, as deemed appropriate, update the fair valuation guidelines to better reflect the results of back testing and address new or evolving issues. The Fair Valuation Committee reports any changes to the fair valuation guidelines to the board of trustees with supplemental information to support the changes. The fund’s board and audit committee also regularly review reports that describe fair value determinations and methods.
The fund’s investment adviser has also established a Fixed-Income Pricing Review Group to administer and oversee the fixed-income valuation process, including the use of fixed-income pricing vendors. This group regularly reviews pricing vendor information and market data. Pricing decisions, processes and controls over security valuation are also subject to additional internal reviews, including an annual control self-evaluation program facilitated by the investment adviser’s compliance group.
Classifications — The fund’s investment adviser classifies the fund’s assets and liabilities into three levels based on the inputs used to value the assets or liabilities. Level 1 values are based on quoted prices in active markets for identical securities. Level 2 values are based on significant observable market inputs, such as quoted prices for similar securities and quoted prices in inactive markets. Certain securities trading outside the U.S. may transfer between Level 1 and Level 2 due to valuation adjustments resulting from significant market movements following the close of local trading. Level 3 values are based on significant unobservable inputs that reflect the investment adviser’s determination of assumptions that market participants might reasonably use in valuing the securities. The valuation levels are not necessarily an indication of the risk or liquidity associated with the underlying investment. For example, U.S. government securities are reflected as Level 2 because the inputs used to determine fair value may not always be quoted prices in an active market. The following table presents the fund’s valuation levels as of June 30, 2013 (dollars in thousands):
| | | Investment securities |
| | | Level 1* | | | Level 2 | | | Level 3 | | | Total |
| Assets: | | | | | | | | | | | | | | | | |
| Common stocks: | | | | | | | | | | | | | | | | |
| Financials | | $ | 8,871,839 | | | $ | — | | | $ | — | | | $ | 8,871,839 | |
| Consumer discretionary | | | 6,585,932 | | | | — | | | | — | | | | 6,585,932 | |
| Industrials | | | 6,383,504 | | | | — | | | | — | | | | 6,383,504 | |
| Health care | | | 4,717,266 | | | | — | | | | — | | | | 4,717,266 | |
| Information technology | | | 4,608,202 | | | | — | | | | — | | | | 4,608,202 | |
| Consumer staples | | | 4,394,807 | | | | — | | | | — | | | | 4,394,807 | |
| Energy | | | 4,322,646 | | | | — | | | | — | | | | 4,322,646 | |
| Materials | | | 1,780,565 | | | | — | | | | — | | | | 1,780,565 | |
| Utilities | | | 768,592 | | | | — | | | | — | | | | 768,592 | |
| Telecommunication services | | | 317,718 | | | | — | | | | — | | | | 317,718 | |
| Miscellaneous | | | 2,300,372 | | | | — | | | | — | | | | 2,300,372 | |
| Bonds, notes & other debt instruments: | | | | | | | | | | | | | | | | |
| Corporate bonds & notes | | | — | | | | 5,096,729 | | | | — | | | | 5,096,729 | |
| U.S. Treasury bonds & notes | | | — | | | | 4,848,642 | | | | — | | | | 4,848,642 | |
| Mortgage-backed obligations | | | — | | | | 3,825,809 | | | | — | | | | 3,825,809 | |
| Federal agency bonds & notes | | | — | | | | 293,511 | | | | — | | | | 293,511 | |
| Other | | | — | | | | 157,476 | | | | — | | | | 157,476 | |
| Miscellaneous | | | — | | | | 54,926 | | | | — | | | | 54,926 | |
| Short-term securities | | | — | | | | 2,952,375 | | | | — | | | | 2,952,375 | |
| Total | | $ | 45,051,443 | | | $ | 17,229,468 | | | $ | — | | | $ | 62,280,911 | |
| * | Securities with a market value of $906,536,000, which represented 1.46% of the net assets of the fund, transferred from Level 2 to Level 1 since the prior fiscal year-end, primarily due to a lack of significant market movements following the close of local trading. |
4. Risk factors
Investing in the fund may involve certain risks including, but not limited to, those described below.
Market conditions — The prices of, and the income generated by, the common stocks, bonds and other securities held by the fund may decline due to market conditions and other factors, including those directly involving the issuers of securities held by the fund.
Investing in growth-oriented stocks — Growth-oriented stocks may involve larger price swings and greater potential for loss than other types of investments.
Investing in income-oriented stocks — Income provided by the fund may be reduced by changes in the dividend policies of, and the capital resources available at, the companies in which the fund invests.
Investing in bonds — Rising interest rates will generally cause the prices of bonds and other debt securities to fall. Longer maturity debt securities may be subject to greater price fluctuations than shorter maturity debt securities. In addition, falling interest rates may cause an issuer to redeem, call or refinance a security before its stated maturity, which may result in the fund having to reinvest the proceeds in lower yielding securities.
Bonds and other debt securities are subject to credit risk, which is the possibility that the credit strength of an issuer will weaken and/or an issuer of a debt security will fail to make timely payments of principal or interest and the security will go into default. Lower quality debt securities generally have higher rates of interest and may be subject to greater price fluctuations than higher quality debt securities. Credit risk is gauged, in part, by the credit ratings of the securities in which the fund invests. However, ratings are only the opinions of the rating agencies issuing them and are not guarantees as to credit quality or an evaluation of market risk. The fund’s investment adviser relies on its own credit analysts to research issuers and issues in seeking to mitigate the risks of an issuer defaulting on its obligations.
Investing in securities backed by the U.S. government — Securities backed by the U.S. Treasury or the full faith and credit of the U.S. government are guaranteed only as to the timely payment of interest and principal when held to maturity. Accordingly, the current market values for these securities will fluctuate with changes in interest rates. Securities issued by government-sponsored entities and federal agencies and instrumentalities that are not backed by the full faith and credit of the U.S. government are neither issued nor guaranteed by the U.S. government.
Investing in mortgage-backed and asset-backed securities — Many types of bonds and other debt securities, including mortgage-backed securities, are subject to prepayment risk as well as the risks associated with investing in debt securities in general. If interest rates fall and the loans underlying these securities are prepaid faster than expected, the fund may have to reinvest the prepaid principal in lower yielding securities, thus reducing the
fund’s income. Conversely, if interest rates increase and the loans underlying the securities are prepaid more slowly than expected, the time in which the securities are expected to be paid off could be extended. This may reduce the fund’s cash for potential reinvestment in higher yielding securities.
Thinly traded securities — There may be little trading in the secondary market for particular bonds or other debt securities, which may make them more difficult to value, acquire or sell.
Investing outside the U.S. — Securities of issuers domiciled outside the U.S., or with significant operations outside the U.S., may lose value because of adverse political, social, economic or market developments in the countries or regions in which the issuers operate. These securities may also lose value due to changes in foreign currency exchange rates against the U.S. dollar and/or currencies of other countries. Securities markets in certain countries may be more volatile and/or less liquid than those in the U.S. Investments outside the U.S. may also be subject to different settlement and accounting practices and different regulatory, legal and reporting standards, and may be more difficult to value, than those in the U.S. The risks of investing outside the U.S. may be heightened in connection with investments in emerging markets.
Management — The investment adviser to the fund actively manages the fund’s investments. Consequently, the fund is subject to the risk that the methods and analyses employed by the investment adviser in this process may not produce the desired results. This could cause the fund to lose value or its investment results to lag relevant benchmarks or other funds with similar objectives.
5. Taxation and distributions
Federal income taxation — The fund complies with the requirements under Subchapter M of the Internal Revenue Code applicable to mutual funds and intends to distribute substantially all of its net taxable income and net capital gains each year. The fund is not subject to income taxes to the extent such distributions are made. Therefore, no federal income tax provision is required.
As of and during the period ended June 30, 2013, the fund did not have a liability for any unrecognized tax benefits. The fund recognizes interest and penalties, if any, related to unrecognized tax benefits as income tax expense in the statement of operations. During the period, the fund did not incur any interest or penalties.
The fund is not subject to examination by U.S. federal tax authorities for tax years before 2009 and by state tax authorities for tax years before 2008.
Non-U.S. taxation — Dividend and interest income are recorded net of non-U.S. taxes paid.
Distributions — Distributions paid to shareholders are based on net investment income and net realized gains determined on a tax basis, which may differ from net investment income and net realized gains for financial reporting purposes. These differences are due primarily to different treatment for items such as currency gains and losses; short-term capital gains and losses; capital losses related to sales of certain securities within 30 days of purchase; cost of investments sold; paydowns on fixed-income securities and net capital losses. The fiscal year in which amounts are distributed may differ from the year in which the net investment income and net realized gains are recorded by the fund for financial reporting purposes.
The components of distributable earnings on a tax basis are reported as of the fund’s most recent year-end. As of December 31, 2012, the components of distributable earnings on a tax basis were as follows (dollars in thousands):
| Undistributed ordinary income | | $ | 83,372 | |
| Capital loss carryforward expiring 2017* | | | (1,810,298 | ) |
| * | The capital loss carryforward will be used to offset any capital gains realized by the fund in the current year or in subsequent years through the expiration date. The fund will not make distributions from capital gains while a capital loss carryforward remains. |
Under the Regulated Investment Company Modernization Act of 2010 (the “Act”), net capital losses recognized after December 31, 2010, may be carried forward indefinitely, and their character is retained as short-term and/or long-term losses. Previously, net capital losses were carried forward for eight years and treated as short-term losses. As a transition rule, the Act requires that post-enactment net capital losses be used before pre-enactment net capital losses.
As of June 30, 2013, the tax basis unrealized appreciation (depreciation) and cost of investment securities were as follows (dollars in thousands):
| Gross unrealized appreciation on investment securities | | $ | 16,031,840 | |
| Gross unrealized depreciation on investment securities | | | (953,860 | ) |
| Net unrealized appreciation on investment securities | | | 15,077,980 | |
| Cost of investment securities | | | 47,202,931 | |
Tax-basis distributions paid to shareholders from ordinary income were as follows (dollars in thousands):
| Share class | | Six months ended
June 30, 2013 | | | Year ended
December 31, 2012 | |
| Class A | | $ | 322,380 | | | $ | 641,065 | |
| Class B | | | 4,563 | | | | 15,571 | |
| Class C | | | 22,110 | | | | 49,332 | |
| Class F-1 | | | 15,244 | | | | 25,793 | |
| Class F-2 | | | 4,967 | | | | 7,506 | |
| Class 529-A | | | 18,903 | | | | 36,800 | |
| Class 529-B | | | 514 | | | | 1,576 | |
| Class 529-C | | | 3,334 | | | | 7,193 | |
| Class 529-E | | | 854 | | | | 1,725 | |
| Class 529-F-1 | | | 826 | | | | 1,528 | |
| Class R-1 | | | 670 | | | | 1,506 | |
| Class R-2 | | | 6,328 | | | | 13,722 | |
| Class R-3 | | | 20,426 | | | | 41,191 | |
| Class R-4 | | | 30,271 | | | | 50,016 | |
| Class R-5 | | | 22,390 | | | | 40,820 | |
| Class R-6 | | | 27,194 | | | | 42,000 | |
| Total | | $ | 500,974 | | | $ | 977,344 | |
6. Fees and transactions with related parties
CRMC, the fund’s investment adviser, is the parent company of American Funds Distributors,® Inc. (“AFD”), the principal underwriter of the fund’s shares, and American Funds Service Company® (“AFS”), the fund’s transfer agent. CRMC, AFD and AFS are considered related parties to the fund.
Investment advisory services — The fund has an investment advisory and service agreement with CRMC that provides for monthly fees accrued daily. These fees are based on a series of decreasing annual rates beginning with 0.420% on the first $500 million of daily net assets and decreasing to 0.210% on such assets in excess of $71 billion. For the six months ended June 30, 2013, the investment advisory services fee was $70,994,000, which was equivalent to an annualized rate of 0.237% of average daily net assets.
Class-specific fees and expenses — Expenses that are specific to individual share classes are accrued directly to the respective share class. The principal class-specific fees and expenses are described below:
| | Distribution services — The fund has plans of distribution for all share classes, except Class F-2, R-5 and R-6 shares. Under the plans, the board of trustees approves certain categories of expenses that are used to finance activities primarily intended to sell fund shares and service existing accounts. The plans provide for payments, |
| | based on an annualized percentage of average daily net assets, ranging from 0.25% to 1.00% as noted below. In some cases, the board of trustees has limited the amounts that may be paid to less than the maximum allowed by the plans. All share classes with a plan may use up to 0.25% of average daily net assets to pay service fees, or to compensate AFD for paying service fees, to firms that have entered into agreements with AFD to provide certain shareholder services. The remaining amounts available to be paid under each plan are paid to dealers to compensate them for their sales activities. |
| | |
| | For Class A and 529-A shares, distribution-related expenses include the reimbursement of dealer and wholesaler commissions paid by AFD for certain shares sold without a sales charge. These share classes reimburse AFD for amounts billed within the prior 15 months but only to the extent that the overall annual expense limit of 0.25% is not exceeded. As of June 30, 2013, there were no unreimbursed expenses subject to reimbursement for Class A or 529-A shares. |
| | Share class | | Currently approved limits | | Plan limits |
| | Class A | | | 0.25 | % | | | 0.25 | % |
| | Class 529-A | | | 0.25 | | | | 0.50 | |
| | Classes B and 529-B | | | 1.00 | | | | 1.00 | |
| | Classes C, 529-C and R-1 | | | 1.00 | | | | 1.00 | |
| | Class R-2 | | | 0.75 | | | | 1.00 | |
| | Classes 529-E and R-3 | | | 0.50 | | | | 0.75 | |
| | Classes F-1, 529-F-1 and R-4 | | | 0.25 | | | | 0.50 | |
| | Transfer agent services — The fund has a shareholder services agreement with AFS under which the fund compensates AFS for providing transfer agent services to each of the fund’s share classes. These services include recordkeeping, shareholder communications and transaction processing. In addition, the fund reimburses AFS for amounts paid to third parties for performing transfer agent services on behalf of fund shareholders. |
| | |
| | Administrative services — The fund has an administrative services agreement with CRMC under which the fund compensates CRMC for providing administrative services to Class A, C, F, 529 and R shares. These services include, but are not limited to, coordinating, monitoring, assisting and overseeing third parties that provide services to fund shareholders. Under the agreement, Class A shares pay an annual fee of 0.01% and Class C, F, 529 and R shares pay an annual fee of 0.05% of their respective average daily net assets. |
| | |
| | 529 plan services — Each 529 share class is subject to service fees to compensate the Commonwealth of Virginia for the maintenance of the 529 college savings plan. The quarterly fee is based on a series of decreasing annual rates beginning with 0.10% on the first $30 billion of the net assets invested in Class 529 shares of the American Funds and decreasing to 0.06% on such assets between $120 billion and $150 billion. |
| | The fee for any given calendar quarter is accrued and calculated on the basis of the average net assets of Class 529 shares of the American Funds for the last month of the prior calendar quarter. The fee is included in other expenses on the accompanying financial statements. The Commonwealth of Virginia is not considered a related party. |
| | |
| | For the six months ended June 30, 2013, class-specific expenses under the agreements were as follows (dollars in thousands): |
| | Share class | | Distribution
services | | Transfer agent
services | | Administrative
services | | 529 plan
services |
| | Class A | | | $44,160 | | | | $23,015 | | | | $1,828 | | | Not applicable |
| | Class B | | | 5,097 | | | | 681 | | | | Not applicable | | | Not applicable |
| | Class C | | | 22,792 | | | | 2,833 | | | | 1,143 | | | Not applicable |
| | Class F-1 | | | 2,126 | | | | 953 | | | | 426 | | | Not applicable |
| | Class F-2 | | | Not applicable | | | | 305 | | | | 122 | | | Not applicable |
| | Class 529-A | | | 2,496 | | | | 1,065 | | | | 562 | | | $1,104 |
| | Class 529-B | | | 634 | | | | 69 | | | | 32 | | | 63 |
| | Class 529-C | | | 3,667 | | | | 369 | | | | 184 | | | 363 |
| | Class 529-E | | | 296 | | | | 39 | | | | 30 | | | 58 |
| | Class 529-F-1 | | | — | | | | 42 | | | | 22 | | | 43 |
| | Class R-1 | | | 668 | | | | 68 | | | | 33 | | | Not applicable |
| | Class R-2 | | | 4,497 | | | | 1,835 | | | | 303 | | | Not applicable |
| | Class R-3 | | | 6,996 | | | | 2,110 | | | | 703 | | | Not applicable |
| | Class R-4 | | | 4,268 | | | | 1,695 | | | | 855 | | | Not applicable |
| | Class R-5 | | | Not applicable | | | | 543 | | | | 549 | | | Not applicable |
| | Class R-6 | | | Not applicable | | | | 7 | | | | 636 | | | Not applicable |
| | Total class-specific expenses | | | $97,697 | | | | $35,629 | | | | $7,428 | | | $1,631 |
Trustees’ deferred compensation — Trustees who are unaffiliated with CRMC may elect to defer the cash payment of part or all of their compensation. These deferred amounts, which remain as liabilities of the fund, are treated as if invested in shares of the fund or other American Funds. These amounts represent general, unsecured liabilities of the fund and vary according to the total returns of the selected funds. Trustees’ compensation of $589,000, shown on the accompanying financial statements, includes $236,000 in current fees (either paid in cash or deferred) and a net increase of $353,000 in the value of the deferred amounts.
Affiliated officers and trustees — Officers and certain trustees of the fund are or may be considered to be affiliated with CRMC, AFD and AFS. No affiliated officers or trustees received any compensation directly from the fund.
7. Capital share transactions
Capital share transactions in the fund were as follows (dollars and shares in thousands):
| | | Sales* | | | Reinvestments
of dividends | | | Repurchases* | | | Net increase
(decrease) | |
| Share class | | Amount | | | Shares | | | Amount | | | Shares | | | Amount | | | Shares | | | Amount | | | Shares | |
| | | | | | | | | | | | | | | | | | | | | | | | | | | | | | | | | |
| Six months ended June 30, 2013 | | | | | | | | | | | | | | |
| | | | | | | | | | | | | | | | | | | | | | | | | | | | | | | | | |
| Class A | | $ | 2,777,622 | | | | 127,765 | | | $ | 315,243 | | | | 14,367 | | | $ | (2,361,533 | ) | | | (108,649 | ) | | $ | 731,332 | | | | 33,483 | |
| Class B | | | 14,036 | | | | 650 | | | | 4,508 | | | | 206 | | | | (313,898 | ) | | | (14,487 | ) | | | (295,354 | ) | | | (13,631 | ) |
| Class C | | | 469,400 | | | | 21,674 | | | | 21,515 | | | | 985 | | | | (488,226 | ) | | | (22,515 | ) | | | 2,689 | | | | 144 | |
| Class F-1 | | | 404,725 | | | | 18,532 | | | | 14,893 | | | | 678 | | | | (157,889 | ) | | | (7,259 | ) | | | 261,729 | | | | 11,951 | |
| Class F-2 | | | 145,489 | | | | 6,658 | | | | 4,357 | | | | 198 | | | | (40,244 | ) | | | (1,849 | ) | | | 109,602 | | | | 5,007 | |
| Class 529-A | | | 177,079 | | | | 8,172 | | | | 18,900 | | | | 862 | | | | (136,422 | ) | | | (6,308 | ) | | | 59,557 | | | | 2,726 | |
| Class 529-B | | | 2,079 | | | | 96 | | | | 514 | | | | 24 | | | | (28,195 | ) | | | (1,299 | ) | | | (25,602 | ) | | | (1,179 | ) |
| Class 529-C | | | 61,705 | | | | 2,853 | | | | 3,332 | | | | 152 | | | | (52,649 | ) | | | (2,441 | ) | | | 12,388 | | | | 564 | |
| Class 529-E | | | 9,241 | | | | 426 | | | | 854 | | | | 39 | | | | (8,295 | ) | | | (384 | ) | | | 1,800 | | | | 81 | |
| Class 529-F-1 | | | 10,184 | | | | 467 | | | | 826 | | | | 38 | | | | (10,348 | ) | | | (479 | ) | | | 662 | | | | 26 | |
| Class R-1 | | | 27,998 | | | | 1,314 | | | | 667 | | | | 31 | | | | (20,541 | ) | | | (957 | ) | | | 8,124 | | | | 388 | |
| Class R-2 | | | 169,281 | | | | 7,841 | | | | 6,324 | | | | 290 | | | | (195,616 | ) | | | (9,072 | ) | | | (20,011 | ) | | | (941 | ) |
| Class R-3 | | | 393,998 | | | | 18,287 | | | | 20,410 | | | | 934 | | | | (367,604 | ) | | | (16,996 | ) | | | 46,804 | | | | 2,225 | |
| Class R-4 | | | 727,550 | | | | 33,808 | | | | 30,269 | | | | 1,381 | | | | (436,941 | ) | | | (20,071 | ) | | | 320,878 | | | | 15,118 | |
| Class R-5 | | | 268,243 | | | | 12,377 | | | | 22,388 | | | | 1,020 | | | | (257,426 | ) | | | (11,863 | ) | | | 33,205 | | | | 1,534 | |
| Class R-6 | | | 597,135 | | | | 27,554 | | | | 27,194 | | | | 1,239 | | | | (145,768 | ) | | | (6,686 | ) | | | 478,561 | | | | 22,107 | |
Total net increase
(decrease) | | $ | 6,255,765 | | | | 288,474 | | | $ | 492,194 | | | | 22,444 | | | $ | (5,021,595 | ) | | | (231,315 | ) | | $ | 1,726,364 | | | | 79,603 | |
| | | | | | | | | | | | | | | | | | | | | | | | | | | | | | | | | |
| Year ended December 31, 2012 | | | | | | | | | | | | | | |
| Class A | | $ | 4,502,559 | | | | 229,859 | | | $ | 625,483 | | | | 31,607 | | | $ | (5,268,947 | ) | | | (268,065 | ) | | $ | (140,905 | ) | | | (6,599 | ) |
| Class B | | | 39,307 | | | | 2,022 | | | | 15,320 | | | | 779 | | | | (849,109 | ) | | | (43,720 | ) | | | (794,482 | ) | | | (40,919 | ) |
| Class C | | | 578,325 | | | | 29,628 | | | | 47,737 | | | | 2,424 | | | | (1,029,078 | ) | | | (52,881 | ) | | | (403,016 | ) | | | (20,829 | ) |
| Class F-1 | | | 617,641 | | | | 31,605 | | | | 25,155 | | | | 1,270 | | | | (295,386 | ) | | | (15,008 | ) | | | 347,410 | | | | 17,867 | |
| Class F-2 | | | 158,930 | | | | 8,048 | | | | 6,627 | | | | 334 | | | | (60,218 | ) | | | (3,069 | ) | | | 105,339 | | | | 5,313 | |
| Class 529-A | | | 361,529 | | | | 18,494 | | | | 36,792 | | | | 1,861 | | | | (265,372 | ) | | | (13,499 | ) | | | 132,949 | | | | 6,856 | |
| Class 529-B | | | 7,203 | | | | 371 | | | | 1,576 | | | | 80 | | | | (72,927 | ) | | | (3,741 | ) | | | (64,148 | ) | | | (3,290 | ) |
| Class 529-C | | | 120,563 | | | | 6,172 | | | | 7,190 | | | | 364 | | | | (113,974 | ) | | | (5,819 | ) | | | 13,779 | | | | 717 | |
| Class 529-E | | | 18,181 | | | | 928 | | | | 1,725 | | | | 87 | | | | (18,106 | ) | | | (922 | ) | | | 1,800 | | | | 93 | |
| Class 529-F-1 | | | 24,921 | | | | 1,272 | | | | 1,528 | | | | 77 | | | | (13,584 | ) | | | (691 | ) | | | 12,865 | | | | 658 | |
| Class R-1 | | | 30,006 | | | | 1,542 | | | | 1,501 | | | | 76 | | | | (51,190 | ) | | | (2,611 | ) | | | (19,683 | ) | | | (993 | ) |
| Class R-2 | | | 313,814 | | | | 16,118 | | | | 13,712 | | | | 697 | | | | (376,195 | ) | | | (19,303 | ) | | | (48,669 | ) | | | (2,488 | ) |
| Class R-3 | | | 708,104 | | | | 36,294 | | | | 41,160 | | | | 2,087 | | | | (744,628 | ) | | | (38,062 | ) | | | 4,636 | | | | 319 | |
| Class R-4 | | | 1,214,962 | | | | 61,671 | | | | 50,012 | | | | 2,526 | | | | (687,947 | ) | | | (34,977 | ) | | | 577,027 | | | | 29,220 | |
| Class R-5 | | | 674,969 | | | | 34,246 | | | | 40,816 | | | | 2,058 | | | | (408,465 | ) | | | (20,625 | ) | | | 307,320 | | | | 15,679 | |
| Class R-6 | | | 646,120 | | | | 32,698 | | | | 42,000 | | | | 2,119 | | | | (216,707 | ) | | | (10,974 | ) | | | 471,413 | | | | 23,843 | |
Total net increase
(decrease) | | $ | 10,017,134 | | | | 510,968 | | | $ | 958,334 | | | | 48,446 | | | $ | (10,471,833 | ) | | | (533,967 | ) | | $ | 503,635 | | | | 25,447 | |
* Includes exchanges between share classes of the fund.
8. Investment transactions
The fund made purchases and sales of investment securities, excluding short-term securities and U.S. government obligations, if any, of $15,338,346,000 and $14,933,128,000, respectively, during the six months ended June 30, 2013.
Financial highlights
| | | | | | | | | Income (loss) from investment operations1 | |
| | | | | Net asset
value,
beginning
of period | | | Net
investment
income2 | | | Net gains (losses)
on securities
(both realized
and unrealized) | | | Total from
investment
operations | |
| Class A: | | Six months ended 6/30/20135,6 | $ | 20.40 | | | $ | .17 | | | $ | 1.70 | | | $ | 1.87 | |
| | | Year ended 12/31/2012 | | | 18.21 | | | | .38 | | | | 2.19 | | | | 2.57 | |
| | | Year ended 12/31/2011 | | | 17.93 | | | | .36 | | | | .32 | | | | .68 | |
| | | Year ended 12/31/2010 | | | 16.21 | | | | .40 | | | | 1.68 | | | | 2.08 | |
| | | Year ended 12/31/2009 | | | 13.78 | | | | .40 | | | | 2.44 | | | | 2.84 | |
| | | Year ended 12/31/2008 | | | 19.31 | | | | .50 | | | | (5.35 | ) | | | (4.85 | ) |
| Class B: | | Six months ended 6/30/20135,6 | | 20.35 | | | | .09 | | | | 1.69 | | | | 1.78 | |
| | | Year ended 12/31/2012 | | | 18.16 | | | | .23 | | | | 2.19 | | | | 2.42 | |
| | | Year ended 12/31/2011 | | | 17.87 | | | | .22 | | | | .33 | | | | .55 | |
| | | Year ended 12/31/2010 | | | 16.16 | | | | .28 | | | | 1.66 | | | | 1.94 | |
| | | Year ended 12/31/2009 | | | 13.73 | | | | .29 | | | | 2.44 | | | | 2.73 | |
| | | Year ended 12/31/2008 | | | 19.25 | | | | .37 | | | | (5.34 | ) | | | (4.97 | ) |
| Class C: | | Six months ended 6/30/20135,6 | | 20.31 | | | | .09 | | | | 1.68 | | | | 1.77 | |
| | | Year ended 12/31/2012 | | | 18.13 | | | | .22 | | | | 2.18 | | | | 2.40 | |
| | | Year ended 12/31/2011 | | | 17.85 | | | | .21 | | | | .32 | | | | .53 | |
| | | Year ended 12/31/2010 | | | 16.14 | | | | .27 | | | | 1.67 | | | | 1.94 | |
| | | Year ended 12/31/2009 | | | 13.72 | | | | .29 | | | | 2.43 | | | | 2.72 | |
| | | Year ended 12/31/2008 | | | 19.23 | | | | .36 | | | | (5.33 | ) | | | (4.97 | ) |
| Class F-1: | | Six months ended 6/30/20135,6 | | 20.39 | | | | .17 | | | | 1.70 | | | | 1.87 | |
| | | Year ended 12/31/2012 | | | 18.21 | | | | .38 | | | | 2.18 | | | | 2.56 | |
| | | Year ended 12/31/2011 | | | 17.92 | | | | .36 | | | | .33 | | | | .69 | |
| | | Year ended 12/31/2010 | | | 16.21 | | | | .40 | | | | 1.67 | | | | 2.07 | |
| | | Year ended 12/31/2009 | | | 13.78 | | | | .41 | | | | 2.44 | | | | 2.85 | |
| | | Year ended 12/31/2008 | | | 19.31 | | | | .50 | | | | (5.35 | ) | | | (4.85 | ) |
| Class F-2: | | Six months ended 6/30/20135,6 | | 20.39 | | | | .19 | | | | 1.70 | | | | 1.89 | |
| | | Year ended 12/31/2012 | | | 18.21 | | | | .43 | | | | 2.18 | | | | 2.61 | |
| | | Year ended 12/31/2011 | | | 17.92 | | | | .40 | | | | .33 | | | | .73 | |
| | | Year ended 12/31/2010 | | | 16.21 | | | | .44 | | | | 1.67 | | | | 2.11 | |
| | | Year ended 12/31/2009 | | | 13.78 | | | | .43 | | | | 2.45 | | | | 2.88 | |
| | | Period from 8/5/2008 to 12/31/20085 | | 17.44 | | | | .21 | | | | (3.59 | ) | | | (3.38 | ) |
| Dividends and distributions | | | | | | | | | | | | | | | | | | | |
| | Dividends
(from net
investment
income) | | | | Distributions
(from capital
gains) | | | | Total
dividends
and
distributions | | | | Net asset
value, end
of period | | | | Total
return3,4 | | | | Net assets,
end of period
(in millions) | | | | Ratio of
expenses to
average net
assets before
waivers | | | | Ratio of
expenses to
average net
assets after
waivers4 | | | | Ratio
of net
income to
average
net assets2,4 | |
| $ | (.19 | ) | | $ | — | | | $ | (.19 | ) | | $ | 22.08 | | | | 9.18 | % | | $ | 37,828 | | | | .62 | %7 | | | .62 | %7 | | | 1.59 | %7 |
| | (.38 | ) | | | — | | | | (.38 | ) | | | 20.40 | | | | 14.19 | | | | 34,272 | | | | .63 | | | | .63 | | | | 1.94 | |
| | (.40 | ) | | | — | | | | (.40 | ) | | | 18.21 | | | | 3.82 | | | | 30,716 | | | | .62 | | | | .62 | | | | 1.97 | |
| | (.36 | ) | | | — | | | | (.36 | ) | | | 17.93 | | | | 13.02 | | | | 31,409 | | | | .63 | | | | .63 | | | | 2.42 | |
| | (.41 | ) | | | — | | | | (.41 | ) | | | 16.21 | | | | 21.08 | | | | 29,675 | | | | .67 | | | | .67 | | | | 2.80 | |
| | (.54 | ) | | | (.14 | ) | | | (.68 | ) | | | 13.78 | | | | (25.73 | ) | | | 26,972 | | | | .61 | | | | .59 | | | | 2.96 | |
| | (.10 | ) | | | — | | | | (.10 | ) | | | 22.03 | | | | 8.76 | | | | 916 | | | | 1.38 | 7 | | | 1.38 | 7 | | | .82 | 7 |
| | (.23 | ) | | | — | | | | (.23 | ) | | | 20.35 | | | | 13.35 | | | | 1,123 | | | | 1.38 | | | | 1.38 | | | | 1.17 | |
| | (.26 | ) | | | — | | | | (.26 | ) | | | 18.16 | | | | 3.08 | | | | 1,745 | | | | 1.38 | | | | 1.38 | | | | 1.21 | |
| | (.23 | ) | | | — | | | | (.23 | ) | | | 17.87 | | | | 12.12 | | | | 2,573 | | | | 1.38 | | | | 1.38 | | | | 1.66 | |
| | (.30 | ) | | | — | | | | (.30 | ) | | | 16.16 | | | | 20.24 | | | | 3,305 | | | | 1.43 | | | | 1.43 | | | | 2.06 | |
| | (.41 | ) | | | (.14 | ) | | | (.55 | ) | | | 13.73 | | | | (26.33 | ) | | | 3,455 | | | | 1.38 | | | | 1.35 | | | | 2.18 | |
| | (.10 | ) | | | — | | | | (.10 | ) | | | 21.98 | | | | 8.74 | | | | 4,693 | | | | 1.42 | 7 | | | 1.42 | 7 | | | .80 | 7 |
| | (.22 | ) | | | — | | | | (.22 | ) | | | 20.31 | | | | 13.30 | | | | 4,334 | | | | 1.42 | | | | 1.42 | | | | 1.14 | |
| | (.25 | ) | | | — | | | | (.25 | ) | | | 18.13 | | | | 3.00 | | | | 4,247 | | | | 1.42 | | | | 1.42 | | | | 1.17 | |
| | (.23 | ) | | | — | | | | (.23 | ) | | | 17.85 | | | | 12.11 | | | | 4,576 | | | | 1.43 | | | | 1.43 | | | | 1.61 | |
| | (.30 | ) | | | — | | | | (.30 | ) | | | 16.14 | | | | 20.16 | | | | 4,429 | | | | 1.45 | | | | 1.45 | | | | 2.02 | |
| | (.40 | ) | | | (.14 | ) | | | (.54 | ) | | | 13.72 | | | | (26.33 | ) | | | 4,128 | | | | 1.42 | | | | 1.40 | | | | 2.14 | |
| | (.19 | ) | | | — | | | | (.19 | ) | | | 22.07 | | | | 9.17 | | | | 1,887 | | | | .66 | 7 | | | .66 | 7 | | | 1.57 | 7 |
| | (.38 | ) | | | — | | | | (.38 | ) | | | 20.39 | | | | 14.13 | | | | 1,500 | | | | .64 | | | | .64 | | | | 1.94 | |
| | (.40 | ) | | | — | | | | (.40 | ) | | | 18.21 | | | | 3.87 | | | | 1,014 | | | | .63 | | | | .63 | | | | 1.96 | |
| | (.36 | ) | | | — | | | | (.36 | ) | | | 17.92 | | | | 12.95 | | | | 895 | | | | .63 | | | | .63 | | | | 2.41 | |
| | (.42 | ) | | | — | | | | (.42 | ) | | | 16.21 | | | | 21.13 | | | | 885 | | | | .64 | | | | .64 | | | | 2.85 | |
| | (.54 | ) | | | (.14 | ) | | | (.68 | ) | | | 13.78 | | | | (25.73 | ) | | | 946 | | | | .61 | | | | .58 | | | | 2.96 | |
| | (.21 | ) | | | — | | | | (.21 | ) | | | 22.07 | | | | 9.29 | | | | 564 | | | | .42 | 7 | | | .42 | 7 | | | 1.80 | 7 |
| | (.43 | ) | | | — | | | | (.43 | ) | | | 20.39 | | | | 14.40 | | | | 419 | | | | .40 | | | | .40 | | | | 2.18 | |
| | (.44 | ) | | | — | | | | (.44 | ) | | | 18.21 | | | | 4.12 | | | | 277 | | | | .40 | | | | .40 | | | | 2.19 | |
| | (.40 | ) | | | — | | | | (.40 | ) | | | 17.92 | | | | 13.21 | | | | 228 | | | | .40 | | | | .40 | | | | 2.63 | |
| | (.45 | ) | | | — | | | | (.45 | ) | | | 16.21 | | | | 21.41 | | | | 164 | | | | .41 | | | | .41 | | | | 2.87 | |
| | (.28 | ) | | | — | | | | (.28 | ) | | | 13.78 | | | | (19.51 | ) | | | 39 | | | | .17 | | | | .16 | | | | 1.45 | |
See page 30 for footnotes.
Financial highlights (continued)
| | | | | | | | Income (loss) from investment operations1 | |
| | | | | Net asset
value,
beginning
of period | | | Net
investment
income2 | | | Net gains (losses)
on securities
(both realized
and unrealized) | | | Total from
investment
operations | |
| Class 529-A: | | Six months ended 6/30/20135,6 | | $ | 20.38 | | | $ | .16 | | | $ | 1.69 | | | $ | 1.85 | |
| | | Year ended 12/31/2012 | | | 18.19 | | | | .36 | | | | 2.19 | | | | 2.55 | |
| | | Year ended 12/31/2011 | | | 17.91 | | | | .34 | | | | .33 | | | | .67 | |
| | | Year ended 12/31/2010 | | | 16.19 | | | | .39 | | | | 1.68 | | | | 2.07 | |
| | | Year ended 12/31/2009 | | | 13.77 | | | | .39 | | | | 2.43 | | | | 2.82 | |
| | | Year ended 12/31/2008 | | | 19.29 | | | | .49 | | | | (5.34 | ) | | | (4.85 | ) |
| Class 529-B: | | Six months ended 6/30/20135,6 | | | 20.39 | | | | .08 | | | | 1.69 | | | | 1.77 | |
| | | Year ended 12/31/2012 | | | 18.19 | | | | .21 | | | | 2.19 | | | | 2.40 | |
| | | Year ended 12/31/2011 | | | 17.90 | | | | .20 | | | | .33 | | | | .53 | |
| | | Year ended 12/31/2010 | | | 16.19 | | | | .26 | | | | 1.66 | | | | 1.92 | |
| | | Year ended 12/31/2009 | | | 13.76 | | | | .28 | | | | 2.44 | | | | 2.72 | |
| | | Year ended 12/31/2008 | | | 19.28 | | | | .35 | | | | (5.34 | ) | | | (4.99 | ) |
| Class 529-C: | | Six months ended 6/30/20135,6 | | | 20.37 | | | | .08 | | | | 1.69 | | | | 1.77 | |
| | | Year ended 12/31/2012 | | | 18.19 | | | | .21 | | | | 2.18 | | | | 2.39 | |
| | | Year ended 12/31/2011 | | | 17.90 | | | | .20 | | | | .33 | | | | .53 | |
| | | Year ended 12/31/2010 | | | 16.19 | | | | .26 | | | | 1.67 | | | | 1.93 | |
| | | Year ended 12/31/2009 | | | 13.76 | | | | .28 | | | | 2.44 | | | | 2.72 | |
| | | Year ended 12/31/2008 | | | 19.29 | | | | .35 | | | | (5.35 | ) | | | (5.00 | ) |
| Class 529-E: | | Six months ended 6/30/20135,6 | | | 20.37 | | | | .14 | | | | 1.68 | | | | 1.82 | |
| | | Year ended 12/31/2012 | | | 18.18 | | | | .31 | | | | 2.19 | | | | 2.50 | |
| | | Year ended 12/31/2011 | | | 17.90 | | | | .30 | | | | .32 | | | | .62 | |
| | | Year ended 12/31/2010 | | | 16.19 | | | | .35 | | | | 1.66 | | | | 2.01 | |
| | | Year ended 12/31/2009 | | | 13.76 | | | | .35 | | | | 2.44 | | | | 2.79 | |
| | | Year ended 12/31/2008 | | | 19.28 | | | | .44 | | | | (5.34 | ) | | | (4.90 | ) |
| Class 529-F-1: | | Six months ended 6/30/20135,6 | | | 20.36 | | | | .19 | | | | 1.69 | | | | 1.88 | |
| | | Year ended 12/31/2012 | | | 18.18 | | | | .41 | | | | 2.18 | | | | 2.59 | |
| | | Year ended 12/31/2011 | | | 17.90 | | | | .38 | | | | .33 | | | | .71 | |
| | | Year ended 12/31/2010 | | | 16.19 | | | | .43 | | | | 1.67 | | | | 2.10 | |
| | | Year ended 12/31/2009 | | | 13.76 | | | | .42 | | | | 2.44 | | | | 2.86 | |
| | | Year ended 12/31/2008 | | | 19.28 | | | | .52 | | | | (5.34 | ) | | | (4.82 | ) |
| Dividends and distributions | | | | | | | | | | | | | | | | | | | |
Dividends
(from net
investment
income) | | | Distributions
(from capital
gains) | | | Total
dividends
and
distributions | | | Net asset
value, end
of period | | | Total
return3,4 | | | Net assets,
end of period
(in millions) | | | Ratio of
expenses to
average net
assets before
waivers | | | Ratio of
expenses to
average net
assets after
waivers4 | | | Ratio
of net
income to
average
net assets2,4 | |
| $ | (.18 | ) | | $ | — | | | $ | (.18 | ) | | $ | 22.05 | | | | 9.09 | % | | $ | 2,334 | | | | .71 | %7 | | | .71 | %7 | | | 1.51 | %7 |
| | (.36 | ) | | | — | | | | (.36 | ) | | | 20.38 | | | | 14.12 | | | | 2,101 | | | | .71 | | | | .71 | | | | 1.86 | |
| | (.39 | ) | | | — | | | | (.39 | ) | | | 18.19 | | | | 3.75 | | | | 1,751 | | | | .70 | | | | .70 | | | | 1.89 | |
| | (.35 | ) | | | — | | | | (.35 | ) | | | 17.91 | | | | 12.97 | | | | 1,589 | | | | .69 | | | | .69 | | | | 2.35 | |
| | (.40 | ) | | | — | | | | (.40 | ) | | | 16.19 | | | | 20.97 | | | | 1,291 | | | | .73 | | | | .73 | | | | 2.73 | |
| | (.53 | ) | | | (.14 | ) | | | (.67 | ) | | | 13.77 | | | | (25.76 | ) | | | 1,030 | | | | .68 | | | | .65 | | | | 2.90 | |
| | (.09 | ) | | | — | | | | (.09 | ) | | | 22.07 | | | | 8.69 | | | | 120 | | | | 1.49 | 7 | | | 1.49 | 7 | | | .71 | 7 |
| | (.20 | ) | | | — | | | | (.20 | ) | | | 20.39 | | | | 13.24 | | | | 134 | | | | 1.50 | | | | 1.50 | | | | 1.05 | |
| | (.24 | ) | | | — | | | | (.24 | ) | | | 18.19 | | | | 2.95 | | | | 180 | | | | 1.49 | | | | 1.49 | | | | 1.09 | |
| | (.21 | ) | | | — | | | | (.21 | ) | | | 17.90 | | | | 11.99 | | | | 244 | | | | 1.48 | | | | 1.48 | | | | 1.56 | |
| | (.29 | ) | | | — | | | | (.29 | ) | | | 16.19 | | | | 20.09 | | | | 284 | | | | 1.53 | | | | 1.53 | | | | 1.95 | |
| | (.39 | ) | | | (.14 | ) | | | (.53 | ) | | | 13.76 | | | | (26.36 | ) | | | 251 | | | | 1.48 | | | | 1.46 | | | | 2.09 | |
| | (.10 | ) | | | — | | | | (.10 | ) | | | 22.04 | | | | 8.68 | | | | 764 | | | | 1.49 | 7 | | | 1.49 | 7 | | | .73 | 7 |
| | (.21 | ) | | | — | | | | (.21 | ) | | | 20.37 | | | | 13.19 | | | | 694 | | | | 1.49 | | | | 1.49 | | | | 1.08 | |
| | (.24 | ) | | | — | | | | (.24 | ) | | | 18.19 | | | | 3.00 | | | | 607 | | | | 1.48 | | | | 1.48 | | | | 1.11 | |
| | (.22 | ) | | | — | | | | (.22 | ) | | | 17.90 | | | | 12.03 | | | | 583 | | | | 1.48 | | | | 1.48 | | | | 1.57 | |
| | (.29 | ) | | | — | | | | (.29 | ) | | | 16.19 | | | | 20.10 | | | | 507 | | | | 1.52 | | | | 1.52 | | | | 1.94 | |
| | (.39 | ) | | | (.14 | ) | | | (.53 | ) | | | 13.76 | | | | (26.40 | ) | | | 420 | | | | 1.48 | | | | 1.45 | | | | 2.09 | |
| | (.15 | ) | | | — | | | | (.15 | ) | | | 22.04 | | | | 8.96 | | | | 123 | | | | .96 | 7 | | | .96 | 7 | | | 1.26 | 7 |
| | (.31 | ) | | | — | | | | (.31 | ) | | | 20.37 | | | | 13.84 | | | | 112 | | | | .97 | | | | .97 | | | | 1.60 | |
| | (.34 | ) | | | — | | | | (.34 | ) | | | 18.18 | | | | 3.47 | | | | 98 | | | | .97 | | | | .97 | | | | 1.62 | |
| | (.30 | ) | | | — | | | | (.30 | ) | | | 17.90 | | | | 12.59 | | | | 92 | | | | .97 | | | | .97 | | | | 2.07 | |
| | (.36 | ) | | | — | | | | (.36 | ) | | | 16.19 | | | | 20.71 | | | | 80 | | | | 1.02 | | | | 1.02 | | | | 2.45 | |
| | (.48 | ) | | | (.14 | ) | | | (.62 | ) | | | 13.76 | | | | (25.99 | ) | | | 65 | | | | .97 | | | | .95 | | | | 2.60 | |
| | (.20 | ) | | | — | | | | (.20 | ) | | | 22.04 | | | | 9.26 | | | | 89 | | | | .49 | 7 | | | .49 | 7 | | | 1.73 | 7 |
| | (.41 | ) | | | — | | | | (.41 | ) | | | 20.36 | | | | 14.32 | | | | 82 | | | | .49 | | | | .49 | | | | 2.09 | |
| | (.43 | ) | | | — | | | | (.43 | ) | | | 18.18 | | | | 3.98 | | | | 61 | | | | .48 | | | | .48 | | | | 2.11 | |
| | (.39 | ) | | | — | | | | (.39 | ) | | | 17.90 | | | | 13.15 | | | | 57 | | | | .47 | | | | .47 | | | | 2.57 | |
| | (.43 | ) | | | — | | | | (.43 | ) | | | 16.19 | | | | 21.31 | | | | 42 | | | | .52 | | | | .52 | | | | 2.93 | |
| | (.56 | ) | | | (.14 | ) | | | (.70 | ) | | | 13.76 | | | | (25.61 | ) | | | 31 | | | | .47 | | | | .45 | | | | 3.11 | |
See page 30 for footnotes.
Financial highlights (continued)
| | | | | | | | Income (loss) from investment operations1 | |
| | | | | Net asset
value,
beginning
of period | | | Net
investment
income2 | | | Net gains (losses)
on securities
(both realized
and unrealized) | | | Total from
investment
operations | |
| Class R-1: | | Six months ended 6/30/20135,6 | | $ | 20.29 | | | $ | .09 | | | $ | 1.69 | | | $ | 1.78 | |
| | | Year ended 12/31/2012 | | | 18.12 | | | | .23 | | | | 2.17 | | | | 2.40 | |
| | | Year ended 12/31/2011 | | | 17.83 | | | | .22 | | | | .33 | | | | .55 | |
| | | Year ended 12/31/2010 | | | 16.13 | | | | .27 | | | | 1.66 | | | | 1.93 | |
| | | Year ended 12/31/2009 | | | 13.71 | | | | .29 | | | | 2.43 | | | | 2.72 | |
| | | Year ended 12/31/2008 | | | 19.22 | | | | .37 | | | | (5.33 | ) | | | (4.96 | ) |
| Class R-2: | | Six months ended 6/30/20135,6 | | | 20.30 | | | | .09 | | | | 1.69 | | | | 1.78 | |
| | | Year ended 12/31/2012 | | | 18.13 | | | | .23 | | | | 2.18 | | | | 2.41 | |
| | | Year ended 12/31/2011 | | | 17.85 | | | | .22 | | | | .32 | | | | .54 | |
| | | Year ended 12/31/2010 | | | 16.14 | | | | .27 | | | | 1.67 | | | | 1.94 | |
| | | Year ended 12/31/2009 | | | 13.72 | | | | .29 | | | | 2.43 | | | | 2.72 | |
| | | Year ended 12/31/2008 | | | 19.23 | | | | .36 | | | | (5.33 | ) | | | (4.97 | ) |
| Class R-3: | | Six months ended 6/30/20135,6 | | | 20.32 | | | | .14 | | | | 1.69 | | | | 1.83 | |
| | | Year ended 12/31/2012 | | | 18.14 | | | | .32 | | | | 2.18 | | | | 2.50 | |
| | | Year ended 12/31/2011 | | | 17.86 | | | | .30 | | | | .32 | | | | .62 | |
| | | Year ended 12/31/2010 | | | 16.15 | | | | .35 | | | | 1.67 | | | | 2.02 | |
| | | Year ended 12/31/2009 | | | 13.73 | | | | .36 | | | | 2.43 | | | | 2.79 | |
| | | Year ended 12/31/2008 | | | 19.24 | | | | .45 | | | | (5.33 | ) | | | (4.88 | ) |
| Class R-4: | | Six months ended 6/30/20135,6 | | | 20.37 | | | | .17 | | | | 1.70 | | | | 1.87 | |
| | | Year ended 12/31/2012 | | | 18.19 | | | | .38 | | | | 2.18 | | | | 2.56 | |
| | | Year ended 12/31/2011 | | | 17.91 | | | | .35 | | | | .33 | | | | .68 | |
| | | Year ended 12/31/2010 | | | 16.19 | | | | .40 | | | | 1.68 | | | | 2.08 | |
| | | Year ended 12/31/2009 | | | 13.76 | | | | .40 | | | | 2.44 | | | | 2.84 | |
| | | Year ended 12/31/2008 | | | 19.28 | | | | .49 | | | | (5.34 | ) | | | (4.85 | ) |
| Class R-5: | | Six months ended 6/30/20135,6 | | | 20.41 | | | | .20 | | | | 1.70 | | | | 1.90 | |
| | | Year ended 12/31/2012 | | | 18.22 | | | | .44 | | | | 2.19 | | | | 2.63 | |
| | | Year ended 12/31/2011 | | | 17.94 | | | | .41 | | | | .32 | | | | .73 | |
| | | Year ended 12/31/2010 | | | 16.22 | | | | .45 | | | | 1.68 | | | | 2.13 | |
| | | Year ended 12/31/2009 | | | 13.79 | | | | .45 | | | | 2.43 | | | | 2.88 | |
| | | Year ended 12/31/2008 | | | 19.32 | | | | .54 | | | | (5.35 | ) | | | (4.81 | ) |
| Class R-6: | | Six months ended 6/30/20135,6 | | | 20.40 | | | | .21 | | | | 1.70 | | | | 1.91 | |
| | | Year ended 12/31/2012 | | | 18.21 | | | | .45 | | | | 2.19 | | | | 2.64 | |
| | | Year ended 12/31/2011 | | | 17.93 | | | | .42 | | | | .32 | | | | .74 | |
| | | Year ended 12/31/2010 | | | 16.21 | | | | .46 | | | | 1.67 | | | | 2.13 | |
| | | Period from 5/1/2009 to 12/31/20095 | | | 13.64 | | | | .30 | | | | 2.61 | | | | 2.91 | |
| Dividends and distributions | | | | | | | | | | | | | | | | | | | |
Dividends
(from net
investment
income) | | | Distributions
(from capital
gains) | | | Total
dividends
and
distributions | | | Net asset
value, end
of period | | | Total
return4 | | | Net assets,
end of period
(in millions) | | | Ratio of
expenses to
average net
assets before
waivers | | | Ratio of
expenses to
average net
assets after
waivers4 | | | Ratio
of net
income to
average
net assets2,4 | |
| $ | (.11 | ) | | $ | — | | | $ | (.11 | ) | | $ | 21.96 | | | | 8.76 | % | | $ | 139 | | | | 1.39 | %7 | | | 1.39 | %7 | | | .82 | %7 |
| | (.23 | ) | | | — | | | | (.23 | ) | | | 20.29 | | | | 13.28 | | | | 121 | | | | 1.40 | | | | 1.40 | | | | 1.16 | |
| | (.26 | ) | | | — | | | | (.26 | ) | | | 18.12 | | | | 3.09 | | | | 126 | | | | 1.40 | | | | 1.40 | | | | 1.19 | |
| | (.23 | ) | | | — | | | | (.23 | ) | | | 17.83 | | | | 12.10 | | | | 135 | | | | 1.40 | | | | 1.40 | | | | 1.65 | |
| | (.30 | ) | | | — | | | | (.30 | ) | | | 16.13 | | | | 20.22 | | | | 120 | | | | 1.43 | | | | 1.43 | | | | 2.03 | |
| | (.41 | ) | | | (.14 | ) | | | (.55 | ) | | | 13.71 | | | | (26.30 | ) | | | 89 | | | | 1.38 | | | | 1.35 | | | | 2.21 | |
| | (.11 | ) | | | — | | | | (.11 | ) | | | 21.97 | | | | 8.78 | | | | 1,232 | | | | 1.34 | 7 | | | 1.34 | 7 | | | .87 | 7 |
| | (.24 | ) | | | — | | | | (.24 | ) | | | 20.30 | | | | 13.31 | | | | 1,158 | | | | 1.37 | | | | 1.37 | | | | 1.20 | |
| | (.26 | ) | | | — | | | | (.26 | ) | | | 18.13 | | | | 3.05 | | | | 1,079 | | | | 1.38 | | | | 1.38 | | | | 1.21 | |
| | (.23 | ) | | | — | | | | (.23 | ) | | | 17.85 | | | | 12.14 | | | | 1,128 | | | | 1.40 | | | | 1.40 | | | | 1.64 | |
| | (.30 | ) | | | — | | | | (.30 | ) | | | 16.14 | | | | 20.14 | | | | 1,054 | | | | 1.47 | | | | 1.47 | | | | 1.99 | |
| | (.40 | ) | | | (.14 | ) | | | (.54 | ) | | | 13.72 | | | | (26.33 | ) | | | 855 | | | | 1.42 | | | | 1.39 | | | | 2.15 | |
| | (.16 | ) | | | — | | | | (.16 | ) | | | 21.99 | | | | 8.99 | | | | 2,881 | | | | .94 | 7 | | | .94 | 7 | | | 1.27 | 7 |
| | (.32 | ) | | | — | | | | (.32 | ) | | | 20.32 | | | | 13.83 | | | | 2,617 | | | | .95 | | | | .95 | | | | 1.62 | |
| | (.34 | ) | | | — | | | | (.34 | ) | | | 18.14 | | | | 3.50 | | | | 2,331 | | | | .95 | | | | .95 | | | | 1.64 | |
| | (.31 | ) | | | — | | | | (.31 | ) | | | 17.86 | | | | 12.64 | | | | 2,408 | | | | .94 | | | | .94 | | | | 2.10 | |
| | (.37 | ) | | | — | | | | (.37 | ) | | | 16.15 | | | | 20.73 | | | | 2,326 | | | | .97 | | | | .97 | | | | 2.49 | |
| | (.49 | ) | | | (.14 | ) | | | (.63 | ) | | | 13.73 | | | | (25.94 | ) | | | 1,959 | | | | .90 | | | | .87 | | | | 2.65 | |
| | (.19 | ) | | | — | | | | (.19 | ) | | | 22.05 | | | | 9.18 | | | | 3,586 | | | | .65 | 7 | | | .65 | 7 | | | 1.58 | 7 |
| | (.38 | ) | | | — | | | | (.38 | ) | | | 20.37 | | | | 14.14 | | | | 3,006 | | | | .64 | | | | .64 | | | | 1.94 | |
| | (.40 | ) | | | — | | | | (.40 | ) | | | 18.19 | | | | 3.80 | | | | 2,152 | | | | .65 | | | | .65 | | | | 1.94 | |
| | (.36 | ) | | | — | | | | (.36 | ) | | | 17.91 | | | | 13.01 | | | | 2,007 | | | | .65 | | | | .65 | | | | 2.39 | |
| | (.41 | ) | | | — | | | | (.41 | ) | | | 16.19 | | | | 21.09 | | | | 1,736 | | | | .67 | | | | .67 | | | | 2.75 | |
| | (.53 | ) | | | (.14 | ) | | | (.67 | ) | | | 13.76 | | | | (25.75 | ) | | | 1,395 | | | | .65 | | | | .62 | | | | 2.92 | |
| | (.22 | ) | | | — | | | | (.22 | ) | | | 22.09 | | | | 9.32 | | | | 2,252 | | | | .35 | 7 | | | .35 | 7 | | | 1.87 | 7 |
| | (.44 | ) | | | — | | | | (.44 | ) | | | 20.41 | | | | 14.51 | | | | 2,050 | | | | .35 | | | | .35 | | | | 2.23 | |
| | (.45 | ) | | | — | | | | (.45 | ) | | | 18.22 | | | | 4.11 | | | | 1,544 | | | | .35 | | | | .35 | | | | 2.24 | |
| | (.41 | ) | | | — | | | | (.41 | ) | | | 17.94 | | | | 13.32 | | | | 1,545 | | | | .35 | | | | .35 | | | | 2.69 | |
| | (.45 | ) | | | — | | | | (.45 | ) | | | 16.22 | | | | 21.44 | | | | 1,332 | | | | .37 | | | | .37 | | | | 3.19 | |
| | (.58 | ) | | | (.14 | ) | | | (.72 | ) | | | 13.79 | | | | (25.52 | ) | | | 1,418 | | | | .35 | | | | .33 | | | | 3.28 | |
| | (.23 | ) | | | — | | | | (.23 | ) | | | 22.08 | | | | 9.35 | | | | 2,816 | | | | .30 | 7 | | | .30 | 7 | | | 1.93 | 7 |
| | (.45 | ) | | | — | | | | (.45 | ) | | | 20.40 | | | | 14.57 | | | | 2,151 | | | | .30 | | | | .30 | | | | 2.28 | |
| | (.46 | ) | | | — | | | | (.46 | ) | | | 18.21 | | | | 4.16 | | | | 1,486 | | | | .30 | | | | .30 | | | | 2.30 | |
| | (.41 | ) | | | — | | | | (.41 | ) | | | 17.93 | | | | 13.38 | | | | 1,063 | | | | .30 | | | | .30 | | | | 2.75 | |
| | (.34 | ) | | | — | | | | (.34 | ) | | | 16.21 | | | | 21.52 | | | | 590 | | | | .33 | 7 | | | .33 | 7 | | | 2.94 | 7 |
See page 30 for footnotes.
Financial highlights (continued)
| | | Six months
ended
June 30, | | Year ended December 31 |
| | | 20135,6 | | 2012 | 2011 | | 2010 | | 2009 | | 2008 |
| Portfolio turnover rate for all share classes | | | 29 | % | | | 54 | % | | | 47 | % | | | 37 | % | | | 46 | % | | | 41 | % |
| 1 | Based on average shares outstanding. |
| 2 | For the year ended December 31, 2010, this column reflects the impact of a corporate action event that resulted in a one-time increase to net investment income. If the corporate action event had not occurred, the Class A net investment income per share and ratio of net income to average net assets would have been lower by $.04 and .25 percentage points, respectively. The impact to the other share classes would have been similar. |
| 3 | Total returns exclude any applicable sales charges, including contingent deferred sales charges. |
| 4 | This column reflects the impact, if any, of certain waivers from CRMC. During some of the periods shown, CRMC reduced fees for investment advisory services. |
| 5 | Based on operations for the period shown and, accordingly, is not representative of a full year. |
| 6 | Unaudited. |
| 7 | Annualized. |
See Notes to Financial Statements
As a shareholder of the fund, you incur two types of costs: (1) transaction costs, such as initial sales charges on purchase payments and contingent deferred sales charges on redemptions (loads), and (2) ongoing costs, including management fees, distribution and service (12b-1) fees, and other expenses. This example is intended to help you understand your ongoing costs (in dollars) of investing in the fund so you can compare these costs with the ongoing costs of investing in other mutual funds. The example is based on an investment of $1,000 invested at the beginning of the period and held for the entire six-month period (January 1, 2013, through June 30, 2013).
Actual expenses:
The first line of each share class in the table on page 33 provides information about actual account values and actual expenses. You may use the information in this line, together with the amount you invested, to estimate the expenses that you paid over the period. Simply divide your account value by $1,000 (for example, an $8,600 account value divided by $1,000 = 8.6), then multiply the result by the number in the first line under the heading entitled “Expenses paid during period” to estimate the expenses you paid on your account during this period.
Hypothetical example for comparison purposes:
The second line of each share class in the table on page 33 provides information about hypothetical account values and hypothetical expenses based on the actual expense ratio for the share class and an assumed rate of return of 5.00% per year before expenses, which is not the actual return of the share class. The hypothetical account values and expenses may not be used to estimate the actual ending account balance or expenses you paid for the period. You may use this information to compare the ongoing costs of investing in the fund and other funds. To do so, compare this 5.00% hypothetical example with the 5.00% hypothetical examples that appear in the shareholder reports of the other funds.
Notes:
There are some account fees that are charged to certain types of accounts, such as individual retirement accounts and 529 college savings plan accounts (generally, a $10 fee is charged to set up the account and an additional $10 fee is charged to the account annually), that would increase the amount of expenses paid on your account. In addition, retirement plan participants may be subject to certain fees charged by the plan sponsor, and Class F-1, F-2 and 529-F-1 shareholders may be subject to fees charged by financial intermediaries, typically ranging from 0.75% to 1.50% of assets annually depending on services offered. You can estimate the impact of these fees by adding the amount of the fees to the total estimated expenses you paid on your account during the period as calculated above. In addition, your ending account value would be lower by the amount of these fees.
Note that the expenses shown in the table are meant to highlight your ongoing costs only and do not reflect any transactional costs, such as sales charges (loads). Therefore, the second line of each share class in the table is useful in comparing ongoing costs only and will not help you determine the relative total costs of owning different funds. In addition, if these transactional costs were included, your costs would have been higher.
| | | | Beginning
account value
1/1/2013 | | | | Ending
account value
6/30/2013 | | | | Expenses
paid during
period* | | | | Annualized
expense ratio | |
| Class A — actual return | | $ | 1,000.00 | | | $ | 1,091.77 | | | $ | 3.22 | | | | .62 | % |
| Class A — assumed 5% return | | | 1,000.00 | | | | 1,021.72 | | | | 3.11 | | | | .62 | |
| Class B — actual return | | | 1,000.00 | | | | 1,087.58 | | | | 7.14 | | | | 1.38 | |
| Class B — assumed 5% return | | | 1,000.00 | | | | 1,017.95 | | | | 6.90 | | | | 1.38 | |
| Class C — actual return | | | 1,000.00 | | | | 1,087.39 | | | | 7.35 | | | | 1.42 | |
| Class C — assumed 5% return | | | 1,000.00 | | | | 1,017.75 | | | | 7.10 | | | | 1.42 | |
| Class F-1 — actual return | | | 1,000.00 | | | | 1,091.67 | | | | 3.42 | | | | .66 | |
| Class F-1 — assumed 5% return | | | 1,000.00 | | | | 1,021.52 | | | | 3.31 | | | | .66 | |
| Class F-2 — actual return | | | 1,000.00 | | | | 1,092.91 | | | | 2.18 | | | | .42 | |
| Class F-2 — assumed 5% return | | | 1,000.00 | | | | 1,022.71 | | | | 2.11 | | | | .42 | |
| Class 529-A — actual return | | | 1,000.00 | | | | 1,090.90 | | | | 3.68 | | | | .71 | |
| Class 529-A — assumed 5% return | | | 1,000.00 | | | | 1,021.27 | | | | 3.56 | | | | .71 | |
| Class 529-B — actual return | | | 1,000.00 | | | | 1,086.86 | | | | 7.71 | | | | 1.49 | |
| Class 529-B — assumed 5% return | | | 1,000.00 | | | | 1,017.41 | | | | 7.45 | | | | 1.49 | |
| Class 529-C — actual return | | | 1,000.00 | | | | 1,086.79 | | | | 7.71 | | | | 1.49 | |
| Class 529-C — assumed 5% return | | | 1,000.00 | | | | 1,017.41 | | | | 7.45 | | | | 1.49 | |
| Class 529-E — actual return | | | 1,000.00 | | | | 1,089.61 | | | | 4.97 | | | | .96 | |
| Class 529-E — assumed 5% return | | | 1,000.00 | | | | 1,020.03 | | | | 4.81 | | | | .96 | |
| Class 529-F-1 — actual return | | | 1,000.00 | | | | 1,092.63 | | | | 2.54 | | | | .49 | |
| Class 529-F-1 — assumed 5% return | | | 1,000.00 | | | | 1,022.36 | | | | 2.46 | | | | .49 | |
| Class R-1 — actual return | | | 1,000.00 | | | | 1,087.63 | | | | 7.19 | | | | 1.39 | |
| Class R-1 — assumed 5% return | | | 1,000.00 | | | | 1,017.90 | | | | 6.95 | | | | 1.39 | |
| Class R-2 — actual return | | | 1,000.00 | | | | 1,087.84 | | | | 6.94 | | | | 1.34 | |
| Class R-2 — assumed 5% return | | | 1,000.00 | | | | 1,018.15 | | | | 6.71 | | | | 1.34 | |
| Class R-3 — actual return | | | 1,000.00 | | | | 1,089.93 | | | | 4.87 | | | | .94 | |
| Class R-3 — assumed 5% return | | | 1,000.00 | | | | 1,020.13 | | | | 4.71 | | | | .94 | |
| Class R-4 — actual return | | | 1,000.00 | | | | 1,091.81 | | | | 3.37 | | | | .65 | |
| Class R-4 — assumed 5% return | | | 1,000.00 | | | | 1,021.57 | | | | 3.26 | | | | .65 | |
| Class R-5 — actual return | | | 1,000.00 | | | | 1,093.19 | | | | 1.82 | | | | .35 | |
| Class R-5 — assumed 5% return | | | 1,000.00 | | | | 1,023.06 | | | | 1.76 | | | | .35 | |
| Class R-6 — actual return | | | 1,000.00 | | | | 1,093.51 | | | | 1.56 | | | | .30 | |
| Class R-6 — assumed 5% return | | | 1,000.00 | | | | 1,023.31 | | | | 1.51 | | | | .30 | |
| * | The “expenses paid during period” are equal to the “annualized expense ratio,” multiplied by the average account value over the period, multiplied by the number of days in the period, and divided by 365 (to reflect the one-half year period). |
Office of the fund
One Market
Steuart Tower, Suite 2000
Mailing address: P.O. Box 7650
San Francisco, CA 94120-7650
Investment adviser
Capital Research and Management Company
333 South Hope Street
Los Angeles, CA 90071-1406
6455 Irvine Center Drive
Irvine, CA 92618
Custodian of assets
JPMorgan Chase Bank
270 Park Avenue
New York, NY 10017-2070
Counsel
Bingham McCutchen LLP
355 South Grand Avenue, Suite 4400
Los Angeles, CA 90071-3106
Transfer agent for shareholder accounts
American Funds Service Company
(Write to the address near you.)
P.O. Box 6007
Indianapolis, IN 46206-6007
P.O. Box 2280
Norfolk, VA 23501-2280
Independent registered public accounting firm
Deloitte & Touche LLP
695 Town Center Drive
Suite 1200
Costa Mesa, CA 92626-7188
Principal underwriter
American Funds Distributors, Inc.
333 South Hope Street
Los Angeles, CA 90071-1406
Investors should carefully consider investment objectives, risks, charges and expenses. This and other important information is contained in the fund prospectus and summary prospectus, which can be obtained from your financial professional and should be read carefully before investing. You may also call American Funds Service Company (AFS) at (800) 421-4225 or visit the American Funds website at americanfunds.com.
“American Funds Proxy Voting Procedures and Principles” — which describes how we vote proxies relating to portfolio securities — is available on the American Funds website or upon request by calling AFS. The fund files its proxy voting record with the U.S. Securities and Exchange Commission (SEC) for the 12 months ended June 30 by August 31. The proxy voting record is available free of charge on the SEC website at sec.gov and on the American Funds website.
A complete June 30, 2013, portfolio of American Balanced Fund’s investments is available free of charge by calling AFS or visiting the SEC website (where it is part of Form N-CSR).
American Balanced Fund files a complete list of its portfolio holdings with the SEC for the first and third quarters of each fiscal year on Form N-Q. This filing is available free of charge on the SEC website. You may also review or, for a fee, copy this filing at the SEC’s Public Reference Room in Washington, D.C. Additional information regarding the operation of the Public Reference Room may be obtained by calling the SEC’s Office of Investor Education and Advocacy at (800) SEC-0330. Additionally, the list of portfolio holdings is available by calling AFS.
This report is for the information of shareholders of American Balanced Fund, but it also may be used as sales literature when preceded or accompanied by the current prospectus or summary prospectus, which gives details about charges, expenses, investment objectives and operating policies of the fund. If used as sales material after September 30, 2013, this report must be accompanied by an American Funds statistical update for the most recently completed calendar quarter.
This page intentionally left blank.
This page intentionally left blank.
The American Funds Advantage
Since 1931, American Funds, part of Capital Group, has helped investors pursue long-term investment success. Our consistent approach — in combination with The Capital SystemSM — has resulted in a superior long-term track record.
| | Aligned with investor success |
| | We base our decisions on a long-term perspective, which we believe aligns our goals with the interests of our clients. Our portfolio managers average 25 years of investment experience, including 20 years at our company, reflecting a career commitment to our long-term approach.1 |
| | |
| | The Capital SystemSM |
| | Our investment process, The Capital System, combines individual accountability with teamwork. Each fund is divided into portions that are managed independently by investment professionals with diverse backgrounds, ages and investment approaches. An extensive global research effort is the backbone of our system. |
| | |
| | Superior long-term track record |
| | Our equity funds have beaten their Lipper peer indexes in 90% of 10-year periods and 96% of 20-year periods. Our fixed-income funds have beaten their Lipper indexes in 58% of 10-year periods and 63% of 20-year periods.2 Our fund management fees have been among the lowest in the industry.3 |
| | 1 | Portfolio manager experience as of December 31, 2012. |
| | 2 | Based on Class A share results for rolling periods through December 31, 2012. Periods covered are the shorter of the fund’s lifetime or since the comparable Lipper index inception date. |
| | 3 | Based on management fees for the 20-year period ended December 31, 2012, versus comparable Lipper categories, excluding funds of funds. |
| | American Funds span a range of investment objectives |
| ¢ | Growth funds |
| | AMCAP Fund® |
| | EuroPacific Growth Fund® |
| | The Growth Fund of America® |
| | The New Economy Fund® |
| | New Perspective Fund® |
| | New World Fund® |
| | SMALLCAP World Fund® |
| ¢ | Growth-and-income funds |
| | American Mutual Fund® |
| | Capital World Growth and Income Fund® |
| | Fundamental Investors® |
| | International Growth and Income FundSM |
| | The Investment Company of America® |
| | Washington Mutual Investors FundSM |
| ¢ | Equity-income funds |
| | Capital Income Builder® |
| | The Income Fund of America® |
| ¢ | Balanced funds |
| | American Balanced Fund® |
| | American Funds Global Balanced FundSM |
| ¢ | Bond funds |
| | American Funds Mortgage Fund® |
| | American High-Income Trust® |
| | The Bond Fund of America® |
| | Capital World Bond Fund® |
| | Intermediate Bond Fund of America® |
| | Short-Term Bond Fund of America® |
| | U.S. Government Securities Fund® |
| ¢ | Tax-exempt bond funds |
| | American Funds Short-Term Tax-Exempt Bond Fund® |
| | American High-Income Municipal Bond Fund® |
| | Limited Term Tax-Exempt Bond Fund of America® |
| | The Tax-Exempt Bond Fund of America® |
| | State-specific tax-exempt funds |
| | American Funds Tax-Exempt Fund of New York® |
| | The Tax-Exempt Fund of California® |
| | The Tax-Exempt Fund of Maryland® |
| | The Tax-Exempt Fund of Virginia® |
| ¢ | Money market fund |
| | American Funds Money Market Fund® |
| ¢ | American Funds Portfolio SeriesSM |
| | American Funds Global Growth PortfolioSM |
| | American Funds Growth PortfolioSM |
| | American Funds Growth and Income PortfolioSM |
| | American Funds Balanced PortfolioSM |
| | American Funds Income PortfolioSM |
| | American Funds Tax-Advantaged Income PortfolioSM |
| | American Funds Preservation PortfolioSM |
| | American Funds Tax-Exempt Preservation PortfolioSM |
| ¢ | American Funds Target Date Retirement Series® |
| ¢ | American Funds College Target Date SeriesSM |

ITEM 2 – Code of Ethics
Not applicable for filing of semi-annual reports to shareholders.
ITEM 3 – Audit Committee Financial Expert
Not applicable for filing of semi-annual reports to shareholders.
ITEM 4 – Principal Accountant Fees and Services
Not applicable for filing of semi-annual reports to shareholders.
ITEM 5 – Audit Committee of Listed Registrants
Not applicable to this Registrant, insofar as the Registrant is not a listed issuer as defined in Rule 10A-3 under the Securities Exchange Act of 1934.
ITEM 6 – Schedule of Investments
 | American Balanced Fund® Investment portfolio June 30, 2013 |
unaudited
| Common stocks 72.40% | | |
| | | Value |
| Financials 14.26% | Shares | (000) |
| | | |
| Wells Fargo & Co. | 33,215,000 | $ 1,370,783 |
| Berkshire Hathaway Inc., Class A1 | 8,000 | 1,348,800 |
| American Express Co. | 16,224,000 | 1,212,906 |
| Goldman Sachs Group, Inc. | 6,481,700 | 980,357 |
| ACE Ltd. | 5,650,000 | 505,562 |
| JPMorgan Chase & Co. | 9,121,000 | 481,498 |
| Citigroup Inc. | 9,500,000 | 455,715 |
| Weyerhaeuser Co.1 | 12,815,242 | 365,106 |
| SunTrust Banks, Inc. | 9,500,000 | 299,915 |
| Moody’s Corp. | 4,400,000 | 268,092 |
| BlackRock, Inc. | 1,000,000 | 256,850 |
| American Tower Corp. | 3,350,000 | 245,120 |
| U.S. Bancorp | 6,090,000 | 220,153 |
| Arch Capital Group Ltd.1 | 3,890,000 | 199,985 |
| Allstate Corp. | 2,250,000 | 108,270 |
| Bank of America Corp. | 8,000,000 | 102,880 |
| Prologis, Inc. | 2,300,000 | 86,756 |
| Chubb Corp. | 1,000,000 | 84,650 |
| HDFC Bank Ltd. (ADR) | 2,200,000 | 79,728 |
| Progressive Corp. | 3,130,000 | 79,565 |
| DDR Corp. | 3,992,800 | 66,480 |
| T. Rowe Price Group, Inc. | 720,000 | 52,668 |
| | | 8,871,839 |
| Consumer discretionary 10.58% | | |
| | | |
| Home Depot, Inc. | 25,925,000 | 2,008,410 |
| Amazon.com, Inc.1 | 5,168,000 | 1,435,102 |
| Comcast Corp., Class A | 20,310,000 | 850,583 |
| Walt Disney Co. | 7,000,000 | 442,050 |
| VF Corp. | 1,750,000 | 337,855 |
| Time Warner Inc. | 5,000,000 | 289,100 |
| General Motors Co.1 | 7,500,000 | 249,825 |
| DIRECTV1 | 3,580,000 | 220,599 |
| Las Vegas Sands Corp. | 3,221,423 | 170,510 |
| Macy’s, Inc. | 3,500,000 | 168,000 |
| Starbucks Corp. | 2,500,000 | 163,725 |
| NIKE, Inc., Class B | 2,554,442 | 162,667 |
| Johnson Controls, Inc. | 2,445,000 | 87,506 |
| | | 6,585,932 |
| Industrials 10.26% | | |
| | | |
| Boeing Co. | 15,525,000 | 1,590,381 |
| Union Pacific Corp. | 7,793,187 | 1,202,333 |
| Lockheed Martin Corp. | 6,392,037 | 693,280 |
| General Electric Co. | 29,600,000 | 686,424 |
| Common stocks | | |
| | | Value |
| Industrials (continued) | Shares | (000) |
| | | |
| Deere & Co. | 5,640,000 | $ 458,250 |
| Parker-Hannifin Corp. | 4,100,000 | 391,140 |
| United Technologies Corp. | 3,630,000 | 337,372 |
| Cummins Inc. | 2,695,000 | 292,300 |
| Honeywell International Inc. | 2,100,000 | 166,614 |
| General Dynamics Corp. | 1,865,000 | 146,086 |
| Canadian Pacific Railway Ltd. | 1,200,000 | 145,513 |
| Northrop Grumman Corp. | 1,250,000 | 103,500 |
| Rockwell Collins, Inc. | 1,400,000 | 88,774 |
| Emerson Electric Co. | 1,495,000 | 81,537 |
| | | 6,383,504 |
| Health care 7.58% | | |
| | | |
| Merck & Co., Inc. | 23,540,000 | 1,093,433 |
| Bristol-Myers Squibb Co. | 17,676,149 | 789,947 |
| UnitedHealth Group Inc. | 9,295,000 | 608,637 |
| Gilead Sciences, Inc.1 | 10,268,100 | 525,829 |
| Pfizer Inc. | 18,550,000 | 519,585 |
| Baxter International Inc. | 5,610,000 | 388,605 |
| Johnson & Johnson | 4,100,000 | 352,026 |
| Roche Holding AG | 800,000 | 199,037 |
| Quest Diagnostics Inc. | 3,250,000 | 197,047 |
| Teva Pharmaceutical Industries Ltd. (ADR) | 1,100,000 | 43,120 |
| | | 4,717,266 |
| Information technology 7.40% | | |
| | | |
| Microsoft Corp. | 29,740,000 | 1,026,922 |
| Taiwan Semiconductor Manufacturing Co. Ltd. (ADR) | 45,100,000 | 826,232 |
| Texas Instruments Inc. | 23,605,000 | 823,106 |
| ASML Holding NV (New York registered) | 3,812,080 | 301,535 |
| ASML Holding NV | 1,470,405 | 116,024 |
| Google Inc., Class A1 | 415,000 | 365,354 |
| TE Connectivity Ltd. | 6,360,000 | 289,634 |
| Maxim Integrated Products, Inc. | 9,420,000 | 261,688 |
| Oracle Corp. | 5,077,591 | 155,984 |
| Paychex, Inc. | 4,227,000 | 154,370 |
| Avago Technologies Ltd. | 3,380,772 | 126,373 |
| Analog Devices, Inc. | 2,000,000 | 90,120 |
| EMC Corp. | 3,000,000 | 70,860 |
| | | 4,608,202 |
| Consumer staples 7.06% | | |
| | | |
| Philip Morris International Inc. | 11,300,000 | 978,806 |
| PepsiCo, Inc. | 9,853,357 | 805,906 |
| Procter & Gamble Co. | 8,730,000 | 672,123 |
| Costco Wholesale Corp. | 5,677,326 | 627,742 |
| Nestlé SA | 7,470,000 | 489,933 |
| Nestlé SA (ADR) | 1,000,000 | 65,780 |
| Kimberly-Clark Corp. | 2,795,000 | 271,506 |
| Wal-Mart Stores, Inc. | 2,100,000 | 156,429 |
| Unilever NV (New York registered) | 3,635,000 | 142,892 |
| Coca-Cola Co. | 2,580,000 | 103,484 |
| Colgate-Palmolive Co. | 1,400,000 | 80,206 |
| | | 4,394,807 |
| Common stocks | | |
| | | Value |
| Energy 6.95% | Shares | (000) |
| | | |
| Chevron Corp. | 11,687,000 | $ 1,383,040 |
| Royal Dutch Shell PLC, Class B (ADR) | 8,958,000 | 593,647 |
| Transocean Ltd. | 6,500,000 | 311,675 |
| Enbridge Inc. | 6,600,000 | 277,662 |
| Occidental Petroleum Corp. | 3,000,000 | 267,690 |
| ConocoPhillips | 4,000,000 | 242,000 |
| Kinder Morgan, Inc. | 5,980,000 | 228,137 |
| Southwestern Energy Co.1 | 5,895,000 | 215,344 |
| Concho Resources Inc.1 | 2,180,000 | 182,510 |
| Baker Hughes Inc. | 3,000,000 | 138,390 |
| Petróleo Brasileiro SA — Petrobras, ordinary nominative (ADR) | 7,825,000 | 105,011 |
| Technip SA | 1,000,000 | 101,542 |
| Phillips 66 | 1,650,000 | 97,201 |
| Suncor Energy Inc. | 2,000,000 | 58,952 |
| Apache Corp. | 675,000 | 56,585 |
| TOTAL SA (ADR) | 800,000 | 38,960 |
| Cimarex Energy Co. | 373,900 | 24,300 |
| | | 4,322,646 |
| Materials 2.86% | | |
| | | |
| E.I. du Pont de Nemours and Co. | 6,750,000 | 354,375 |
| Dow Chemical Co. | 10,980,000 | 353,227 |
| Potash Corp. of Saskatchewan Inc. | 7,190,000 | 274,155 |
| Nucor Corp. | 4,000,000 | 173,280 |
| Mosaic Co. | 2,750,000 | 147,977 |
| Alcoa Inc. | 17,500,000 | 136,850 |
| Monsanto Co. | 1,300,000 | 128,440 |
| Cliffs Natural Resources Inc. | 4,908,000 | 79,755 |
| Steel Dynamics, Inc. | 5,179,668 | 77,229 |
| Praxair, Inc. | 480,000 | 55,277 |
| | | 1,780,565 |
| Utilities 1.24% | | |
| | | |
| PG&E Corp. | 6,810,000 | 311,421 |
| FirstEnergy Corp. | 4,560,000 | 170,271 |
| Duke Energy Corp. | 1,693,333 | 114,300 |
| Exelon Corp. | 3,250,000 | 100,360 |
| Edison International | 1,500,000 | 72,240 |
| | | 768,592 |
| Telecommunication services 0.51% | | |
| | | |
| AT&T Inc. | 5,420,000 | 191,868 |
| Verizon Communications Inc. | 2,500,000 | 125,850 |
| | | 317,718 |
| Miscellaneous 3.70% | | |
| | | |
| Other common stocks in initial period of acquisition | | 2,300,372 |
| Total common stocks (cost: $30,055,630,000) | | 45,051,443 |
| Bonds, notes & other debt instruments 22.95% | | |
| Corporate bonds & notes 8.19% | Principal amount | |
| Financials 2.54% | (000) | |
| | | |
| Goldman Sachs Group, Inc. 3.625% 2016 | $46,650 | 48,720 |
| Goldman Sachs Group, Inc. 2.375% 2018 | 36,000 | 35,371 |
| Goldman Sachs Group, Inc. 5.25% 2021 | 20,000 | 21,423 |
| Bonds, notes & other debt instruments | | |
| | Principal amount | Value |
| Corporate bonds & notes — Financials (continued) | (000) | (000) |
| | | |
| Goldman Sachs Group, Inc. 5.75% 2022 | $20,000 | $22,087 |
| Goldman Sachs Group, Inc. 3.625% 2023 | 19,430 | 18,616 |
| Westfield Group 5.75% 20152 | 16,250 | 17,761 |
| Westfield Group 5.70% 20162 | 30,520 | 34,126 |
| Westfield Group 7.125% 20182 | 15,750 | 18,704 |
| Westfield Group 4.625% 20212 | 25,000 | 26,404 |
| Bank of America Corp., Series L, 3.625% 2016 | 13,820 | 14,444 |
| Bank of America Corp. 3.75% 2016 | 21,955 | 23,028 |
| Bank of America Corp. 5.75% 2017 | 13,650 | 15,180 |
| Bank of America Corp. 5.625% 2020 | 15,500 | 17,082 |
| Bank of America Corp. 5.00% 2021 | 7,750 | 8,273 |
| Bank of America Corp. 3.30% 2023 | 5,185 | 4,908 |
| Citigroup Inc. 4.587% 2015 | 20,950 | 22,383 |
| Citigroup Inc. 3.953% 2016 | 13,050 | 13,763 |
| Citigroup Inc. 1.75% 2018 | 37,000 | 35,409 |
| Citigroup Inc. 8.50% 2019 | 8,416 | 10,613 |
| Morgan Stanley, Series F, 2.875% 2014 | 18,000 | 18,189 |
| Morgan Stanley 1.75% 2016 | 25,000 | 24,779 |
| Morgan Stanley 3.80% 2016 | 8,700 | 9,053 |
| Morgan Stanley 2.125% 2018 | 21,000 | 20,113 |
| JPMorgan Chase & Co. 3.45% 2016 | 15,000 | 15,654 |
| JPMorgan Chase & Co. 1.625% 2018 | 18,500 | 17,749 |
| JPMorgan Chase & Co. 1.80% 2018 | 16,000 | 15,489 |
| JPMorgan Chase & Co. 3.25% 2022 | 12,000 | 11,409 |
| Prologis, Inc. 5.625% 2015 | 10,425 | 11,296 |
| Prologis, Inc. 6.625% 2018 | 18,100 | 20,848 |
| Prologis, Inc. 6.625% 2019 | 2,851 | 3,289 |
| Prologis, Inc. 7.375% 2019 | 19,835 | 23,891 |
| Ford Motor Credit Co. 1.70% 2016 | 17,000 | 16,732 |
| Ford Motor Credit Co. 2.50% 2016 | 13,000 | 13,120 |
| Ford Motor Credit Co. 2.375% 2018 | 26,250 | 25,293 |
| Hospitality Properties Trust 6.30% 2016 | 12,631 | 13,741 |
| Hospitality Properties Trust 6.70% 2018 | 21,025 | 23,413 |
| Hospitality Properties Trust 4.50% 2023 | 16,130 | 15,600 |
| ERP Operating LP 5.375% 2016 | 25,000 | 27,883 |
| ERP Operating LP 4.75% 2020 | 12,000 | 12,920 |
| ERP Operating LP 3.00% 2023 | 9,595 | 8,831 |
| Wells Fargo & Co. 3.676% 2016 | 19,000 | 20,311 |
| Wells Fargo & Co. 4.60% 2021 | 25,000 | 27,274 |
| CNA Financial Corp. 5.85% 2014 | 25,000 | 26,601 |
| CNA Financial Corp. 6.50% 2016 | 16,000 | 18,136 |
| Kimco Realty Corp., Series C, 4.82% 2014 | 13,000 | 13,452 |
| Kimco Realty Corp., Series C, 5.783% 2016 | 14,000 | 15,473 |
| Kimco Realty Corp. 5.70% 2017 | 11,180 | 12,501 |
| Barclays Bank PLC 2.375% 2014 | 20,000 | 20,168 |
| Barclays Bank PLC 5.125% 2020 | 18,000 | 19,933 |
| ACE INA Holdings Inc. 5.875% 2014 | 20,000 | 20,951 |
| ACE INA Holdings Inc. 2.60% 2015 | 12,665 | 13,150 |
| Berkshire Hathaway Inc. 2.20% 2016 | 23,000 | 23,762 |
| Berkshire Hathaway Finance Corp. 1.30% 2018 | 10,195 | 9,867 |
| BNP Paribas 3.60% 2016 | 19,000 | 19,915 |
| BNP Paribas 5.00% 2021 | 12,750 | 13,572 |
| American International Group, Inc. 3.00% 2015 | 26,000 | 26,803 |
| American International Group, Inc. 4.875% 2016 | 6,000 | 6,576 |
| Bonds, notes & other debt instruments | | |
| | Principal amount | Value |
| Corporate bonds & notes — Financials (continued) | (000) | (000) |
| | | |
| Toyota Motor Credit Corp. 1.375% 2013 | $16,500 | $ 16,520 |
| Toyota Motor Credit Corp. 0.875% 2015 | 16,000 | 16,062 |
| Royal Bank of Scotland PLC 3.40% 2013 | 13,150 | 13,194 |
| Royal Bank of Scotland PLC 3.95% 2015 | 16,000 | 16,718 |
| Monumental Global Funding III 0.477% 20142,3 | 29,000 | 29,008 |
| Mack-Cali Realty Corp. 2.50% 2017 | 11,780 | 11,586 |
| Mack-Cali Realty Corp. 3.15% 2023 | 18,500 | 16,540 |
| American Express Co. 6.15% 2017 | 22,800 | 26,437 |
| Simon Property Group, LP 6.75% 2014 | 8,495 | 8,804 |
| Simon Property Group, LP 1.50% 20182 | 13,825 | 13,326 |
| Standard Chartered PLC 3.20% 20162 | 21,000 | 21,983 |
| Boston Properties, Inc. 3.70% 2018 | 20,000 | 21,022 |
| Bank of Nova Scotia 2.55% 2017 | 20,000 | 20,596 |
| US Bancorp., Series T, 1.65% 2017 | 19,500 | 19,452 |
| UBS AG 2.25% 2014 | 18,500 | 18,680 |
| Bank of New York Mellon Corp., Series G, 2.50% 2016 | 17,000 | 17,595 |
| ANZ National (International) Ltd. 3.125% 20152 | 16,500 | 17,163 |
| Nordea Bank AB 1.625% 20182 | 17,500 | 16,936 |
| QBE Insurance Group Ltd. 2.40% 20182 | 17,000 | 16,678 |
| MetLife Global Funding I 2.50% 20152 | 16,000 | 16,558 |
| BB&T Corp., Series C, 1.60% 2017 | 16,750 | 16,391 |
| HCP, Inc. 5.375% 2021 | 15,000 | 16,289 |
| Westpac Banking Corp. 3.00% 2015 | 15,300 | 16,017 |
| Prudential Holdings, LLC, Series C, 8.695% 20232,4 | 11,500 | 14,281 |
| Toronto-Dominion Bank 2.375% 2016 | 12,000 | 12,425 |
| Santander Issuances, SA Unipersonal 6.50% 20192,3 | 11,500 | 11,442 |
| AvalonBay Communities, Inc. 2.85% 2023 | 12,550 | 11,436 |
| Corporate Office Properties Trust 3.60% 20232 | 12,100 | 11,184 |
| American Tower Corp. 4.625% 2015 | 10,000 | 10,571 |
| Liberty Mutual Group Inc. 4.25% 20232 | 10,500 | 10,160 |
| Nationwide Mutual Insurance Co. 5.81% 20242,3 | 8,150 | 8,293 |
| AXA SA, Series B, junior subordinated 6.379% (undated)2,3 | 6,680 | 6,530 |
| Developers Diversified Realty Corp. 7.875% 2020 | 5,215 | 6,367 |
| PNC Financial Services Group, Inc. 2.854% 2022 | 5,975 | 5,458 |
| Regions Financial Corp. 7.75% 2014 | 3,664 | 3,961 |
| Brandywine Operating Partnership, LP 3.95% 2023 | 1,639 | 1,543 |
| | | 1,583,238 |
| Consumer staples 0.99% | | |
| | | |
| Anheuser-Busch InBev NV 3.625% 2015 | 36,500 | 38,340 |
| Anheuser-Busch InBev NV 4.125% 2015 | 16,500 | 17,341 |
| Anheuser-Busch InBev NV 1.375% 2017 | 16,000 | 15,758 |
| Anheuser-Busch InBev NV 7.75% 2019 | 20,000 | 25,316 |
| Altria Group, Inc. 9.25% 2019 | 5,067 | 6,716 |
| Altria Group, Inc. 2.95% 2023 | 22,775 | 21,126 |
| Altria Group, Inc. 9.95% 2038 | 13,500 | 20,055 |
| Altria Group, Inc. 4.25% 2042 | 20,000 | 17,153 |
| Altria Group, Inc. 4.50% 2043 | 8,570 | 7,659 |
| Kraft Foods Inc. 2.25% 2017 | 12,725 | 12,822 |
| Kraft Foods Inc. 5.375% 2020 | 10,472 | 11,824 |
| Kraft Foods Inc. 3.50% 2022 | 23,285 | 23,089 |
| Kraft Foods Inc. 6.50% 2040 | 20,000 | 23,968 |
| PepsiCo, Inc. 3.10% 2015 | 17,000 | 17,642 |
| PepsiCo, Inc. 2.50% 2016 | 15,000 | 15,616 |
| Bonds, notes & other debt instruments | | |
| | Principal amount | Value |
| Corporate bonds & notes — Consumer staples (continued) | (000) | (000) |
| | | |
| PepsiCo, Inc. 7.90% 2018 | $15,000 | $ 19,227 |
| SABMiller Holdings Inc. 2.45% 20172 | 20,245 | 20,578 |
| SABMiller Holdings Inc. 3.75% 20222 | 7,900 | 8,050 |
| SABMiller Holdings Inc. 4.95% 20422 | 16,430 | 16,418 |
| Wal-Mart Stores, Inc. 2.875% 2015 | 11,700 | 12,177 |
| Wal-Mart Stores, Inc. 2.80% 2016 | 25,000 | 26,292 |
| Coca-Cola Co. 1.50% 2015 | 18,970 | 19,360 |
| Coca-Cola Co. 1.80% 2016 | 17,500 | 17,885 |
| Pernod Ricard SA 2.95% 20172 | 35,500 | 36,344 |
| British American Tobacco International Finance PLC 2.125% 20172 | 16,000 | 16,058 |
| British American Tobacco International Finance PLC 9.50% 20182 | 11,955 | 16,029 |
| Imperial Tobacco Finance PLC 2.05% 20182 | 16,000 | 15,739 |
| Imperial Tobacco Finance PLC 3.50% 20232 | 17,000 | 16,005 |
| Kraft Foods Inc. 6.75% 2014 | 16,180 | 16,757 |
| Kraft Foods Inc. 5.375% 2020 | 9,528 | 10,698 |
| ConAgra Foods, Inc. 1.90% 2018 | 12,220 | 12,022 |
| ConAgra Foods, Inc. 3.20% 2023 | 6,800 | 6,512 |
| Philip Morris International Inc. 2.625% 2023 | 16,000 | 14,833 |
| Procter & Gamble Co. 1.45% 2016 | 13,460 | 13,635 |
| Reynolds American Inc. 3.25% 2022 | 11,420 | 10,631 |
| Wesfarmers Ltd. 1.874% 20182 | 8,000 | 7,866 |
| Heineken NV 1.40% 20172 | 7,485 | 7,277 |
| | | 614,818 |
| Industrials 0.86% | | |
| | | |
| General Electric Capital Corp. 0.91% 20143 | 50,000 | 50,230 |
| General Electric Co. 0.85% 2015 | 19,500 | 19,490 |
| General Electric Capital Corp. 1.00% 2015 | 13,700 | 13,686 |
| General Electric Capital Corp., Series A, 2.25% 2015 | 21,500 | 22,041 |
| General Electric Capital Corp. 2.95% 2016 | 9,305 | 9,703 |
| General Electric Capital Corp. 1.60% 2017 | 16,000 | 15,630 |
| General Electric Capital Corp. 2.30% 2017 | 26,100 | 26,476 |
| General Electric Capital Corp., Series A, 6.00% 2019 | 15,000 | 17,429 |
| General Electric Capital Corp. 3.10% 2023 | 34,000 | 32,164 |
| General Electric Co. 4.125% 2042 | 11,000 | 10,290 |
| United Technologies Corp. 1.80% 2017 | 8,435 | 8,471 |
| United Technologies Corp. 3.10% 2022 | 30,000 | 29,675 |
| United Technologies Corp. 4.50% 2042 | 30,460 | 30,191 |
| Burlington Northern Santa Fe LLC 7.00% 2014 | 31,850 | 32,993 |
| Burlington Northern Santa Fe LLC 4.10% 2021 | 7,000 | 7,392 |
| Burlington Northern Santa Fe LLC 3.00% 2023 | 21,300 | 20,327 |
| Union Pacific Corp. 5.75% 2017 | 4,325 | 4,997 |
| Union Pacific Corp. 5.70% 2018 | 29,150 | 33,990 |
| Continental Airlines, Inc., Series 1997-1, Class A, 7.461% 20164 | 1,581 | 1,632 |
| Continental Airlines, Inc., Series 1998-1, Class A, 6.648% 20194 | 5,285 | 5,559 |
| Continental Airlines, Inc., Series 1997-4, Class A, 6.90% 20194 | 3,485 | 3,719 |
| Continental Airlines, Inc., Series 1999-1, Class A, 6.545% 20204 | 6,264 | 6,812 |
| Continental Airlines, Inc., Series 2001-1, Class A-1, 6.703% 20224 | 6,482 | 6,984 |
| Waste Management, Inc. 2.60% 2016 | 8,890 | 9,187 |
| Waste Management, Inc. 2.90% 2022 | 15,000 | 13,805 |
| Danaher Corp. 2.30% 2016 | 16,795 | 17,375 |
| Atlas Copco AB 5.60% 20172 | 14,000 | 15,597 |
| Canadian National Railway Co. 4.95% 2014 | 6,000 | 6,140 |
| Canadian National Railway Co. 1.45% 2016 | 8,900 | 8,979 |
| Bonds, notes & other debt instruments | | |
| | Principal amount | Value |
| Corporate bonds & notes — Industrials (continued) | (000) | (000) |
| | | |
| American Airlines, Inc., Series 2011-2, Class A, 8.625% 20234 | $13,650 | $ 14,554 |
| Boeing Co. 0.95% 2018 | 12,000 | 11,491 |
| Volvo Treasury AB 5.95% 20152 | 9,460 | 10,172 |
| Norfolk Southern Corp. 5.75% 2016 | 7,615 | 8,476 |
| CSX Corp. 6.25% 2015 | 5,990 | 6,546 |
| | | 532,203 |
| Energy 0.80% | | |
| | | |
| StatoilHydro ASA 2.90% 2014 | 13,285 | 13,671 |
| StatoilHydro ASA 1.80% 2016 | 16,000 | 16,423 |
| Statoil ASA 3.125% 2017 | 16,500 | 17,421 |
| StatoilHydro ASA 2.65% 2024 | 7,000 | 6,502 |
| Statoil ASA 4.25% 2041 | 6,000 | 5,692 |
| Enterprise Products Operating LLC 1.25% 2015 | 10,000 | 10,037 |
| Enterprise Products Operating LLC 5.20% 2020 | 6,355 | 7,119 |
| Enterprise Products Operating LLC 3.35% 2023 | 36,430 | 35,107 |
| Kinder Morgan Energy Partners, LP 6.00% 2017 | 24,610 | 27,732 |
| Kinder Morgan Energy Partners, LP 4.15% 2022 | 12,855 | 12,938 |
| Kinder Morgan Energy Partners, LP 3.45% 2023 | 4,000 | 3,761 |
| Enbridge Energy Partners, LP, Series B, 6.50% 2018 | 12,250 | 14,238 |
| Enbridge Energy Partners, LP, Series B, 7.50% 2038 | 12,250 | 14,867 |
| Enbridge Energy Partners, LP 5.50% 2040 | 15,000 | 14,536 |
| Total Capital SA 3.00% 2015 | 17,000 | 17,771 |
| Total Capital Canada Ltd. 1.45% 2018 | 10,940 | 10,694 |
| Total Capital International 2.875% 2022 | 8,695 | 8,368 |
| Total Capital International 2.70% 2023 | 4,820 | 4,516 |
| Devon Energy Corp. 1.875% 2017 | 9,315 | 9,194 |
| Devon Energy Corp. 3.25% 2022 | 22,500 | 21,822 |
| Energy Transfer Partners, L.P. 3.60% 2023 | 26,445 | 24,784 |
| Anadarko Petroleum Corp. 5.95% 2016 | 20,500 | 23,008 |
| Cenovus Energy Inc. 4.50% 2014 | 15,000 | 15,664 |
| Cenovus Energy Inc. 3.00% 2022 | 7,395 | 7,047 |
| Shell International Finance BV 1.125% 2017 | 21,000 | 20,556 |
| BG Energy Capital PLC 2.50% 20152 | 7,200 | 7,441 |
| BG Energy Capital PLC 2.875% 20162 | 12,325 | 12,908 |
| Apache Corp. 2.625% 2023 | 21,000 | 19,391 |
| Marathon Oil Corp. 0.90% 2015 | 16,000 | 15,918 |
| ConocoPhillips 1.05% 2017 | 16,000 | 15,452 |
| Transocean Inc. 6.375% 2021 | 13,050 | 14,685 |
| Williams Partners L.P. 4.125% 2020 | 13,500 | 13,623 |
| Canadian Natural Resources Ltd. 5.70% 2017 | 11,925 | 13,532 |
| TransCanada PipeLines Ltd. 0.875% 2015 | 13,000 | 13,015 |
| Enbridge Inc. 5.60% 2017 | 10,000 | 11,217 |
| | | 500,650 |
| Health care 0.77% | | |
| | | |
| Cardinal Health, Inc. 4.00% 2015 | 37,100 | 39,190 |
| Cardinal Health, Inc. 5.80% 2016 | 17,500 | 19,875 |
| Cardinal Health, Inc. 4.625% 2020 | 20,000 | 21,409 |
| Cardinal Health, Inc. 3.20% 2022 | 16,850 | 16,039 |
| Medco Health Solutions, Inc. 2.75% 2015 | 10,095 | 10,384 |
| Express Scripts Inc. 3.125% 2016 | 23,000 | 23,930 |
| Express Scripts Inc. 3.90% 2022 | 20,565 | 20,849 |
| Express Scripts Inc. 6.125% 2041 | 15,000 | 17,404 |
| Amgen Inc. 2.50% 2016 | 27,875 | 28,819 |
| Amgen Inc. 2.125% 2017 | 16,000 | 16,076 |
| Bonds, notes & other debt instruments | | |
| | Principal amount | Value |
| Corporate bonds & notes — Health care (continued) | (000) | (000) |
| | | |
| Amgen Inc. 5.375% 2043 | $25,000 | $ 25,981 |
| UnitedHealth Group Inc. 6.00% 2017 | 22,170 | 25,571 |
| UnitedHealth Group Inc. 6.00% 2018 | 35,000 | 41,134 |
| AbbVie Inc. 1.75% 20172 | 16,000 | 15,686 |
| AbbVie Inc. 2.90% 20222 | 19,500 | 18,261 |
| AbbVie Inc. 4.40% 20422 | 22,200 | 20,726 |
| Gilead Sciences, Inc. 3.05% 2016 | 18,425 | 19,488 |
| Gilead Sciences, Inc. 4.40% 2021 | 4,870 | 5,236 |
| Humana Inc. 3.15% 2022 | 20,000 | 18,587 |
| Coventry Health Care, Inc. 6.30% 2014 | 11,955 | 12,640 |
| Aetna Inc. 1.50% 2017 | 5,400 | 5,246 |
| GlaxoSmithKline Capital Inc. 1.50% 2017 | 17,500 | 17,392 |
| Novartis Capital Corp. 2.90% 2015 | 16,000 | 16,683 |
| Baxter International Inc. 3.20% 2023 | 11,000 | 10,806 |
| DENTSPLY International Inc. 2.75% 2016 | 9,830 | 10,098 |
| Catholic Health Initiatives, Series 2012, 1.60% 2017 | 2,000 | 1,959 |
| | | 479,469 |
| Consumer discretionary 0.76% | | |
| | | |
| Comcast Corp. 5.30% 2014 | 15,000 | 15,370 |
| Comcast Corp. 6.30% 2017 | 16,750 | 19,804 |
| Comcast Corp. 6.45% 2037 | 15,000 | 18,011 |
| Comcast Corp. 6.95% 2037 | 24,250 | 30,652 |
| Time Warner Cable Inc. 6.75% 2018 | 37,620 | 43,093 |
| Time Warner Cable Inc. 5.00% 2020 | 15,000 | 15,674 |
| Time Warner Cable Inc. 4.00% 2021 | 15,000 | 14,382 |
| DaimlerChrysler North America Holding Corp. 1.30% 20152 | 16,000 | 16,041 |
| DaimlerChrysler North America Holding Corp. 2.40% 20172 | 25,000 | 25,102 |
| Volkswagen International Finance NV 0.894% 20142,3 | 17,000 | 17,039 |
| Volkswagen International Finance NV 2.375% 20172 | 20,000 | 20,348 |
| Home Depot, Inc. 4.40% 2021 | 15,000 | 16,484 |
| Home Depot, Inc. 5.95% 2041 | 15,000 | 17,955 |
| Time Warner Inc. 5.875% 2016 | 14,210 | 16,231 |
| Time Warner Inc. 6.25% 2041 | 15,000 | 16,624 |
| Thomson Reuters Corp. 5.95% 2013 | 8,140 | 8,155 |
| Thomson Reuters Corp. 6.50% 2018 | 20,815 | 24,626 |
| Walt Disney Co. 0.875% 2014 | 15,500 | 15,590 |
| Walt Disney Co. 1.10% 2017 | 14,255 | 13,830 |
| Cox Communications, Inc. 5.45% 2014 | 4,956 | 5,289 |
| Cox Communications, Inc. 2.95% 20232 | 21,000 | 19,130 |
| Dollar General Corp. 1.875% 2018 | 12,500 | 12,069 |
| Dollar General Corp. 3.25% 2023 | 9,500 | 8,688 |
| Nordstrom, Inc. 6.75% 2014 | 10,000 | 10,533 |
| Nordstrom, Inc. 4.00% 2021 | 6,245 | 6,619 |
| NBCUniversal Media, LLC 2.875% 2016 | 16,000 | 16,732 |
| RCI Banque 3.50% 20182 | 16,000 | 15,864 |
| Ford Motor Co. 4.75% 2043 | 6,870 | 6,083 |
| Macy’s Retail Holdings, Inc. 7.875% 20153 | 4,699 | 5,330 |
| Seminole Tribe of Florida 5.798% 20132,4 | 2,530 | 2,555 |
| | | 473,903 |
| Telecommunication services 0.53% | | |
| | | |
| SBC Communications Inc. 5.10% 2014 | 15,000 | 15,764 |
| AT&T Inc. 2.40% 2016 | 18,000 | 18,561 |
| SBC Communications Inc. 5.625% 2016 | 24,300 | 27,201 |
| Bonds, notes & other debt instruments | | |
| | Principal amount | Value |
| Corporate bonds & notes — Telecommunication services (continued) | (000) | (000) |
| | | |
| AT&T INC. 4.30% 2042 | $58,111 | $ 50,863 |
| Verizon Communications Inc. 3.00% 2016 | 34,000 | 35,558 |
| Verizon Communications Inc. 6.25% 2037 | 20,000 | 22,918 |
| Verizon Communications Inc. 4.75% 2041 | 3,100 | 2,963 |
| Verizon Communications Inc. 6.00% 2041 | 7,900 | 8,904 |
| Telefónica Emisiones, SAU 3.992% 2016 | 18,000 | 18,606 |
| Telefónica Emisiones, SAU 3.192% 2018 | 16,000 | 15,509 |
| Telefónica Emisiones, SAU 4.57% 2023 | 28,000 | 26,841 |
| Deutsche Telekom International Finance BV 4.875% 2014 | 15,500 | 16,106 |
| Deutsche Telekom International Finance BV 9.25% 2032 | 9,719 | 14,568 |
| Deutsche Telekom International Finance BV 4.875% 20422 | 620 | 608 |
| France Télécom 4.375% 2014 | 10,000 | 10,301 |
| France Télécom 4.125% 2021 | 20,000 | 20,227 |
| Telecom Italia Capital SA 6.999% 2018 | 11,992 | 13,238 |
| Telecom Italia Capital SA 7.175% 2019 | 9,000 | 10,057 |
| | | 328,793 |
| Materials 0.43% | | |
| | | |
| Xstrata Canada Financial Corp. 2.45% 20172,3 | 10,000 | 9,704 |
| Glencore Xstrata LLC 2.50% 20192 | 21,000 | 19,015 |
| Xstrata Canada Financial Corp. 4.95% 20212 | 19,000 | 18,416 |
| Glencore Xstrata LLC 4.125% 20232 | 12,000 | 10,717 |
| Rio Tinto Finance (USA) Ltd. 2.25% 2016 | 15,000 | 15,321 |
| Rio Tinto Finance (USA) Ltd. 1.625% 2017 | 16,000 | 15,703 |
| Rio Tinto Finance (USA) Ltd. 2.25% 2018 | 12,850 | 12,498 |
| International Paper Co. 7.40% 2014 | 23,250 | 24,597 |
| International Paper Co. 7.30% 2039 | 8,425 | 10,153 |
| Newcrest Finance Pty Ltd. 4.45% 20212 | 15,125 | 13,590 |
| Newcrest Finance Pty Ltd. 4.20% 20222 | 13,735 | 11,857 |
| E.I. du Pont de Nemours and Co. 0.693% 20143 | 25,000 | 25,079 |
| Rohm and Haas Co. 6.00% 2017 | 17,445 | 19,905 |
| Praxair, Inc. 1.05% 2017 | 16,000 | 15,451 |
| Teck Resources Ltd. 4.75% 2022 | 10,055 | 10,013 |
| Teck Resources Ltd. 5.40% 2043 | 5,870 | 5,162 |
| Ecolab Inc. 3.00% 2016 | 12,365 | 12,909 |
| Anglo American Capital PLC 2.15% 20132 | 9,525 | 9,553 |
| Cliffs Natural Resources Inc. 4.875% 2021 | 9,310 | 8,447 |
| | | 268,090 |
| Utilities 0.35% | | |
| | | |
| MidAmerican Energy Holdings Co., Series D, 5.00% 2014 | 18,000 | 18,492 |
| PacifiCorp., First Mortgage Bonds, 5.65% 2018 | 2,465 | 2,879 |
| MidAmerican Energy Holdings Co. 5.75% 2018 | 15,300 | 17,774 |
| MidAmerican Energy Holdings Co. 5.95% 2037 | 6,125 | 6,834 |
| National Rural Utilities Cooperative Finance Corp. 5.50% 2013 | 30,333 | 30,333 |
| National Rural Utilities Cooperative Finance Corp. 10.375% 2018 | 8,450 | 11,716 |
| E.ON International Finance BV 5.80% 20182 | 24,450 | 28,395 |
| CenterPoint Energy Resources Corp. 4.50% 2021 | 18,751 | 20,488 |
| Entergy Corp. 4.70% 2017 | 14,600 | 15,504 |
| American Electric Power Co. 2.95% 2022 | 16,090 | 14,999 |
| Electricité de France SA 6.95% 20392 | 12,000 | 14,803 |
| Virginia Electric and Power Co., Series B, 5.95% 2017 | 10,000 | 11,629 |
| Iberdrola Finance Ireland 3.80% 20142 | 11,000 | 11,287 |
| Niagara Mohawk Power 3.553% 20142 | 10,000 | 10,341 |
| Tri-State Generation and Transmission Assn. Inc., Pass Through Trust, Series 2003-A, 6.04% 20182,4 | 2,381 | 2,537 |
| | | 218,011 |
| Bonds, notes & other debt instruments | | |
| Corporate bonds & notes (continued) | Principal amount | Value |
| Information technology 0.16% | (000) | (000) |
| | | |
| International Business Machines Corp. 1.95% 2016 | $ 52,500 | $ 53,844 |
| International Business Machines Corp. 2.00% 2016 | 17,000 | 17,448 |
| International Business Machines Corp. 1.625% 2020 | 17,000 | 15,932 |
| Cisco Systems, Inc. 2.90% 2014 | 10,000 | 10,330 |
| | | 97,554 |
| Total corporate bonds & notes | | 5,096,729 |
| U.S. Treasury bonds & notes 7.80% | | |
| U.S. Treasury 6.37% | | |
| | | |
| U.S. Treasury 1.50% 2013 | 172,500 | 173,673 |
| U.S. Treasury 2.75% 2013 | 246,500 | 248,677 |
| U.S. Treasury 4.25% 2013 | 189,835 | 190,822 |
| U.S. Treasury 1.875% 2014 | 194,100 | 196,848 |
| U.S. Treasury 1.875% 2014 | 100,000 | 101,149 |
| U.S. Treasury 2.625% 2014 | 175,000 | 179,232 |
| U.S. Treasury 2.625% 2014 | 150,000 | 153,932 |
| U.S. Treasury 1.50% 2016 | 25,000 | 25,598 |
| U.S. Treasury 1.75% 2016 | 136,000 | 140,245 |
| U.S. Treasury 2.00% 2016 | 212,000 | 219,956 |
| U.S. Treasury 2.375% 2016 | 122,000 | 127,949 |
| U.S. Treasury 4.50% 2016 | 58,500 | 64,502 |
| U.S. Treasury 4.625% 2017 | 68,750 | 77,848 |
| U.S. Treasury 2.625% 2018 | 192,000 | 203,558 |
| U.S. Treasury 3.50% 2018 | 125,000 | 137,516 |
| U.S. Treasury 1.125% 2019 | 212,000 | 205,636 |
| U.S. Treasury 1.625% 2022 | 419,000 | 390,722 |
| U.S. Treasury 6.25% 2023 | 207,000 | 277,541 |
| U.S. Treasury 6.375% 2027 | 149,500 | 209,183 |
| U.S. Treasury 5.50% 2028 | 48,000 | 62,434 |
| U.S. Treasury 5.25% 2029 | 15,000 | 19,073 |
| U.S. Treasury 4.50% 2036 | 104,882 | 124,932 |
| U.S. Treasury 3.75% 2041 | 90,000 | 95,048 |
| U.S. Treasury 2.875% 2043 | 68,250 | 60,428 |
| U.S. Treasury 3.125% 2043 | 295,000 | 275,433 |
| | | 3,961,935 |
| U.S. Treasury inflation-protected securities5 1.43% | | |
| | | |
| U.S. Treasury Inflation-Protected Security 1.875% 2013 | 37,983 | 38,040 |
| U.S. Treasury Inflation-Protected Security 1.875% 2015 | 107,596 | 114,456 |
| U.S. Treasury Inflation-Protected Security 0.125% 2017 | 174,048 | 178,632 |
| U.S. Treasury Inflation-Protected Security 0.125% 2018 | 13,078 | 13,415 |
| U.S. Treasury Inflation-Protected Security 2.125% 2019 | 54,155 | 61,243 |
| U.S. Treasury Inflation-Protected Security 0.125% 2022 | 157,747 | 154,107 |
| U.S. Treasury Inflation-Protected Security 0.125% 2023 | 156,909 | 151,963 |
| U.S. Treasury Inflation-Protected Security 2.375% 2025 | 61,683 | 73,429 |
| U.S. Treasury Inflation-Protected Security 0.75% 2042 | 15,437 | 13,569 |
| U.S. Treasury Inflation-Protected Security 0.625% 2043 | 104,683 | 87,853 |
| | | 886,707 |
| Total U.S. Treasury bonds & notes | | 4,848,642 |
| Bonds, notes & other debt instruments | | |
| | Principal amount | Value |
| Mortgage-backed obligations4 6.15% | (000) | (000) |
| | | |
| Fannie Mae 11.00% 2018 | $ 104 | $ 113 |
| Fannie Mae, Series 2012-M8, multifamily 1.52% 2019 | 16,665 | 16,492 |
| Fannie Mae, Series 2012-M17, Class A2, multifamily 2.184% 2022 | 18,500 | 17,250 |
| Fannie Mae, Series 2012-M14, Class A2, multifamily 2.301% 20223 | 8,570 | 8,065 |
| Fannie Mae, Series 2012-M9, Class A2, multifamily 2.482% 2022 | 21,843 | 20,641 |
| Fannie Mae, Series 2012-M5, Class A2, multifamily 2.715% 2022 | 14,000 | 13,557 |
| Fannie Mae 2.50% 2023 | 23,924 | 24,570 |
| Fannie Mae 3.50% 2024 | 1,102 | 1,152 |
| Fannie Mae 3.50% 2025 | 34,634 | 36,184 |
| Fannie Mae 3.50% 2025 | 14,992 | 15,671 |
| Fannie Mae 3.50% 2025 | 13,400 | 13,967 |
| Fannie Mae 3.50% 2025 | 12,317 | 12,880 |
| Fannie Mae 3.50% 2025 | 9,122 | 9,536 |
| Fannie Mae 3.50% 2025 | 365 | 381 |
| Fannie Mae 4.50% 2025 | 10,496 | 11,147 |
| Fannie Mae 4.50% 2025 | 9,992 | 10,609 |
| Fannie Mae, Series 2001-4, Class NA, 10.913% 20253 | 41 | 46 |
| Fannie Mae 3.50% 2026 | 65,085 | 67,989 |
| Fannie Mae 3.50% 2026 | 4,196 | 4,383 |
| Fannie Mae 3.50% 2026 | 3,820 | 3,989 |
| Fannie Mae 2.50% 2027 | 42,413 | 42,692 |
| Fannie Mae 2.50% 2027 | 40,161 | 40,425 |
| Fannie Mae 2.50% 2027 | 2,829 | 2,846 |
| Fannie Mae 2.50% 2027 | 2,525 | 2,541 |
| Fannie Mae 2.50% 2027 | 2,319 | 2,333 |
| Fannie Mae 2.50% 2027 | 1,370 | 1,379 |
| Fannie Mae 2.50% 2027 | 1,147 | 1,154 |
| Fannie Mae 2.50% 2027 | 1,114 | 1,121 |
| Fannie Mae 3.00% 2027 | 52,129 | 53,693 |
| Fannie Mae 3.00% 2027 | 21,864 | 22,539 |
| Fannie Mae 2.50% 2028 | 126,135 | 126,947 |
| Fannie Mae 2.50% 2028 | 85,063 | 85,624 |
| Fannie Mae 2.50% 2028 | 33,795 | 34,018 |
| Fannie Mae 2.50% 2028 | 31,264 | 31,456 |
| Fannie Mae 2.50% 2028 | 30,360 | 30,559 |
| Fannie Mae 2.50% 2028 | 23,500 | 23,614 |
| Fannie Mae 2.50% 2028 | 19,870 | 19,992 |
| Fannie Mae 2.50% 2028 | 13,792 | 13,877 |
| Fannie Mae 2.50% 2028 | 12,655 | 12,737 |
| Fannie Mae 2.50% 2028 | 9,790 | 9,853 |
| Fannie Mae 2.50% 2028 | 8,540 | 8,596 |
| Fannie Mae 2.50% 2028 | 7,378 | 7,423 |
| Fannie Mae 2.50% 2028 | 2,087 | 2,100 |
| Fannie Mae 3.50% 2028 | 1,775 | 1,850 |
| Fannie Mae, Series 2001-20, Class D, 11.012% 20313 | 26 | 29 |
| Fannie Mae 5.00% 2033 | 4,621 | 5,000 |
| Fannie Mae 5.00% 2033 | 2,412 | 2,610 |
| Fannie Mae 5.50% 2033 | 7,307 | 7,983 |
| Fannie Mae 5.50% 2033 | 6,278 | 6,859 |
| Fannie Mae 5.50% 2033 | 773 | 845 |
| Fannie Mae 4.50% 2034 | 27,065 | 28,732 |
| Fannie Mae 5.00% 2034 | 5,172 | 5,593 |
| Fannie Mae 5.00% 2035 | 19,526 | 21,076 |
| Bonds, notes & other debt instruments | | |
| | Principal amount | Value |
| Mortgage-backed obligations4 (continued) | (000) | (000) |
| | | |
| Fannie Mae 5.00% 2035 | $ 2,741 | $ 2,971 |
| Fannie Mae 5.50% 2035 | 3,233 | 3,524 |
| Fannie Mae 5.50% 2035 | 1,753 | 1,907 |
| Fannie Mae 6.50% 2035 | 5,504 | 6,171 |
| Fannie Mae, Series 2006-43, Class JO, principal only, 0% 2036 | 3,033 | 2,646 |
| Fannie Mae 5.00% 2036 | 4,573 | 4,924 |
| Fannie Mae 5.00% 2036 | 2,322 | 2,507 |
| Fannie Mae 5.50% 2036 | 752 | 818 |
| Fannie Mae 5.50% 2036 | 698 | 760 |
| Fannie Mae, Series 2006-49, Class PA, 6.00% 2036 | 5,967 | 6,624 |
| Fannie Mae 6.00% 2036 | 2,044 | 2,228 |
| Fannie Mae 2.662% 20373 | 5,980 | 6,367 |
| Fannie Mae 6.00% 2037 | 27,841 | 30,351 |
| Fannie Mae 6.00% 2037 | 7,670 | 8,343 |
| Fannie Mae 6.50% 2037 | 7,534 | 8,377 |
| Fannie Mae 6.50% 2037 | 6,248 | 6,786 |
| Fannie Mae 6.50% 2037 | 3,966 | 4,307 |
| Fannie Mae 7.00% 2037 | 1,600 | 1,795 |
| Fannie Mae 7.00% 2037 | 1,337 | 1,500 |
| Fannie Mae 7.00% 2037 | 754 | 845 |
| Fannie Mae 5.50% 2038 | 1,769 | 1,918 |
| Fannie Mae 6.50% 2038 | 9,118 | 10,146 |
| Fannie Mae 4.50% 2039 | 31,867 | 33,713 |
| Fannie Mae 5.00% 2039 | 1,920 | 2,064 |
| Fannie Mae 6.00% 2039 | 46,723 | 50,756 |
| Fannie Mae 4.00% 2040 | 91,975 | 95,862 |
| Fannie Mae 4.00% 2040 | 30,654 | 32,116 |
| Fannie Mae 4.189% 20403 | 3,198 | 3,399 |
| Fannie Mae 4.408% 20403 | 2,138 | 2,279 |
| Fannie Mae 4.50% 2040 | 58,134 | 61,603 |
| Fannie Mae 4.50% 2040 | 34,642 | 36,709 |
| Fannie Mae 4.50% 2040 | 30,593 | 32,573 |
| Fannie Mae 4.50% 2040 | 22,782 | 24,143 |
| Fannie Mae 4.50% 2040 | 18,813 | 19,936 |
| Fannie Mae 5.00% 2040 | 29,104 | 31,949 |
| Fannie Mae 5.00% 2040 | 4,639 | 5,085 |
| Fannie Mae 5.00% 2040 | 4,210 | 4,583 |
| Fannie Mae 5.00% 2040 | 3,341 | 3,650 |
| Fannie Mae 3.562% 20413 | 19,577 | 20,432 |
| Fannie Mae 4.00% 2041 | 45,048 | 46,952 |
| Fannie Mae 4.00% 2041 | 24,971 | 26,026 |
| Fannie Mae 4.00% 2041 | 20,760 | 21,637 |
| Fannie Mae 4.00% 2041 | 17,036 | 17,838 |
| Fannie Mae 4.00% 2041 | 16,976 | 17,693 |
| Fannie Mae 4.50% 2041 | 51,311 | 54,413 |
| Fannie Mae 4.50% 2041 | 13,937 | 14,780 |
| Fannie Mae 4.50% 2041 | 10,410 | 11,039 |
| Fannie Mae, Series 2001-T10, Class A-1, 7.00% 2041 | 360 | 427 |
| Fannie Mae, Series 2001-50, Class BA, 7.00% 2041 | 287 | 325 |
| Fannie Mae, Series 2002-W3, Class A-5, 7.50% 2041 | 461 | 544 |
| Fannie Mae 3.50% 2042 | 99,132 | 100,877 |
| Fannie Mae 3.50% 2042 | 70,849 | 72,024 |
| Fannie Mae 3.50% 2042 | 28,225 | 28,691 |
| Fannie Mae 3.50% 2042 | 7,931 | 8,071 |
| Bonds, notes & other debt instruments | | |
| | Principal amount | Value |
| Mortgage-backed obligations4 (continued) | (000) | (000) |
| | | |
| Fannie Mae, Series 2002-W1, Class 2A, 6.767% 20423 | $ 526 | $ 628 |
| Fannie Mae 3.50% 2043 | 59,737 | 60,762 |
| Fannie Mae 3.50% 2043 | 54,178 | 55,090 |
| Fannie Mae 3.50% 2043 | 34,227 | 34,805 |
| Fannie Mae 3.50% 2043 | 22,688 | 23,077 |
| Fannie Mae 3.50% 2043 | 22,291 | 22,674 |
| Fannie Mae 3.50% 2043 | 21,830 | 22,204 |
| Fannie Mae 3.50% 2043 | 18,749 | 19,071 |
| Fannie Mae 3.50% 2043 | 9,774 | 9,941 |
| Fannie Mae 3.50% 2043 | 7,625 | 7,756 |
| Fannie Mae 4.00% 2043 | 140,000 | 145,841 |
| Fannie Mae 4.00% 2043 | 130,000 | 135,139 |
| Fannie Mae 6.50% 2047 | 1,197 | 1,305 |
| Fannie Mae 6.50% 2047 | 531 | 579 |
| Fannie Mae 6.50% 2047 | 423 | 461 |
| Fannie Mae 6.50% 2047 | 211 | 230 |
| Fannie Mae 7.00% 2047 | 646 | 719 |
| Fannie Mae 7.00% 2047 | 486 | 542 |
| Fannie Mae 7.00% 2047 | 482 | 537 |
| Fannie Mae 7.00% 2047 | 376 | 419 |
| Fannie Mae 7.00% 2047 | 231 | 257 |
| Fannie Mae 7.00% 2047 | 145 | 161 |
| Fannie Mae 7.00% 2047 | 126 | 141 |
| Fannie Mae 7.00% 2047 | 106 | 118 |
| Fannie Mae 7.00% 2047 | 33 | 37 |
| Freddie Mac, Series K711, Class A2, multifamily 1.73% 2019 | 20,000 | 19,613 |
| Freddie Mac, Series K712, Class A2, multifamily 1.869% 2019 | 13,765 | 13,374 |
| Freddie Mac, Series K710, Class A2, multifamily 1.883% 2019 | 16,115 | 15,729 |
| Freddie Mac, Series K709, Class A2, multifamily 2.086% 2019 | 10,300 | 10,209 |
| Freddie Mac, Series KS01, Class A1, multifamily 1.693% 2022 | 5,761 | 5,680 |
| Freddie Mac, Series K019, Class A2, multifamily 2.272% 2022 | 16,000 | 15,080 |
| Freddie Mac, Series K023, Class A2, multifamily 2.307% 2022 | 17,995 | 16,836 |
| Freddie Mac, Series K021, Class A2, multifamily 2.396% 2022 | 16,555 | 15,608 |
| Freddie Mac, Series K025, Class A2, multifamily 2.682% 2022 | 15,904 | 15,309 |
| Freddie Mac, Series K027, Class A2, multifamily 2.637% 2023 | 14,500 | 13,893 |
| Freddie Mac, Series K028, Class A2, multifamily 3.111% 2023 | 19,600 | 19,387 |
| Freddie Mac 4.50% 2023 | 124 | 131 |
| Freddie Mac 5.00% 2023 | 7,545 | 7,980 |
| Freddie Mac 5.00% 2023 | 5,438 | 5,752 |
| Freddie Mac 5.00% 2023 | 3,126 | 3,306 |
| Freddie Mac 5.00% 2023 | 1,568 | 1,659 |
| Freddie Mac 5.00% 2023 | 1,483 | 1,571 |
| Freddie Mac 5.00% 2023 | 1,228 | 1,299 |
| Freddie Mac 5.00% 2024 | 10,260 | 10,988 |
| Freddie Mac 6.00% 2026 | 3,877 | 4,267 |
| Freddie Mac 6.00% 2026 | 2,878 | 3,169 |
| Freddie Mac 6.00% 2026 | 2,564 | 2,824 |
| Freddie Mac 4.50% 2027 | 729 | 776 |
| Freddie Mac 6.50% 2027 | 1,666 | 1,851 |
| Freddie Mac 6.50% 2027 | 506 | 562 |
| Freddie Mac 6.50% 2027 | 429 | 476 |
| Freddie Mac 6.50% 2028 | 996 | 1,107 |
| Freddie Mac 4.50% 2029 | 597 | 631 |
| Freddie Mac 4.50% 2031 | 764 | 811 |
| Bonds, notes & other debt instruments | | |
| | Principal amount | Value |
| Mortgage-backed obligations4 (continued) | (000) | (000) |
| | | |
| Freddie Mac, Series T-041, Class 3-A, 6.705% 20323 | $ 2,345 | $ 2,766 |
| Freddie Mac, Series 3061, Class PN, 5.50% 2035 | 4,739 | 5,180 |
| Freddie Mac, Series 3156, Class PO, principal only, 0% 2036 | 7,231 | 6,703 |
| Freddie Mac, Series 3146, Class PO, principal only, 0% 2036 | 4,876 | 4,610 |
| Freddie Mac, Series 3233, Class PA, 6.00% 2036 | 13,514 | 14,884 |
| Freddie Mac, Series 3318, Class JT, 5.50% 2037 | 10,510 | 11,411 |
| Freddie Mac, Series 3312, Class PA, 5.50% 2037 | 9,898 | 10,752 |
| Freddie Mac, Series 3272, Class PA, 6.00% 2037 | 7,972 | 8,752 |
| Freddie Mac 6.00% 2038 | 5,106 | 5,532 |
| Freddie Mac 6.00% 2038 | 825 | 895 |
| Freddie Mac 4.50% 2040 | 28,131 | 29,667 |
| Freddie Mac 4.50% 2040 | 1,139 | 1,199 |
| Freddie Mac 4.50% 2041 | 2,824 | 2,982 |
| Freddie Mac 4.50% 2041 | 2,741 | 2,894 |
| Freddie Mac 4.50% 2041 | 1,253 | 1,323 |
| Freddie Mac 4.50% 2041 | 1,008 | 1,065 |
| Freddie Mac 4.50% 2041 | 920 | 972 |
| Freddie Mac 4.50% 2041 | 549 | 579 |
| Government National Mortgage Assn. 10.00% 2021 | 233 | 260 |
| Government National Mortgage Assn. 6.00% 2038 | 24,137 | 26,544 |
| Government National Mortgage Assn. 6.50% 2038 | 11,557 | 13,015 |
| Government National Mortgage Assn. 4.00% 2039 | 3,504 | 3,684 |
| Government National Mortgage Assn. 4.00% 2039 | 3,367 | 3,540 |
| Government National Mortgage Assn. 4.00% 2039 | 2,220 | 2,335 |
| Government National Mortgage Assn. 4.00% 2040 | 20,353 | 21,781 |
| Government National Mortgage Assn. 4.00% 2040 | 17,101 | 18,072 |
| Government National Mortgage Assn. 4.00% 2040 | 10,785 | 11,398 |
| Government National Mortgage Assn. 4.00% 2040 | 6,634 | 7,010 |
| Government National Mortgage Assn. 4.00% 2040 | 6,106 | 6,453 |
| Government National Mortgage Assn. 4.00% 2040 | 5,193 | 5,554 |
| Government National Mortgage Assn. 4.00% 2040 | 5,140 | 5,484 |
| Government National Mortgage Assn. 4.00% 2040 | 4,290 | 4,520 |
| Government National Mortgage Assn. 4.00% 2040 | 3,448 | 3,644 |
| Government National Mortgage Assn. 4.00% 2040 | 2,236 | 2,363 |
| Government National Mortgage Assn. 4.00% 2040 | 446 | 471 |
| Government National Mortgage Assn. 4.00% 2041 | 40,862 | 43,211 |
| Government National Mortgage Assn. 4.00% 2041 | 15,865 | 16,659 |
| Government National Mortgage Assn. 4.00% 2041 | 5,530 | 5,807 |
| Government National Mortgage Assn. 4.00% 2041 | 1,274 | 1,337 |
| Government National Mortgage Assn. 4.00% 2041 | 736 | 773 |
| J.P. Morgan Chase Commercial Mortgage Securities Corp., Series 2005-CIBC12, Class A-3B, 5.462% 20373 | 10,823 | 11,113 |
| J.P. Morgan Chase Commercial Mortgage Securities Corp., Series 2005-LDP4, Class A-SB, 4.824% 2042 | 8,307 | 8,517 |
| J.P. Morgan Chase Commercial Mortgage Securities Corp., Series 2006-CB15, Class A-4, 5.814% 20433 | 6,000 | 6,604 |
| J.P. Morgan Chase Commercial Mortgage Securities Corp., Series 2006-LDP7, Class A-4, 6.056% 20453 | 16,835 | 18,620 |
| J.P. Morgan Chase Commercial Mortgage Securities Corp., Series 2011-C4, Class A-2, 3.341% 20462 | 15,005 | 15,764 |
| J.P. Morgan Chase Commercial Mortgage Securities Corp., Series 2011-C3A, Class A-2, 3.673% 20462 | 40,900 | 43,387 |
| J.P. Morgan Chase Commercial Mortgage Securities Corp., Series 2007-CB19, Class A-4, 5.901% 20493 | 32,990 | 37,145 |
| J.P. Morgan Chase Commercial Mortgage Securities Corp., Series 2007-C1, Class A-4, 5.716% 2051 | 19,517 | 21,894 |
| Wachovia Bank Commercial Mortgage Trust, Series 2005-C16, Class A-PB, 4.692% 2041 | 8,848 | 8,950 |
| Wachovia Bank Commercial Mortgage Trust, Series 2007-C30, Class A-5, 5.342% 2043 | 14,000 | 15,604 |
| Wachovia Bank Commercial Mortgage Trust, Series 2007-C31, Class A-5, 5.50% 2047 | 10,000 | 11,246 |
| Wachovia Bank Commercial Mortgage Trust, Series 2007-C32, Class A-3, 5.937% 20493 | 27,635 | 31,036 |
| Wachovia Bank Commercial Mortgage Trust, Series 2007-C33, Class A-M, 6.122% 20513 | 17,000 | 18,487 |
| Banc of America Commercial Mortgage Inc., Series 2006-3, Class A-4, 5.889% 20443 | 7,000 | 7,785 |
| Bonds, notes & other debt instruments | | |
| | Principal amount | Value |
| Mortgage-backed obligations4 (continued) | (000) | (000) |
| | | |
| Banc of America Commercial Mortgage Inc., Series 2005-5, Class A-4, 5.115% 20453 | $ 6,788 | $ 7,294 |
| Banc of America Commercial Mortgage Inc., Series 2006-4, Class A-4, 5.634% 2046 | 2,000 | 2,200 |
| Banc of America Commercial Mortgage Inc., Series 2007-2, Class A-M, 5.803% 20493 | 4,100 | 4,520 |
| Banc of America Commercial Mortgage Inc., Series 2007-3, Class A-4, 5.857% 20493 | 13,569 | 15,254 |
| Banc of America Commercial Mortgage Inc., Series 2008-1, Class A-4, 6.395% 20513 | 30,000 | 34,540 |
| Greenwich Capital Commercial Funding Corp., Series 2006-GG7, Class A-4, 6.056% 20383 | 22,761 | 25,290 |
| Greenwich Capital Commercial Funding Corp., Series 2007-GG9, Class A-4, 5.444% 2039 | 38,708 | 42,944 |
| LB-UBS Commercial Mortgage Trust, Series 2007-C2, Class A-3, 5.43% 2040 | 34,455 | 37,923 |
| LB-UBS Commercial Mortgage Trust, Series 2007-C6, Class A-M, 6.114% 20403 | 8,715 | 9,500 |
| LB-UBS Commercial Mortgage Trust, Series 2007-C7, Class A-M, 6.425% 20453 | 11,575 | 13,035 |
| J.P. Morgan Chase Commercial Mortgage Securities Trust, Series 2006-LDP8, Class A-4, 5.399% 2045 | 32,860 | 36,206 |
| J.P. Morgan Chase Commercial Mortgage Securities Trust, Series 2006-LDP9, Class A-3, 5.336% 2047 | 10,055 | 11,115 |
| J.P. Morgan Chase Commercial Mortgage Securities Trust, Series 2006-LDP9, Class A-M, 5.372% 2047 | 10,596 | 11,209 |
| Citigroup-Deutsche Bank Commercial Mortgage Trust, Series 2005-CD1, Class A-4, 5.392% 20443 | 9,250 | 9,951 |
| Citigroup-Deutsche Bank Commercial Mortgage Trust, Series 2006-CD3, Class A-5, 5.617% 2048 | 23,965 | 26,431 |
| Morgan Stanley Capital I Trust, Series 2007-IQ13, Class A-M, 5.406% 2044 | 4,500 | 4,834 |
| Morgan Stanley Capital I Trust, Series 2007-IQ15, Class A-4, 6.09% 20493 | 24,313 | 27,456 |
| CS First Boston Mortgage Securities Corp., Series 2002-34, Class I-A-1, 7.50% 2032 | 873 | 939 |
| CS First Boston Mortgage Securities Corp., Series 2002-30, Class I-A-1, 7.50% 2032 | 557 | 606 |
| CS First Boston Mortgage Securities Corp., Series 2003-21, Class V-A-1, 6.50% 2033 | 760 | 818 |
| CS First Boston Mortgage Securities Corp., Series 2003-29, Class V-A-1, 7.00% 2033 | 1,363 | 1,497 |
| CS First Boston Mortgage Securities Corp., Series 2004-5, Class IV-A-1, 6.00% 2034 | 4,418 | 4,563 |
| CS First Boston Mortgage Securities Corp., Series 2007-C5, Class A4, 5.695% 20403 | 18,360 | 20,591 |
| DBUBS Mortgage Trust, Series 2011-LC1A, Class A1, 3.742% 20462 | 14,055 | 14,876 |
| DBUBS Mortgage Trust, Series 2011-LC1A, Class A3, 5.002% 20462 | 9,500 | 10,535 |
| GE Commercial Mortgage Corp., Series 2005-C4, Class A-3A, 5.471% 20453 | 24,346 | 24,311 |
| Bear Stearns Commercial Mortgage Securities Inc., Series 2005-PW10, Class AM, 5.449% 20403 | 20,000 | 21,424 |
| L.A. Arena Funding, LLC, Series 1, Class A, 7.656% 20262 | 16,293 | 18,335 |
| Bank of Montreal 2.85% 20152 | 17,000 | 17,708 |
| Wells Fargo Mortgage-backed Securities Trust, Series 2005-AR10, Class II-A-6, 2.636% 20353 | 14,414 | 14,473 |
| Bear Stearns Commercial Mortgage Securities Trust, Series 2007-PW17, Class A-4, 5.694% 20503 | 9,665 | 10,989 |
| Bear Stearns Commercial Mortgage Securities Trust, Series 2007-PW18, Class A-4, 5.70% 2050 | 2,250 | 2,570 |
| GS Mortgage Securities Corp. II, Series 2006-GG8, Class A-4, 5.56% 2039 | 11,880 | 13,182 |
| National Australia Bank 1.25% 20182 | 13,450 | 13,074 |
| Commonwealth Bank of Australia 0.75% 20162 | 13,000 | 12,902 |
| ML-CFC Commercial Mortgage Trust, Series 2007-8, Class A-3, 6.093% 20493 | 10,000 | 11,358 |
| Merrill Lynch Mortgage Trust, Series 2007-C1, Class A-4, 6.038% 20503 | 8,000 | 9,018 |
| Bear Stearns Commercial Mortgage Securities Trust, Series 2007-PW18, Class A-M, 6.084% 20503 | 6,425 | 7,172 |
| CHL Mortgage Pass-Through Trust, Series 2003-56, Class 6-A-1, 3.009% 20333 | 3,219 | 3,215 |
| American General Mortgage Loan Trust, Series 2010-1A, Class A-1, 5.15% 20582,3 | 2,599 | 2,624 |
| | | 3,825,809 |
| Federal agency bonds & notes 0.47% | | |
| | | |
| Freddie Mac 2.50% 2016 | 72,000 | 75,618 |
| Freddie Mac 1.00% 2017 | 114,000 | 112,776 |
| Freddie Mac 0.75% 2018 | 25,000 | 24,230 |
| Freddie Mac 1.375% 2020 | 52,000 | 49,103 |
| CoBank, ACB 0.873% 20222,3 | 23,425 | 21,235 |
| Fannie Mae 6.25% 2029 | 8,000 | 10,549 |
| | | 293,511 |
| Bonds & notes of governments & government agencies outside the U.S. 0.12% | | |
| | | |
| Israeli Government 3.15% 2023 | 35,000 | 32,844 |
| Polish Government 5.25% 2014 | 2,500 | 2,558 |
| Polish Government 6.375% 2019 | 14,350 | 16,772 |
| Bonds, notes & other debt instruments | | |
| | Principal amount | Value |
| Bonds & notes of governments & government agencies outside the U.S. (continued) | (000) | (000) |
| | | |
| France Government Agency-Guaranteed, Société Finance 2.875% 20142 | $ 10,460 | $ 10,763 |
| Latvia (Republic of) 2.75% 2020 | 10,500 | 9,765 |
| | | 72,702 |
| Asset-backed obligations4 0.08% | | |
| | | |
| Hertz Vehicle Financing LLC, Rental Car Asset-backed Notes, Series 2013-1A, Class A-1, 1.12% 20172 | 16,000 | 15,853 |
| Chase Credit Card Owner Trust, Series 2003-4, Class B, 0.843% 20163 | 14,000 | 14,011 |
| Morgan Stanley ABS Capital I Inc., Series 2004-NC3, Class M-1, 0.988% 20343 | 10,474 | 9,667 |
| RAMP Trust, Series 2003-RZ4, Class A-7, 4.79% 20333 | 1,742 | 1,795 |
| RAMP Trust, Series 2003-RS11, Class A-I-7, 4.828% 2033 | 2,162 | 2,170 |
| CWABS, Inc., Series 2004-BC1, Class M-1, 0.943% 20343 | 2,803 | 2,591 |
| Residential Asset Securities Corp. Trust, Series 2003-KS8, Class A-I-6, 4.83% 2033 | 1,932 | 1,954 |
| GE SeaCo Finance SRL, Series 2004-1, Class A, AMBAC insured, 0.493% 20192,3 | 1,804 | 1,789 |
| | | 49,830 |
| Municipals 0.05% | | |
| | | |
| State of California, Los Angeles Community College District (County of Los Angeles), | | |
| General Obligation Build America Bonds, 2008 Election, Series 2010-E, 6.60% 2042 | 15,000 | 18,953 |
| State of Maryland, Howard Hughes Medical Institute, Taxable Bonds, 3.45% 2014 | 15,475 | 15,991 |
| | | 34,944 |
| Miscellaneous 0.09% | | |
| | | |
| Other bonds, notes & other debt instruments in initial period of acquisition | | 54,926 |
| Total bonds, notes & other debt instruments (cost: $14,080,213,000) | | 14,277,093 |
| Short-term securities 4.74% | | |
| | | |
| Freddie Mac 0.10%–0.17% due 7/30/2013–5/13/2014 | 712,310 | 711,745 |
| Fannie Mae 0.09%–0.16% due 7/1/2013–5/5/2014 | 576,500 | 576,183 |
| Federal Home Loan Bank 0.082%–0.16% due 7/5/2013–6/17/2014 | 518,900 | 518,650 |
| Coca-Cola Co. 0.10%–0.16% due 7/17–12/18/20132 | 182,260 | 182,224 |
| Federal Farm Credit Banks 0.14%–0.18% due 9/18–10/18/2013 | 180,000 | 179,966 |
| U.S. Treasury Bills 0.158%–0.17% due 8/22–11/14/2013 | 171,400 | 171,365 |
| General Electric Capital Corp. 0.11% due 9/24/2013 | 83,000 | 82,974 |
| Procter & Gamble Co. 0.10% due 8/20–8/26/20132 | 70,000 | 69,992 |
| Wells Fargo & Co. 0.15% due 8/14/2013 | 66,500 | 66,483 |
| Army and Air Force Exchange Service 0.11% due 7/10–7/26/20132 | 64,800 | 64,796 |
| National Rural Utilities Cooperative Finance Corp. 0.10% due 7/26–8/2/2013 | 58,250 | 58,246 |
| ExxonMobil Corp. 0.08% due 7/15/2013 | 50,000 | 49,998 |
| Wal-Mart Stores, Inc. 0.11% due 7/8/20132 | 44,250 | 44,249 |
| IBM Corp. 0.05% due 7/2/20132 | 40,000 | 40,000 |
| Merck & Co. Inc. 0.085% due 7/19/20132 | 37,900 | 37,898 |
| Paccar Financial Corp. 0.13% due 9/9–9/19/2013 | 35,600 | 35,582 |
| Abbott Laboratories 0.10%–0.12% due 8/5–8/19/20132 | 28,050 | 28,048 |
| Honeywell International Inc. 0.12% due 9/24/20132 | 23,700 | 23,692 |
| Chariot Funding, LLC 0.30% due 2/21/20142 | 10,300 | 10,284 |
| Total short-term securities (cost: $2,952,365,000) | | 2,952,375 |
| Total investment securities (cost: $47,088,208,000) | | 62,280,911 |
| Other assets less liabilities | | (57,248) |
| Net assets | | $62,223,663 |
As permitted by U.S. Securities and Exchange Commission regulations, “Miscellaneous” securities include holdings in their first year of acquisition that have not previously been publicly disclosed.
| 1 | Security did not produce income during the last 12 months. |
| 2 | Acquired in a transaction exempt from registration under Rule 144A or section 4(2) of the Securities Act of 1933. May be resold in the U.S. in transactions exempt from registration, normally to qualified institutional buyers. The total value of all such securities was $1,528,622,000, which represented 2.46% of the net assets of the fund. |
| 3 | Coupon rate may change periodically. |
| 4 | Principal payments may be made periodically. Therefore, the effective maturity date may be earlier than the stated maturity date. |
| 5 | Index-linked bond whose principal amount moves with a government price index. |
Key to abbreviation
ADR = American Depositary Receipts
Investments are not FDIC-insured, nor are they deposits of or guaranteed by a bank or any other entity, so they may lose value.
Investors should carefully consider investment objectives, risks, charges and expenses. This and other important information is contained in the fund prospectus and summary prospectus, which can be obtained from your financial professional and should be read carefully before investing. You may also call American Funds Service Company (AFS) at (800) 421-4225 or visit the American Funds website at americanfunds.com.
MFGEFPX-011-0813O-S37734
ITEM 7 – Disclosure of Proxy Voting Policies and Procedures for Closed-End Management Investment Companies
Not applicable to this Registrant, insofar as the Registrant is not a closed-end management investment company.
ITEM 8 – Portfolio Managers of Closed-End Management Investment Companies
Not applicable to this Registrant, insofar as the Registrant is not a closed-end management investment company.
ITEM 9 – Purchases of Equity Securities by Closed-End Management Investment Company and Affiliated Purchasers
Not applicable to this Registrant, insofar as the Registrant is not a closed-end management investment company.
ITEM 10 – Submission of Matters to a Vote of Security Holders
There have been no material changes to the procedures by which shareholders may recommend nominees to the Registrant’s board of trustees since the Registrant last submitted a proxy statement to its shareholders. The procedures are as follows. The Registrant has a nominating and governance committee comprised solely of persons who are not considered ‘‘interested persons’’ of the Registrant within the meaning of the Investment Company Act of 1940, as amended. The committee periodically reviews such issues as the board’s composition, responsibilities, committees, compensation and other relevant issues, and recommends any appropriate changes to the full board of trustees. While the committee normally is able to identify from its own resources an ample number of qualified candidates, it will consider shareholder suggestions of persons to be considered as nominees to fill future vacancies on the board. Such suggestions must be sent in writing to the nominating and governance committee of the Registrant, c/o the Registrant’s Secretary, and must be accompanied by complete biographical and occupational data on the prospective nominee, along with a written consent of the prospective nominee for consideration of his or her name by the nominating and governance committee.
ITEM 11 – Controls and Procedures
| (a) | The Registrant’s Principal Executive Officer and Principal Financial Officer have concluded, based on their evaluation of the Registrant’s disclosure controls and procedures (as such term is defined in Rule 30a-3 under the Investment Company Act of 1940), that such controls and procedures are adequate and reasonably designed to achieve the purposes described in paragraph (c) of such rule. |
| | |
| (b) | There were no changes in the Registrant’s internal controls over financial reporting (as defined in Rule 30a-3(d) under the Investment Company Act of 1940) that occurred during the Registrant’s second fiscal quarter of the period covered by this report that has materially affected, or is reasonably likely to materially affect, the Registrant’s internal control over financial reporting. |
ITEM 12 – Exhibits
| (a)(1) | Not applicable for filing of semi-annual reports to shareholders. |
| | |
| (a)(2) | The certifications required by Rule 30a-2 of the Investment Company Act of 1940 and Sections 302 and 906 of the Sarbanes-Oxley Act of 2002 are attached as exhibits hereto. |
SIGNATURES
Pursuant to the requirements of the Securities Exchange Act of 1934 and the Investment Company Act of 1940, the Registrant has duly caused this report to be signed on its behalf by the undersigned, thereunto duly authorized.
| | AMERICAN BALANCED FUND |
| | |
| | By /s/ Gregory D. Johnson |
| | Gregory D. Johnson, Vice Chairman, President and Principal Executive Officer |
| | |
| | Date: August 30, 2013 |
Pursuant to the requirements of the Securities Exchange Act of 1934 and the Investment Company Act of 1940, this report has been signed below by the following persons on behalf of the Registrant and in the capacities and on the dates indicated.
| By /s/ Gregory D. Johnson |
| Gregory D. Johnson, Vice Chairman, President and Principal Executive Officer |
| |
| Date: August 30, 2013 |
| By /s/ Jeffrey P. Regal |
Jeffrey P. Regal, Treasurer and Principal Financial Officer |
| |
| Date: August 30, 2013 |