UNITED STATES
SECURITIES AND EXCHANGE COMMISSION
Washington, D.C. 20549
FORM N-CSR
Certified Shareholder Report of
Registered Management Investment Companies
Investment Company Act File Number: 811-00066
American Balanced Fund
(Exact Name of Registrant as Specified in Charter)
6455 Irvine Center Drive
Irvine, California 92618
(Address of Principal Executive Offices)
Registrant's telephone number, including area code: (213) 486-9200
Date of fiscal year end: December 31
Date of reporting period: June 30, 2017
Michael W. Stockton
American Balanced Fund
333 South Hope Street
Los Angeles, California 90071
(Name and Address of Agent for Service)
ITEM 1 – Reports to Stockholders
 | American Balanced Fund® Semi-annual report
for the six months ended
June 30, 2017 |

We believe high-
conviction investing
and diverse
perspectives lead
to better results.
American Balanced Fund seeks conservation of capital, current income and long-term growth of capital and income.
This fund is one of more than 40 offered by one of the nation’s largest mutual fund families, American Funds, from Capital Group. For more than 85 years, Capital has invested with a long-term focus based on thorough research and attention to risk.
Fund results shown in this report, unless otherwise indicated, are for Class A shares at net asset value. If a sales charge (maximum 5.75%) had been deducted, the results would have been lower. Results are for past periods and are not predictive of results for future periods. Current and future results may be lower or higher than those shown. Share prices and returns will vary, so investors may lose money. Investing for short periods makes losses more likely. Investments are not FDIC-insured, nor are they deposits of or guaranteed by a bank or any other entity, so they may lose value. For current information and month-end results, visit americanfunds.com.
Here are the average annual total returns on a $1,000 investment with all distributions reinvested for periods ended June 30, 2017:
| Class A shares | | 1 year | | 5 years | | 10 years |
| | | | | | | |
| Reflecting 5.75% maximum sales charge | | 4.08% | | 9.32% | | 5.97% |
For other share class results, visit americanfunds.com and americanfundsretirement.com.
The total annual fund operating expense ratio was 0.59% for Class A shares as of the prospectus dated April 7, 2017.
Investment results assume all distributions are reinvested and reflect applicable fees and expenses. When applicable, investment results reflect fee waivers, without which results would have been lower. Visit americanfunds.com for more information.
The fund’s 30-day yield for Class A shares as of July 31, 2017, calculated in accordance with the U.S. Securities and Exchange Commission (SEC) formula, was 1.54%. The fund’s 12-month distribution rate for Class A shares as of that date was 1.53%. Both reflect the 5.75% maximum sales charge. The SEC yield reflects the rate at which the fund is earning income on its current portfolio of securities while the distribution rate reflects the fund’s past dividends paid to shareholders. Accordingly, the fund’s SEC yield and distribution rate may differ.
The return of principal for bond funds and for funds with significant underlying bond holdings is not guaranteed. Fund shares are subject to the same interest rate, inflation and credit risks associated with the underlying bond holdings. Refer to the fund prospectus and the Risk Factors section of this report for more information on these and other risks associated with investing in the fund.
Fellow investors:
The first half of 2017 was surprisingly calm after a rather rocky 2016 — volatility, as measured by the Chicago Board Options Exchange Volatility Index, drifted to its lowest levels in years.
The U.S. economy continued to grow, completing eight consecutive years of expansion. The equity markets also moved higher at a steady pace. Uncertainties remained as many investors wondered about the future of a mature market cycle, high valuation levels — on a historical basis — and whether the current administration would be able to deliver on its policy promises.
Still, by June, the unmanaged Standard & Poor’s 500 Composite Index was up 9.34% and the Dow Jones Industrial Average had hit record highs a total of 22 times.
Fund results
Amidst this backdrop, American Balanced Fund (AMBAL) gained 6.65% during the six-month period ended June 30, 2017.
Results at a glance
For periods ended June 30, 2017, with all distributions reinvested
| | | Cumulative total returns | | Average annual total returns |
| | | 6 months | | 1 year | | 5 years | | 10 years | | Lifetime
(since 7/26/75)1 |
| | | | | | | | | | | |
| AMBAL (Class A shares) | | | 6.65 | % | | | 10.41 | % | | | 10.62 | % | | | 6.60 | % | | | 10.68 | % |
| 60%/40% S&P 500/Bloomberg Barclays U.S. Aggregate Index2,3 | | | 6.48 | | | | 10.33 | | | | 9.64 | | | | 6.40 | | | | 10.15 | |
| Lipper Balanced Funds Index4 | | | 6.77 | | | | 10.80 | | | | 8.53 | | | | 5.11 | | | | 9.78 | |
The market indexes shown in this report are unmanaged and, therefore, have no expenses. Investors cannot invest directly in an index.
| 1 | Date Capital Research and Management Company began managing the fund. |
| 2 | Sources: Bloomberg Index Services Ltd. and S&P Dow Jones Indices LLC. Blends the S&P 500 Composite Index with the Bloomberg Barclays U.S. Aggregate Index by weighting their total returns at 60% and 40%, respectively. Results assume the blend is rebalanced monthly. |
| 3 | Source: Bloomberg Index Services Ltd. The Bloomberg Barclays U.S. Aggregate Index did not exist until December 31, 1975. For the period between July 31, 1975, and December 31, 1975, Bloomberg Barclays Government/Credit Bond Index results were used. The Bloomberg Barclays indexes are based on July, 31, 1975, index value. |
| 4 | Source: Thompson Reuters Lipper. Lipper indexes track the largest mutual funds (no more than 30), represented by one share class per fund, in the corresponding Lipper category. |
In comparison, the fund’s benchmarks — the 60%/40% S&P 500 Index/Bloomberg Barclays U.S. Aggregate Index and the Lipper Balanced Funds Index — reported returns of 6.48% and 6.77%, respectively.
At American Funds, we are long-term investors, as are many of our shareholders who are saving for important goals such as a comfortable retirement. With that in mind, it is worth noting AMBAL’s five-, 10-year and lifetime results were 10.62%, 6.60% and 10.68%, respectively, and that they continue to outpace the long-term results of both indexes. (See “Results at a glance” chart.)
We remain dedicated to helping AMBAL’s shareholders realize the fund’s objectives of conservation of capital, while providing current income and seeking long-term growth of capital and income. Especially during a relatively calm environment when investors might underestimate the possibility of market risk, we take our pledge seriously to conserve capital in the event of unforeseen shifts in the market. While no one can consistently predict when declines will happen, it’s not unusual for fluctuations of 5% or more to occur about three times a year. And historically, we experience corrections of 10-20% every one to three-and-a-half years.
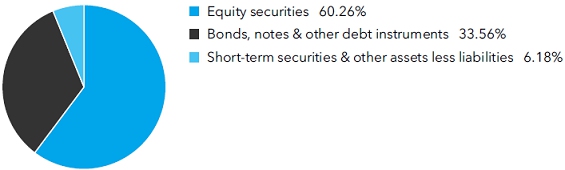
Asset allocation
AMBAL’s diversified portfolio is designed to help investors to take advantage of potential upside market opportunity while mitigating the downside effects of volatility over time. This is the hallmark of balanced investing.
We have the ability to adjust the fund’s asset allocation at any given point in order to achieve what we believe is the optimal balance of exposure to the equity and fixed income markets. At the end of 2013, during a period of strong market growth, the fund’s asset allocation was 74% equities, 23% fixed income and 3% cash. At one point in 2016, stocks were reduced to 53%, given the portfolio manager’s view that stock valuations were not as attractive as before. Since then, we’ve increased the equity portion again and the fund’s asset allocation has remained relatively consistent throughout 2017. On June 30, 2017, the mix was 60% equities, 34% fixed income and 6% cash.
Inside the portfolio
In AMBAL, balance is not only the allocation between equity and fixed income, it’s also the strategic diversification of investments in these areas.
Reviewing our top 10 holdings and the results we’ve achieved over the most recent six-month period, we feel that we did a relatively good job picking stocks for our shareholders. Our selections in the consumer discretionary sector lifted results, with Amazon serving as one of the top contributors to the fund. Likewise, strong returns from Philip Morris International helped boost the fund’s returns among consumer staples companies.
While our exposure to information technology companies lagged the broader market and held back relative results, our selection of Broadcom Limited — a semiconductor company and leader in wireless radio frequency solutions and high-speed opto-electronics — proved to be a strong contributor to the fund. Similarly, a smaller position in health care companies also detracted from relative results while still helping the fund.
On the other hand, our exposure to the energy sector, which was down 15% this year in the face of falling oil prices, held back returns — in particular, our investment in Schlumberger, a leading supplier of oil services.
In the bond market, yields generally fell for the first half of the year before leveling out at the end of June given a positive view of the economy. During this time, we reduced our exposure to U.S. Treasuries to a position below that of the overall U.S. bond market. We offset it with a meaningful increase in mortgage-backed securities and mortgage-structured investments, including agency pass-throughs (Fannie Mae, Freddie Mac and Ginnie Mae bonds). These investments and those we made in corporate bonds generated additive returns to the fund, relative to Treasuries, which detracted from relative returns.
We are optimistic about investment opportunities in both bonds and stocks as the year progresses.
Thank you
In the meantime, we welcome our many new shareholders to the fund, and appreciate the trust placed in us to help you pursue your financial goals. Rest assured, we will continue to follow our prudent, research-driven approach to investing that has characterized American Balanced Fund for over 40 years.
We look forward to reporting to you again in six months’ time.
Sincerely,

Gregory D. Johnson
Vice Chairman of the Board
and President
August 10, 2017
For current information about the fund, visit americanfunds.com.
| Summary investment portfolio June 30, 2017 | unaudited |
| | |
| Investment mix by security type | Percent of net assets |
| Common stocks 60.26% | | Shares | | | Value
(000) | |
| Information technology 13.16% | | | | | | |
| Microsoft Corp. | | | 62,012,000 | | | $ | 4,274,487 | |
| Broadcom Ltd. | | | 7,053,457 | | | | 1,643,808 | |
| Intel Corp. | | | 31,684,100 | | | | 1,069,022 | |
| Facebook, Inc., Class A1 | | | 6,272,000 | | | | 946,947 | |
| Alphabet Inc., Class C1 | | | 836,800 | | | | 760,425 | |
| ASML Holding NV (New York registered) | | | 5,117,458 | | | | 666,856 | |
| ASML Holding NV | | | 1,905,000 | | | | 248,258 | |
| Symantec Corp.2 | | | 32,026,000 | | | | 904,734 | |
| Apple Inc. | | | 5,438,000 | | | | 783,181 | |
| Taiwan Semiconductor Manufacturing Co., Ltd. (ADR) | | | 19,527,000 | | | | 682,664 | |
| Intuit Inc. | | | 4,598,277 | | | | 610,697 | |
| TE Connectivity Ltd. | | | 7,205,000 | | | | 566,889 | |
| Other securities | | | | | | | 1,767,367 | |
| | | | | | | | 14,925,335 | |
| | | | | | | | | |
| Consumer discretionary 9.17% | | | | | | | | |
| Home Depot, Inc. | | | 17,362,349 | | | | 2,663,384 | |
| Comcast Corp., Class A | | | 61,635,000 | | | | 2,398,834 | |
| Amazon.com, Inc.1 | | | 2,010,000 | | | | 1,945,680 | |
| McDonald’s Corp. | | | 3,493,000 | | | | 534,988 | |
| Other securities | | | | | | | 2,856,125 | |
| | | | | | | | 10,399,011 | |
| | | | | | | | | |
| Financials 7.77% | | | | | | | | |
| Berkshire Hathaway Inc., Class A1 | | | 7,972 | | | | 2,030,469 | |
| Berkshire Hathaway Inc., Class B1 | | | 800,000 | | | | 135,496 | |
| Wells Fargo & Co. | | | 24,943,500 | | | | 1,382,119 | |
| SunTrust Banks, Inc. | | | 16,126,083 | | | | 914,672 | |
| JPMorgan Chase & Co. | | | 9,753,000 | | | | 891,424 | |
| Chubb Ltd. | | | 6,070,500 | | | | 882,529 | |
| BlackRock, Inc. | | | 1,349,000 | | | | 569,831 | |
| Other securities | | | | | | | 2,001,554 | |
| | | | | | | | 8,808,094 | |
| | | Shares | | | Value
(000) | |
| Consumer staples 6.08% | | | | | | | | |
| Philip Morris International Inc. | | | 16,770,000 | | | $ | 1,969,637 | |
| Coca-Cola Co. | | | 32,173,000 | | | | 1,442,959 | |
| Kraft Heinz Co. | | | 11,710,850 | | | | 1,002,917 | |
| Altria Group, Inc. | | | 8,405,000 | | | | 625,920 | |
| Procter & Gamble Co. | | | 6,037,563 | | | | 526,174 | |
| Other securities | | | | | | | 1,327,040 | |
| | | | | | | | 6,894,647 | |
| | | | | | | | | |
| Energy 5.75% | | | | | | | | |
| Schlumberger Ltd. | | | 18,262,000 | | | | 1,202,370 | |
| Royal Dutch Shell PLC, Class B (ADR) | | | 18,493,000 | | | | 1,006,574 | |
| Royal Dutch Shell PLC, Class B | | | 4,000,000 | | | | 107,452 | |
| Chevron Corp. | | | 7,594,755 | | | | 792,361 | |
| Enbridge Inc. | | | 16,680,000 | | | | 664,031 | |
| Other securities | | | | | | | 2,748,113 | |
| | | | | | | | 6,520,901 | |
| | | | | | | | | |
| Health care 5.75% | | | | | | | | |
| UnitedHealth Group Inc. | | | 11,496,500 | | | | 2,131,681 | |
| Johnson & Johnson | | | 7,660,000 | | | | 1,013,341 | |
| Merck & Co., Inc. | | | 15,232,000 | | | | 976,219 | |
| Express Scripts Holding Co.1 | | | 10,676,400 | | | | 681,581 | |
| Medtronic PLC | | | 6,005,000 | | | | 532,944 | |
| Other securities | | | | | | | 1,181,784 | |
| | | | | | | | 6,517,550 | |
| | | | | | | | | |
| Industrials 3.22% | | | | | | | | |
| Boeing Co. | | | 6,876,600 | | | | 1,359,848 | |
| Lockheed Martin Corp. | | | 4,207,037 | | | | 1,167,916 | |
| Other securities | | | | | | | 1,118,658 | |
| | | | | | | | 3,646,422 | |
| | | | | | | | | |
| Materials 3.00% | | | | | | | | |
| E.I. du Pont de Nemours and Co. | | | 20,784,000 | | | | 1,677,477 | |
| Other securities | | | | | | | 1,725,652 | |
| | | | | | | | 3,403,129 | |
| | | | | | | | | |
| Real estate 1.48% | | | | | | | | |
| Crown Castle International Corp. REIT | | | 6,133,446 | | | | 614,448 | |
| Other securities | | | | | | | 1,060,193 | |
| | | | | | | | 1,674,641 | |
| | | | | | | | | |
| Other 0.76% | | | | | | | | |
| Other securities | | | | | | | 858,607 | |
| | | | | | | | | |
| Miscellaneous 4.12% | | | | | | | | |
| Other common stocks in initial period of acquisition | | | | | | | 4,667,855 | |
| | | | | | | | | |
| Total common stocks (cost: $44,241,086,000) | | | | | | | 68,316,192 | |
| Preferred securities 0.00% | | Shares | | | Value
(000) | |
| Financials 0.00% | | | | | | | | |
| Other securities | | | | | | $ | 4,627 | |
| | | | | | | | | |
| Total preferred securities (cost: $5,208,000) | | | | | | | 4,627 | |
| | | | | | | | | |
| Bonds, notes & other debt instruments 33.56% | | | Principal amount
(000) | | | | | |
| Corporate bonds & notes 12.52% | | | | | | | | |
| Financials 3.01% | | | | | | | | |
| Berkshire Hathaway Finance Corp. 1.30% 2019 | | $ | 15,320 | | | | 15,214 | |
| Berkshire Hathaway Inc. 2.00%–2.90% 2018–2023 | | | 42,835 | | | | 43,461 | |
| JPMorgan Chase & Co. 2.25%–6.75% 2020–2049 | | | 256,220 | | | | 262,974 | |
| Wells Fargo & Co. 2.10%–4.60% 2019–2028 | | | 240,007 | | | | 242,695 | |
| Other securities | | | | | | | 2,849,917 | |
| | | | | | | | 3,414,261 | |
| | | | | | | | | |
| Health care 1.68% | | | | | | | | |
| Johnson & Johnson 2.25%–3.75% 2022–2047 | | | 87,610 | | | | 89,329 | |
| UnitedHealth Group Inc. 1.40%–6.00% 2017–2022 | | | 86,600 | | | | 88,169 | |
| Other securities | | | | | | | 1,729,855 | |
| | | | | | | | 1,907,353 | |
| | | | | | | | | |
| Energy 1.58% | | | | | | | | |
| Royal Dutch Shell PLC 1.75%–3.75% 2021–2046 | | | 40,655 | | | | 38,912 | |
| Schlumberger BV 3.00%–4.00% 2020–20253 | | | 51,440 | | | | 53,470 | |
| Shell International Finance BV 2.25%–2.88% 2020–2026 | | | 60,950 | | | | 61,171 | |
| Other securities | | | | | | | 1,641,639 | |
| | | | | | | | 1,795,192 | |
| | | | | | | | | |
| Consumer discretionary 1.46% | | | | | | | | |
| Amazon.com, Inc. 3.80%–4.95% 2024–2044 | | | 55,475 | | | | 59,877 | |
| Comcast Corp. 1.63%–6.45% 2017–2045 | | | 118,965 | | | | 124,033 | |
| Home Depot, Inc. 1.80%–5.95% 2020–2047 | | | 129,930 | | | | 133,812 | |
| Other securities | | | | | | | 1,335,873 | |
| | | | | | | | 1,653,595 | |
| | | | | | | | | |
| Utilities 1.23% | | | | | | | | |
| Other securities | | | | | | | 1,399,199 | |
| |
| Consumer staples 0.91% | | | | | | | | |
| Philip Morris International Inc. 1.88%–4.25% 2020–2044 | | | 121,975 | | | | 123,048 | |
| Other securities | | | | | | | 908,297 | |
| | | | | | | | 1,031,345 | |
| | | | | | | | | |
| Information technology 0.73% | | | | | | | | |
| Broadcom Ltd. 2.38%–3.88% 2020–20273 | | | 317,135 | | | | 323,923 | |
| Microsoft Corp. 1.55%–4.20% 2021–2046 | | | 204,690 | | | | 206,442 | |
| Other securities | | | | | | | 291,066 | |
| | | | | | | | 821,431 | |
| | | | | | | | | |
| Industrials 0.57% | | | | | | | | |
| Lockheed Martin Corp. 3.10%–4.70% 2023–2046 | | | 64,250 | | | | 67,690 | |
| Other securities | | | | | | | 574,126 | |
| | | | | | | | 641,816 | |
| | | | | | | | | |
| Other corporate bonds & notes 1.35% | | | | | | | | |
| Other securities | | | | | | | 1,530,840 | |
| | | | | | | | | |
| Total corporate bonds & notes | | | | | | | 14,195,032 | |
| | Principal amount
(000) | | | Value
(000) | |
| U.S. Treasury bonds & notes 11.20% | | | | | | | | |
| U.S. Treasury 9.16% | | | | | | | | |
| U.S. Treasury 1.25% 2020 | | $ | 617,000 | | | $ | 613,212 | |
| U.S. Treasury 1.875% 2022 | | | 890,000 | | | | 890,525 | |
| U.S. Treasury 2.25% 2023 | | | 625,250 | | | | 631,477 | |
| U.S. Treasury 2.375% 2027 | | | 857,924 | | | | 863,689 | |
| U.S. Treasury 2.875% 2046 | | | 575,130 | | | | 579,196 | |
| U.S. Treasury 3.00% 2047 | | | 657,681 | | | | 679,463 | |
| U.S. Treasury 0.63%–5.38% 2018–2047 | | | 6,171,785 | | | | 6,131,569 | |
| | | | | | | | 10,389,131 | |
| | | | | | | | | |
| U.S. Treasury inflation-protected securities 2.03% | | | | | | | | |
| U.S. Treasury Inflation-Protected Securities 0.13%–2.63% 2017–20474 | | | 2,287,537 | | | | 2,297,348 | |
| |
| Federal agency bonds & notes 0.01% | | | | | | | | |
| Other securities | | | | | | | 10,015 | |
| | | | | | | | | |
| Total U.S. Treasury bonds & notes | | | | | | | 12,696,494 | |
| | | | | | | | | |
| Mortgage-backed obligations 7.58% | | | | | | | | |
| Fannie Mae 0%–11.01% 2017–20565,6,7 | | | 3,634,579 | | | | 3,772,743 | |
| Freddie Mac 4.00% 20475 | | | 651,773 | | | | 686,519 | |
| Freddie Mac 0%–6.50% 2022–20505,6,7 | | | 2,029,280 | | | | 2,114,457 | |
| Government National Mortgage Assn. 4.00%–10.00% 2021–20615,7 | | | 1,187,681 | | | | 1,256,597 | |
| Other securities | | | | | | | 764,467 | |
| | | | | | | | 8,594,783 | |
| | | | | | | | | |
| Asset-backed obligations 1.49% | | | | | | | | |
| Other securities | | | | | | | 1,690,483 | |
| |
| Federal agency bonds & notes 0.26% | | | | | | | | |
| Fannie Mae 2.00%–6.25% 2022–2029 | | | 79,510 | | | | 80,089 | |
| Federal Home Loan Bank 0.88%–5.50% 2018–2036 | | | 120,240 | | | | 121,565 | |
| Freddie Mac 0.75% 2018 | | | 60,732 | | | | 60,521 | |
| Other securities | | | | | | | 27,882 | |
| | | | | | | | 290,057 | |
| | | | | | | | | |
| Other bonds & notes 0.45% | | | | | | | | |
| Other securities | | | | | | | 512,876 | |
| |
| Miscellaneous 0.06% | | | | | | | | |
| Other bonds & notes in initial period of acquisition | | | | | | | 68,223 | |
| | | | | | | | | |
| Total bonds, notes & other debt instruments (cost: $37,642,765,000) | | | | | | | 38,047,948 | |
| |
| Short-term securities 8.15% | | | | | | | | |
| Chariot Funding, LLC 1.00% due 7/12/20173 | | | 100,000 | | | | 99,960 | |
| Coca-Cola Co. 1.00% due 7/17/20173 | | | 25,000 | | | | 24,987 | |
| Federal Home Loan Bank 0.64%–1.05% due 7/3/2017–10/10/2017 | | | 5,316,960 | | | | 5,310,535 | |
| Freddie Mac 0.80%–0.99% due 8/2/2017–10/11/2017 | | | 650,000 | | | | 648,959 | |
| Johnson & Johnson 1.08%–1.12% due 9/6/2017–9/19/20173 | | | 265,200 | | | | 264,560 | |
| Microsoft Corp. 0.89% due 7/7/20173 | | | 50,000 | | | | 49,989 | |
| Short-term securities (continued) | Principal amount
(000) | | | Value
(000) | |
| U.S. Treasury Bills 0.59%–1.08% due 7/6/2017–12/21/2017 | | $ | 1,542,900 | | | $ | 1,539,243 | |
| Other securities | | | | | | | 1,299,853 | |
| | | | | | | | | |
| Total short-term securities (cost: $9,237,740,000) | | | | | | | 9,238,086 | |
| Total investment securities 101.97% (cost: $91,126,799,000) | | | | | | | 115,606,853 | |
| Other assets less liabilities (1.97)% | | | | | | | (2,231,869 | ) |
| | | | | | | | | |
| Net assets 100.00% | | | | | | $ | 113,374,984 | |
This summary investment portfolio is designed to streamline the report and help investors better focus on the fund’s principal holdings. See the inside back cover for details on how to obtain a complete schedule of portfolio holdings.
As permitted by U.S. Securities and Exchange Commission regulations, “Miscellaneous” securities include holdings in their first year of acquisition that have not previously been publicly disclosed.
“Other securities” includes all issues that are not disclosed separately in the summary investment portfolio. “Other securities” includes securities which were valued under fair value procedures adopted by authority of the board of trustees. The total value of securities which were valued under fair value procedures was $122,709,000, which represented .11% of the net assets of the fund.
Investments in affiliates
A company is an affiliate of the fund under the Investment Company Act of 1940 if the fund’s holdings in that company represent 5% or more of the outstanding voting shares. The value of the fund’s affiliated-company holdings is either shown in the summary investment portfolio or included in the value of “Other securities” under the respective industry sectors. Further details on such holdings and related transactions during the six months ended June 30, 2017, appear below.
| | | Beginning
shares | | | Additions | | | Reductions | | | Ending
shares | |
| Symantec Corp.8 | | | 30,540,000 | | | | 1,486,000 | | | | — | | | | 32,026,000 | |
| VeriSign, Inc.1 | | | 5,500,000 | | | | — | | | | — | | | | 5,500,000 | |
| Royal Gold, Inc. | | | 1,770,000 | | | | 1,693,000 | | | | — | | | | 3,463,000 | |
| | | Net realized
gain
(000) | | | Net unrealized
appreciation
(000) | | | Dividend
income
(000) | | | Value of
affiliates at
6/30/2017
(000) | |
| Symantec Corp.8 | | $ | — | | | $ | 135,294 | | | $ | 4,770 | | | $ | 904,734 | |
| VeriSign, Inc.1 | | | — | | | | 92,895 | | | | — | | | | 511,280 | |
| Royal Gold, Inc. | | | — | | | | 35,920 | | | | 1,052 | | | | 270,703 | |
| | | $ | — | | | $ | 264,109 | | | $ | 5,822 | | | $ | 1,686,717 | |
The following footnotes apply to either the individual securities noted or one or more of the securities aggregated and listed as a single line item.
| 1 | Security did not produce income during the last 12 months. |
| 2 | Represents an affiliated company as defined under the Investment Company Act of 1940. |
| 3 | Acquired in a transaction exempt from registration under Rule 144A or Section 4(2) of the Securities Act of 1933. May be resold in the U.S. in transactions exempt from registration, normally to qualified institutional buyers. The total value of all such securities, including those in “Other securities,” was $5,557,884,000, which represented 4.90% of the net assets of the fund. |
| 4 | Index-linked bond whose principal amount moves with a government price index. |
| 5 | Principal payments may be made periodically. Therefore, the effective maturity date may be earlier than the stated maturity date. |
| 6 | Coupon rate may change periodically. |
| 7 | Purchased on a TBA basis. |
| 8 | This security was an unaffiliated issuer in its initial period of acquisition at 12/31/2016; it was not publicly disclosed. |
Key to abbreviations
ADR = American Depositary Receipts
TBA = To-be-announced
See Notes to Financial Statements
Financial statements
Statement of assets and liabilities
at June 30, 2017 | unaudited
(dollars in thousands) |
| Assets: | | | | | | | | |
| Investment securities, at value: | | | | | | | | |
| Unaffiliated issuers (cost: $89,851,360) | | $ | 113,920,136 | | | | | |
| Affiliated issuers (cost: $1,275,439) | | | 1,686,717 | | | $ | 115,606,853 | |
| Cash | | | | | | | 109,496 | |
| Receivables for: | | | | | | | | |
| Sales of investments | | | 3,143,749 | | | | | |
| Sales of fund’s shares | | | 369,182 | | | | | |
| Dividends and interest | | | 319,198 | | | | | |
| Other | | | 235 | | | | 3,832,364 | |
| | | | | | | | 119,548,713 | |
| Liabilities: | | | | | | | | |
| Payables for: | | | | | | | | |
| Purchases of investments | | | 5,809,738 | | | | | |
| Repurchases of fund’s shares | | | 300,877 | | | | | |
| Investment advisory services | | | 20,914 | | | | | |
| Services provided by related parties | | | 31,503 | | | | | |
| Trustees’ deferred compensation | | | 4,053 | | | | | |
| Other | | | 6,644 | | | | 6,173,729 | |
| Net assets at June 30, 2017 | | | | | | $ | 113,374,984 | |
| | | | | | | | | |
| Net assets consist of: | | | | | | | | |
| Capital paid in on shares of beneficial interest | | | | | | $ | 86,133,546 | |
| Undistributed net investment income | | | | | | | 203,212 | |
| Undistributed net realized gain | | | | | | | 2,558,176 | |
| Net unrealized appreciation | | | | | | | 24,480,050 | |
| Net assets at June 30, 2017 | | | | | | $ | 113,374,984 | |
| | | | | | | | | |
See Notes to Financial Statements
(dollars and shares in thousands, except per-share amounts)
Shares of beneficial interest issued and outstanding (no stated par value) —
unlimited shares authorized (4,337,395 total shares outstanding)
| | | Net assets | | | Shares
outstanding | | | Net asset
value per share | |
| Class A | | $ | 59,280,121 | | | | 2,265,933 | | | $ | 26.16 | |
| Class C | | | 8,327,544 | | | | 320,218 | | | | 26.01 | |
| Class T | | | 10 | | | | — | * | | | 26.16 | |
| Class F-1 | | | 4,580,467 | | | | 175,227 | | | | 26.14 | |
| Class F-2 | | | 6,894,990 | | | | 263,715 | | | | 26.15 | |
| Class F-3 | | | 1,446,740 | | | | 55,322 | | | | 26.15 | |
| Class 529-A | | | 3,373,901 | | | | 129,165 | | | | 26.12 | |
| Class 529-C | | | 1,044,605 | | | | 40,021 | | | | 26.10 | |
| Class 529-E | | | 165,001 | | | | 6,320 | | | | 26.11 | |
| Class 529-T | | | 10 | | | | — | * | | | 26.16 | |
| Class 529-F-1 | | | 156,821 | | | | 6,008 | | | | 26.10 | |
| Class R-1 | | | 136,658 | | | | 5,258 | | | | 25.99 | |
| Class R-2 | | | 1,241,050 | | | | 47,725 | | | | 26.00 | |
| Class R-2E | | | 31,184 | | | | 1,196 | | | | 26.08 | |
| Class R-3 | | | 3,449,462 | | | | 132,501 | | | | 26.03 | |
| Class R-4 | | | 6,227,069 | | | | 238,442 | | | | 26.12 | |
| Class R-5E | | | 3,895 | | | | 149 | | | | 26.13 | |
| Class R-5 | | | 2,010,440 | | | | 76,776 | | | | 26.19 | |
| Class R-6 | | | 15,005,016 | | | | 573,419 | | | | 26.17 | |
| * | Amount less than one thousand. |
See Notes to Financial Statements
Statement of operations
for the six months ended June 30, 2017 | unaudited
(dollars in thousands) |
| Investment income: | | | | | | | | |
| Income: | | | | | | | | |
| Dividends (net of non-U.S. taxes of $13,592; also includes $5,822 from affiliates) | | $ | 772,623 | | | | | |
| Interest | | | 479,579 | | | $ | 1,252,202 | |
| Fees and expenses*: | | | | | | | | |
| Investment advisory services | | | 120,556 | | | | | |
| Distribution services | | | 144,218 | | | | | |
| Transfer agent services | | | 44,910 | | | | | |
| Administrative services | | | 15,307 | | | | | |
| Reports to shareholders | | | 1,843 | | | | | |
| Registration statement and prospectus | | | 3,725 | | | | | |
| Trustees’ compensation | | | 527 | | | | | |
| Auditing and legal | | | 67 | | | | | |
| Custodian | | | 334 | | | | | |
| Other | | | 1,892 | | | | 333,379 | |
| Net investment income | | | | | | | 918,823 | |
| | | | | | | | | |
| Net realized gain and unrealized appreciation: | | | | | | | | |
| Net realized gain (loss) on: | | | | | | | | |
| Investments in unaffiliated issuers | | | 2,661,183 | | | | | |
| Currency transactions | | | (1,919 | ) | | | 2,659,264 | |
| Net unrealized appreciation on: | | | | | | | | |
| Investments (net of non-U.S. taxes of $238): | | | | | | | | |
| Unffiliated issuers | | | 2,992,681 | | | | | |
| Affiliated issuers | | | 264,109 | | | | | |
| Currency translations | | | 204 | | | | 3,256,994 | |
| Net realized gain and unrealized appreciation | | | | | | | 5,916,258 | |
| | | | | | | | | |
| Net increase in net assets resulting from operations | | | | | | $ | 6,835,081 | |
| * | Additional information related to class-specific fees and expenses is included in the Notes to Financial Statements. |
See Notes to Financial Statements
| Statements of changes in net assets | |
| | (dollars in thousands) |
| | | Six months ended
June 30, 2017* | | | Year ended
December 31, 2016 | |
| | | | | | | | | |
| Operations: | | | | | | | | |
| Net investment income | | $ | 918,823 | | | $ | 1,495,733 | |
| Net realized gain | | | 2,659,264 | | | | 2,500,127 | |
| Net unrealized appreciation | | | 3,256,994 | | | | 3,673,561 | |
| Net increase in net assets resulting from operations | | | 6,835,081 | | | | 7,669,421 | |
| | | | | | | | | |
| Dividends and distributions paid to shareholders: | | | | | | | | |
| Dividends from net investment income | | | (818,718 | ) | | | (1,636,470 | ) |
| Distributions from net realized gain on investments | | | (424,407 | ) | | | (2,406,499 | ) |
| Total dividends and distributions paid to shareholders | | | (1,243,125 | ) | | | (4,042,969 | ) |
| | | | | | | | | |
| Net capital share transactions | | | 6,652,968 | | | | 12,936,574 | |
| | | | | | | | | |
| Total increase in net assets | | | 12,244,924 | | | | 16,563,026 | |
| | | | | | | | | |
| Net assets: | | | | | | | | |
| Beginning of period | | | 101,130,060 | | | | 84,567,034 | |
| End of period (including undistributed net investment income: $203,212 and $103,107, respectively) | | $ | 113,374,984 | | | $ | 101,130,060 | |
See Notes to Financial Statements
| Notes to financial statements | unaudited |
1. Organization
American Balanced Fund (the “fund”) is registered under the Investment Company Act of 1940 as an open-end, diversified management investment company. The fund seeks conservation of capital, current income and long-term growth of capital and income.
The fund has 19 share classes consisting of six retail share classes (Classes A, C, T, F-1, F-2 and F-3), five 529 college savings plan share classes (Classes 529-A, 529-C, 529-E, 529-T and 529-F-1) and eight retirement plan share classes (Classes R-1, R-2, R-2E, R-3, R-4, R-5E, R-5 and R-6). The 529 college savings plan share classes can be used to save for college education. The retirement plan share classes are generally offered only through eligible employer-sponsored retirement plans. The fund’s share classes are described further in the following table:
| Share class | | Initial sales
charge | | Contingent deferred sales
charge upon redemption | | Conversion feature |
| Classes A and 529-A | | Up to 5.75% | | None (except 1% for certain redemptions within one year of purchase without an initial sales charge) | | None |
| Class C | | None | | 1% for redemptions within one year of purchase | | Class C converts to Class F-1 after 10 years |
| Class 529-C | | None | | 1% for redemptions within one year of purchase | | None |
| Class 529-E | | None | | None | | None |
| Classes T and 529-T* | | Up to 2.50% | | None | | None |
| Classes F-1, F-2, F-3 and 529-F-1 | | None | | None | | None |
| Classes R-1, R-2, R-2E, R-3, R-4, R-5E, R-5 and R-6 | | None | | None | | None |
| * | Class T and 529-T shares are not available for purchase. |
Holders of all share classes have equal pro rata rights to the assets, dividends and liquidation proceeds of the fund. Each share class has identical voting rights, except for the exclusive right to vote on matters affecting only its class. Share classes have different fees and expenses (“class-specific fees and expenses”), primarily due to different arrangements for distribution, transfer agent and administrative services. Differences in class-specific fees and expenses will result in differences in net investment income and, therefore, the payment of different per-share dividends by each share class.
2. Significant accounting policies
The fund is an investment company that applies the accounting and reporting guidance issued in Topic 946 by the U.S. Financial Accounting Standards Board. The fund’s financial statements have been prepared to comply with U.S. generally accepted accounting principles (“U.S. GAAP”). These principles require the fund’s investment adviser to make
estimates and assumptions that affect reported amounts and disclosures. Actual results could differ from those estimates. Subsequent events, if any, have been evaluated through the date of issuance in the preparation of the financial statements. The fund follows the significant accounting policies described in this section, as well as the valuation policies described in the next section on valuation.
Cash — Cash includes amounts held in an interest bearing deposit facility.
Security transactions and related investment income — Security transactions are recorded by the fund as of the date the trades are executed with brokers. Realized gains and losses from security transactions are determined based on the specific identified cost of the securities. In the event a security is purchased with a delayed payment date, the fund will segregate liquid assets sufficient to meet its payment obligations. Dividend income is recognized on the ex-dividend date and interest income is recognized on an accrual basis. Market discounts, premiums and original issue discounts on fixed-income securities are amortized daily over the expected life of the security.
Class allocations — Income, fees and expenses (other than class-specific fees and expenses) and realized and unrealized gains and losses are allocated daily among the various share classes based on their relative net assets. Class-specific fees and expenses, such as distribution, transfer agent and administrative services, are charged directly to the respective share class.
Dividends and distributions to shareholders — Dividends and distributions to shareholders are recorded on the ex-dividend date.
Currency translation — Assets and liabilities, including investment securities, denominated in currencies other than U.S. dollars are translated into U.S. dollars at the exchange rates supplied by one or more pricing vendors on the valuation date. Purchases and sales of investment securities and income and expenses are translated into U.S. dollars at the exchange rates on the dates of such transactions. The effects of changes in exchange rates on investment securities are included with the net realized gain or loss and net unrealized appreciation or depreciation on investments in the fund’s statement of operations. The realized gain or loss and unrealized appreciation or depreciation resulting from all other transactions denominated in currencies other than U.S. dollars are disclosed separately.
3. Valuation
Capital Research and Management Company (“CRMC”), the fund’s investment adviser, values the fund’s investments at fair value as defined by U.S. GAAP. The net asset value of each share class of the fund is generally determined as of approximately 4:00 p.m. New York time each day the New York Stock Exchange is open.
Methods and inputs — The fund’s investment adviser uses the following methods and inputs to establish the fair value of the fund’s assets and liabilities. Use of particular methods and inputs may vary over time based on availability and relevance as market and economic conditions evolve.
Equity securities are generally valued at the official closing price of, or the last reported sale price on, the exchange or market on which such securities are traded, as of the close of business on the day the securities are being valued or, lacking any sales, at the last available bid price. Prices for each security are taken from the principal exchange or market on which the security trades.
Fixed-income securities, including short-term securities, are generally valued at prices obtained from one or more pricing vendors. Vendors value such securities based on one or more of the inputs described in the following table. The table provides examples of inputs that are commonly relevant for valuing particular classes of fixed-income securities in which the fund is authorized to invest. However, these classifications are not exclusive, and any of the inputs may be used to value any other class of fixed-income security.
| Fixed-income class | | Examples of standard inputs |
| All | | Benchmark yields, transactions, bids, offers, quotations from dealers and trading systems, new issues, spreads and other relationships observed in the markets among comparable securities; and proprietary pricing models such as yield measures calculated using factors such as cash flows, financial or collateral performance and other reference data (collectively referred to as “standard inputs”) |
| Corporate bonds & notes; convertible securities | | Standard inputs and underlying equity of the issuer |
| Bonds & notes of governments & government agencies | | Standard inputs and interest rate volatilities |
| Mortgage-backed; asset-backed obligations | | Standard inputs and cash flows, prepayment information, default rates, delinquency and loss assumptions, collateral characteristics, credit enhancements and specific deal information |
| Municipal securities | | Standard inputs and, for certain distressed securities, cash flows or liquidation values using a net present value calculation based on inputs that include, but are not limited to, financial statements and debt contracts |
When the fund’s investment adviser deems it appropriate to do so (such as when vendor prices are unavailable or deemed to be not representative), fixed-income securities will be valued in good faith at the mean quoted bid and ask prices that are reasonably and timely available (or bid prices, if ask prices are not available) or at prices for securities of comparable maturity, quality and type.
Securities with both fixed-income and equity characteristics, or equity securities traded principally among fixed-income dealers, are generally valued in the manner described for either equity or fixed-income securities, depending on which method is deemed most appropriate by the fund’s investment adviser.
Securities and other assets for which representative market quotations are not readily available or are considered unreliable by the fund’s investment adviser are fair valued as determined in good faith under fair valuation guidelines adopted by authority of the fund’s board of trustees as further described. The investment adviser follows fair valuation guidelines, consistent with U.S. Securities and Exchange Commission rules and guidance, to consider relevant principles and factors when making fair value determinations. The investment adviser considers relevant indications of value that are reasonably and timely available to it in determining the fair value to be assigned to a particular security, such as the type and cost of the security; contractual or legal restrictions on resale of the security; relevant financial or business developments of the issuer; actively traded similar or related securities; conversion or exchange rights on the security; related corporate actions; significant events occurring after the close of trading in the security; and changes in overall market conditions. In addition, the closing prices of equity securities that trade in markets outside U.S. time zones may be adjusted to reflect significant events that occur after the close of local trading but before the net asset value of each share class of the fund is determined. Fair valuations and valuations of investments that are not actively trading involve judgment and may differ materially from valuations that would have been used had greater market activity occurred.
Processes and structure — The fund’s board of trustees has delegated authority to the fund’s investment adviser to make fair value determinations, subject to board oversight. The investment adviser has established a Joint Fair Valuation Committee (the “Fair Valuation Committee”) to administer, implement and oversee the fair valuation process, and to make fair value decisions. The Fair Valuation Committee regularly reviews its own fair value decisions, as well as decisions made under its standing instructions to the investment adviser’s valuation teams. The Fair Valuation Committee reviews changes in fair value measurements from period to period and may, as deemed appropriate, update the fair valuation guidelines to better reflect the results of back testing and address new or evolving issues. The Fair Valuation Committee reports any changes to the fair valuation guidelines to the board of trustees with supplemental information to support the changes. The fund’s board and audit committee also regularly review reports that describe fair value determinations and methods.
The fund’s investment adviser has also established a Fixed-Income Pricing Review Group to administer and oversee the fixed-income valuation process, including the use of fixed-income pricing vendors. This group regularly reviews pricing vendor information and market data. Pricing decisions, processes and controls over security valuation are also subject to additional internal reviews, including an annual control self-evaluation program facilitated by the investment adviser’s compliance group.
Classifications — The fund’s investment adviser classifies the fund’s assets and liabilities into three levels based on the inputs used to value the assets or liabilities. Level 1 values are based on quoted prices in active markets for identical securities. Level 2 values are based on significant observable market inputs, such as quoted prices for similar securities and quoted prices in inactive markets. Certain securities trading outside the U.S. may transfer between Level 1 and Level 2 due to valuation adjustments resulting from significant market movements following the close of local trading. Level 3 values are based on significant unobservable inputs that reflect the investment adviser’s determination of assumptions that market participants might reasonably use in valuing the securities. The valuation levels are not necessarily an indication of the risk or liquidity associated with the underlying investment. For example, U.S. government securities are reflected as Level 2 because the inputs used to determine fair value may not always be quoted prices in an active market. The following table presents the fund’s valuation levels as of June 30, 2017 (dollars in thousands):
| | | Investment securities | |
| | | Level 1* | | | Level 2 | | | Level 3 | | | Total | |
| Assets: | | | | | | | | | | | | | | | | |
| Common stocks: | | | | | | | | | | | | | | | | |
| Information technology | | $ | 14,925,335 | | | $ | — | | | $ | — | | | $ | 14,925,335 | |
| Consumer discretionary | | | 10,399,011 | | | | — | | | | — | | | | 10,399,011 | |
| Financials | | | 8,698,052 | | | | 110,042 | | | | — | | | | 8,808,094 | |
| Consumer staples | | | 6,894,647 | | | | — | | | | — | | | | 6,894,647 | |
| Energy | | | 6,520,901 | | | | — | | | | — | | | | 6,520,901 | |
| Health care | | | 6,517,550 | | | | — | | | | — | | | | 6,517,550 | |
| Industrials | | | 3,646,422 | | | | — | | | | — | | | | 3,646,422 | |
| Materials | | | 3,403,129 | | | | — | | | | — | | | | 3,403,129 | |
| Real estate | | | 1,674,641 | | | | — | | | | — | | | | 1,674,641 | |
| Other | | | 858,607 | | | | — | | | | — | | | | 858,607 | |
| Miscellaneous | | | 4,667,855 | | | | — | | | | — | | | | 4,667,855 | |
| Preferred securities | | | — | | | | 4,627 | | | | — | | | | 4,627 | |
| Bonds, notes & other debt instruments: | | | | | | | | | | | | | | | | |
| Corporate bonds & notes | | | — | | | | 14,193,613 | | | | 1,419 | | | | 14,195,032 | |
| U.S. Treasury bonds & notes | | | — | | | | 12,696,494 | | | | — | | | | 12,696,494 | |
| Mortgage-backed obligations | | | — | | | | 8,594,783 | | | | — | | | | 8,594,783 | |
| Asset-backed obligations | | | — | | | | 1,690,483 | | | | — | | | | 1,690,483 | |
| Federal agency bonds & notes | | | — | | | | 290,057 | | | | — | | | | 290,057 | |
| Other bonds & notes | | | — | | | | 512,876 | | | | — | | | | 512,876 | |
| Miscellaneous | | | — | | | | 68,223 | | | | — | | | | 68,223 | |
| Short-term securities | | | — | | | | 9,238,086 | | | | — | | | | 9,238,086 | |
| Total | | $ | 68,206,150 | | | $ | 47,399,284 | | | $ | 1,419 | | | $ | 115,606,853 | |
| * | Securities with a value of $1,761,640,000, which represented 1.55% of the net assets of the fund, transferred from Level 2 to Level 1 since the prior fiscal year-end, primarily due to a lack of significant market movements following the close of local trading. |
4. Risk factors
Investing in the fund may involve certain risks including, but not limited to, those described below.
Market conditions — The prices of, and the income generated by, the common stocks, bonds and other securities held by the fund may decline — sometimes rapidly or unpredictably — due to various factors, including events or conditions affecting the general economy or particular industries; overall market changes; local, regional or global political, social or economic instability; governmental or governmental agency responses to economic conditions; and currency exchange rate, interest rate and commodity price fluctuations.
Issuer risks — The prices of, and the income generated by, securities held by the fund may decline in response to various factors directly related to the issuers of such securities, including reduced demand for an issuer’s goods or services, poor management performance and strategic initiatives such as mergers, acquisitions or dispositions and the market response to any such initiatives.
Investing in growth-oriented stocks — Growth-oriented common stocks and other equity-type securities (such as preferred stocks, convertible preferred stocks and convertible bonds) may involve larger price swings and greater potential for loss than other types of investments.
Investing in income-oriented stocks — Income provided by the fund may be reduced by changes in the dividend policies of, and the capital resources available for dividend payments at, the companies in which the fund invests.
Investing in debt instruments — The prices of, and the income generated by, bonds and other debt securities held by the fund may be affected by changing interest rates and by changes in the effective maturities and credit ratings of these securities.
Rising interest rates will generally cause the prices of bonds and other debt securities to fall. Falling interest rates may cause an issuer to redeem, call or refinance a debt security before its stated maturity, which may result in the fund having to reinvest the proceeds in lower yielding securities. Longer maturity debt securities generally have greater sensitivity to changes in interest rates and may be subject to greater price fluctuations than shorter maturity debt securities.
Bonds and other debt securities are also subject to credit risk, which is the possibility that the credit strength of an issuer will weaken and/or an issuer of a debt security will fail to make timely payments of principal or interest and the security will go into default. Lower quality debt securities generally have higher rates of interest and may be subject to greater price fluctuations than higher quality debt securities. Credit risk is gauged, in part, by the credit ratings of the debt securities in which the fund invests. However, ratings are only the opinions of the rating agencies issuing them and are not guarantees as to credit quality or an evaluation of market risk. The fund’s investment adviser relies on its own credit analysts to research issuers and issues in seeking to mitigate various credit and default risks.
Investing in securities backed by the U.S. government — Securities backed by the U.S. Treasury or the full faith and credit of the U.S. government are guaranteed only as to the timely payment of interest and principal when held to maturity. Accordingly, the current market values for these securities will fluctuate with changes in interest rates. Securities issued by government-sponsored entities and federal agencies and instrumentalities that are not backed by the full faith and credit of the U.S. government are neither issued nor guaranteed by the U.S. government.
Investing in mortgage-related and other asset-backed securities — Mortgage-related securities, such as mortgage-backed securities, and other asset-backed securities, include debt obligations that represent interests in pools of mortgages or other income-bearing assets, such as consumer loans or receivables. Such securities often involve risks that are different from or more acute than the risks associated with investing in other types of debt securities. Mortgage-backed and other asset-backed securities are subject to changes in the payment patterns of borrowers of the underlying debt. When interest rates fall, borrowers are more likely to refinance or prepay their debt before its stated maturity. This may result in the fund having to reinvest the proceeds in lower yielding securities, effectively reducing the fund’s income. Conversely, if interest rates rise and borrowers repay their debt more slowly than expected, the time in which the mortgage-backed and other asset-backed securities are paid off could be extended, reducing the fund’s cash available for reinvestment in higher yielding securities.
Liquidity risk — Certain fund holdings may be deemed to be less liquid or illiquid because they cannot be readily sold without significantly impacting the value of the holdings. Liquidity risk may result from the lack of an active market for a holding, legal or contractual restrictions on resale, or the reduced number and capacity of market participants to make a market in such holding. Market prices for less liquid or illiquid holdings may be volatile, and reduced liquidity may have an adverse impact on the market price of such holdings. Additionally, the sale of less liquid or illiquid holdings may involve substantial delays (including delays in settlement) and additional costs and the fund may be unable to sell such holdings when necessary to meet its liquidity needs.
Investing outside the U.S. — Securities of issuers domiciled outside the U.S., or with significant operations or revenues outside the U.S., may lose value because of adverse political, social, economic or market developments (including social instability, regional conflicts, terrorism and war) in the countries or regions in which the issuers operate or generate revenue. These securities may also lose value due to changes in foreign currency exchange rates against the U.S. dollar and/or currencies of other countries. Issuers of these securities may be more susceptible to actions of foreign governments, such as the imposition of price controls or punitive taxes, that could adversely impact the value of these securities. Securities markets in certain countries may be more volatile and/or less liquid than those in the U.S. Investments outside the U.S. may also be subject to different accounting practices and different regulatory, legal and reporting standards and practices, and may be more difficult to value, than those in the U.S. In addition, the value of investments outside the U.S. may be reduced by foreign taxes, including foreign
withholding taxes on interest and dividends. Further, there may be increased risks of delayed settlement of securities purchased or sold by the fund. The risks of investing outside the U.S. may be heightened in connection with investments in emerging markets.
Management — The investment adviser to the fund actively manages the fund’s investments. Consequently, the fund is subject to the risk that the methods and analyses employed by the investment adviser in this process may not produce the desired results. This could cause the fund to lose value or its investment results to lag relevant benchmarks or other funds with similar objectives.
5. Certain investment techniques
Index-linked bonds — The fund has invested in index-linked bonds, which are fixed-income securities whose principal value is periodically adjusted to a government price index. Over the life of an index-linked bond, interest is paid on the adjusted principal value. Increases or decreases in the principal value of index-linked bonds are recorded as interest income in the fund’s statement of operations.
Mortgage dollar rolls — The fund has entered into mortgage dollar roll transactions in which the fund sells a mortgage-backed security to a counterparty and simultaneously enters into an agreement with the same counterparty to buy back a similar security on a specific future date at a predetermined price. Mortgage dollar rolls are accounted for as purchase and sale transactions, which may increase the fund’s portfolio turnover rate.
Collateral — The fund participates in a collateral program due to its use of future delivery contracts. The program calls for the fund to either receive or pledge highly liquid assets, such as cash or U.S. Treasury bills, as collateral based on the net gain or loss on unsettled contracts by certain counterparties. The purpose of the collateral is to cover potential losses that could occur in the event that either party cannot meet its contractual obligations.
6. Taxation and distributions
Federal income taxation — The fund complies with the requirements under Subchapter M of the Internal Revenue Code applicable to mutual funds and intends to distribute substantially all of its net taxable income and net capital gains each year. The fund is not subject to income taxes to the extent such distributions are made. Therefore, no federal income tax provision is required.
As of and during the period ended June 30, 2017, the fund did not have a liability for any unrecognized tax benefits. The fund recognizes interest and penalties, if any, related to unrecognized tax benefits as income tax expense in the statement of operations. During the period, the fund did not incur any interest or penalties.
The fund is not subject to examination by U.S. federal tax authorities for tax years before 2013, by state tax authorities for tax years before 2012 and by tax authorities outside the U.S. for tax years before 2014.
Non-U.S. taxation — Dividend and interest income are recorded net of non-U.S. taxes paid. The fund may file withholding tax reclaims in certain jurisdictions to recover a portion of amounts previously withheld. As a result of rulings from European courts, the fund filed for additional reclaims related to prior years. These reclaims are recorded when the amount is known and there are no significant uncertainties on collectability.
Distributions — Distributions paid to shareholders are based on net investment income and net realized gains determined on a tax basis, which may differ from net investment income and net realized gains for financial reporting purposes. These differences are due primarily to different treatment for items such as currency gains and losses; short-term capital gains and losses; capital losses related to sales of certain securities within 30 days of purchase and paydowns on fixed-income securities. The fiscal year in which amounts are distributed may differ from the year in which the net investment income and net realized gains are recorded by the fund for financial reporting purposes.
The components of distributable earnings on a tax basis are reported as of the fund’s most recent year-end. As of December 31, 2016, the components of distributable earnings on a tax basis were as follows (dollars in thousands):
| Undistributed ordinary income | | $ | 105,397 | |
| Undistributed long-term capital gains | | | 421,244 | |
As of June 30, 2017, the tax basis unrealized appreciation (depreciation) and cost of investment securities were as follows (dollars in thousands):
| Gross unrealized appreciation on investment securities | | $ | 25,680,805 | |
| Gross unrealized depreciation on investment securities | | | (1,260,834 | ) |
| Net unrealized appreciation on investment securities | | | 24,419,971 | |
| Cost of investment securities | | | 91,186,882 | |
The tax character of distributions paid to shareholders was as follows (dollars in thousands):
| | | Six months ended June 30, 2017 | | | Year ended December 31, 2016 | |
| Share class | | Ordinary
income | | | Long-term
capital gains | | | Total
dividends and
distributions
paid | | | Ordinary
income | | | Long-term
capital gains | | | Total
dividends and
distributions
paid | |
| Class A | | $ | 449,109 | | | $ | 223,283 | | | $ | 672,392 | | | $ | 946,069 | | | $ | 1,330,543 | | | $ | 2,276,612 | |
| Class B1 | | | — | | | | — | | | | — | | | | 1,060 | | | | 2,173 | | | | 3,233 | |
| Class C | | | 31,156 | | | | 31,535 | | | | 62,691 | | | | 73,871 | | | | 185,174 | | | | 259,045 | |
| Class T2 | | | — | 3 | | | — | 3 | | | — | 3 | | | | | | | | | | | | |
| Class F-1 | | | 32,746 | | | | 17,323 | | | | 50,069 | | | | 65,724 | | | | 97,542 | | | | 163,266 | |
| Class F-2 | | | 57,338 | | | | 25,140 | | | | 82,478 | | | | 84,464 | | | | 123,561 | | | | 208,025 | |
| Class F-34 | | | 6,382 | | | | 5,135 | | | | 11,517 | | | | | | | | | | | | | |
| Class 529-A | | | 24,184 | | | | 12,688 | | | | 36,872 | | | | 51,256 | | | | 75,290 | | | | 126,546 | |
| Class 529-B1 | | | — | | | | — | | | | — | | | | 128 | | | | 310 | | | | 438 | |
| Class 529-C | | | 3,643 | | | | 3,943 | | | | 7,586 | | | | 8,983 | | | | 23,696 | | | | 32,679 | |
| Class 529-E | | | 993 | | | | 621 | | | | 1,614 | | | | 2,177 | | | | 3,698 | | | | 5,875 | |
| Class 529-T2 | | | — | 3 | | | — | 3 | | | — | 3 | | | | | | | | | | | | |
| Class 529-F-1 | | | 1,265 | | | | 584 | | | | 1,849 | | | | 2,450 | | | | 3,211 | | | | 5,661 | |
| Class R-1 | | | 517 | | | | 526 | | | | 1,043 | | | | 1,565 | | | | 3,783 | | | | 5,348 | |
| Class R-2 | | | 4,688 | | | | 4,711 | | | | 9,399 | | | | 12,602 | | | | 30,477 | | | | 43,079 | |
| Class R-2E | | | 145 | | | | 114 | | | | 259 | | | | 144 | | | | 351 | | | | 495 | |
| Class R-3 | | | 20,419 | | | | 13,054 | | | | 33,473 | | | | 47,533 | | | | 81,888 | | | | 129,421 | |
| Class R-4 | | | 45,988 | | | | 23,613 | | | | 69,601 | | | | 88,272 | | | | 137,789 | | | | 226,061 | |
| Class R-5E | | | 29 | | | | 15 | | | | 44 | | | | 12 | | | | 35 | | | | 47 | |
| Class R-5 | | | 18,199 | | | | 7,781 | | | | 25,980 | | | | 51,662 | | | | 53,855 | | | | 105,517 | |
| Class R-6 | | | 121,917 | | | | 54,341 | | | | 176,258 | | | | 198,498 | | | | 253,123 | | | | 451,621 | |
| Total | | $ | 818,718 | | | $ | 424,407 | | | $ | 1,243,125 | | | $ | 1,636,470 | | | $ | 2,406,499 | | | $ | 4,042,969 | |
| 1 | Class B and 529-B shares were fully liquidated on May 5, 2017. |
| 2 | Class T and 529-T shares began investment operations on April 7, 2017. |
| 3 | Amount less than one thousand. |
| 4 | Class F-3 shares began investment operations on January 27, 2017. |
7. Fees and transactions with related parties
CRMC, the fund’s investment adviser, is the parent company of American Funds Distributors,® Inc. (“AFD”), the principal underwriter of the fund’s shares, and American Funds Service Company® (“AFS”), the fund’s transfer agent. CRMC, AFD and AFS are considered related parties to the fund.
Investment advisory services — The fund has an investment advisory and service agreement with CRMC that provides for monthly fees accrued daily. These fees are based on a series of decreasing annual rates beginning with 0.420% on the first $500 million of daily net assets and decreasing to 0.207% on such assets in excess of $89 billion. For the six months ended June 30, 2017, the investment advisory services fee was $120,556,000, which was equivalent to an annualized rate of 0.225% of average daily net assets.
Class-specific fees and expenses — Expenses that are specific to individual share classes are accrued directly to the respective share class. The principal class-specific fees and expenses are further described below:
Distribution services — The fund has plans of distribution for all share classes, except Class F-2, F-3, R-5E, R-5 and R-6 shares. Under the plans, the board of trustees approves certain categories of expenses that are used to finance activities primarily intended to sell fund shares and service existing accounts. The plans provide for payments, based on an annualized percentage of average daily net assets, ranging from 0.25% to 1.00% as noted in this section. In some cases, the board of trustees has limited the amounts that may be paid to less than the maximum allowed by the plans. All share classes with a plan may use up to 0.25% of average daily net assets to pay service fees, or to compensate AFD for paying service fees, to firms that have entered into agreements with AFD to provide certain shareholder services. The remaining amounts available to be paid under each plan are paid to dealers to compensate them for their sales activities.
For Class A and 529-A shares, distribution-related expenses include the reimbursement of dealer and wholesaler commissions paid by AFD for certain shares sold without a sales charge. These share classes reimburse AFD for amounts billed within the prior 15 months but only to the extent that the overall annual expense limit of 0.25% is not exceeded. As of June 30, 2017, there were no unreimbursed expenses subject to reimbursement for Class A or 529-A shares.
| Share class | | Currently approved limits | | Plan limits |
| Class A | | 0.25% | | 0.25% |
| Class 529-A | | 0.25 | | 0.50 |
| Classes C, 529-C and R-1 | | 1.00 | | 1.00 |
| Class R-2 | | 0.75 | | 1.00 |
| Class R-2E | | 0.60 | | 0.85 |
| Classes 529-E and R-3 | | 0.50 | | 0.75 |
| Classes T, F-1, 529-T, 529-F-1 and R-4 | | 0.25 | | 0.50 |
Transfer agent services — The fund has a shareholder services agreement with AFS under which the fund compensates AFS for providing transfer agent services to each of the fund’s share classes. These services include recordkeeping, shareholder communications and transaction processing. In addition, the fund reimburses AFS for amounts paid to third parties for performing transfer agent services on behalf of fund shareholders.
Administrative services — The fund has an administrative services agreement with CRMC under which the fund compensates CRMC for providing administrative services to Class A, C, T, F, 529 and R shares. These services include, but are not limited to, coordinating, monitoring, assisting and overseeing third parties that provide services to fund shareholders. Under the agreement, Class A shares pay an annual fee of 0.01% and Class C, T, F, 529 and R shares pay an annual fee of 0.05% of their respective average daily net assets.
529 plan services — Each 529 share class is subject to service fees to compensate the Virginia College Savings Plan (“Virginia529”) for its oversight and administration of the 529 college savings plan. The quarterly fee is based on a series of decreasing annual rates beginning with 0.10% on the first $20 billion of the net assets invested in the Class 529 shares of the American Funds and decreasing to 0.03% on such assets in excess of $100 billion. The fee for any given calendar quarter is accrued and calculated on the basis of the average net assets of Class 529 shares of the American Funds for the last month of the prior calendar quarter. The fee is included in other expenses in the fund’s statement of operations. Virginia529 is not considered a related party to the fund.
For the six months ended June 30, 2017, class-specific expenses under the agreements were as follows (dollars in thousands):
| Share class | | Distribution
services | | Transfer agent
services | | Administrative
services | | 529 plan
services | |
| Class A | | $ 67,793 | | $25,112 | | $ 2,872 | | Not applicable | |
| Class B1 | | 102 | | 15 | | Not applicable | | Not applicable | |
| Class C | | 40,249 | | 3,591 | | 2,016 | | Not applicable | |
| Class T2 | | — | | — | 3 | — | 3 | Not applicable | |
| Class F-1 | | 5,455 | | 2,675 | | 1,094 | | Not applicable | |
| Class F-2 | | Not applicable | | 3,535 | | 1,645 | | Not applicable | |
| Class F-34 | | Not applicable | | 9 | | 90 | | Not applicable | |
| Class 529-A | | 3,636 | | 1,180 | | 812 | | $1,100 | |
| Class 529-B1 | | 11 | | 2 | | 1 | | 1 | |
| Class 529-C | | 4,998 | | 388 | | 252 | | 342 | |
| Class 529-E | | 392 | | 34 | | 40 | | 54 | |
| Class 529-T2 | | — | | — | 3 | — | 3 | — | 3 |
| Class 529-F-1 | | — | | 53 | | 36 | | 49 | |
| Class R-1 | | 715 | | 70 | | 36 | | Not applicable | |
| Class R-2 | | 4,598 | | 2,130 | | 309 | | Not applicable | |
| Class R-2E | | 75 | | 24 | | 6 | | Not applicable | |
| Class R-3 | | 8,519 | | 2,535 | | 853 | | Not applicable | |
| Class R-4 | | 7,675 | | 3,045 | | 1,535 | | Not applicable | |
| Class R-5E | | Not applicable | | 2 | | 1 | | Not applicable | |
| Class R-5 | | Not applicable | | 508 | | 508 | | Not applicable | |
| Class R-6 | | Not applicable | | 2 | | 3,201 | | Not applicable | |
| Total class-specific expenses | | $144,218 | | $44,910 | | $15,307 | | $1,546 | |
| 1 | Class B and 529-B shares were fully liquidated on May 5, 2017. |
| 2 | Class T and 529-T shares began investment operations on April 7, 2017. |
| 3 | Amount less than one thousand. |
| 4 | Class F-3 shares began investment operations on January 27, 2017. |
Trustees’ deferred compensation — Trustees who are unaffiliated with CRMC may elect to defer the cash payment of part or all of their compensation. These deferred amounts, which remain as liabilities of the fund, are treated as if invested in shares of the fund or other American Funds. These amounts represent general, unsecured liabilities of the fund and vary according to the total returns of the selected funds. Trustees’ compensation of $527,000 in the fund’s statement of operations reflects $181,000 in current fees (either paid in cash or deferred) and a net increase of $346,000 in the value of the deferred amounts.
Affiliated officers and trustees — Officers and certain trustees of the fund are or may be considered to be affiliated with CRMC, AFD and AFS. No affiliated officers or trustees received any compensation directly from the fund.
Security transactions with related funds — The fund may purchase from, or sell securities to, other funds managed by CRMC (or funds managed by certain affiliates of CRMC) under procedures adopted by the fund’s board of trustees. The funds involved in such transactions are considered related by virtue of having a common investment adviser (or affiliated investment advisers), common trustees and/or common officers. When such transactions occur, each transaction is executed at the current market price of the security and no brokerage commissions or fees are paid in accordance with Rule 17a-7 of the 1940 Act.
Interfund lending — Pursuant to an exemptive order issued by the SEC, the fund, along with other CRMC-managed funds (or funds managed by certain affiliates of CRMC), may participate in an interfund lending program. The program provides an alternate credit facility that permits the funds to lend or borrow cash for temporary purposes directly to or from one another, subject to the conditions of the exemptive order. The fund did not lend or borrow cash through the interfund lending program at any time during the six months ended June 30, 2017.
8. Capital share transactions
Capital share transactions in the fund were as follows (dollars and shares in thousands):
| | | Sales1 | | | Reinvestments of
dividends and distributions | | | Repurchases1 | | | Net increase (decrease) |
| Share class | | Amount | | | Shares | | | Amount | | | Shares | | | Amount | | | Shares | | | Amount | | | Shares | |
| | | | | | | | | | | | | | | | | | | | | | | | | | | | | | | | | |
| Six months ended June 30, 2017 | | | | | | | | | | | | | | | | | | | | | | | | | |
| | | | | | | | | | | | | | | | | | | | | | | | | | | | | | | | | |
| Class A | | $ | 4,832,005 | | | | 187,426 | | | $ | 661,762 | | | | 25,295 | | | $ | (4,621,852 | ) | | | (179,157 | ) | | $ | 871,915 | | | | 33,564 | |
| Class B2 | | | 194 | | | | 7 | | | | — | | | | — | | | | (68,161 | ) | | | (2,669 | ) | | | (67,967 | ) | | | (2,662 | ) |
| Class C | | | 1,105,745 | | | | 43,180 | | | | 61,737 | | | | 2,368 | | | | (1,030,838 | ) | | | (40,238 | ) | | | 136,644 | | | | 5,310 | |
| Class T3 | | | 10 | | | | — | 4 | | | — | | | | — | | | | — | | | | — | | | | 10 | | | | — | 4 |
| Class F-1 | | | 748,610 | | | | 29,127 | | | | 48,961 | | | | 1,873 | | | | (536,362 | ) | | | (20,806 | ) | | | 261,209 | | | | 10,194 | |
| Class F-2 | | | 2,691,984 | | | | 104,454 | | | | 79,230 | | | | 3,032 | | | | (1,911,033 | ) | | | (73,805 | ) | | | 860,181 | | | | 33,681 | |
| Class F-35 | | | 1,462,339 | | | | 56,180 | | | | 11,368 | | | | 432 | | | | (33,919 | ) | | | (1,290 | ) | | | 1,439,788 | | | | 55,322 | |
| Class 529-A | | | 236,280 | | | | 9,197 | | | | 36,869 | | | | 1,411 | | | | (184,892 | ) | | | (7,205 | ) | | | 88,257 | | | | 3,403 | |
| Class 529-B2 | | | 42 | | | | 2 | | | | — | | | | — | | | | (9,221 | ) | | | (361 | ) | | | (9,179 | ) | | | (359 | ) |
| Class 529-C | | | 77,339 | | | | 3,011 | | | | 7,585 | | | | 290 | | | | (68,626 | ) | | | (2,679 | ) | | | 16,298 | | | | 622 | |
| Class 529-E | | | 11,904 | | | | 463 | | | | 1,613 | | | | 62 | | | | (9,291 | ) | | | (363 | ) | | | 4,226 | | | | 162 | |
| Class 529-T3 | | | 10 | | | | — | 4 | | | — | 4 | | | — | 4 | | | — | | | | — | | | | 10 | | | | — | 4 |
| Class 529-F-1 | | | 22,316 | | | | 868 | | | | 1,848 | | | | 71 | | | | (9,568 | ) | | | (373 | ) | | | 14,596 | | | | 566 | |
| Class R-1 | | | 14,693 | | | | 576 | | | | 1,041 | | | | 40 | | | | (40,965 | ) | | | (1,607 | ) | | | (25,231 | ) | | | (991 | ) |
| Class R-2 | | | 160,194 | | | | 6,262 | | | | 9,390 | | | | 360 | | | | (235,709 | ) | | | (9,227 | ) | | | (66,125 | ) | | | (2,605 | ) |
| Class R-2E | | | 21,602 | | | | 842 | | | | 258 | | | | 10 | | | | (9,105 | ) | | | (352 | ) | | | 12,755 | | | | 500 | |
| Class R-3 | | | 462,352 | | | | 18,077 | | | | 33,429 | | | | 1,283 | | | | (576,868 | ) | | | (22,514 | ) | | | (81,087 | ) | | | (3,154 | ) |
| Class R-4 | | | 758,199 | | | | 29,629 | | | | 69,594 | | | | 2,664 | | | | (854,978 | ) | | | (33,322 | ) | | | (27,185 | ) | | | (1,029 | ) |
| Class R-5E | | | 2,114 | | | | 82 | | | | 44 | | | | 2 | | | | (358 | ) | | | (14 | ) | | | 1,800 | | | | 70 | |
| Class R-5 | | | 232,708 | | | | 9,031 | | | | 25,951 | | | | 991 | | | | (341,956 | ) | | | (13,227 | ) | | | (83,297 | ) | | | (3,205 | ) |
| Class R-6 | | | 3,863,874 | | | | 149,533 | | | | 176,248 | | | | 6,734 | | | | (734,772 | ) | | | (28,506 | ) | | | 3,305,350 | | | | 127,761 | |
| Total net increase (decrease) | | $ | 16,704,514 | | | | 647,947 | | | $ | 1,226,928 | | | | 46,918 | | | $ | (11,278,474 | ) | | | (437,715 | ) | | $ | 6,652,968 | | | | 257,150 | |
| | | Sales1 | | | Reinvestments of
dividends and distributions | | | Repurchases1 | | | Net increase (decrease) |
| Share class | | Amount | | | Shares | | | Amount | | | Shares | | | Amount | | | Shares | | | Amount | | | Shares | |
| | | | | | | | | | | | | | | | | | | | | | | | | | | | | | | | | |
| Year ended December 31, 2016 | | | | | | | | | | | | | | | | | | | | | | | | |
| | | | | | | | | | | | | | | | | | | | | | | | | | | | | | | | | |
| Class A | | $ | 8,757,067 | | | | 358,896 | | | $ | 2,241,249 | | | | 90,845 | | | $ | (6,915,731 | ) | | | (282,347 | ) | | $ | 4,082,585 | | | | 167,394 | |
| Class B | | | 3,973 | | | | 165 | | | | 3,205 | | | | 131 | | | | (227,367 | ) | | | (9,369 | ) | | | (220,189 | ) | | | (9,073 | ) |
| Class C | | | 2,486,671 | | | | 102,574 | | | | 254,951 | | | | 10,367 | | | | (1,420,028 | ) | | | (58,455 | ) | | | 1,321,594 | | | | 54,486 | |
| Class F-1 | | | 1,165,494 | | | | 47,762 | | | | 159,358 | | | | 6,461 | | | | (748,608 | ) | | | (30,572 | ) | | | 576,244 | | | | 23,651 | |
| Class F-2 | | | 3,674,683 | | | | 149,338 | | | | 200,023 | | | | 8,093 | | | | (933,696 | ) | | | (37,986 | ) | | | 2,941,010 | | | | 119,445 | |
| Class 529-A | | | 445,581 | | | | 18,265 | | | | 126,517 | | | | 5,135 | | | | (437,560 | ) | | | (17,862 | ) | | | 134,538 | | | | 5,538 | |
| Class 529-B | | | 1,175 | | | | 48 | | | | 438 | | | | 18 | | | | (32,554 | ) | | | (1,334 | ) | | | (30,941 | ) | | | (1,268 | ) |
| Class 529-C | | | 159,261 | | | | 6,543 | | | | 32,671 | | | | 1,324 | | | | (159,507 | ) | | | (6,520 | ) | | | 32,425 | | | | 1,347 | |
| Class 529-E | | | 21,281 | | | | 871 | | | | 5,874 | | | | 239 | | | | (22,370 | ) | | | (912 | ) | | | 4,785 | | | | 198 | |
| Class 529-F-1 | | | 31,861 | | | | 1,304 | | | | 5,661 | | | | 230 | | | | (24,230 | ) | | | (994 | ) | | | 13,292 | | | | 540 | |
| Class R-1 | | | 44,753 | | | | 1,839 | | | | 5,334 | | | | 217 | | | | (53,075 | ) | | | (2,181 | ) | | | (2,988 | ) | | | (125 | ) |
| Class R-2 | | | 310,155 | | | | 12,804 | | | | 43,048 | | | | 1,752 | | | | (380,485 | ) | | | (15,689 | ) | | | (27,282 | ) | | | (1,133 | ) |
| Class R-2E | | | 31,089 | | | | 1,260 | | | | 495 | | | | 20 | | | | (17,216 | ) | | | (692 | ) | | | 14,368 | | | | 588 | |
| Class R-3 | | | 829,309 | | | | 34,115 | | | | 129,283 | | | | 5,261 | | | | (906,300 | ) | | | (37,327 | ) | | | 52,292 | | | | 2,049 | |
| Class R-4 | | | 2,172,314 | | | | 89,073 | | | | 226,051 | | | | 9,164 | | | | (1,093,915 | ) | | | (44,985 | ) | | | 1,304,450 | | | | 53,252 | |
| Class R-5E | | | 1,928 | | | | 78 | | | | 47 | | | | 2 | | | | (35 | ) | | | (1 | ) | | | 1,940 | | | | 79 | |
| Class R-5 | | | 719,201 | | | | 29,524 | | | | 105,457 | | | | 4,285 | | | | (1,509,585 | ) | | | (61,629 | ) | | | (684,927 | ) | | | (27,820 | ) |
| Class R-6 | | | 4,239,152 | | | | 173,253 | | | | 451,558 | | | | 18,289 | | | | (1,267,332 | ) | | | (51,684 | ) | | | 3,423,378 | | | | 139,858 | |
| Total net increase (decrease) | | $ | 25,094,948 | | | | 1,027,712 | | | $ | 3,991,220 | | | | 161,833 | | | $ | (16,149,594 | ) | | | (660,539 | ) | | $ | 12,936,574 | | | | 529,006 | |
| 1 | Includes exchanges between share classes of the fund. |
| 2 | Class B and 529-B shares were fully liquidated on May 5, 2017. |
| 3 | Class T and 529-T shares began investment operations on April 7, 2017. |
| 4 | Amount less than one thousand. |
| 5 | Class F-3 shares began investment operations on January 27, 2017. |
9. Investment transactions
The fund made purchases and sales of investment securities, excluding short-term securities and U.S. government obligations, if any, of $43,771,570,000 and $38,418,298,000, respectively, during the six months ended June 30, 2017.
Financial highlights
| | | | | | Income (loss) from investment operations1 | |
| | | Net asset
value,
beginning
of period | | | Net
investment
income | | | Net gains (losses)
on securities (both
realized and
unrealized) | | | Total from
investment
operations | |
| Class A: | | | | | | | | | | | | | | | | |
| Six months ended 6/30/20173,4 | | $ | 24.81 | | | $ | .23 | | | $ | 1.42 | | | $ | 1.65 | |
| Year ended 12/31/2016 | | | 23.83 | | | | .41 | | | | 1.62 | | | | 2.03 | |
| Year ended 12/31/2015 | | | 24.75 | | | | .42 | | | | — | 7 | | | .42 | |
| Year ended 12/31/2014 | | | 24.42 | | | | .41 | | | | 1.75 | | | | 2.16 | |
| Year ended 12/31/2013 | | | 20.40 | | | | .36 | | | | 4.04 | | | | 4.40 | |
| Year ended 12/31/2012 | | | 18.21 | | | | .38 | | | | 2.19 | | | | 2.57 | |
| Class C: | | | | | | | | | | | | | | | | |
| Six months ended 6/30/20173,4 | | | 24.66 | | | | .12 | | | | 1.43 | | | | 1.55 | |
| Year ended 12/31/2016 | | | 23.71 | | | | .21 | | | | 1.60 | | | | 1.81 | |
| Year ended 12/31/2015 | | | 24.63 | | | | .22 | | | | .01 | | | | .23 | |
| Year ended 12/31/2014 | | | 24.30 | | | | .21 | | | | 1.75 | | | | 1.96 | |
| Year ended 12/31/2013 | | | 20.31 | | | | .19 | | | | 4.00 | | | | 4.19 | |
| Year ended 12/31/2012 | | | 18.13 | | | | .22 | | | | 2.18 | | | | 2.40 | |
| Class T: | | | | | | | | | | | | | | | | |
| Period from 4/7/2017 to 6/30/20173,4,8 | | | 25.77 | | | | .13 | | | | .47 | | | | .60 | |
| Class F-1: | | | | | | | | | | | | | | | | |
| Six months ended 6/30/20173,4 | | | 24.79 | | | | .21 | | | | 1.43 | | | | 1.64 | |
| Year ended 12/31/2016 | | | 23.82 | | | | .39 | | | | 1.61 | | | | 2.00 | |
| Year ended 12/31/2015 | | | 24.74 | | | | .40 | | | | .01 | | | | .41 | |
| Year ended 12/31/2014 | | | 24.41 | | | | .39 | | | | 1.75 | | | | 2.14 | |
| Year ended 12/31/2013 | | | 20.39 | | | | .36 | | | | 4.03 | | | | 4.39 | |
| Year ended 12/31/2012 | | | 18.21 | | | | .38 | | | | 2.18 | | | | 2.56 | |
| Class F-2: | | | | | | | | | | | | | | | | |
| Six months ended 6/30/20173,4 | | | 24.79 | | | | .25 | | | | 1.43 | | | | 1.68 | |
| Year ended 12/31/2016 | | | 23.82 | | | | .46 | | | | 1.61 | | | | 2.07 | |
| Year ended 12/31/2015 | | | 24.74 | | | | .47 | | | | — | 7 | | | .47 | |
| Year ended 12/31/2014 | | | 24.41 | | | | .46 | | | | 1.75 | | | | 2.21 | |
| Year ended 12/31/2013 | | | 20.39 | | | | .41 | | | | 4.04 | | | | 4.45 | |
| Year ended 12/31/2012 | | | 18.21 | | | | .43 | | | | 2.18 | | | | 2.61 | |
| Class F-3: | | | | | | | | | | | | | | | | |
| Period from 1/27/2017 to 6/30/20173,4,11 | | | 25.38 | | | | .24 | | | | .87 | | | | 1.11 | |
| Dividends and distributions | | | | | | | | | | | | | | | | |
Dividends
(from net
investment
income) | | | Distributions
(from capital
gains) | | | Total
dividends
and
distributions | | | Net asset
value, end
of period | | | Total
return2 | | | Net assets,
end of period
(in millions) | | | Ratio of
expenses
to average
net assets | | | Ratio of net
income
to average
net assets | |
| | | | | | | | | | | | | | | | | | | | | | | | | | | | | | | |
| $ | (.20 | ) | | $ | (.10 | ) | | $ | (.30 | ) | | $ | 26.16 | | | | 6.65 | %5 | | $ | 59,280 | | | | .57 | %6 | | | 1.76 | %6 |
| | (.44 | ) | | | (.61 | ) | | | (1.05 | ) | | | 24.81 | | | | 8.62 | | | | 55,379 | | | | .59 | | | | 1.67 | |
| | (.40 | ) | | | (.94 | ) | | | (1.34 | ) | | | 23.83 | | | | 1.72 | | | | 49,215 | | | | .58 | | | | 1.69 | |
| | (.39 | ) | | | (1.44 | ) | | | (1.83 | ) | | | 24.75 | | | | 8.85 | | | | 46,917 | | | | .59 | | | | 1.62 | |
| | (.38 | ) | | | — | | | | (.38 | ) | | | 24.42 | | | | 21.73 | | | | 42,735 | | | | .61 | | | | 1.62 | |
| | (.38 | ) | | | — | | | | (.38 | ) | | | 20.40 | | | | 14.19 | | | | 34,272 | | | | .63 | | | | 1.94 | |
| | | | | | | | | | | | | | | | | | | | | | | | | | | | | | | |
| | (.10 | ) | | | (.10 | ) | | | (.20 | ) | | | 26.01 | | | | 6.27 | 5 | | | 8,328 | | | | 1.37 | 6 | | | .96 | 6 |
| | (.25 | ) | | | (.61 | ) | | | (.86 | ) | | | 24.66 | | | | 7.70 | | | | 7,767 | | | | 1.38 | | | | .88 | |
| | (.21 | ) | | | (.94 | ) | | | (1.15 | ) | | | 23.71 | | | | .93 | | | | 6,173 | | | | 1.38 | | | | .90 | |
| | (.19 | ) | | | (1.44 | ) | | | (1.63 | ) | | | 24.63 | | | | 8.03 | | | | 5,574 | | | | 1.39 | | | | .83 | |
| | (.20 | ) | | | — | | | | (.20 | ) | | | 24.30 | | | | 20.72 | | | | 5,247 | | | | 1.41 | | | | .83 | |
| | (.22 | ) | | | — | | | | (.22 | ) | | | 20.31 | | | | 13.30 | | | | 4,334 | | | | 1.42 | | | | 1.14 | |
| | | | | | | | | | | | | | | | | | | | | | | | | | | | | | | |
| | (.11 | ) | | | (.10 | ) | | | (.21 | ) | | | 26.16 | | | | 2.33 | 5,9 | | | — | 10 | | | .09 | 5,9 | | | .48 | 5,9 |
| | | | | | | | | | | | | | | | | | | | | | | | | | | | | | | |
| | (.19 | ) | | | (.10 | ) | | | (.29 | ) | | | 26.14 | | | | 6.61 | 5 | | | 4,580 | | | | .66 | 6 | | | 1.68 | 6 |
| | (.42 | ) | | | (.61 | ) | | | (1.03 | ) | | | 24.79 | | | | 8.50 | | | | 4,091 | | | | .66 | | | | 1.60 | |
| | (.39 | ) | | | (.94 | ) | | | (1.33 | ) | | | 23.82 | | | | 1.67 | | | | 3,367 | | | | .65 | | | | 1.63 | |
| | (.37 | ) | | | (1.44 | ) | | | (1.81 | ) | | | 24.74 | | | | 8.80 | | | | 2,841 | | | | .65 | | | | 1.57 | |
| | (.37 | ) | | | — | | | | (.37 | ) | | | 24.41 | | | | 21.70 | | | | 2,471 | | | | .66 | | | | 1.58 | |
| | (.38 | ) | | | — | | | | (.38 | ) | | | 20.39 | | | | 14.13 | | | | 1,500 | | | | .64 | | | | 1.94 | |
| | | | | | | | | | | | | | | | | | | | | | | | | | | | | | | |
| | (.22 | ) | | | (.10 | ) | | | (.32 | ) | | | 26.15 | | | | 6.79 | 5 | | | 6,895 | | | | .40 | 6 | | | 1.96 | 6 |
| | (.49 | ) | | | (.61 | ) | | | (1.10 | ) | | | 24.79 | | | | 8.80 | | | | 5,703 | | | | .39 | | | | 1.88 | |
| | (.45 | ) | | | (.94 | ) | | | (1.39 | ) | | | 23.82 | | | | 1.92 | | | | 2,634 | | | | .39 | | | | 1.89 | |
| | (.44 | ) | | | (1.44 | ) | | | (1.88 | ) | | | 24.74 | | | | 9.08 | | | | 1,869 | | | | .39 | | | | 1.83 | |
| | (.43 | ) | | | — | | | | (.43 | ) | | | 24.41 | | | | 21.99 | | | | 768 | | | | .41 | | | | 1.83 | |
| | (.43 | ) | | | — | | | | (.43 | ) | | | 20.39 | | | | 14.40 | | | | 419 | | | | .40 | | | | 2.18 | |
| | | | | | | | | | | | | | | | | | | | | | | | | | | | | | | |
| | (.24 | ) | | | (.10 | ) | | | (.34 | ) | | | 26.15 | | | | 4.37 | 5 | | | 1,447 | | | | .12 | 5 | | | .92 | 5 |
See page 37 for footnotes.
Financial highlights (continued)
| | | | | | Income (loss) from investment operations1 | |
| | | Net asset
value,
beginning
of period | | | Net
investment
income | | | Net gains (losses)
on securities (both
realized and
unrealized) | | | Total from
investment
operations | |
| Class 529-A: | | | | | | | | | | | | | | | | |
| Six months ended 6/30/20173,4 | | $ | 24.77 | | | $ | .21 | | | $ | 1.43 | | | $ | 1.64 | |
| Year ended 12/31/2016 | | | 23.80 | | | | .39 | | | | 1.61 | | | | 2.00 | |
| Year ended 12/31/2015 | | | 24.72 | | | | .39 | | | | .01 | | | | .40 | |
| Year ended 12/31/2014 | | | 24.39 | | | | .38 | | | | 1.75 | | | | 2.13 | |
| Year ended 12/31/2013 | | | 20.38 | | | | .34 | | | | 4.03 | | | | 4.37 | |
| Year ended 12/31/2012 | | | 18.19 | | | | .36 | | | | 2.19 | | | | 2.55 | |
| Class 529-C: | | | | | | | | | | | | | | | | |
| Six months ended 6/30/20173,4 | | | 24.75 | | | | .12 | | | | 1.42 | | | | 1.54 | |
| Year ended 12/31/2016 | | | 23.79 | | | | .20 | | | | 1.60 | | | | 1.80 | |
| Year ended 12/31/2015 | | | 24.70 | | | | .20 | | | | .02 | | | | .22 | |
| Year ended 12/31/2014 | | | 24.38 | | | | .19 | | | | 1.74 | | | | 1.93 | |
| Year ended 12/31/2013 | | | 20.37 | | | | .17 | | | | 4.03 | | | | 4.20 | |
| Year ended 12/31/2012 | | | 18.19 | | | | .21 | | | | 2.18 | | | | 2.39 | |
| Class 529-E: | | | | | | | | | | | | | | | | |
| Six months ended 6/30/20173,4 | | | 24.76 | | | | .18 | | | | 1.43 | | | | 1.61 | |
| Year ended 12/31/2016 | | | 23.79 | | | | .33 | | | | 1.61 | | | | 1.94 | |
| Year ended 12/31/2015 | | | 24.71 | | | | .33 | | | | .01 | | | | .34 | |
| Year ended 12/31/2014 | | | 24.38 | | | | .32 | | | | 1.75 | | | | 2.07 | |
| Year ended 12/31/2013 | | | 20.37 | | | | .29 | | | | 4.02 | | | | 4.31 | |
| Year ended 12/31/2012 | | | 18.18 | | | | .31 | | | | 2.19 | | | | 2.50 | |
| Class 529-T: | | | | | | | | | | | | | | | | |
| Period from 4/7/2017 to 6/30/20173,4,8 | | | 25.77 | | | | .12 | | | | .48 | | | | .60 | |
| Class 529-F-1: | | | | | | | | | | | | | | | | |
| Six months ended 6/30/20173,4 | | | 24.75 | | | | .24 | | | | 1.43 | | | | 1.67 | |
| Year ended 12/31/2016 | | | 23.78 | | | | .44 | | | | 1.62 | | | | 2.06 | |
| Year ended 12/31/2015 | | | 24.71 | | | | .45 | | | | (.01 | ) | | | .44 | |
| Year ended 12/31/2014 | | | 24.37 | | | | .44 | | | | 1.76 | | | | 2.20 | |
| Year ended 12/31/2013 | | | 20.36 | | | | .39 | | | | 4.03 | | | | 4.42 | |
| Year ended 12/31/2012 | | | 18.18 | | | | .41 | | | | 2.18 | | | | 2.59 | |
| Class R-1: | | | | | | | | | | | | | | | | |
| Six months ended 6/30/20173,4 | | | 24.64 | | | | .12 | | | | 1.42 | | | | 1.54 | |
| Year ended 12/31/2016 | | | 23.68 | | | | .22 | | | | 1.60 | | | | 1.82 | |
| Year ended 12/31/2015 | | | 24.61 | | | | .22 | | | | (.01 | ) | | | .21 | |
| Year ended 12/31/2014 | | | 24.28 | | | | .21 | | | | 1.75 | | | | 1.96 | |
| Year ended 12/31/2013 | | | 20.29 | | | | .19 | | | | 4.01 | | | | 4.20 | |
| Year ended 12/31/2012 | | | 18.12 | | | | .23 | | | | 2.17 | | | | 2.40 | |
| Dividends and distributions | | | | | | | | | | | | | | | | |
Dividends
(from net
investment
income) | | | Distributions
(from capital
gains) | | | Total
dividends
and
distributions | | | Net asset
value, end
of period | | | Total
return2 | | | Net assets,
end of period
(in millions) | | | Ratio of
expenses
to average
net assets | | | Ratio of net
income
to average
net assets | |
| | | | | | | | | | | | | | | | | | | | | | | | | | | | | | | |
| $ | (.19 | ) | | $ | (.10 | ) | | $ | (.29 | ) | | $ | 26.12 | | | | 6.62 | %5 | | $ | 3,374 | | | | .65 | %6 | | | 1.68 | %6 |
| | (.42 | ) | | | (.61 | ) | | | (1.03 | ) | | | 24.77 | | | | 8.50 | | | | 3,115 | | | | .67 | | | | 1.59 | |
| | (.38 | ) | | | (.94 | ) | | | (1.32 | ) | | | 23.80 | | | | 1.63 | | | | 2,861 | | | | .68 | | | | 1.60 | |
| | (.36 | ) | | | (1.44 | ) | | | (1.80 | ) | | | 24.72 | | | | 8.76 | | | | 2,831 | | | | .68 | | | | 1.53 | |
| | (.36 | ) | | | — | | | | (.36 | ) | | | 24.39 | | | | 21.60 | | | | 2,599 | | | | .70 | | | | 1.53 | |
| | (.36 | ) | | | — | | | | (.36 | ) | | | 20.38 | | | | 14.12 | | | | 2,101 | | | | .71 | | | | 1.86 | |
| | | | | | | | | | | | | | | | | | | | | | | | | | | | | | | |
| | (.09 | ) | | | (.10 | ) | | | (.19 | ) | | | 26.10 | | | | 6.22 | 5 | | | 1,045 | | | | 1.42 | 6 | | | .91 | 6 |
| | (.23 | ) | | | (.61 | ) | | | (.84 | ) | | | 24.75 | | | | 7.63 | | | | 975 | | | | 1.44 | | | | .82 | |
| | (.19 | ) | | | (.94 | ) | | | (1.13 | ) | | | 23.79 | | | | .88 | | | | 905 | | | | 1.45 | | | | .83 | |
| | (.17 | ) | | | (1.44 | ) | | | (1.61 | ) | | | 24.70 | | | | 7.90 | | | | 905 | | | | 1.46 | | | | .76 | |
| | (.19 | ) | | | — | | | | (.19 | ) | | | 24.38 | | | | 20.68 | | | | 841 | | | | 1.48 | | | | .76 | |
| | (.21 | ) | | | — | | | | (.21 | ) | | | 20.37 | | | | 13.19 | | | | 694 | | | | 1.49 | | | | 1.08 | |
| | | | | | | | | | | | | | | | | | | | | | | | | | | | | | | |
| | (.16 | ) | | | (.10 | ) | | | (.26 | ) | | | 26.11 | | | | 6.50 | 5 | | | 165 | | | | .89 | 6 | | | 1.44 | 6 |
| | (.36 | ) | | | (.61 | ) | | | (.97 | ) | | | 24.76 | | | | 8.24 | | | | 153 | | | | .91 | | | | 1.35 | |
| | (.32 | ) | | | (.94 | ) | | | (1.26 | ) | | | 23.79 | | | | 1.38 | | | | 142 | | | | .92 | | | | 1.36 | |
| | (.30 | ) | | | (1.44 | ) | | | (1.74 | ) | | | 24.71 | | | | 8.50 | | | | 144 | | | | .93 | | | | 1.28 | |
| | (.30 | ) | | | — | | | | (.30 | ) | | | 24.38 | | | | 21.31 | | | | 134 | | | | .95 | | | | 1.29 | |
| | (.31 | ) | | | — | | | | (.31 | ) | | | 20.37 | | | | 13.84 | | | | 112 | | | | .97 | | | | 1.60 | |
| | | | | | | | | | | | | | | | | | | | | | | | | | | | | | | |
| | (.11 | ) | | | (.10 | ) | | | (.21 | ) | | | 26.16 | | | | 2.32 | 5,9 | | | — | 10 | | | .09 | 5,9 | | | .48 | 5,9 |
| | | | | | | | | | | | | | | | | | | | | | | | | | | | | | | |
| | (.22 | ) | | | (.10 | ) | | | (.32 | ) | | | 26.10 | | | | 6.74 | 5 | | | 157 | | | | .43 | 6 | | | 1.91 | 6 |
| | (.48 | ) | | | (.61 | ) | | | (1.09 | ) | | | 24.75 | | | | 8.75 | | | | 135 | | | | .44 | | | | 1.82 | |
| | (.43 | ) | | | (.94 | ) | | | (1.37 | ) | | | 23.78 | | | | 1.82 | | | | 117 | | | | .46 | | | | 1.82 | |
| | (.42 | ) | | | (1.44 | ) | | | (1.86 | ) | | | 24.71 | | | | 9.05 | | | | 111 | | | | .46 | | | | 1.76 | |
| | (.41 | ) | | | — | | | | (.41 | ) | | | 24.37 | | | | 21.88 | | | | 101 | | | | .48 | | | | 1.76 | |
| | (.41 | ) | | | — | | | | (.41 | ) | | | 20.36 | | | | 14.32 | | | | 82 | | | | .49 | | | | 2.09 | |
| | | | | | | | | | | | | | | | | | | | | | | | | | | | | | | |
| | (.09 | ) | | | (.10 | ) | | | (.19 | ) | | | 25.99 | | | | 6.26 | 5 | | | 137 | | | | 1.38 | 6 | | | .94 | 6 |
| | (.25 | ) | | | (.61 | ) | | | (.86 | ) | | | 24.64 | | | | 7.75 | | | | 154 | | | | 1.38 | | | | .89 | |
| | (.20 | ) | | | (.94 | ) | | | (1.14 | ) | | | 23.68 | | | | .88 | | | | 151 | | | | 1.38 | | | | .90 | |
| | (.19 | ) | | | (1.44 | ) | | | (1.63 | ) | | | 24.61 | | | | 8.05 | | | | 158 | | | | 1.38 | | | | .83 | |
| | (.21 | ) | | | — | | | | (.21 | ) | | | 24.28 | | | | 20.76 | | | | 151 | | | | 1.39 | | | | .84 | |
| | (.23 | ) | | | — | | | | (.23 | ) | | | 20.29 | | | | 13.28 | | | | 121 | | | | 1.40 | | | | 1.16 | |
See page 37 for footnotes.
Financial highlights (continued)
| | | | | | Income (loss) from investment operations1 | |
| | | Net asset
value,
beginning
of period | | | Net
investment
income | | | Net gains (losses)
on securities (both
realized and
unrealized) | | | Total from
investment
operations | |
| Class R-2: | | | | | | | | | | | | | | | | |
| Six months ended 6/30/20173,4 | | $ | 24.66 | | | $ | .12 | | | $ | 1.42 | | | $ | 1.54 | |
| Year ended 12/31/2016 | | | 23.70 | | | | .22 | | | | 1.60 | | | | 1.82 | |
| Year ended 12/31/2015 | | | 24.62 | | | | .23 | | | | .01 | | | | .24 | |
| Year ended 12/31/2014 | | | 24.30 | | | | .21 | | | | 1.74 | | | | 1.95 | |
| Year ended 12/31/2013 | | | 20.30 | | | | .20 | | | | 4.02 | | | | 4.22 | |
| Year ended 12/31/2012 | | | 18.13 | | | | .23 | | | | 2.18 | | | | 2.41 | |
| Class R-2E: | | | | | | | | | | | | | | | | |
| Six months ended 6/30/20173,4 | | | 24.74 | | | | .17 | | | | 1.41 | | | | 1.58 | |
| Year ended 12/31/2016 | | | 23.77 | | | | .29 | | | | 1.62 | | | | 1.91 | |
| Year ended 12/31/2015 | | | 24.75 | | | | .29 | | | | .10 | | | | .39 | |
| Period from 8/29/2014 to 12/31/20143,12 | | | 25.81 | | | | .15 | | | | .41 | | | | .56 | |
| Class R-3: | | | | | | | | | | | | | | | | |
| Six months ended 6/30/20173,4 | | | 24.69 | | | | .18 | | | | 1.41 | | | | 1.59 | |
| Year ended 12/31/2016 | | | 23.72 | | | | .32 | | | | 1.62 | | | | 1.94 | |
| Year ended 12/31/2015 | | | 24.65 | | | | .33 | | | | (.01 | ) | | | .32 | |
| Year ended 12/31/2014 | | | 24.32 | | | | .32 | | | | 1.75 | | | | 2.07 | |
| Year ended 12/31/2013 | | | 20.32 | | | | .29 | | | | 4.02 | | | | 4.31 | |
| Year ended 12/31/2012 | | | 18.14 | | | | .32 | | | | 2.18 | | | | 2.50 | |
| Class R-4: | | | | | | | | | | | | | | | | |
| Six months ended 6/30/20173,4 | | | 24.76 | | | | .22 | | | | 1.43 | | | | 1.65 | |
| Year ended 12/31/2016 | | | 23.80 | | | | .40 | | | | 1.60 | | | | 2.00 | |
| Year ended 12/31/2015 | | | 24.72 | | | | .41 | | | | — | 7 | | | .41 | |
| Year ended 12/31/2014 | | | 24.38 | | | | .40 | | | | 1.75 | | | | 2.15 | |
| Year ended 12/31/2013 | | | 20.37 | | | | .36 | | | | 4.02 | | | | 4.38 | |
| Year ended 12/31/2012 | | | 18.19 | | | | .38 | | | | 2.18 | | | | 2.56 | |
| Class R-5E: | | | | | | | | | | | | | | | | |
| Six months ended 6/30/20173,4 | | | 24.78 | | | | .26 | | | | 1.41 | | | | 1.67 | |
| Year ended 12/31/2016 | | | 23.82 | | | | .48 | | | | 1.56 | | | | 2.04 | |
| Period from 11/20/2015 to 12/31/20153,13 | | | 25.09 | | | | .05 | | | | (.36 | ) | | | (.31 | ) |
| Class R-5: | | | | | | | | | | | | | | | | |
| Six months ended 6/30/20173,4 | | | 24.83 | | | | .26 | | | | 1.43 | | | | 1.69 | |
| Year ended 12/31/2016 | | | 23.85 | | | | .47 | | | | 1.62 | | | | 2.09 | |
| Year ended 12/31/2015 | | | 24.77 | | | | .48 | | | | — | 7 | | | .48 | |
| Year ended 12/31/2014 | | | 24.43 | | | | .47 | | | | 1.76 | | | | 2.23 | |
| Year ended 12/31/2013 | | | 20.41 | | | | .43 | | | | 4.03 | | | | 4.46 | |
| Year ended 12/31/2012 | | | 18.22 | | | | .44 | | | | 2.19 | | | | 2.63 | |
| Dividends and distributions | | | | | | | | | | | | | | | | |
Dividends
(from net
investment
income) | | | Distributions
(from capital
gains) | | | Total
dividends
and
distributions | | | Net asset
value, end
of period | | | Total
return2 | | | Net assets,
end of period
(in millions) | | | Ratio of
expenses
to average
net assets | | | Ratio of net
income
to average
net assets | |
| | | | | | | | | | | | | | | | | | | | | | | | | | | | | | | |
| $ | (.10 | ) | | $ | (.10 | ) | | $ | (.20 | ) | | $ | 26.00 | | | | 6.23 | %5 | | $ | 1,241 | | | | 1.38 | %6 | | | .95 | %6 |
| | (.25 | ) | | | (.61 | ) | | | (.86 | ) | | | 24.66 | | | | 7.74 | | | | 1,241 | | | | 1.37 | | | | .89 | |
| | (.22 | ) | | | (.94 | ) | | | (1.16 | ) | | | 23.70 | | | | .97 | | | | 1,220 | | | | 1.32 | | | | .95 | |
| | (.19 | ) | | | (1.44 | ) | | | (1.63 | ) | | | 24.62 | | | | 8.03 | | | | 1,308 | | | | 1.36 | | | | .86 | |
| | (.22 | ) | | | — | | | | (.22 | ) | | | 24.30 | | | | 20.87 | | | | 1,304 | | | | 1.34 | | | | .90 | |
| | (.24 | ) | | | — | | | | (.24 | ) | | | 20.30 | | | | 13.31 | | | | 1,158 | | | | 1.37 | | | | 1.20 | |
| | | | | | | | | | | | | | | | | | | | | | | | | | | | | | | |
| | (.14 | ) | | | (.10 | ) | | | (.24 | ) | | | 26.08 | | | | 6.39 | 5 | | | 31 | | | | 1.08 | 6 | | | 1.31 | 6 |
| | (.33 | ) | | | (.61 | ) | | | (.94 | ) | | | 24.74 | | | | 8.10 | | | | 17 | | | | 1.08 | | | | 1.18 | |
| | (.43 | ) | | | (.94 | ) | | | (1.37 | ) | | | 23.77 | | | | 1.60 | | | | 2 | | | | .96 | | | | 1.22 | |
| | | | | | | | | | | | | | | | | | | | | | | | | | | | | | | |
| | (.21 | ) | | | (1.41 | ) | | | (1.62 | ) | | | 24.75 | | | | 2.17 | 5,9 | | | — | 10 | | | .16 | 5,9 | | | .58 | 5,9 |
| | | | | | | | | | | | | | | | | | | | | | | | | | | | | | | |
| | (.15 | ) | | | (.10 | ) | | | (.25 | ) | | | 26.03 | | | | 6.45 | 5 | | | 3,449 | | | | .94 | 6 | | | 1.39 | 6 |
| | (.36 | ) | | | (.61 | ) | | | (.97 | ) | | | 24.69 | | | | 8.24 | | | | 3,349 | | | | .93 | | | | 1.33 | |
| | (.31 | ) | | | (.94 | ) | | | (1.25 | ) | | | 23.72 | | | | 1.34 | | | | 3,170 | | | | .93 | | | | 1.35 | |
| | (.30 | ) | | | (1.44 | ) | | | (1.74 | ) | | | 24.65 | | | | 8.51 | | | | 3,315 | | | | .94 | | | | 1.28 | |
| | (.31 | ) | | | — | | | | (.31 | ) | | | 24.32 | | | | 21.33 | | | | 3,212 | | | | .94 | | | | 1.30 | |
| | (.32 | ) | | | — | | | | (.32 | ) | | | 20.32 | | | | 13.83 | | | | 2,617 | | | | .95 | | | | 1.62 | |
| | | | | | | | | | | | | | | | | | | | | | | | | | | | | | | |
| | (.19 | ) | | | (.10 | ) | | | (.29 | ) | | | 26.12 | | | | 6.67 | 5 | | | 6,227 | | | | .64 | 6 | | | 1.69 | 6 |
| | (.43 | ) | | | (.61 | ) | | | (1.04 | ) | | | 24.76 | | | | 8.50 | | | | 5,930 | | | | .64 | | | | 1.63 | |
| | (.39 | ) | | | (.94 | ) | | | (1.33 | ) | | | 23.80 | | | | 1.67 | | | | 4,431 | | | | .63 | | | | 1.65 | |
| | (.37 | ) | | | (1.44 | ) | | | (1.81 | ) | | | 24.72 | | | | 8.85 | | | | 4,385 | | | | .64 | | | | 1.58 | |
| | (.37 | ) | | | — | | | | (.37 | ) | | | 24.38 | | | | 21.68 | | | | 3,994 | | | | .65 | | | | 1.60 | |
| | (.38 | ) | | | — | | | | (.38 | ) | | | 20.37 | | | | 14.14 | | | | 3,006 | | | | .64 | | | | 1.94 | |
| | | | | | | | | | | | | | | | | | | | | | | | | | | | | | | |
| | (.22 | ) | | | (.10 | ) | | | (.32 | ) | | | 26.13 | | | | 6.74 | 5 | | | 4 | | | | .42 | 6 | | | 2.03 | 6 |
| | (.47 | ) | | | (.61 | ) | | | (1.08 | ) | | | 24.78 | | | | 8.65 | | | | 2 | | | | .42 | | | | 1.94 | |
| | | | | | | | | | | | | | | | | | | | | | | | | | | | | | | |
| | (.12 | ) | | | (.84 | ) | | | (.96 | ) | | | 23.82 | | | | (1.21 | )5 | | | — | 10 | | | .05 | 5 | | | .20 | 5 |
| | | | | | | | | | | | | | | | | | | | | | | | | | | | | | | |
| | (.23 | ) | | | (.10 | ) | | | (.33 | ) | | | 26.19 | | | | 6.81 | 5 | | | 2,010 | | | | .34 | 6 | | | 1.99 | 6 |
| | (.50 | ) | | | (.61 | ) | | | (1.11 | ) | | | 24.83 | | | | 8.88 | | | | 1,986 | | | | .34 | | | | 1.91 | |
| | (.46 | ) | | | (.94 | ) | | | (1.40 | ) | | | 23.85 | | | | 1.98 | | | | 2,571 | | | | .34 | | | | 1.94 | |
| | (.45 | ) | | | (1.44 | ) | | | (1.89 | ) | | | 24.77 | | | | 9.16 | | | | 2,616 | | | | .34 | | | | 1.88 | |
| | (.44 | ) | | | — | | | | (.44 | ) | | | 24.43 | | | | 22.04 | | | | 2,492 | | | | .34 | | | | 1.89 | |
| | (.44 | ) | | | — | | | | (.44 | ) | | | 20.41 | | | | 14.51 | | | | 2,050 | | | | .35 | | | | 2.23 | |
See page 37 for footnotes.
Financial highlights (continued)
| | | | | | Income (loss) from investment operations1 |
| | | Net asset
value,
beginning
of period | | | Net
investment
income | | | Net gains (losses)
on securities (both
realized and
unrealized) | | | Total from
investment
operations | |
| Class R-6: | | | | | | | | | | | | | | | | |
| Six months ended 6/30/20173,4 | | $ | 24.81 | | | $ | .26 | | | $ | 1.44 | | | $ | 1.70 | |
| Year ended 12/31/2016 | | | 23.84 | | | | .48 | | | | 1.61 | | | | 2.09 | |
| Year ended 12/31/2015 | | | 24.76 | | | | .49 | | | | — | 7 | | | .49 | |
| Year ended 12/31/2014 | | | 24.42 | | | | .49 | | | | 1.75 | | | | 2.24 | |
| Year ended 12/31/2013 | | | 20.40 | | | | .44 | | | | 4.03 | | | | 4.47 | |
| Year ended 12/31/2012 | | | 18.21 | | | | .45 | | | | 2.19 | | | | 2.64 | |
| | | Six months ended | | Year ended December 31 |
| Portfolio turnover rate for all share classes12 | | June 30, 20173,4,5 | | 2016 | | 2015 | | 2014 | | 2013 | | 2012 |
| Including mortgage dollar roll transactions | | | 53 | % | | | 79 | % | | | 82 | % | | | 68 | % | | | 55 | % | | | 54 | % |
| Excluding mortgage dollar roll transactions | | | 35 | % | | | 48 | % | | | 45 | % | | | 48 | % | | | Not available |
See Notes to Financial Statements
| Dividends and distributions | | | | | | | | | | | | | | | | |
Dividends
(from net
investment
income) | | | Distributions
(from capital
gains) | | | Total
dividends
and
distributions | | | Net asset
value, end
of period | | | Total
return2 | | | Net assets,
end of period
(in millions) | | | Ratio of
expenses
to average
net assets | | | Ratio of net
income
to average
net assets | |
| | | | | | | | | | | | | | | | | | | | | | | | | | | | | | | |
| $ | (.24 | ) | | $ | (.10 | ) | | $ | (.34 | ) | | $ | 26.17 | | | | 6.84 | %5 | | $ | 15,005 | | | | .29 | %6 | | | 2.07 | %6 |
| | (.51 | ) | | | (.61 | ) | | | (1.12 | ) | | | 24.81 | | | | 8.90 | | | | 11,058 | | | | .29 | | | | 1.98 | |
| | (.47 | ) | | | (.94 | ) | | | (1.41 | ) | | | 23.84 | | | | 2.02 | | | | 7,290 | | | | .29 | | | | 1.99 | |
| | (.46 | ) | | | (1.44 | ) | | | (1.90 | ) | | | 24.76 | | | | 9.22 | | | | 6,076 | | | | .29 | | | | 1.93 | |
| | (.45 | ) | | | — | | | | (.45 | ) | | | 24.42 | | | | 22.12 | | | | 3,910 | | | | .29 | | | | 1.95 | |
| | (.45 | ) | | | — | | | | (.45 | ) | | | 20.40 | | | | 14.57 | | | | 2,151 | | | | .30 | | | | 2.28 | |
| 1 | Based on average shares outstanding. |
| 2 | Total returns exclude any applicable sales charges, including contingent deferred sales charges. |
| 3 | Based on operations for the period shown and, accordingly, is not representative of a full year. |
| 4 | Unaudited. |
| 5 | Not annualized. |
| 6 | Annualized. |
| 7 | Amount less than $.01. |
| 8 | Class T and 529-T shares began investment operations on April 7, 2017. |
| 9 | All or a significant portion of assets in this class consisted of seed capital invested by CRMC and/or its affiliates. Fees for distribution services are not charged or accrued on these seed capital assets. If such fees were paid by the fund on seed capital assets, fund expenses would have been higher and net income and total return would have been lower. |
| 10 | Amount less than $1 million. |
| 11 | Class F-3 shares began investment operations on January 27, 2017. |
| 12 | Class R-2E shares began investment operations on August 29, 2014. |
| 13 | Class R-5E shares began investment operations on November 20, 2015. |
| 12 | Refer to Note 5 for further information on mortgage dollar rolls. |
As a fund shareholder, you incur two types of costs: (1) transaction costs, such as initial sales charges on purchase payments and contingent deferred sales charges on redemptions (loads), and (2) ongoing costs, including management fees, distribution and service (12b-1) fees, and other expenses. This example is intended to help you understand your ongoing costs (in dollars) of investing in the fund so you can compare these costs with the ongoing costs of investing in other mutual funds. The example is based on an investment of $1,000 invested at the beginning of the period and held for the entire six-month period (January 1, 2017, through June 30, 2017).
Actual expenses:
The first line of each share class in the table on the following page provides information about actual account values and actual expenses. You may use the information in this line, together with the amount you invested, to estimate the expenses that you paid over the period. Simply divide your account value by $1,000 (for example, an $8,600 account value divided by $1,000 = 8.6), then multiply the result by the number in the first line under the heading titled “Expenses paid during period” to estimate the expenses you paid on your account during this period.
Hypothetical example for comparison purposes:
The second line of each share class in the table on the following page provides information about hypothetical account values and hypothetical expenses based on the actual expense ratio for the share class and an assumed rate of return of 5.00% per year before expenses, which is not the actual return of the share class. The hypothetical account values and expenses may not be used to estimate the actual ending account balance or expenses you paid for the period. You may use this information to compare the ongoing costs of investing in the fund and other funds. To do so, compare this 5.00% hypothetical example with the 5.00% hypothetical examples that appear in the shareholder reports of the other funds.
Notes:
Retirement plan participants may be subject to certain fees charged by the plan sponsor, and Class F-1, F-2, F-3 and 529-F-1 shareholders may be subject to fees charged by financial intermediaries, typically ranging from 0.75% to 1.50% of assets annually depending on services offered. You can estimate the impact of these fees by adding the amount of the fees to the total estimated expenses you paid on your account during the period as calculated above. In addition, your ending account value would be lower by the amount of these fees.
Note that the expenses shown in the table on the following page are meant to highlight your ongoing costs only and do not reflect any transactional costs, such as sales charges (loads). Therefore, the second line of each share class in the table is useful in comparing ongoing costs only and will not help you determine the relative total costs of owning different funds. In addition, if these transactional costs were included, your costs would have been higher.
| | | Beginning account value 1/1/2017 | | | Ending account value 6/30/2017 | | | Expenses paid
during period1 | | | Annualized expense ratio | |
| Class A - actual return | | $ | 1,000.00 | | | $ | 1,066.49 | | | $ | 2.92 | | | | .57 | % |
| Class A - assumed 5% return | | | 1,000.00 | | | | 1,021.97 | | | | 2.86 | | | | .57 | |
| Class C - actual return | | | 1,000.00 | | | | 1,062.74 | | | | 7.01 | | | | 1.37 | |
| Class C - assumed 5% return | | | 1,000.00 | | | | 1,018.00 | | | | 6.85 | | | | 1.37 | |
| Class T - actual return2 | | | 1,000.00 | | | | 1,023.30 | | | | .86 | | | | .37 | |
| Class T - assumed 5% return2 | | | 1,000.00 | | | | 1,022.96 | | | | 1.86 | | | | .37 | |
| Class F-1 - actual return | | | 1,000.00 | | | | 1,066.12 | | | | 3.38 | | | | .66 | |
| Class F-1 - assumed 5% return | | | 1,000.00 | | | | 1,021.52 | | | | 3.31 | | | | .66 | |
| Class F-2 - actual return | | | 1,000.00 | | | | 1,067.89 | | | | 2.05 | | | | .40 | |
| Class F-2 - assumed 5% return | | | 1,000.00 | | | | 1,022.81 | | | | 2.01 | | | | .40 | |
| Class F-3 - actual return3 | | | 1,000.00 | | | | 1,043.72 | | | | 1.25 | | | | .29 | |
| Class F-3 - assumed 5% return3 | | | 1,000.00 | | | | 1,023.36 | | | | 1.45 | | | | .29 | |
| Class 529-A - actual return | | | 1,000.00 | | | | 1,066.17 | | | | 3.33 | | | | .65 | |
| Class 529-A - assumed 5% return | | | 1,000.00 | | | | 1,021.57 | | | | 3.26 | | | | .65 | |
| Class 529-C - actual return | | | 1,000.00 | | | | 1,062.24 | | | | 7.26 | | | | 1.42 | |
| Class 529-C - assumed 5% return | | | 1,000.00 | | | | 1,017.75 | | | | 7.10 | | | | 1.42 | |
| Class 529-E - actual return | | | 1,000.00 | | | | 1,065.00 | | | | 4.56 | | | | .89 | |
| Class 529-E - assumed 5% return | | | 1,000.00 | | | | 1,020.38 | | | | 4.46 | | | | .89 | |
| Class 529-T - actual return2 | | | 1,000.00 | | | | 1,023.22 | | | | .95 | | | | .41 | |
| Class 529-T - assumed 5% return2 | | | 1,000.00 | | | | 1,022.76 | | | | 2.06 | | | | .41 | |
| Class 529-F-1 - actual return | | | 1,000.00 | | | | 1,067.41 | | | | 2.20 | | | | .43 | |
| Class 529-F-1 - assumed 5% return | | | 1,000.00 | | | | 1,022.66 | | | | 2.16 | | | | .43 | |
| Class R-1 - actual return | | | 1,000.00 | | | | 1,062.60 | | | | 7.06 | | | | 1.38 | |
| Class R-1 - assumed 5% return | | | 1,000.00 | | | | 1,017.95 | | | | 6.90 | | | | 1.38 | |
| Class R-2 - actual return | | | 1,000.00 | | | | 1,062.31 | | | | 7.06 | | | | 1.38 | |
| Class R-2 - assumed 5% return | | | 1,000.00 | | | | 1,017.95 | | | | 6.90 | | | | 1.38 | |
| Class R-2E - actual return | | | 1,000.00 | | | | 1,063.88 | | | | 5.53 | | | | 1.08 | |
| Class R-2E - assumed 5% return | | | 1,000.00 | | | | 1,019.44 | | | | 5.41 | | | | 1.08 | |
| Class R-3 - actual return | | | 1,000.00 | | | | 1,064.47 | | | | 4.81 | | | | .94 | |
| Class R-3 - assumed 5% return | | | 1,000.00 | | | | 1,020.13 | | | | 4.71 | | | | .94 | |
| Class R-4 - actual return | | | 1,000.00 | | | | 1,066.71 | | | | 3.28 | | | | .64 | |
| Class R-4 - assumed 5% return | | | 1,000.00 | | | | 1,021.62 | | | | 3.21 | | | | .64 | |
| Class R-5E - actual return | | | 1,000.00 | | | | 1,067.41 | | | | 2.15 | | | | .42 | |
| Class R-5E - assumed 5% return | | | 1,000.00 | | | | 1,022.71 | | | | 2.11 | | | | .42 | |
| Class R-5 - actual return | | | 1,000.00 | | | | 1,068.08 | | | | 1.74 | | | | .34 | |
| Class R-5 - assumed 5% return | | | 1,000.00 | | | | 1,023.11 | | | | 1.71 | | | | .34 | |
| Class R-6 - actual return | | | 1,000.00 | | | | 1,068.36 | | | | 1.49 | | | | .29 | |
| Class R-6 - assumed 5% return | | | 1,000.00 | | | | 1,023.36 | | | | 1.45 | | | | .29 | |
See page 40 for footnotes.
| 1 | The “expenses paid during period” are equal to the “annualized expense ratio,” multiplied by the average account value over the period, multiplied by the number of days in the period, and divided by 365 (to reflect the one-half year period). |
| 2 | The period for the “annualized expense ratio” and “actual return” line is based on the number of days since the share class began investment operations on April 7, 2017. The “assumed 5% return” line is based on 181 days. |
| 3 | The period for the “annualized expense ratio” and “actual return” line is based on the number of days since the share class began investment operations on January 27, 2017. The “assumed 5% return” line is based on 181 days. |
This page was intentionally left blank.
This page was intentionally left blank.
This page was intentionally left blank.
Office of the fund
6455 Irvine Center Drive
Irvine, CA 92618-4518
Investment adviser
Capital Research and Management Company
333 South Hope Street
Los Angeles, CA 90071-1406
6455 Irvine Center Drive
Irvine, CA 92618-4518
Transfer agent for shareholder accounts
American Funds Service Company
(Write to the address near you.)
P.O. Box 6007
Indianapolis, IN 46206-6007
P.O. Box 2280
Norfolk, VA 23501-2280
Custodian of assets
JPMorgan Chase Bank
270 Park Avenue
New York, NY 10017-2070
Counsel
Morgan, Lewis & Bockius LLP
300 South Grand Avenue, 22nd Floor
Los Angeles, CA 90071-3132
Independent registered public accounting firm
Deloitte & Touche LLP
695 Town Center Drive
Suite 1200
Costa Mesa, CA 92626-7188
Principal underwriter
American Funds Distributors, Inc.
333 South Hope Street
Los Angeles, CA 90071-1406
Investors should carefully consider investment objectives, risks, charges and expenses. This and other important information is contained in the fund prospectus and summary prospectus, which can be obtained from your financial professional and should be read carefully before investing. You may also call American Funds Service Company (AFS) at (800) 421-4225 or visit the American Funds website at americanfunds.com. Securities offered through American Funds Distributors, Inc.
“American Funds Proxy Voting Procedures and Principles” — which describes how we vote proxies relating to portfolio securities — is available on the American Funds website or upon request by calling AFS. The fund files its proxy voting record with the U.S. Securities and Exchange Commission (SEC) for the 12 months ended June 30 by August 31. The proxy voting record is available free of charge on the SEC website at sec.gov and on the American Funds website.
A complete June 30, 2017, portfolio of American Balanced Fund’s investments is available free of charge by calling AFS or visiting the SEC website (where it is part of Form N-CSR).
American Balanced Fund files a complete list of its portfolio holdings with the SEC for the first and third quarters of each fiscal year on Form N-Q. This filing is available free of charge on the SEC website. You may also review or, for a fee, copy this filing at the SEC’s Public Reference Room in Washington, D.C. Additional information regarding the operation of the Public Reference Room may be obtained by calling the SEC’s Office of Investor Education and Advocacy at (800) SEC-0330. Additionally, the list of portfolio holdings is available by calling AFS.
This report is for the information of shareholders of American Balanced Fund, but it also may be used as sales literature when preceded or accompanied by the current prospectus or summary prospectus, which gives details about charges, expenses, investment objectives and operating policies of the fund. If used as sales material after September 30, 2017, this report must be accompanied by an American Funds statistical update for the most recently completed calendar quarter.
Bloomberg® is a trademark of Bloomberg Finance L.P. (collectively with its affiliates, “Bloomberg”). Barclays® is a trademark of Barclays Bank Plc (collectively with its affiliates, “Barclays”), used under license. Neither Bloomberg nor Barclays approves or endorses this material, guarantees the accuracy or completeness of any information herein and, to the maximum extent allowed by law, neither shall have any liability or responsibility for injury or damages arising in connection therewith. Standard & Poor’s 500 Composite Index (“Index”) is a product of S&P Dow Jones Indices LLC and/or its affiliates and has been licensed for use by Capital Group. Copyright © 2017 S&P Dow Jones Indices LLC, a division of S&P Global, and/or its affiliates. All rights reserved. Redistribution or reproduction in whole or in part are prohibited without written permission of S&P Dow Jones Indices LLC.
American Funds from Capital Group
The Capital AdvantageSM
Since 1931, American Funds, part of Capital Group, has helped investors pursue long-term investment success. Our consistent approach — in combination with The Capital SystemSM — has resulted in a superior long-term track record.
| | Aligned with investor success |
| | We base our decisions on a long-term perspective, which we believe aligns our goals with the interests of our clients. Our portfolio managers average 27 years of investment experience, including 21 years at our company, reflecting a career commitment to our long-term approach.1 |
| | |
| | The Capital System |
| | The Capital System combines individual accountability with teamwork. Funds using The Capital System are divided into portions that are managed independently by investment professionals with diverse backgrounds, ages and investment approaches. An extensive global research effort is the backbone of our system. |
| | |
| | American Funds’ superior long-term track record |
| | Equity funds have beaten their Lipper peer indexes in 93% of 10-year periods and 98% of 20-year periods. Fixed income funds have beaten their Lipper indexes in 80% of 10-year periods and 80% of 20-year periods.2 Fund management fees have been among the lowest in the industry.3 |
| | 1 | Portfolio manager experience as of December 31, 2016. |
| | 2 | Based on Class F-2 share results for rolling periods through December 31, 2016. Periods covered are the shorter of the fund’s lifetime or since the comparable Lipper index inception date (except Capital Income Builder and SMALLCAP World Fund, for which the Lipper average was used). Expenses differ for each share class, so results will vary. Class F-2 shares were first offered on August 1, 2008. Class F-2 share results prior to the date of first sale are hypothetical based on Class A share results without a sales charge, adjusted for typical estimated expenses. Results for certain funds with an inception date after August 1, 2008, also include hypothetical returns because those funds’ Class F-2 shares sold after the funds’ date of first offering. Please see americanfunds.com for more information on specific expense adjustments and the actual dates of first sale. |
| | 3 | On average, our management fees were in the lowest quintile 73% of the time, based on the 20-year period ended December 31, 2016, versus comparable Lipper categories, excluding funds of funds. |

ITEM 2 – Code of Ethics
Not applicable for filing of semi-annual reports to shareholders.
ITEM 3 – Audit Committee Financial Expert
Not applicable for filing of semi-annual reports to shareholders.
ITEM 4 – Principal Accountant Fees and Services
Not applicable for filing of semi-annual reports to shareholders.
ITEM 5 – Audit Committee of Listed Registrants
Not applicable to this Registrant, insofar as the Registrant is not a listed issuer as defined in Rule 10A-3 under the Securities Exchange Act of 1934.
ITEM 6 – Schedule of Investments

American Balanced Fund®
Investment portfolio
June 30, 2017
unaudited
Common stocks60.26%
Information technology13.16% | Shares | Value
(000) |
| Microsoft Corp. | 62,012,000 | $4,274,487 |
| Broadcom Ltd. | 7,053,457 | 1,643,808 |
| Intel Corp. | 31,684,100 | 1,069,022 |
| Facebook, Inc., Class A1 | 6,272,000 | 946,947 |
| Alphabet Inc., Class C1 | 836,800 | 760,425 |
| Alphabet Inc., Class A1 | 179,500 | 166,878 |
| ASML Holding NV (New York registered) | 5,117,458 | 666,856 |
| ASML Holding NV | 1,905,000 | 248,258 |
| Symantec Corp.2 | 32,026,000 | 904,734 |
| Apple Inc. | 5,438,000 | 783,181 |
| Taiwan Semiconductor Manufacturing Co., Ltd. (ADR) | 19,527,000 | 682,664 |
| Intuit Inc. | 4,598,277 | 610,697 |
| TE Connectivity Ltd. | 7,205,000 | 566,889 |
| VeriSign, Inc.1,2 | 5,500,000 | 511,280 |
| Visa Inc., Class A | 4,561,000 | 427,731 |
| Texas Instruments Inc. | 4,050,000 | 311,566 |
| Analog Devices, Inc. | 2,996,000 | 233,089 |
| Amphenol Corp., Class A | 806,000 | 59,499 |
| MasterCard Inc., Class A | 472,000 | 57,324 |
| | | 14,925,335 |
| Consumer discretionary9.17% | | |
| Home Depot, Inc. | 17,362,349 | 2,663,384 |
| Comcast Corp., Class A | 61,635,000 | 2,398,834 |
| Amazon.com, Inc.1 | 2,010,000 | 1,945,680 |
| McDonald’s Corp. | 3,493,000 | 534,988 |
| CBS Corp., Class B | 7,233,000 | 461,321 |
| Starbucks Corp. | 6,330,000 | 369,102 |
| Charter Communications, Inc., Class A1 | 908,100 | 305,894 |
| NIKE, Inc., Class B | 4,901,000 | 289,159 |
| VF Corp. | 4,669,000 | 268,934 |
| Marriott International, Inc., Class A | 2,288,000 | 229,509 |
| General Motors Co. | 5,000,000 | 174,650 |
| Priceline Group Inc.1 | 80,900 | 151,325 |
| LVMH Moët Hennessy-Louis Vuitton SE | 598,000 | 149,100 |
| Twenty-First Century Fox, Inc., Class A | 4,970,000 | 140,850 |
| Viacom Inc., Class B | 4,000,000 | 134,280 |
| Netflix, Inc.1 | 548,000 | 81,877 |
| Dollar General Corp. | 1,013,000 | 73,027 |
| Hasbro, Inc. | 243,000 | 27,097 |
| | | 10,399,011 |
| Financials7.77% | | |
| Berkshire Hathaway Inc., Class A1 | 7,972 | 2,030,469 |
| Berkshire Hathaway Inc., Class B1 | 800,000 | 135,496 |
| Wells Fargo & Co. | 24,943,500 | 1,382,119 |
| SunTrust Banks, Inc. | 16,126,083 | 914,672 |
American Balanced Fund — Page 1 of 33
unaudited
Common stocks
Financials (continued) | Shares | Value
(000) |
| JPMorgan Chase & Co. | 9,753,000 | $891,424 |
| Chubb Ltd. | 6,070,500 | 882,529 |
| BlackRock, Inc. | 1,349,000 | 569,831 |
| Capital One Financial Corp. | 5,468,047 | 451,770 |
| Goldman Sachs Group, Inc. | 1,545,228 | 342,886 |
| Citigroup Inc. | 4,000,000 | 267,520 |
| PNC Financial Services Group, Inc. | 2,000,000 | 249,740 |
| Bank of America Corp. | 10,000,000 | 242,600 |
| Legal & General Group PLC | 70,000,000 | 235,496 |
| HDFC Bank Ltd.3 | 4,275,000 | 110,042 |
| HDFC Bank Ltd. (ADR) | 581,924 | 50,610 |
| Intercontinental Exchange, Inc. | 772,000 | 50,890 |
| | | 8,808,094 |
| Consumer staples6.08% | | |
| Philip Morris International Inc. | 16,770,000 | 1,969,637 |
| Coca-Cola Co. | 32,173,000 | 1,442,959 |
| Kraft Heinz Co. | 11,710,850 | 1,002,917 |
| Altria Group, Inc. | 8,405,000 | 625,920 |
| Procter & Gamble Co. | 6,037,563 | 526,174 |
| Costco Wholesale Corp. | 1,698,900 | 271,705 |
| Reynolds American Inc. | 4,068,000 | 264,583 |
| Coca-Cola European Partners PLC | 4,000,000 | 162,680 |
| Walgreens Boots Alliance, Inc. | 2,000,000 | 156,620 |
| Pinnacle Foods Inc. | 2,345,000 | 139,293 |
| British American Tobacco PLC | 1,993,515 | 135,898 |
| General Mills, Inc. | 1,850,000 | 102,490 |
| Kellogg Co. | 1,350,000 | 93,771 |
| | | 6,894,647 |
| Energy5.75% | | |
| Schlumberger Ltd. | 18,262,000 | 1,202,370 |
| Royal Dutch Shell PLC, Class B (ADR) | 18,493,000 | 1,006,574 |
| Royal Dutch Shell PLC, Class B | 4,000,000 | 107,452 |
| Chevron Corp. | 7,594,755 | 792,361 |
| Enbridge Inc. | 16,680,000 | 664,031 |
| Noble Energy, Inc. | 18,206,729 | 515,250 |
| Halliburton Co. | 10,561,000 | 451,060 |
| Baker Hughes Inc. | 8,000,000 | 436,080 |
| ConocoPhillips | 5,837,668 | 256,624 |
| Concho Resources Inc.1 | 1,805,000 | 219,362 |
| Phillips 66 | 2,180,000 | 180,264 |
| Suncor Energy Inc. | 6,000,000 | 175,308 |
| BP PLC | 22,000,000 | 126,880 |
| TOTAL SA | 1,605,245 | 79,360 |
| TOTAL SA (ADR) | 898,769 | 44,570 |
| Hess Corp. | 2,501,605 | 109,745 |
| Murphy Oil Corp. | 3,600,080 | 92,270 |
| Weatherford International PLC1 | 15,850,000 | 61,340 |
| | | 6,520,901 |
| Health care5.75% | | |
| UnitedHealth Group Inc. | 11,496,500 | 2,131,681 |
| Johnson & Johnson | 7,660,000 | 1,013,341 |
| Merck & Co., Inc. | 15,232,000 | 976,219 |
American Balanced Fund — Page 2 of 33
unaudited
Common stocks
Health care (continued) | Shares | Value
(000) |
| Express Scripts Holding Co.1 | 10,676,400 | $681,581 |
| Medtronic PLC | 6,005,000 | 532,944 |
| Bristol-Myers Squibb Co. | 5,000,000 | 278,600 |
| Thermo Fisher Scientific Inc. | 1,479,000 | 258,041 |
| Kite Pharma, Inc.1 | 1,325,400 | 137,404 |
| Vertex Pharmaceuticals Inc.1 | 998,500 | 128,677 |
| Regeneron Pharmaceuticals, Inc.1 | 255,500 | 125,486 |
| Humana Inc. | 454,000 | 109,242 |
| Intercept Pharmaceuticals, Inc.1 | 706,622 | 85,551 |
| Pfizer Inc. | 1,750,000 | 58,783 |
| | | 6,517,550 |
| Industrials3.22% | | |
| Boeing Co. | 6,876,600 | 1,359,848 |
| Lockheed Martin Corp. | 4,207,037 | 1,167,916 |
| Johnson Controls International PLC | 6,430,375 | 278,821 |
| General Electric Co. | 8,250,000 | 222,832 |
| Cummins Inc. | 1,350,000 | 218,997 |
| TransDigm Group Inc. | 708,100 | 190,387 |
| Caterpillar Inc. | 1,300,000 | 139,698 |
| Parker-Hannifin Corp. | 425,000 | 67,923 |
| | | 3,646,422 |
| Materials3.00% | | |
| E.I. du Pont de Nemours and Co. | 20,784,000 | 1,677,477 |
| LyondellBasell Industries NV | 5,290,100 | 446,432 |
| Praxair, Inc. | 2,888,400 | 382,857 |
| Royal Gold, Inc.2 | 3,463,000 | 270,703 |
| Sherwin-Williams Co. | 743,000 | 260,763 |
| Dow Chemical Co. | 2,500,000 | 157,675 |
| Potash Corp. of Saskatchewan Inc. | 6,500,000 | 105,950 |
| Nucor Corp. | 1,750,000 | 101,272 |
| | | 3,403,129 |
| Real estate1.48% | | |
| Crown Castle International Corp. REIT | 6,133,446 | 614,448 |
| Iron Mountain Inc. REIT | 10,166,200 | 349,311 |
| Digital Realty Trust, Inc. REIT | 2,500,000 | 282,375 |
| Equinix, Inc. REIT | 400,000 | 171,664 |
| American Tower Corp. REIT | 1,228,000 | 162,489 |
| Ventas, Inc. REIT | 1,358,000 | 94,354 |
| | | 1,674,641 |
| Telecommunication services0.45% | | |
| AT&T Inc. | 11,632,000 | 438,875 |
| Verizon Communications Inc. | 1,636,000 | 73,064 |
| | | 511,939 |
| Utilities0.31% | | |
| PG&E Corp. | 2,000,000 | 132,740 |
| Dominion Energy, Inc. | 1,680,381 | 128,768 |
| Pinnacle West Capital Corp. | 1,000,000 | 85,160 |
| | | 346,668 |
American Balanced Fund — Page 3 of 33
unaudited
Common stocks
Miscellaneous4.12% | Shares | Value
(000) |
| Other common stocks in initial period of acquisition | | $4,667,855 |
| Total common stocks (cost: $44,241,086,000) | | 68,316,192 |
Preferred securities0.00%
Financials0.00% | | |
| CoBank, ACB, Class E, noncumulative4 | 7,440 | 4,627 |
| Total preferred securities (cost: $5,208,000) | | 4,627 |
Bonds, notes & other debt instruments33.56%
Corporate bonds & notes12.52%
Financials3.01% | Principal?amount
(000) | |
| ACE INA Holdings Inc. 2.30% 2020 | $7,635 | 7,681 |
| ACE INA Holdings Inc. 2.875% 2022 | 22,180 | 22,577 |
| ACE INA Holdings Inc. 3.35% 2026 | 5,180 | 5,305 |
| Allstate Corp. 3.28% 2026 | 10,185 | 10,359 |
| American Express Co. 6.15% 2017 | 22,800 | 22,951 |
| American Express Credit Co. 1.55% 2017 | 9,055 | 9,057 |
| Australia & New Zealand Banking Group Ltd. 2.625% 2022 | 29,000 | 29,053 |
| AXA SA, Series B, junior subordinated 6.379% (undated)4 | 2,000 | 2,263 |
| Banco Santander, SA 3.70% 20224 | 28,500 | 28,896 |
| Bank of America Corp. 2.625% 2020 | 20,000 | 20,216 |
| Bank of America Corp. 2.625% 2021 | 4,730 | 4,755 |
| Bank of America Corp. 2.503% 2022 | 29,000 | 28,661 |
| Bank of America Corp. 3.124% 2023 | 28,000 | 28,334 |
| Bank of America Corp. 3.875% 2025 | 25,385 | 26,291 |
| Bank of America Corp. 3.248% 2027 | 11,250 | 10,896 |
| Bank of America Corp. 3.705% 2028 | 21,750 | 21,941 |
| Bank of America Corp. 3.824% 2028 | 10,500 | 10,696 |
| Bank of America Corp. 4.244% 2038 | 7,500 | 7,824 |
| Barclays Bank PLC 3.25% 2021 | 19,345 | 19,695 |
| Barclays Bank PLC 3.65% 2025 | 18,500 | 18,476 |
| BB&T Corp. 2.45% 2020 | 37,000 | 37,424 |
| BB&T Corp. 2.625% 2022 | 22,500 | 22,772 |
| BB&T Corp. 2.75% 2022 | 45,000 | 45,690 |
| Berkshire Hathaway Finance Corp. 1.30% 2019 | 15,320 | 15,214 |
| Berkshire Hathaway Inc. 2.00% 2018 | 16,340 | 16,422 |
| Berkshire Hathaway Inc. 2.90% 2020 | 9,500 | 9,808 |
| Berkshire Hathaway Inc. 2.75% 2023 | 16,995 | 17,231 |
| BNP Paribas 4.375% 20254 | 5,700 | 5,919 |
| BNP Paribas 4.375% 20264 | 6,350 | 6,592 |
| BPCE SA group 5.70% 20234 | 13,830 | 15,417 |
| BPCE SA group 5.15% 20244 | 20,000 | 21,401 |
| Capital One Financial Corp. 3.20% 2025 | 20,000 | 19,612 |
| Carlyle Investment Management (1-month USD-LIBOR + 2.00%) 3.299% 20193,4,5,6 | 805 | 805 |
| Carlyle Investment Management (1-month USD-LIBOR + 2.00%) 3.299% 20193,4,5,6 | 615 | 614 |
| Charles Schwab Corp. 3.45% 2026 | 3,885 | 3,985 |
| Citigroup Inc. 2.05% 2019 | 24,500 | 24,528 |
| Citigroup Inc. 8.50% 2019 | 8,416 | 9,404 |
| Citigroup Inc. 2.35% 2021 | 71,000 | 70,416 |
| Citigroup Inc. 2.70% 2021 | 24,500 | 24,673 |
| Citigroup Inc. 2.90% 2021 | 53,000 | 53,586 |
American Balanced Fund — Page 4 of 33
unaudited
Bonds, notes & other debt instruments
Corporate bonds & notes (continued)
Financials (continued) | Principal?amount
(000) | Value
(000) |
| Citigroup Inc. 3.20% 2026 | $18,000 | $17,528 |
| Citigroup Inc. 3.887% 2028 | 9,500 | 9,667 |
| CME Group Inc. 5.30% 2043 | 3,135 | 3,912 |
| CNA Financial Corp. 3.95% 2024 | 9,910 | 10,295 |
| Commonwealth Bank of Australia 2.25% 20204 | 6,250 | 6,265 |
| Commonwealth Bank of Australia 2.75% 20224 | 6,250 | 6,308 |
| Crédit Agricole SA 2.375% 20214 | 6,645 | 6,622 |
| Crédit Agricole SA 3.375% 20224 | 20,125 | 20,683 |
| Crédit Agricole SA 4.375% 20254 | 14,825 | 15,397 |
| Credit Suisse Group AG 1.70% 2018 | 12,000 | 12,001 |
| Credit Suisse Group AG 3.45% 2021 | 20,000 | 20,547 |
| Credit Suisse Group AG 3.80% 2023 | 32,275 | 33,314 |
| Danske Bank AS 2.00% 20214 | 37,870 | 37,242 |
| Danske Bank AS 2.70% 20224 | 47,600 | 47,932 |
| DNB ASA 2.375% 20214 | 27,000 | 26,895 |
| Goldman Sachs Group, Inc. 2.90% 2018 | 15,000 | 15,174 |
| Goldman Sachs Group, Inc. 2.55% 2019 | 66,250 | 67,013 |
| Goldman Sachs Group, Inc. 2.60% 2020 | 14,610 | 14,754 |
| Goldman Sachs Group, Inc. 2.75% 2020 | 20,725 | 20,989 |
| Goldman Sachs Group, Inc. (3-month USD-LIBOR + 1.36%) 2.516% 20216 | 25,782 | 26,286 |
| Goldman Sachs Group, Inc. 2.625% 2021 | 9,465 | 9,491 |
| Goldman Sachs Group, Inc. 2.875% 2021 | 19,245 | 19,466 |
| Goldman Sachs Group, Inc. 5.25% 2021 | 20,000 | 21,931 |
| Goldman Sachs Group, Inc. 3.00% 2022 | 35,000 | 35,343 |
| Goldman Sachs Group, Inc. 5.75% 2022 | 20,000 | 22,529 |
| Goldman Sachs Group, Inc. 2.908% 2023 | 53,750 | 53,598 |
| Goldman Sachs Group, Inc. 3.50% 2025 | 3,250 | 3,289 |
| Goldman Sachs Group, Inc. 3.75% 2026 | 12,629 | 12,884 |
| Goldman Sachs Group, Inc. 3.691% 2028 | 34,750 | 34,935 |
| HSBC Holdings PLC 2.95% 2021 | 32,500 | 32,928 |
| HSBC Holdings PLC 2.65% 2022 | 15,000 | 14,959 |
| HSBC Holdings PLC 3.262% 2023 | 50,500 | 51,485 |
| HSBC Holdings PLC 4.25% 2024 | 8,000 | 8,289 |
| HSBC Holdings PLC 3.90% 2026 | 7,825 | 8,087 |
| Intercontinentalexchange, Inc. 2.50% 2018 | 20,000 | 20,200 |
| Intesa Sanpaolo SpA 5.017% 20244 | 27,485 | 27,917 |
| JPMorgan Chase & Co. 2.25% 2020 | 42,185 | 42,328 |
| JPMorgan Chase & Co. 2.55% 2020 | 32,300 | 32,583 |
| JPMorgan Chase & Co. 2.40% 2021 | 32,500 | 32,453 |
| JPMorgan Chase & Co. 2.55% 2021 | 24,235 | 24,364 |
| JPMorgan Chase & Co. 3.25% 2022 | 10,000 | 10,254 |
| JPMorgan Chase & Co. 3.875% 2024 | 25,000 | 25,820 |
| JPMorgan Chase & Co. 3.54% 2028 | 30,000 | 30,203 |
| JPMorgan Chase & Co., Series Z, junior subordinated 5.30% 2049 | 35,000 | 36,531 |
| JPMorgan Chase & Co., Series S, junior subordinated 6.75% (undated) | 25,000 | 28,438 |
| Keybank National Association 2.50% 2019 | 17,000 | 17,176 |
| Leucadia National Corp. 5.50% 2023 | 830 | 889 |
| Liberty Mutual Group Inc. 4.25% 20234 | 3,000 | 3,195 |
| Lloyds Banking Group PLC 3.00% 2022 | 30,000 | 30,325 |
| Lloyds Banking Group PLC 4.582% 2025 | 14,750 | 15,321 |
| MetLife Global Funding I 1.55% 20194 | 15,500 | 15,368 |
| MetLife Global Funding I 2.30% 20194 | 10,120 | 10,208 |
| MetLife Global Funding I 2.00% 20204 | 6,125 | 6,110 |
| MetLife Global Funding I 2.50% 20204 | 46,300 | 46,645 |
American Balanced Fund — Page 5 of 33
unaudited
Bonds, notes & other debt instruments
Corporate bonds & notes (continued)
Financials (continued) | Principal?amount
(000) | Value
(000) |
| MetLife Global Funding I 1.95% 20214 | $15,500 | $15,193 |
| MetLife, Inc. 3.60% 2025 | 4,595 | 4,772 |
| MetLife, Inc. 5.25% 2049 | 4,600 | 4,787 |
| Mitsubishi UFJ Financial Group, Inc. 2.19% 2021 | 25,500 | 25,143 |
| Mitsubishi UFJ Financial Group, Inc. 2.998% 2022 | 18,300 | 18,582 |
| Moody’s Corp. 2.75% 2021 | 20,000 | 20,186 |
| Morgan Stanley 2.50% 2021 | 46,000 | 45,985 |
| Morgan Stanley 2.75% 2022 | 29,500 | 29,510 |
| Morgan Stanley (3-month USD-LIBOR + 1.22%) 2.373% 20246 | 52,250 | 52,562 |
| Morgan Stanley 4.00% 2025 | 8,950 | 9,352 |
| Morgan Stanley 3.875% 2026 | 9,500 | 9,792 |
| Morgan Stanley 3.625% 2027 | 20,125 | 20,278 |
| National Australia Bank Ltd. 1.375% 2019 | 10,200 | 10,084 |
| National Australia Bank Ltd. 1.875% 2021 | 10,200 | 9,984 |
| National Australia Bank Ltd. 2.50% 2022 | 29,500 | 29,349 |
| Nationwide Mutual Insurance Co. (3-month USD-LIBOR + 2.29%) 3.536% 20244,6 | 8,150 | 8,162 |
| New York Life Global Funding 1.50% 20194 | 15,265 | 15,144 |
| New York Life Global Funding 2.10% 20194 | 15,000 | 15,076 |
| New York Life Global Funding 1.95% 20204 | 16,000 | 15,971 |
| New York Life Global Funding 1.70% 20214 | 40,500 | 39,487 |
| New York Life Global Funding 2.35% 20264 | 11,890 | 11,392 |
| Nordea Bank AB 2.50% 20204 | 19,955 | 20,153 |
| Nordea Bank AB 2.25% 20214 | 8,800 | 8,747 |
| PNC Bank 1.45% 2019 | 33,375 | 33,069 |
| PNC Bank 2.40% 2019 | 14,800 | 14,945 |
| PNC Bank 2.60% 2020 | 30,000 | 30,435 |
| PNC Bank 2.55% 2021 | 17,000 | 17,119 |
| PNC Financial Services Group, Inc. 3.90% 2024 | 20,000 | 20,920 |
| Prudential Financial, Inc. 2.30% 2018 | 7,595 | 7,640 |
| Prudential Financial, Inc. 3.50% 2024 | 23,600 | 24,609 |
| QBE Insurance Group Ltd. 2.40% 20184 | 19,300 | 19,321 |
| Rabobank Nederland 2.25% 2019 | 15,000 | 15,100 |
| Rabobank Nederland 2.50% 2021 | 14,700 | 14,793 |
| Rabobank Nederland 2.75% 2022 | 23,500 | 23,870 |
| Rabobank Nederland 4.375% 2025 | 22,650 | 23,795 |
| Skandinaviska Enskilda Banken AB 1.875% 2021 | 25,500 | 24,930 |
| Skandinaviska Enskilda Banken AB 2.625% 2021 | 23,000 | 23,193 |
| Skandinaviska Enskilda Banken AB 2.80% 2022 | 33,750 | 34,149 |
| Sumitomo Mitsui Banking Corp. 2.50% 2018 | 12,475 | 12,570 |
| Svenska Handelsbanken AB 1.875% 2021 | 16,845 | 16,483 |
| Travelers Companies, Inc. 4.00% 2047 | 22,735 | 23,308 |
| UBS Group AG 2.95% 20204 | 20,000 | 20,445 |
| UBS Group AG 4.125% 20254 | 28,250 | 29,646 |
| UniCredit SPA 3.75% 20224 | 70,825 | 72,606 |
| UniCredit SPA 4.625% 20274 | 30,900 | 32,661 |
| UniCredit SPA 5.861% 20324 | 48,700 | 50,115 |
| Unum Group 5.625% 2020 | 345 | 378 |
| Unum Group 3.875% 2025 | 5,045 | 5,123 |
| US Bancorp. 2.625% 2022 | 16,225 | 16,402 |
| US Bancorp. 3.70% 2024 | 18,000 | 19,044 |
| US Bancorp. 2.375% 2026 | 35,000 | 33,028 |
| US Bancorp. 3.15% 2027 | 46,500 | 46,641 |
| US Bank NA 1.40% 2019 | 5,465 | 5,433 |
| US Bank NA 2.125% 2019 | 30,000 | 30,234 |
American Balanced Fund — Page 6 of 33
unaudited
Bonds, notes & other debt instruments
Corporate bonds & notes (continued)
Financials (continued) | Principal?amount
(000) | Value
(000) |
| Wells Fargo & Co. 2.15% 2019 | $20,000 | $20,101 |
| Wells Fargo & Co. 2.55% 2020 | 16,100 | 16,291 |
| Wells Fargo & Co. 2.10% 2021 | 25,600 | 25,273 |
| Wells Fargo & Co. 2.50% 2021 | 67,182 | 67,444 |
| Wells Fargo & Co. 4.60% 2021 | 25,000 | 26,960 |
| Wells Fargo & Co. 3.069% 2023 | 48,000 | 48,669 |
| Wells Fargo & Co. 3.00% 2026 | 16,750 | 16,332 |
| Wells Fargo & Co. 3.584% 2028 | 21,375 | 21,625 |
| Westpac Banking Corp. 2.15% 2020 | 28,000 | 28,064 |
| | | 3,414,261 |
| Health care1.68% | | |
| Abbott Laboratories 2.80% 2020 | 13,870 | 14,096 |
| Abbott Laboratories 2.90% 2021 | 49,920 | 50,446 |
| Abbott Laboratories 3.40% 2023 | 16,745 | 17,163 |
| Abbott Laboratories 3.75% 2026 | 58,770 | 60,115 |
| Abbott Laboratories 4.75% 2036 | 4,800 | 5,247 |
| Abbott Laboratories 4.90% 2046 | 30,695 | 34,061 |
| AbbVie Inc. 2.50% 2020 | 10,400 | 10,527 |
| AbbVie Inc. 2.30% 2021 | 25,485 | 25,443 |
| AbbVie Inc. 3.20% 2022 | 5,685 | 5,837 |
| AbbVie Inc. 2.85% 2023 | 11,095 | 11,084 |
| AbbVie Inc. 3.60% 2025 | 23,000 | 23,502 |
| AbbVie Inc. 3.20% 2026 | 36,045 | 35,691 |
| AbbVie Inc. 4.50% 2035 | 10,360 | 10,971 |
| AbbVie Inc. 4.30% 2036 | 4,730 | 4,834 |
| AbbVie Inc. 4.45% 2046 | 38,800 | 40,270 |
| Aetna Inc. 1.70% 2018 | 42,635 | 42,662 |
| Allergan PLC 3.00% 2020 | 26,950 | 27,555 |
| Allergan PLC 3.45% 2022 | 32,390 | 33,420 |
| Allergan PLC 3.85% 2024 | 15,000 | 15,667 |
| Allergan PLC 4.55% 2035 | 7,870 | 8,432 |
| Allergan PLC 4.75% 2045 | 7,882 | 8,554 |
| AmerisourceBergen Corp. 3.25% 2025 | 2,170 | 2,199 |
| AmerisourceBergen Corp. 4.25% 2045 | 2,045 | 2,082 |
| Amgen Inc. 1.85% 2021 | 13,745 | 13,450 |
| Amgen Inc. 2.65% 2022 | 13,000 | 13,056 |
| Amgen Inc. 2.70% 2022 | 21,240 | 21,383 |
| Amgen Inc. 4.40% 2045 | 20,000 | 20,654 |
| AstraZeneca PLC 2.375% 2022 | 29,195 | 29,143 |
| AstraZeneca PLC 3.375% 2025 | 30,445 | 31,133 |
| Baxalta Inc. 4.00% 2025 | 29,020 | 30,321 |
| Bayer AG 2.375% 20194 | 8,245 | 8,314 |
| Becton, Dickinson and Co. 2.133% 2019 | 17,750 | 17,786 |
| Becton, Dickinson and Co. 2.404% 2020 | 17,750 | 17,800 |
| Becton, Dickinson and Co. 2.894% 2022 | 58,500 | 58,639 |
| Becton, Dickinson and Co. 3.363% 2024 | 40,505 | 40,644 |
| Becton, Dickinson and Co. 3.734% 2024 | 2,896 | 2,948 |
| Becton, Dickinson and Co. 3.70% 2027 | 41,795 | 41,945 |
| Becton, Dickinson and Co. 4.669% 2047 | 3,015 | 3,118 |
| Biogen Inc. 3.625% 2022 | 10,210 | 10,690 |
| Boston Scientific Corp. 3.375% 2022 | 20,000 | 20,609 |
| Boston Scientific Corp. 3.85% 2025 | 61,550 | 63,672 |
| Catholic Health Initiatives, Series 2012, 1.60% 2017 | 2,000 | 2,001 |
American Balanced Fund — Page 7 of 33
unaudited
Bonds, notes & other debt instruments
Corporate bonds & notes (continued)
Health care (continued) | Principal?amount
(000) | Value
(000) |
| Celgene Corp. 3.55% 2022 | $10,770 | $11,224 |
| Celgene Corp. 3.625% 2024 | 30,000 | 31,113 |
| Celgene Corp. 3.875% 2025 | 38,540 | 40,321 |
| Celgene Corp. 4.625% 2044 | 2,400 | 2,535 |
| EMD Finance LLC 2.40% 20204 | 24,900 | 25,073 |
| EMD Finance LLC 2.95% 20224 | 12,850 | 13,091 |
| EMD Finance LLC 3.25% 20254 | 54,600 | 54,887 |
| Humana Inc. 3.15% 2022 | 20,000 | 20,367 |
| Johnson & Johnson 2.25% 2022 | 28,250 | 28,415 |
| Johnson & Johnson 2.45% 2026 | 8,360 | 8,162 |
| Johnson & Johnson 2.95% 2027 | 17,000 | 17,226 |
| Johnson & Johnson 3.625% 2037 | 17,000 | 17,836 |
| Johnson & Johnson 3.75% 2047 | 17,000 | 17,690 |
| Medtronic, Inc. 3.50% 2025 | 22,500 | 23,437 |
| Medtronic, Inc. 3.35% 2027 | 24,775 | 25,291 |
| Medtronic, Inc. 4.375% 2035 | 12,627 | 13,920 |
| Medtronic, Inc. 4.625% 2045 | 11,095 | 12,535 |
| Novartis Capital Corp. 2.40% 2022 | 28,000 | 28,236 |
| Pfizer Inc. 7.20% 2039 | 485 | 728 |
| Roche Holdings, Inc. 2.875% 20214 | 24,400 | 24,965 |
| Roche Holdings, Inc. 1.75% 20224 | 18,330 | 17,875 |
| Roche Holdings, Inc. 3.00% 20254 | 19,000 | 19,080 |
| Roche Holdings, Inc. 2.375% 20274 | 19,685 | 18,695 |
| Shire PLC 1.90% 2019 | 20,000 | 19,919 |
| Shire PLC 2.40% 2021 | 54,555 | 53,967 |
| Shire PLC 2.875% 2023 | 38,195 | 37,906 |
| Shire PLC 3.20% 2026 | 32,450 | 31,797 |
| Stryker Corp. 2.625% 2021 | 5,200 | 5,258 |
| Teva Pharmaceutical Finance Company BV 1.40% 2018 | 43,665 | 43,574 |
| Teva Pharmaceutical Finance Company BV 1.70% 2019 | 44,530 | 44,155 |
| Teva Pharmaceutical Finance Company BV 2.20% 2021 | 31,195 | 30,649 |
| Teva Pharmaceutical Finance Company BV 2.80% 2023 | 15,940 | 15,523 |
| Teva Pharmaceutical Finance Company BV 3.15% 2026 | 27,795 | 26,451 |
| Teva Pharmaceutical Finance Company BV 4.10% 2046 | 30,640 | 28,379 |
| Thermo Fisher Scientific Inc. 2.40% 2019 | 10,000 | 10,078 |
| Thermo Fisher Scientific Inc. 4.15% 2024 | 11,840 | 12,646 |
| UnitedHealth Group Inc. 1.40% 2017 | 10,000 | 9,998 |
| UnitedHealth Group Inc. 6.00% 2018 | 35,000 | 35,938 |
| UnitedHealth Group Inc. 2.125% 2021 | 26,195 | 26,141 |
| UnitedHealth Group Inc. 3.35% 2022 | 15,405 | 16,092 |
| WellPoint, Inc. 2.25% 2019 | 15,500 | 15,580 |
| Zimmer Holdings, Inc. 2.70% 2020 | 12,915 | 13,040 |
| Zimmer Holdings, Inc. 3.15% 2022 | 18,910 | 19,216 |
| Zimmer Holdings, Inc. 4.25% 2035 | 1,197 | 1,180 |
| | | 1,907,353 |
| Energy1.58% | | |
| Anadarko Petroleum Corp. 4.85% 2021 | 24,635 | 26,314 |
| Anadarko Petroleum Corp. 5.55% 2026 | 13,895 | 15,556 |
| Anadarko Petroleum Corp. 6.45% 2036 | 685 | 809 |
| Anadarko Petroleum Corp. 6.60% 2046 | 13,200 | 16,357 |
| APT Pipelines Ltd. 4.20% 20254 | 27,300 | 28,230 |
| Boardwalk Pipelines, LP 4.45% 2027 | 10,090 | 10,352 |
| Canadian Natural Resources Ltd. 2.95% 2023 | 46,210 | 45,894 |
American Balanced Fund — Page 8 of 33
unaudited
Bonds, notes & other debt instruments
Corporate bonds & notes (continued)
Energy (continued) | Principal?amount
(000) | Value
(000) |
| Canadian Natural Resources Ltd. 3.80% 2024 | $1,720 | $1,743 |
| Canadian Natural Resources Ltd. 3.85% 2027 | 21,020 | 20,942 |
| Canadian Natural Resources Ltd. 4.95% 2047 | 13,360 | 13,630 |
| Cenovus Energy Inc. 3.00% 2022 | 2,000 | 1,914 |
| Cenovus Energy Inc. 3.80% 2023 | 20,710 | 20,456 |
| Cenovus Energy Inc. 4.25% 20274 | 52,985 | 50,580 |
| Cenovus Energy Inc. 5.25% 20374 | 17,000 | 15,941 |
| Cenovus Energy Inc. 5.40% 20474 | 18,970 | 17,792 |
| Chevron Corp. 2.498% 2022 | 20,630 | 20,834 |
| Chevron Corp. 2.566% 2023 | 13,000 | 13,031 |
| Chevron Corp. 2.895% 2024 | 34,000 | 34,344 |
| Chevron Corp. 3.326% 2025 | 8,700 | 8,927 |
| Chevron Corp. 2.954% 2026 | 6,700 | 6,658 |
| ConocoPhillips 4.20% 2021 | 34,295 | 36,389 |
| ConocoPhillips 4.95% 2026 | 18,000 | 20,084 |
| Devon Energy Corp. 5.85% 2025 | 15,000 | 17,075 |
| Devon Energy Corp. 5.00% 2045 | 23,775 | 24,341 |
| Enbridge Energy Partners, LP 9.875% 2019 | 11,250 | 12,586 |
| Enbridge Energy Partners, LP 4.375% 2020 | 15,730 | 16,567 |
| Enbridge Energy Partners, LP 4.20% 2021 | 300 | 313 |
| Enbridge Energy Partners, LP 5.875% 2025 | 36,990 | 42,270 |
| Enbridge Energy Partners, LP 5.50% 2040 | 15,000 | 15,783 |
| Enbridge Energy Partners, LP 7.375% 2045 | 19,575 | 25,043 |
| Enbridge Energy Partners, LP, Series B, 6.50% 2018 | 17,370 | 17,990 |
| Enbridge Energy Partners, LP, Series B, 7.50% 2038 | 12,250 | 15,424 |
| Enbridge Inc. 4.00% 2023 | 37,535 | 39,457 |
| Enbridge Inc. 3.50% 2024 | 990 | 991 |
| Enbridge Inc. 4.25% 2026 | 7,640 | 7,991 |
| Enbridge Inc. 3.70% 2027 | 11,940 | 11,957 |
| Enbridge Inc. 5.50% 2046 | 21,595 | 24,464 |
| Energy Transfer Partners, LP 4.15% 2020 | 11,500 | 11,952 |
| Energy Transfer Partners, LP 4.75% 2026 | 28,100 | 29,286 |
| Energy Transfer Partners, LP 4.20% 2027 | 19,260 | 19,222 |
| Energy Transfer Partners, LP 6.125% 2045 | 14,990 | 16,444 |
| Energy Transfer Partners, LP 5.30% 2047 | 20,000 | 19,886 |
| EnLink Midstream Partners, LP 4.40% 2024 | 16,245 | 16,516 |
| EnLink Midstream Partners, LP 4.15% 2025 | 37,740 | 37,334 |
| EnLink Midstream Partners, LP 4.85% 2026 | 25,000 | 26,059 |
| EnLink Midstream Partners, LP 5.05% 2045 | 9,405 | 8,770 |
| EnLink Midstream Partners, LP 5.45% 2047 | 14,125 | 14,154 |
| Enterprise Products Operating LLC 3.90% 2024 | 16,545 | 17,234 |
| Enterprise Products Operating LLC 3.95% 2027 | 550 | 570 |
| EOG Resources, Inc. 4.15% 2026 | 10,220 | 10,758 |
| Exxon Mobil Corp. 2.222% 2021 | 18,000 | 18,126 |
| Exxon Mobil Corp. 2.726% 2023 | 12,000 | 12,150 |
| Halliburton Co. 3.80% 2025 | 44,890 | 46,089 |
| Halliburton Co. 5.00% 2045 | 5,900 | 6,310 |
| Kinder Morgan Energy Partners, LP 2.65% 2019 | 20,000 | 20,144 |
| Kinder Morgan Energy Partners, LP 9.00% 2019 | 4,395 | 4,850 |
| Kinder Morgan Energy Partners, LP 3.50% 2021 | 3,980 | 4,078 |
| Kinder Morgan Energy Partners, LP 4.15% 2022 | 12,855 | 13,406 |
| Kinder Morgan Energy Partners, LP 5.40% 2044 | 13,135 | 13,311 |
| Kinder Morgan Energy Partners, LP 5.50% 2044 | 11,321 | 11,740 |
| Kinder Morgan, Inc. 3.05% 2019 | 17,150 | 17,459 |
American Balanced Fund — Page 9 of 33
unaudited
Bonds, notes & other debt instruments
Corporate bonds & notes (continued)
Energy (continued) | Principal?amount
(000) | Value
(000) |
| Kinder Morgan, Inc. 4.30% 2025 | $19,285 | $20,085 |
| Kinder Morgan, Inc. 5.30% 2034 | 8,205 | 8,480 |
| Kinder Morgan, Inc. 5.55% 2045 | 26,835 | 28,577 |
| MPLX LP 4.125% 2027 | 13,650 | 13,724 |
| MPLX LP 5.20% 2047 | 6,130 | 6,311 |
| Petróleos Mexicanos 5.50% 2021 | 9,500 | 9,977 |
| Petróleos Mexicanos 6.375% 2021 | 12,110 | 13,137 |
| Petróleos Mexicanos 5.375% 20224 | 9,870 | 10,403 |
| Petróleos Mexicanos 3.50% 2023 | 22,000 | 21,142 |
| Petróleos Mexicanos 4.625% 2023 | 10,000 | 10,145 |
| Petróleos Mexicanos 6.875% 2026 | 11,350 | 12,604 |
| Petróleos Mexicanos 6.50% 20274 | 21,055 | 22,645 |
| Petróleos Mexicanos 5.50% 2044 | 2,173 | 1,932 |
| Petróleos Mexicanos 5.625% 2046 | 25,290 | 22,514 |
| Petróleos Mexicanos 6.75% 2047 | 29,952 | 30,323 |
| Phillips 66 Partners LP 3.605% 2025 | 1,950 | 1,934 |
| Phillips 66 Partners LP 3.55% 2026 | 3,350 | 3,261 |
| Phillips 66 Partners LP 4.90% 2046 | 20,100 | 19,926 |
| Pioneer Natural Resources Co. 3.45% 2021 | 11,530 | 11,855 |
| Pioneer Natural Resources Co. 4.45% 2026 | 6,370 | 6,722 |
| Royal Dutch Shell PLC 1.75% 2021 | 8,905 | 8,743 |
| Royal Dutch Shell PLC 3.75% 2046 | 31,750 | 30,169 |
| Sabine Pass Liquefaction, LLC 5.625% 2023 | 25,500 | 28,376 |
| Sabine Pass Liquefaction, LLC 5.875% 2026 | 25,000 | 28,027 |
| Sabine Pass Liquefaction, LLC 4.20% 20284 | 86,845 | 87,931 |
| Schlumberger BV 3.00% 20204 | 14,535 | 14,810 |
| Schlumberger BV 3.625% 20224 | 11,340 | 11,811 |
| Schlumberger BV 4.00% 20254 | 25,565 | 26,849 |
| Shell International Finance BV 2.25% 2020 | 49,450 | 49,809 |
| Shell International Finance BV 2.875% 2026 | 11,500 | 11,362 |
| Spectra Energy Partners, LP 4.75% 2024 | 7,030 | 7,588 |
| Spectra Energy Partners, LP 3.375% 2026 | 6,160 | 6,034 |
| Spectra Energy Partners, LP 4.50% 2045 | 6,765 | 6,703 |
| Statoil ASA 3.125% 2017 | 16,500 | 16,530 |
| Statoil ASA 2.75% 2021 | 5,395 | 5,476 |
| Statoil ASA 3.25% 2024 | 1,690 | 1,729 |
| Statoil ASA 4.25% 2041 | 6,000 | 6,168 |
| TC PipeLines, LP 4.375% 2025 | 7,880 | 8,225 |
| TransCanada PipeLines Ltd. 5.00% 2043 | 12,000 | 13,793 |
| TransCanada PipeLines Ltd., junior subordinated 5.625% 2075 | 6,410 | 6,787 |
| Western Gas Partners LP 3.95% 2025 | 3,730 | 3,712 |
| Western Gas Partners LP 4.65% 2026 | 7,045 | 7,225 |
| Williams Partners LP 4.50% 2023 | 6,400 | 6,840 |
| Williams Partners LP 4.30% 2024 | 7,870 | 8,198 |
| Williams Partners LP 4.00% 2025 | 4,800 | 4,897 |
| Williams Partners LP 3.75% 2027 | 4,485 | 4,449 |
| Woodside Petroleum Ltd. 3.65% 20254 | 12,400 | 12,377 |
| | | 1,795,192 |
| Consumer discretionary1.46% | | |
| Amazon.com, Inc. 3.80% 2024 | 49,975 | 53,361 |
| Amazon.com, Inc. 4.95% 2044 | 5,500 | 6,516 |
| American Honda Finance Corp. 1.20% 2019 | 25,500 | 25,265 |
| American Honda Finance Corp. 2.25% 2019 | 16,500 | 16,646 |
American Balanced Fund — Page 10 of 33
unaudited
Bonds, notes & other debt instruments
Corporate bonds & notes (continued)
Consumer discretionary (continued) | Principal?amount
(000) | Value
(000) |
| American Honda Finance Corp. 1.65% 2021 | $18,065 | $17,683 |
| CBS Corp. 3.50% 2025 | 15,000 | 15,227 |
| CBS Corp. 4.60% 2045 | 25,000 | 25,781 |
| CCO Holdings LLC and CCO Holdings Capital Corp. 4.464% 2022 | 22,500 | 23,997 |
| CCO Holdings LLC and CCO Holdings Capital Corp. 4.908% 2025 | 10,000 | 10,822 |
| CCO Holdings LLC and CCO Holdings Capital Corp. 6.484% 2045 | 18,025 | 21,737 |
| CCO Holdings LLC and CCO Holdings Capital Corp. 5.375% 20474 | 18,035 | 19,178 |
| Comcast Corp. 6.30% 2017 | 16,750 | 17,040 |
| Comcast Corp. 1.625% 2022 | 10,250 | 9,972 |
| Comcast Corp. 3.15% 2026 | 11,215 | 11,286 |
| Comcast Corp. 2.35% 2027 | 27,250 | 25,611 |
| Comcast Corp. 3.30% 2027 | 11,250 | 11,403 |
| Comcast Corp. 3.20% 2036 | 7,250 | 6,809 |
| Comcast Corp. 6.45% 2037 | 15,000 | 20,018 |
| Comcast Corp. 4.60% 2045 | 20,000 | 21,894 |
| DaimlerChrysler North America Holding Corp. 1.375% 20174 | 15,125 | 15,125 |
| DaimlerChrysler North America Holding Corp. 1.50% 20194 | 25,500 | 25,266 |
| DaimlerChrysler North America Holding Corp. 2.25% 20194 | 13,000 | 13,051 |
| DaimlerChrysler North America Holding Corp. 2.25% 20204 | 9,780 | 9,793 |
| DaimlerChrysler North America Holding Corp. 2.00% 20214 | 22,525 | 22,145 |
| DaimlerChrysler North America Holding Corp. 3.45% 20274 | 23,925 | 24,347 |
| Ford Motor Credit Co. 2.145% 2018 | 15,485 | 15,540 |
| Ford Motor Credit Co. 2.375% 2018 | 8,990 | 9,020 |
| Ford Motor Credit Co. 2.551% 2018 | 9,015 | 9,077 |
| Ford Motor Credit Co. 2.597% 2019 | 26,735 | 26,929 |
| Ford Motor Credit Co. 2.943% 2019 | 21,000 | 21,278 |
| Ford Motor Credit Co. 3.157% 2020 | 30,400 | 31,000 |
| Ford Motor Credit Co. 3.20% 2021 | 8,300 | 8,431 |
| Ford Motor Credit Co. 3.219% 2022 | 16,000 | 16,157 |
| Ford Motor Credit Co. 3.096% 2023 | 24,000 | 23,744 |
| Ford Motor Credit Co. 4.375% 2023 | 15,475 | 16,301 |
| Ford Motor Credit Co. 3.664% 2024 | 10,000 | 9,992 |
| Ford Motor Credit Co. 3.81% 2024 | 20,000 | 20,274 |
| Ford Motor Credit Co. 4.134% 2025 | 21,355 | 21,763 |
| Ford Motor Credit Co. 5.291% 2046 | 20,000 | 20,630 |
| General Motors Financial Co. 2.35% 2019 | 18,000 | 18,009 |
| General Motors Financial Co. 2.40% 2019 | 20,435 | 20,500 |
| General Motors Financial Co. 3.50% 2019 | 4,685 | 4,796 |
| General Motors Financial Co. 3.70% 2020 | 42,325 | 43,823 |
| General Motors Financial Co. 3.20% 2021 | 23,600 | 23,885 |
| General Motors Financial Co. 4.20% 2021 | 23,000 | 24,142 |
| General Motors Financial Co. 4.375% 2021 | 5,500 | 5,824 |
| General Motors Financial Co. 3.45% 2022 | 52,100 | 53,005 |
| General Motors Financial Co. 3.45% 2022 | 30,000 | 30,527 |
| General Motors Financial Co. 3.70% 2023 | 28,200 | 28,669 |
| General Motors Financial Co. 4.30% 2025 | 18,175 | 18,570 |
| General Motors Financial Co. 4.35% 2027 | 11,250 | 11,411 |
| General Motors Financial Co. 6.60% 2036 | 11,785 | 13,706 |
| Home Depot, Inc. 1.80% 2020 | 26,880 | 26,902 |
| Home Depot, Inc. 2.00% 2021 | 18,000 | 17,957 |
| Home Depot, Inc. 4.40% 2021 | 15,000 | 16,174 |
| Home Depot, Inc. 2.125% 2026 | 25,000 | 23,403 |
| Home Depot, Inc. 5.95% 2041 | 7,500 | 9,949 |
| Home Depot, Inc. 4.25% 2046 | 19,800 | 21,358 |
American Balanced Fund — Page 11 of 33
unaudited
Bonds, notes & other debt instruments
Corporate bonds & notes (continued)
Consumer discretionary (continued) | Principal?amount
(000) | Value
(000) |
| Home Depot, Inc. 3.90% 2047 | $17,750 | $18,069 |
| Hyundai Capital America 2.00% 20194 | 11,960 | 11,871 |
| Hyundai Capital America 2.55% 20204 | 8,300 | 8,284 |
| Hyundai Capital America 2.45% 20214 | 33,000 | 32,607 |
| Hyundai Capital America 3.10% 20224 | 26,390 | 26,486 |
| Lowe’s Companies, Inc. 2.50% 2026 | 23,310 | 22,435 |
| Lowe’s Companies, Inc. 3.10% 2027 | 21,000 | 20,933 |
| McDonald’s Corp. 2.625% 2022 | 23,710 | 23,875 |
| McDonald’s Corp. 3.70% 2026 | 17,905 | 18,578 |
| McDonald’s Corp. 3.50% 2027 | 15,000 | 15,280 |
| NBC Universal Enterprise, Inc. 5.25% 20494 | 475 | 506 |
| Newell Rubbermaid Inc. 3.15% 2021 | 43,135 | 44,194 |
| Newell Rubbermaid Inc. 3.85% 2023 | 31,830 | 33,457 |
| Newell Rubbermaid Inc. 4.20% 2026 | 62,505 | 66,445 |
| NIKE, Inc. 2.375% 2026 | 25,500 | 24,223 |
| NIKE, Inc. 3.375% 2046 | 7,250 | 6,699 |
| Nordstrom, Inc. 4.00% 2021 | 6,245 | 6,384 |
| Starbucks Corp. 2.10% 2021 | 1,395 | 1,404 |
| Thomson Reuters Corp. 1.65% 2017 | 4,965 | 4,966 |
| Thomson Reuters Corp. 6.50% 2018 | 20,815 | 21,796 |
| Thomson Reuters Corp. 4.30% 2023 | 4,500 | 4,831 |
| Thomson Reuters Corp. 3.35% 2026 | 12,410 | 12,415 |
| Thomson Reuters Corp. 5.65% 2043 | 2,000 | 2,326 |
| Time Warner Cable Inc. 6.75% 2018 | 20,000 | 20,930 |
| Time Warner Inc. 3.80% 2027 | 6,045 | 6,098 |
| Toyota Motor Credit Corp. 2.15% 2020 | 18,500 | 18,612 |
| Toyota Motor Credit Corp. 2.60% 2022 | 33,015 | 33,381 |
| Toyota Motor Credit Corp. 2.25% 2023 | 14,085 | 13,791 |
| | | 1,653,595 |
| Utilities1.23% | | |
| Ameren Corp. 3.65% 2026 | 1,410 | 1,442 |
| American Electric Power Co., Inc. 2.95% 2022 | 13,694 | 13,957 |
| American Electric Power Co., Inc. 2.75% 2026 | 5,690 | 5,465 |
| Berkshire Hathaway Energy Co. 2.40% 2020 | 13,643 | 13,769 |
| CMS Energy Corp. 8.75% 2019 | 5,797 | 6,515 |
| CMS Energy Corp. 5.05% 2022 | 9,215 | 10,145 |
| Comision Federal de Electricidad 4.75% 20274 | 10,725 | 11,060 |
| Commonwealth Edison Company 2.55% 2026 | 16,785 | 16,172 |
| Commonwealth Edison Company 4.35% 2045 | 8,345 | 9,045 |
| Consolidated Edison Company of New York, Inc. 3.875% 2047 | 9,600 | 9,779 |
| Consumers Energy Co. 3.375% 2023 | 1,435 | 1,502 |
| Consumers Energy Co. 3.125% 2024 | 10,520 | 10,676 |
| Consumers Energy Co. 3.25% 2046 | 10,635 | 9,792 |
| Dominion Resources, Inc. 1.875% 20184 | 25,000 | 24,976 |
| Dominion Resources, Inc. 1.60% 2019 | 3,660 | 3,631 |
| Dominion Resources, Inc. 2.962% 2019 | 11,040 | 11,211 |
| Dominion Resources, Inc. 2.579% 2020 | 7,025 | 7,066 |
| Dominion Resources, Inc. 2.00% 2021 | 13,335 | 13,090 |
| Dominion Resources, Inc. 2.75% 2022 | 36,516 | 36,749 |
| Duke Energy Carolinas, Inc. 2.50% 2023 | 2,700 | 2,707 |
| Duke Energy Corp. 1.80% 2021 | 10,635 | 10,391 |
| Duke Energy Corp. 3.75% 2024 | 24,295 | 25,420 |
| Duke Energy Corp. 2.65% 2026 | 10,250 | 9,755 |
American Balanced Fund — Page 12 of 33
unaudited
Bonds, notes & other debt instruments
Corporate bonds & notes (continued)
Utilities (continued) | Principal?amount
(000) | Value
(000) |
| Duke Energy Florida, LLC 3.20% 2027 | $23,075 | $23,401 |
| Duke Energy Ohio, Inc. 3.70% 2046 | 7,475 | 7,358 |
| Duke Energy Progress Inc. 4.15% 2044 | 26,190 | 27,523 |
| Duke Energy Progress Inc. 3.70% 2046 | 29,270 | 28,889 |
| E.ON International Finance BV 5.80% 20184 | 24,450 | 25,201 |
| EDP Finance BV 3.625% 20244 | 63,525 | 62,824 |
| Electricité de France SA 2.35% 20204 | 4,600 | 4,620 |
| Electricité de France SA 6.95% 20394 | 10,325 | 13,761 |
| Emera Inc. 6.75% 2076 | 11,600 | 13,166 |
| Emera US Finance LP 2.15% 2019 | 9,165 | 9,161 |
| Emera US Finance LP 2.70% 2021 | 11,940 | 11,968 |
| Emera US Finance LP 3.55% 2026 | 17,715 | 17,791 |
| Enel Finance International SA 2.875% 20224 | 29,500 | 29,571 |
| Enel Finance International SA 3.625% 20274 | 29,500 | 29,279 |
| Enersis Américas SA 4.00% 2026 | 4,330 | 4,383 |
| Entergy Corp. 2.95% 2026 | 24,040 | 23,068 |
| Eversource Energy 2.50% 2021 | 10,200 | 10,170 |
| Eversource Energy 2.70% 2026 | 4,085 | 3,942 |
| Exelon Corp. 2.85% 2020 | 15,000 | 15,248 |
| Exelon Corp. 3.497% 2022 | 36,950 | 37,935 |
| Exelon Corp. 3.40% 2026 | 2,840 | 2,836 |
| Exelon Corp. 4.45% 2046 | 12,640 | 13,136 |
| FirstEnergy Corp. 2.85% 2022 | 20,240 | 20,194 |
| FirstEnergy Corp. 3.90% 2027 | 45,200 | 45,302 |
| FirstEnergy Corp. 7.375% 2031 | 17,250 | 22,746 |
| FirstEnergy Corp. 4.85% 2047 | 54,385 | 55,340 |
| Great Plains Energy Inc. 3.15% 2022 | 10,925 | 11,051 |
| Great Plains Energy Inc. 3.90%2027 | 13,200 | 13,381 |
| Great Plains Energy Inc. 4.20% 2047 | 8,400 | 8,604 |
| MidAmerican Energy Co. 2.40% 2019 | 5,500 | 5,559 |
| MidAmerican Energy Co. 3.10% 2027 | 21,335 | 21,525 |
| MidAmerican Energy Holdings Co. 5.75% 2018 | 15,300 | 15,759 |
| MidAmerican Energy Holdings Co. 3.75% 2023 | 20,000 | 21,064 |
| National Rural Utilities Cooperative Finance Corp. 10.375% 2018 | 8,450 | 9,399 |
| National Rural Utilities Cooperative Finance Corp. 2.15% 2019 | 18,000 | 18,114 |
| National Rural Utilities Cooperative Finance Corp. 2.00% 2020 | 14,460 | 14,504 |
| National Rural Utilities Cooperative Finance Corp. 2.30% 2020 | 13,625 | 13,646 |
| National Rural Utilities Cooperative Finance Corp. 2.70% 2023 | 5,400 | 5,410 |
| National Rural Utilities Cooperative Finance Corp. 2.95% 2024 | 11,500 | 11,616 |
| National Rural Utilities Cooperative Finance Corp. 3.25% 2025 | 15,500 | 15,724 |
| National Rural Utilities Cooperative Finance Corp. 3.05% 2027 | 22,000 | 21,976 |
| Niagara Mohawk Power Corp. 3.508% 20244 | 6,375 | 6,601 |
| Northeast Utilities 1.60% 2018 | 10,000 | 9,986 |
| Northeast Utilities 3.15% 2025 | 8,845 | 8,886 |
| Northern States Power Co. 4.125% 2044 | 18,000 | 19,170 |
| NV Energy, Inc 6.25% 2020 | 10,168 | 11,447 |
| Ohio Power Co., Series G, 6.60% 2033 | 165 | 210 |
| Pacific Gas and Electric Co. 3.25% 2023 | 6,742 | 6,959 |
| Pacific Gas and Electric Co. 3.85% 2023 | 21,430 | 22,789 |
| Pacific Gas and Electric Co. 3.40% 2024 | 3,369 | 3,478 |
| Pacific Gas and Electric Co. 3.75% 2024 | 20,000 | 21,083 |
| Pacific Gas and Electric Co. 2.95% 2026 | 11,205 | 11,141 |
| Pacific Gas and Electric Co. 3.30% 2027 | 11,325 | 11,593 |
| Pacific Gas and Electric Co. 4.75% 2044 | 4,930 | 5,632 |
American Balanced Fund — Page 13 of 33
unaudited
Bonds, notes & other debt instruments
Corporate bonds & notes (continued)
Utilities (continued) | Principal?amount
(000) | Value
(000) |
| Pacific Gas and Electric Co. 4.30% 2045 | $3,170 | $3,409 |
| PacifiCorp. 3.35% 2025 | 7,800 | 7,967 |
| PacifiCorp., First Mortgage Bonds, 5.65% 2018 | 2,465 | 2,565 |
| PacifiCorp., First Mortgage Bonds, 3.60% 2024 | 18,405 | 19,313 |
| PG&E Corp. 2.40% 2019 | 9,380 | 9,430 |
| Public Service Co. of Colorado 2.25% 2022 | 6,000 | 5,960 |
| Public Service Electric and Gas Co., 1.90% 2021 | 6,810 | 6,753 |
| Public Service Electric and Gas Co., 2.375% 2023 | 2,075 | 2,060 |
| Public Service Electric and Gas Co., 3.05% 2024 | 13,425 | 13,536 |
| Public Service Enterprise Group Inc. 2.00% 2021 | 7,985 | 7,812 |
| Public Service Enterprise Group Inc. 2.25% 2026 | 3,875 | 3,661 |
| Puget Energy, Inc. 6.50% 2020 | 5,750 | 6,432 |
| Puget Energy, Inc. 6.00% 2021 | 13,200 | 14,836 |
| Puget Energy, Inc. 5.625% 2022 | 14,950 | 16,718 |
| Puget Energy, Inc. 3.65% 2025 | 9,400 | 9,434 |
| Sierra Pacific Power Co. 2.60% 2026 | 8,000 | 7,732 |
| Sierra Pacific Power Co., General and Refunding Mortgage Notes, Series T, 3.375% 2023 | 14,000 | 14,389 |
| Southern California Edison Co., 1.845% 20225 | 11,018 | 10,883 |
| Tampa Electric Co. 4.35% 2044 | 11,410 | 11,746 |
| Teco Finance, Inc. 5.15% 2020 | 5,627 | 5,984 |
| Tri-State Generation and Transmission Assn. Inc., Pass Through Trust, Series 2003-A, 6.04% 20184,5 | 207 | 209 |
| Virginia Electric and Power Co. 3.50% 2027 | 29,000 | 29,882 |
| Virginia Electric and Power Co., Series B, 5.95% 2017 | 8,000 | 8,065 |
| Xcel Energy Inc. 4.70% 2020 | 4,845 | 5,132 |
| Xcel Energy Inc. 3.30% 2025 | 5,795 | 5,856 |
| | | 1,399,199 |
| Consumer staples0.91% | | |
| Altria Group, Inc. 9.25% 2019 | 5,067 | 5,819 |
| Altria Group, Inc. 2.625% 2020 | 14,760 | 14,993 |
| Altria Group, Inc. 2.95% 2023 | 12,000 | 12,102 |
| Altria Group, Inc. 4.00% 2024 | 7,400 | 7,903 |
| Altria Group, Inc. 2.625% 2026 | 18,585 | 17,917 |
| Altria Group, Inc. 9.95% 2038 | 13,500 | 22,914 |
| Altria Group, Inc. 4.50% 2043 | 13,700 | 14,639 |
| Altria Group, Inc. 5.375% 2044 | 6,825 | 8,257 |
| Altria Group, Inc. 3.875% 2046 | 12,970 | 12,650 |
| Anheuser-Busch InBev NV 2.20% 2018 | 18,700 | 18,819 |
| Anheuser-Busch InBev NV 7.75% 2019 | 20,000 | 21,768 |
| Anheuser-Busch InBev NV 3.30% 2023 | 22,345 | 23,035 |
| Anheuser-Busch InBev NV 3.65% 2026 | 57,965 | 59,832 |
| British American Tobacco International Finance PLC 3.95% 20254 | 16,500 | 17,155 |
| Constellation Brands, Inc. 2.70% 2022 | 6,780 | 6,779 |
| Constellation Brands, Inc. 3.50% 2027 | 7,995 | 8,005 |
| Constellation Brands, Inc. 4.50% 2047 | 3,465 | 3,587 |
| Costco Wholesale Corp. 2.15% 2021 | 17,500 | 17,514 |
| Costco Wholesale Corp. 2.30% 2022 | 17,500 | 17,473 |
| Costco Wholesale Corp. 2.75% 2024 | 57,500 | 57,527 |
| Costco Wholesale Corp. 3.00% 2027 | 17,500 | 17,477 |
| Imperial Tobacco Finance PLC 2.05% 20184 | 16,000 | 16,023 |
| Imperial Tobacco Finance PLC 3.50% 20234 | 17,000 | 17,419 |
| Kraft Foods Inc. 3.50% 2022 | 23,285 | 24,134 |
| Kraft Heinz Co. 4.375% 2046 | 5,290 | 5,176 |
| Kroger Co. 2.60% 2021 | 6,100 | 6,105 |
American Balanced Fund — Page 14 of 33
unaudited
Bonds, notes & other debt instruments
Corporate bonds & notes (continued)
Consumer staples (continued) | Principal?amount
(000) | Value
(000) |
| Kroger Co. 3.50% 2026 | $16,135 | $15,933 |
| Mead Johnson Nutrition Co. 3.00% 2020 | 6,525 | 6,696 |
| Mead Johnson Nutrition Co. 4.125% 2025 | 3,355 | 3,622 |
| Molson Coors Brewing Co. 1.45% 2019 | 7,465 | 7,378 |
| Molson Coors Brewing Co. 1.90% 20194 | 10,015 | 10,006 |
| Molson Coors Brewing Co. 2.25% 20204 | 8,590 | 8,595 |
| Molson Coors Brewing Co. 2.10% 2021 | 11,385 | 11,205 |
| Molson Coors Brewing Co. 3.00% 2026 | 9,670 | 9,320 |
| Molson Coors Brewing Co. 4.20% 2046 | 10,475 | 10,323 |
| PepsiCo, Inc. 1.35% 2019 | 13,215 | 13,103 |
| Pernod Ricard SA 4.45% 20224 | 9,600 | 10,302 |
| Philip Morris International Inc. 2.00% 2020 | 23,400 | 23,457 |
| Philip Morris International Inc. 1.875% 2021 | 25,020 | 24,723 |
| Philip Morris International Inc. 2.625% 2022 | 30,160 | 30,381 |
| Philip Morris International Inc. 3.25% 2024 | 10,000 | 10,191 |
| Philip Morris International Inc. 3.375% 2025 | 27,395 | 28,096 |
| Philip Morris International Inc. 4.25% 2044 | 6,000 | 6,200 |
| Procter & Gamble Co. 1.70% 2021 | 8,270 | 8,166 |
| Procter & Gamble Co. 2.45% 2026 | 15,000 | 14,678 |
| Reckitt Benckiser Group PLC 2.375% 20224 | 75,000 | 74,554 |
| Reckitt Benckiser Group PLC 2.75% 20244 | 63,290 | 62,738 |
| Reynolds American Inc. 2.30% 2018 | 5,900 | 5,927 |
| Reynolds American Inc. 3.25% 2022 | 11,420 | 11,501 |
| Reynolds American Inc. 4.00% 2022 | 6,695 | 7,102 |
| Reynolds American Inc. 4.85% 2023 | 12,000 | 13,246 |
| Reynolds American Inc. 4.45% 2025 | 34,365 | 36,952 |
| Reynolds American Inc. 5.70% 2035 | 1,555 | 1,850 |
| Reynolds American Inc. 6.15% 2043 | 1,975 | 2,478 |
| Reynolds American Inc. 5.85% 2045 | 32,595 | 40,115 |
| The JM Smucker Co. 3.50% 2025 | 5,775 | 5,946 |
| Walgreens Boots Alliance, Inc. 3.30% 2021 | 20,000 | 20,640 |
| Walgreens Boots Alliance, Inc. 3.45% 2026 | 17,660 | 17,658 |
| WM. Wrigley Jr. Co 3.375% 20204 | 22,500 | 23,241 |
| | | 1,031,345 |
| Information technology0.73% | | |
| Alphabet Inc. 1.998% 2026 | 38,850 | 36,398 |
| Apple Inc. 1.55% 2021 | 31,235 | 30,531 |
| Apple Inc. 2.25% 2021 | 23,000 | 23,162 |
| Apple Inc. 2.50% 2022 | 16,750 | 16,907 |
| Apple Inc. 3.00% 2024 | 10,000 | 10,158 |
| Broadcom Ltd. 2.375% 20204 | 15,000 | 15,030 |
| Broadcom Ltd. 3.00% 20224 | 85,000 | 85,840 |
| Broadcom Ltd. 3.625% 20244 | 78,750 | 80,655 |
| Broadcom Ltd. 3.875% 20274 | 138,385 | 142,398 |
| Harris Corp. 3.832% 2025 | 6,615 | 6,859 |
| Intel Corp. 3.70% 2025 | 22,000 | 23,122 |
| Intel Corp. 4.90% 2045 | 14,540 | 16,958 |
| Microsoft Corp. 1.55% 2021 | 51,435 | 50,350 |
| Microsoft Corp. 2.40% 2022 | 50,065 | 50,563 |
| Microsoft Corp. 2.875% 2024 | 10,785 | 10,967 |
| Microsoft Corp. 2.40% 2026 | 27,000 | 26,019 |
| Microsoft Corp. 3.30% 2027 | 21,655 | 22,293 |
| Microsoft Corp. 4.20% 2035 | 18,000 | 19,728 |
American Balanced Fund — Page 15 of 33
unaudited
Bonds, notes & other debt instruments
Corporate bonds & notes (continued)
Information technology (continued) | Principal?amount
(000) | Value
(000) |
| Microsoft Corp. 4.10% 2037 | $10,750 | $11,616 |
| Microsoft Corp. 3.70% 2046 | 15,000 | 14,906 |
| Oracle Corp. 2.375% 2019 | 17,500 | 17,706 |
| Oracle Corp. 2.80% 2021 | 6,100 | 6,242 |
| Oracle Corp. 2.65% 2026 | 31,000 | 29,785 |
| Visa Inc. 2.80% 2022 | 23,000 | 23,431 |
| Visa Inc. 3.15% 2025 | 49,000 | 49,807 |
| | | 821,431 |
| Real estate0.66% | | |
| Alexandria Real Estate Equities, Inc. 4.30% 2026 | 15,720 | 16,494 |
| Alexandria Real Estate Equities, Inc. 3.95% 2028 | 2,680 | 2,731 |
| American Campus Communities, Inc. 3.35% 2020 | 16,070 | 16,498 |
| American Campus Communities, Inc. 3.75% 2023 | 11,715 | 12,066 |
| American Campus Communities, Inc. 4.125% 2024 | 15,285 | 15,999 |
| American Tower Corp. 3.40% 2019 | 13,550 | 13,839 |
| AvalonBay Communities, Inc. 3.625% 2020 | 15,000 | 15,553 |
| Boston Properties, Inc. 3.70% 2018 | 20,000 | 20,422 |
| Brandywine Operating Partnership, LP 3.95% 2023 | 1,639 | 1,651 |
| Corporate Office Properties LP 3.60% 2023 | 12,100 | 12,039 |
| Corporate Office Properties LP 5.25% 2024 | 30,030 | 32,195 |
| Corporate Office Properties LP 5.00% 2025 | 6,735 | 7,126 |
| DDR Corp. 3.50% 2021 | 7,000 | 7,093 |
| DDR Corp. 3.625% 2025 | 15,075 | 14,366 |
| DDR Corp. 4.25% 2026 | 7,370 | 7,239 |
| DDR Corp. 4.70% 2027 | 17,150 | 17,222 |
| Developers Diversified Realty Corp. 7.875% 2020 | 6,365 | 7,295 |
| EPR Properties 4.50% 2025 | 4,460 | 4,529 |
| EPR Properties 4.75% 2026 | 43,650 | 44,940 |
| EPR Properties 4.50% 2027 | 22,450 | 22,631 |
| ERP Operating LP 4.75% 2020 | 12,000 | 12,801 |
| Essex Portfolio L.P. 3.875% 2024 | 27,215 | 28,106 |
| Essex Portfolio L.P. 3.50% 2025 | 27,075 | 27,117 |
| Essex Portfolio L.P. 3.375% 2026 | 2,395 | 2,354 |
| HCP, Inc. 5.375% 2021 | 15,000 | 16,382 |
| Hospitality Properties Trust 6.70% 2018 | 23,400 | 23,499 |
| Hospitality Properties Trust 4.25% 2021 | 30,925 | 32,269 |
| Hospitality Properties Trust 5.00% 2022 | 4,350 | 4,667 |
| Hospitality Properties Trust 4.50% 2023 | 30,950 | 32,471 |
| Hospitality Properties Trust 4.95% 2027 | 11,000 | 11,509 |
| Kimco Realty Corp. 3.40% 2022 | 10,650 | 10,868 |
| Kimco Realty Corp. 3.125% 2023 | 11,705 | 11,613 |
| Kimco Realty Corp. 2.70% 2024 | 9,275 | 8,866 |
| Kimco Realty Corp. 2.80% 2026 | 10,000 | 9,246 |
| Kimco Realty Corp. 3.80% 2027 | 10,360 | 10,384 |
| Prologis, Inc. 4.25% 2023 | 20,000 | 21,616 |
| Scentre Group 2.375% 20194 | 14,845 | 14,884 |
| Scentre Group 2.375% 20214 | 20,430 | 20,218 |
| Scentre Group 3.25% 20254 | 1,780 | 1,751 |
| Scentre Group 3.50% 20254 | 10,415 | 10,464 |
| Scentre Group 3.75% 20274 | 13,620 | 13,764 |
| Select Income REIT 3.60% 2020 | 8,000 | 8,106 |
| Simon Property Group, LP 1.50% 20184 | 13,825 | 13,816 |
| Simon Property Group, LP 3.30% 2026 | 14,600 | 14,621 |
American Balanced Fund — Page 16 of 33
unaudited
Bonds, notes & other debt instruments
Corporate bonds & notes (continued)
Real estate (continued) | Principal?amount
(000) | Value
(000) |
| WEA Finance LLC 2.70% 20194 | $5,395 | $5,443 |
| WEA Finance LLC 3.25% 20204 | 32,500 | 33,096 |
| WEA Finance LLC 3.75% 20244 | 22,800 | 23,124 |
| Westfield Corp. Ltd. 3.15% 20224 | 35,935 | 36,172 |
| | | 751,155 |
| Industrials0.57% | | |
| 3M Co. 1.625% 2021 | 15,000 | 14,842 |
| 3M Co. 2.25% 2026 | 10,000 | 9,490 |
| American Airlines, Inc., Series 2013-2, Class A, 4.95% 20245 | 8,881 | 9,491 |
| Canadian National Railway Co. 3.20% 2046 | 17,110 | 15,686 |
| Continental Airlines, Inc., Series 1998-1, Class A, 6.648% 20195 | 312 | 315 |
| Continental Airlines, Inc., Series 1997-4, Class A, 6.90% 20195 | 177 | 181 |
| Continental Airlines, Inc., Series 1999-1, Class A, 6.545% 20205 | 3,354 | 3,506 |
| Continental Airlines, Inc., Series 2001-1, Class A1, 6.703% 20225 | 1,146 | 1,237 |
| ERAC USA Finance Co. 2.80% 20184 | 9,900 | 10,005 |
| ERAC USA Finance Co. 2.70% 20234 | 25,500 | 24,930 |
| FedEx Corp. 4.75% 2045 | 65,685 | 71,313 |
| Fortive Corp. 1.80% 2019 | 8,000 | 7,947 |
| Fortive Corp. 2.35% 2021 | 6,505 | 6,473 |
| General Electric Capital Corp. 2.342% 2020 | 18,286 | 18,439 |
| General Electric Capital Corp., Series A, 6.00% 2019 | 2,577 | 2,802 |
| General Electric Co. 5.25% 2017 | 11,000 | 11,181 |
| General Electric Co. 2.70% 2022 | 11,000 | 11,195 |
| General Electric Co. 4.125% 2042 | 11,000 | 11,620 |
| Honeywell International Inc. 1.85% 2021 | 17,905 | 17,627 |
| Honeywell International Inc. 2.50% 2026 | 10,000 | 9,599 |
| Johnson Controls, Inc. 1.40% 2017 | 10,000 | 9,994 |
| Lockheed Martin Corp. 3.10% 2023 | 4,710 | 4,824 |
| Lockheed Martin Corp. 3.55% 2026 | 48,050 | 49,884 |
| Lockheed Martin Corp. 4.70% 2046 | 11,490 | 12,982 |
| Rockwell Collins, Inc. 1.95% 2019 | 8,465 | 8,482 |
| Rockwell Collins, Inc. 2.80% 2022 | 36,585 | 36,958 |
| Rockwell Collins, Inc. 3.20% 2024 | 34,345 | 34,856 |
| Roper Technologies, Inc. 2.80% 2021 | 9,660 | 9,751 |
| Roper Technologies, Inc. 3.80% 2026 | 8,325 | 8,571 |
| Siemens AG 1.70% 20214 | 25,500 | 24,923 |
| Siemens AG 2.70% 20224 | 55,520 | 56,273 |
| Southwest Airlines Co. 2.75% 2019 | 6,255 | 6,353 |
| Union Pacific Corp. 5.70% 2018 | 11,150 | 11,650 |
| United Technologies Corp. 2.30% 2022 | 29,000 | 28,929 |
| United Technologies Corp. 3.10% 2022 | 30,000 | 31,017 |
| United Technologies Corp. 3.125% 2027 | 33,000 | 33,123 |
| Waste Management, Inc. 2.90% 2022 | 15,000 | 15,367 |
| | | 641,816 |
| Telecommunication services0.49% | | |
| AT&T Inc. 2.80% 2021 | 11,500 | 11,631 |
| AT&T Inc. 3.00% 2022 | 30,000 | 30,086 |
| AT&T Inc. 4.25% 2027 | 46,850 | 48,531 |
| AT&T Inc. 5.25% 2037 | 26,250 | 28,082 |
| AT&T Inc. 5.45% 2047 | 11,250 | 12,173 |
| British Telecommunications PLC 2.35% 2019 | 13,285 | 13,364 |
| British Telecommunications PLC 9.125% 2030 | 16,988 | 25,890 |
American Balanced Fund — Page 17 of 33
unaudited
Bonds, notes & other debt instruments
Corporate bonds & notes (continued)
Telecommunication services (continued) | Principal?amount
(000) | Value
(000) |
| Deutsche Telekom International Finance BV 1.95% 20214 | $10,000 | $9,753 |
| Deutsche Telekom International Finance BV 2.82% 20224 | 45,985 | 46,292 |
| Deutsche Telekom International Finance BV 2.485% 20234 | 6,315 | 6,138 |
| Deutsche Telekom International Finance BV 3.60% 20274 | 47,214 | 48,136 |
| Deutsche Telekom International Finance BV 9.25% 2032 | 6,194 | 9,789 |
| France Télécom 4.125% 2021 | 20,000 | 21,282 |
| France Télécom 9.00% 2031 | 1,690 | 2,562 |
| Orange SA 1.625% 2019 | 20,000 | 19,838 |
| Orange SA 2.75% 2019 | 14,870 | 15,065 |
| Orange SA 5.50% 2044 | 14,000 | 16,798 |
| SoftBank Group Corp. 3.36% 20234,5 | 15,000 | 15,169 |
| Telefónica Emisiones, SAU 3.192% 2018 | 15,000 | 15,162 |
| Verizon Communications Inc. 2.946% 20224 | 41,575 | 41,905 |
| Verizon Communications Inc. 4.125% 2027 | 26,900 | 27,840 |
| Verizon Communications Inc. 4.272% 2036 | 47,680 | 46,215 |
| Verizon Communications Inc. 4.125% 2046 | 47,649 | 42,639 |
| | | 554,340 |
| Materials0.20% | | |
| BHP Billiton Finance Ltd. 6.25% 20754 | 3,175 | 3,470 |
| Chevron Phillips Chemical Company LLC 2.45% 20204 | 16,880 | 16,955 |
| CRH America, Inc. 3.875% 20254 | 7,700 | 8,016 |
| Eastman Chemical Co. 2.70% 2020 | 21,000 | 21,288 |
| Eastman Chemical Co. 3.80% 2025 | 7,405 | 7,633 |
| Ecolab Inc. 4.35% 2021 | 1,000 | 1,088 |
| Ecolab Inc. 5.50% 2041 | 1,500 | 1,846 |
| Georgia-Pacific Corp. 2.539% 20194 | 21,000 | 21,199 |
| Holcim Ltd. 5.15% 20234 | 17,000 | 18,761 |
| International Paper Co. 7.30% 2039 | 7,835 | 10,641 |
| Monsanto Co. 4.40% 2044 | 13,090 | 13,384 |
| Praxair, Inc. 1.05% 2017 | 16,000 | 15,977 |
| Praxair, Inc. 2.25% 2020 | 12,034 | 12,155 |
| Rohm and Haas Co. 6.00% 2017 | 5,003 | 5,047 |
| Sherwin-Williams Co. 2.25% 2020 | 35,000 | 35,100 |
| Sherwin-Williams Co. 2.75% 2022 | 17,460 | 17,468 |
| Sherwin-Williams Co. 3.125% 2024 | 4,260 | 4,287 |
| Sherwin-Williams Co. 3.45% 2027 | 10,930 | 11,030 |
| | | 225,345 |
| Total corporate bonds & notes | | 14,195,032 |
U.S. Treasury bonds & notes11.20%
U.S. Treasury9.16% | | |
| U.S. Treasury 0.625% 2018 | 437,930 | 435,653 |
| U.S. Treasury 0.75% 2018 | 103,998 | 103,629 |
| U.S. Treasury 1.25% 2018 | 255,000 | 254,709 |
| U.S. Treasury 0.75% 2019 | 76,000 | 74,978 |
| U.S. Treasury 0.875% 2019 | 250,000 | 247,102 |
| U.S. Treasury 1.125% 2019 | 59,000 | 58,795 |
| U.S. Treasury 1.25% 2019 | 225,000 | 224,498 |
| U.S. Treasury 1.25% 2019 | 100,000 | 99,800 |
| U.S. Treasury 1.375% 2019 | 112,000 | 111,757 |
| U.S. Treasury 1.50% 2019 | 44,000 | 44,042 |
| U.S. Treasury 1.75% 2019 | 110,000 | 110,817 |
American Balanced Fund — Page 18 of 33
unaudited
Bonds, notes & other debt instruments
U.S. Treasury bonds & notes (continued)
U.S. Treasury (continued) | Principal?amount
(000) | Value
(000) |
| U.S. Treasury 1.25% 2020 | $617,000 | $613,212 |
| U.S. Treasury 1.375% 2020 | 276,875 | 274,638 |
| U.S. Treasury 1.375% 2020 | 118,000 | 117,560 |
| U.S. Treasury 1.50% 2020 | 101,000 | 100,843 |
| U.S. Treasury 1.50% 2020 | 100,000 | 99,885 |
| U.S. Treasury 1.625% 2020 | 25,000 | 25,078 |
| U.S. Treasury 1.125% 2021 | 224,250 | 218,381 |
| U.S. Treasury 1.125% 2021 | 4,000 | 3,891 |
| U.S. Treasury 1.25% 2021 | 100,900 | 99,215 |
| U.S. Treasury 1.375% 2021 | 246,960 | 244,313 |
| U.S. Treasury 1.375% 2021 | 101,350 | 100,067 |
| U.S. Treasury 1.75% 2021 | 119,250 | 118,947 |
| U.S. Treasury 2.00% 2021 | 75,000 | 75,547 |
| U.S. Treasury 2.25% 2021 | 97,270 | 99,140 |
| U.S. Treasury 1.75% 2022 | 289,638 | 288,054 |
| U.S. Treasury 1.875% 2022 | 890,000 | 890,525 |
| U.S. Treasury 2.00% 2022 | 35,000 | 35,267 |
| U.S. Treasury 1.375% 2023 | 240,360 | 230,698 |
| U.S. Treasury 1.375% 2023 | 100,000 | 96,074 |
| U.S. Treasury 1.375% 2023 | 36,935 | 35,564 |
| U.S. Treasury 1.75% 2023 | 12,920 | 12,761 |
| U.S. Treasury 2.125% 2023 | 100,000 | 100,344 |
| U.S. Treasury 2.25% 2023 | 625,250 | 631,477 |
| U.S. Treasury 2.00% 2024 | 453,711 | 450,022 |
| U.S. Treasury 2.00% 2024 | 99,599 | 98,739 |
| U.S. Treasury 2.00% 2024 | 59,750 | 59,302 |
| U.S. Treasury 2.125% 2024 | 88,500 | 88,562 |
| U.S. Treasury 2.25% 2024 | 75,000 | 75,427 |
| U.S. Treasury 2.25% 2024 | 50,000 | 50,475 |
| U.S. Treasury 2.00% 2025 | 30,000 | 29,592 |
| U.S. Treasury 2.125% 2025 | 25,000 | 24,850 |
| U.S. Treasury 2.25% 2025 | 43,000 | 43,019 |
| U.S. Treasury 1.625% 2026 | 87,112 | 82,605 |
| U.S. Treasury 1.625% 2026 | 8,500 | 8,080 |
| U.S. Treasury 2.00% 2026 | 183,040 | 178,534 |
| U.S. Treasury 2.25% 2027 | 134,250 | 133,667 |
| U.S. Treasury 2.375% 2027 | 857,924 | 863,689 |
| U.S. Treasury 5.375% 2031 | 20,000 | 26,906 |
| U.S. Treasury 2.75% 2042 | 32,950 | 32,630 |
| U.S. Treasury 2.875% 2043 | 36,410 | 36,803 |
| U.S. Treasury 3.125% 2043 | 48,025 | 50,803 |
| U.S. Treasury 3.125% 2044 | 39,797 | 42,091 |
| U.S. Treasury 3.625% 2044 | 25,000 | 28,835 |
| U.S. Treasury 2.50% 2045 | 115,000 | 107,508 |
| U.S. Treasury 2.875% 2045 | 70,000 | 70,493 |
| U.S. Treasury 3.00% 2045 | 110,500 | 114,008 |
| U.S. Treasury 3.00% 2045 | 25,000 | 25,807 |
| U.S. Treasury 2.50% 2046 | 76,255 | 71,070 |
| U.S. Treasury 2.875% 2046 | 575,130 | 579,196 |
| U.S. Treasury 3.00% 2047 | 657,681 | 679,463 |
| U.S. Treasury 3.00% 2047 | 57,750 | 59,694 |
| | | 10,389,131 |
American Balanced Fund — Page 19 of 33
unaudited
Bonds, notes & other debt instruments
U.S. Treasury bonds & notes (continued)
U.S. Treasury inflation-protected securities2.03% | Principal?amount
(000) | Value
(000) |
| U.S. Treasury Inflation-Protected Security 2.625% 20177 | $117,970 | $118,080 |
| U.S. Treasury Inflation-Protected Security 2.125% 20197 | 56,940 | 58,853 |
| U.S. Treasury Inflation-Protected Security 0.125% 20217 | 103,161 | 103,056 |
| U.S. Treasury Inflation-Protected Security 0.125% 20247 | 99,882 | 98,178 |
| U.S. Treasury Inflation-Protected Security 0.625% 20247 | 344,278 | 349,473 |
| U.S. Treasury Inflation-Protected Security 0.375% 20257 | 268,581 | 266,861 |
| U.S. Treasury Inflation-Protected Security 2.375% 20257 | 64,855 | 73,936 |
| U.S. Treasury Inflation-Protected Security 0.125% 20267 | 163,203 | 157,562 |
| U.S. Treasury Inflation-Protected Security 0.625% 20267 | 58,004 | 58,419 |
| U.S. Treasury Inflation-Protected Security 0.375% 20277 | 516,713 | 507,935 |
| U.S. Treasury Inflation-Protected Security 1.75% 20287 | 31,394 | 35,020 |
| U.S. Treasury Inflation-Protected Security 0.75% 20427 | 52,495 | 50,067 |
| U.S. Treasury Inflation-Protected Security 1.375% 20447 | 124,265 | 135,468 |
| U.S. Treasury Inflation-Protected Security 1.00% 20467 | 231,608 | 231,780 |
| U.S. Treasury Inflation-Protected Security 0.875% 20477 | 54,188 | 52,660 |
| | | 2,297,348 |
| Federal agency bonds & notes0.01% | | |
| Japan Finance Organization for Municipalities 2.125% 20194 | 10,000 | 10,015 |
| Total U.S. Treasury bonds & notes | | 12,696,494 |
| Mortgage-backed obligations7.58% | | |
| Aventura Mall Trust, Series A, 3.743% 20324,5,6 | 9,200 | 9,663 |
| Banc of America Commercial Mortgage Inc., Series 2007-4, Class AM, 6.158% 20515,6 | 410 | 410 |
| Banc of America Commercial Mortgage Inc., Series 2008-1, Class A4, 6.466% 20515,6 | 16,497 | 16,635 |
| Bank of Nova Scotia 2.125% 20195 | 16,225 | 16,276 |
| Bear Stearns Commercial Mortgage Securities Trust, Series 2007-PW17, Class A1A, 5.65% 20505,6 | 495 | 496 |
| Bear Stearns Commercial Mortgage Securities Trust, Series 2007-PW17, Class A4, 5.694% 20505,6 | 2,875 | 2,889 |
| Bear Stearns Commercial Mortgage Securities Trust, Series 2007-PW18, Class AM, 6.084% 20505,6 | 6,425 | 6,498 |
| CHL Mortgage Pass-Through Trust, Series 2003-56, Class 6A1, 3.501% 20335,6 | 1,638 | 1,667 |
| Citigroup Commercial Mortgage Trust, Series 2015-GC29, Class AAB, 2.984% 20485 | 3,370 | 3,444 |
| Citigroup Commercial Mortgage Trust, Series 2017-P7, Class A4, 3.712% 20505 | 26,775 | 28,038 |
| Commercial Mortgage Trust, Series 2015-PC1, Class A5, 3.902% 20505 | 15,265 | 16,080 |
| Commonwealth Bank of Australia 1.875% 20184,5 | 5,700 | 5,705 |
| Commonwealth Bank of Australia 2.00% 20194,5 | 23,500 | 23,546 |
| Connecticut Avenue Securities, Series 2013-C01, Class M1, (1-month USD-LIBOR + 2.00%) 3.216% 20234,5,6 | 237 | 240 |
| Connecticut Avenue Securities, Series 2014-C02, Class 1M1, (1-month USD-LIBOR + 0.95%) 2.166% 20245,6 | 244 | 245 |
| Connecticut Avenue Securities, Series 2014-C03, Class 2M1, (1-month USD-LIBOR + 1.20%) 2.416% 20245,6 | 326 | 327 |
| Connecticut Avenue Securities, Series 2014-C03, Class 1M1, (1-month USD-LIBOR + 1.20%) 2.416% 20245,6 | 164 | 164 |
| Connecticut Avenue Securities, Series 2014-C01, Class M1, (1-month USD-LIBOR + 1.60%) 2.816% 20244,5,6 | 649 | 656 |
| Connecticut Avenue Securities, Series 2015-C03, Class 2M1, (1-month USD-LIBOR + 1.50%) 2.716% 20255,6 | 70 | 70 |
| Connecticut Avenue Securities, Series 2015-C04, Class 2M1, (1-month USD-LIBOR + 1.70%) 2.916% 20285,6 | 843 | 845 |
| Core Industrial Trust, Series 2015-CALW, Class A, 3.04% 20344,5 | 19,570 | 20,100 |
| Credit Mutuel-CIC Home Loan SFH 1.50% 20174,5 | 800 | 801 |
| CS First Boston Mortgage Securities Corp., Series 2002-34, Class IA1, 7.50% 20325 | 525 | 578 |
| CS First Boston Mortgage Securities Corp., Series 2002-30, Class IA1, 7.50% 20325 | 358 | 399 |
| CS First Boston Mortgage Securities Corp., Series 2003-21, Class VA1, 6.50% 20335 | 509 | 548 |
| CS First Boston Mortgage Securities Corp., Series 2003-29, Class VA1, 7.00% 20335 | 812 | 870 |
| CS First Boston Mortgage Securities Corp., Series 2004-5, Class IVA1, 6.00% 20345 | 2,358 | 2,409 |
| CS First Boston Mortgage Securities Corp., Series 2007-C5, Class A4, 5.695% 20405,6 | 5,508 | 5,502 |
| CSAIL Commercial Mortgage Trust, Series 2015-C4, Class ASB, 3.617% 20485 | 5,600 | 5,871 |
| DBUBS Mortgage Trust, Series 2011-LC1A, Class A3, 5.002% 20464,5 | 9,500 | 10,220 |
| DNB ASA 1.45% 20194,5 | 925 | 925 |
| Fannie Mae 11.00% 20185 | 2 | 3 |
American Balanced Fund — Page 20 of 33
unaudited
Bonds, notes & other debt instruments
Mortgage-backed obligations (continued) | Principal?amount
(000) | Value
(000) |
| Fannie Mae 4.50% 20255 | $3,195 | $3,371 |
| Fannie Mae 4.50% 20255 | 2,324 | 2,453 |
| Fannie Mae 2.50% 20275 | 21,930 | 22,193 |
| Fannie Mae 2.50% 20275 | 21,159 | 21,412 |
| Fannie Mae 2.50% 20275 | 1,437 | 1,454 |
| Fannie Mae 2.50% 20275 | 1,037 | 1,050 |
| Fannie Mae 2.50% 20275 | 730 | 739 |
| Fannie Mae 2.50% 20285 | 2,252 | 2,272 |
| Fannie Mae 2.50% 20285 | 2,005 | 2,028 |
| Fannie Mae 2.50% 20285 | 1,770 | 1,790 |
| Fannie Mae 2.50% 20285 | 721 | 729 |
| Fannie Mae 2.50% 20285 | 590 | 596 |
| Fannie Mae 2.50% 20285 | 294 | 298 |
| Fannie Mae 2.50% 20325,8 | 1,900 | 1,910 |
| Fannie Mae 5.50% 20335 | 2,465 | 2,762 |
| Fannie Mae 5.50% 20335 | 2,236 | 2,506 |
| Fannie Mae 5.50% 20335 | 261 | 292 |
| Fannie Mae 4.50% 20345 | 8,489 | 9,144 |
| Fannie Mae 3.00% 20355 | 32,314 | 32,873 |
| Fannie Mae 3.50% 20355 | 36,620 | 38,133 |
| Fannie Mae 3.50% 20355 | 25,183 | 26,223 |
| Fannie Mae 3.50% 20355 | 23,031 | 23,931 |
| Fannie Mae 3.50% 20355 | 9,470 | 9,862 |
| Fannie Mae 5.00% 20355 | 902 | 991 |
| Fannie Mae 5.50% 20355 | 1,026 | 1,151 |
| Fannie Mae 5.50% 20355 | 603 | 675 |
| Fannie Mae 6.50% 20355 | 2,323 | 2,663 |
| Fannie Mae 3.00% 20365 | 101,702 | 103,308 |
| Fannie Mae 3.00% 20365 | 28,938 | 29,394 |
| Fannie Mae 3.00% 20365 | 5,770 | 5,861 |
| Fannie Mae 5.50% 20365 | 204 | 228 |
| Fannie Mae 5.50% 20365 | 172 | 192 |
| Fannie Mae 6.00% 20365 | 673 | 770 |
| Fannie Mae 3.00% 20375 | 137,365 | 139,533 |
| Fannie Mae 3.00% 20375 | 100,283 | 101,867 |
| Fannie Mae 3.00% 20375 | 81,443 | 82,730 |
| Fannie Mae 3.00% 20375 | 49,750 | 50,536 |
| Fannie Mae 3.00% 20375 | 25,502 | 25,905 |
| Fannie Mae 3.00% 20375 | 15,522 | 15,767 |
| Fannie Mae 6.00% 20375 | 7,676 | 8,712 |
| Fannie Mae 6.50% 20375 | 1,503 | 1,696 |
| Fannie Mae 6.50% 20375 | 1,324 | 1,466 |
| Fannie Mae 6.50% 20375 | 486 | 536 |
| Fannie Mae 7.00% 20375 | 377 | 412 |
| Fannie Mae 7.00% 20375 | 298 | 326 |
| Fannie Mae 7.00% 20375 | 133 | 145 |
| Fannie Mae 5.50% 20385 | 420 | 469 |
| Fannie Mae 6.50% 20385 | 2,142 | 2,424 |
| Fannie Mae 5.50% 20395 | 65 | 72 |
| Fannie Mae 6.00% 20395 | 10,495 | 11,876 |
| Fannie Mae 4.00% 20405 | 3,077 | 3,268 |
| Fannie Mae 4.50% 20405 | 13,340 | 14,432 |
| Fannie Mae 4.50% 20405 | 10,954 | 11,848 |
| Fannie Mae 4.50% 20405 | 8,529 | 9,226 |
| Fannie Mae 5.00% 20405 | 9,812 | 10,731 |
American Balanced Fund — Page 21 of 33
unaudited
Bonds, notes & other debt instruments
Mortgage-backed obligations (continued) | Principal?amount
(000) | Value
(000) |
| Fannie Mae 5.00% 20405 | $2,572 | $2,817 |
| Fannie Mae 5.00% 20405 | 1,295 | 1,417 |
| Fannie Mae 5.00% 20405 | 1,101 | 1,205 |
| Fannie Mae 4.00% 20415 | 10,914 | 11,591 |
| Fannie Mae 4.00% 20415 | 8,428 | 8,951 |
| Fannie Mae 4.00% 20415 | 7,123 | 7,517 |
| Fannie Mae 4.00% 20415 | 5,051 | 5,368 |
| Fannie Mae 4.00% 20415 | 2,941 | 3,126 |
| Fannie Mae 4.00% 20415 | 2,481 | 2,637 |
| Fannie Mae 4.00% 20415 | 1,550 | 1,653 |
| Fannie Mae 4.50% 20415 | 6,899 | 7,463 |
| Fannie Mae 5.00% 20415 | 1,797 | 1,964 |
| Fannie Mae 5.00% 20415 | 1,506 | 1,648 |
| Fannie Mae 5.00% 20415 | 1,442 | 1,578 |
| Fannie Mae 5.00% 20415 | 1,413 | 1,545 |
| Fannie Mae 5.00% 20415 | 1,389 | 1,519 |
| Fannie Mae 5.00% 20415 | 1,306 | 1,430 |
| Fannie Mae 5.00% 20415 | 1,106 | 1,211 |
| Fannie Mae 5.00% 20415 | 735 | 804 |
| Fannie Mae 5.00% 20415 | 573 | 628 |
| Fannie Mae 5.00% 20415 | 470 | 515 |
| Fannie Mae 5.00% 20415 | 391 | 428 |
| Fannie Mae 5.00% 20415 | 207 | 227 |
| Fannie Mae 5.00% 20415 | 188 | 205 |
| Fannie Mae 5.00% 20415 | 137 | 150 |
| Fannie Mae 5.00% 20415 | 135 | 148 |
| Fannie Mae 5.00% 20415 | 65 | 71 |
| Fannie Mae 5.00% 20415 | 38 | 42 |
| Fannie Mae 5.00% 20415 | 26 | 28 |
| Fannie Mae 5.00% 20415 | 23 | 25 |
| Fannie Mae 3.50% 20425 | 19,484 | 20,102 |
| Fannie Mae 4.00% 20425 | 24,587 | 26,130 |
| Fannie Mae 4.00% 20425 | 13,057 | 13,865 |
| Fannie Mae 4.00% 20425 | 8,689 | 9,253 |
| Fannie Mae 4.00% 20425 | 8,406 | 8,936 |
| Fannie Mae 4.00% 20425 | 6,531 | 6,936 |
| Fannie Mae 4.00% 20425 | 2,822 | 2,990 |
| Fannie Mae 4.00% 20425 | 1,904 | 2,016 |
| Fannie Mae 5.00% 20425 | 252 | 275 |
| Fannie Mae 3.50% 20435 | 25,260 | 26,037 |
| Fannie Mae 3.50% 20435 | 16,904 | 17,411 |
| Fannie Mae 3.50% 20435 | 12,977 | 13,351 |
| Fannie Mae 3.50% 20435 | 5,115 | 5,263 |
| Fannie Mae 3.50% 20435 | 2,365 | 2,435 |
| Fannie Mae 3.50% 20435 | 1,575 | 1,624 |
| Fannie Mae 4.00% 20435 | 12,671 | 13,453 |
| Fannie Mae 4.00% 20435 | 7,690 | 8,154 |
| Fannie Mae 4.00% 20435 | 2,816 | 2,964 |
| Fannie Mae 4.00% 20435 | 529 | 565 |
| Fannie Mae 4.00% 20435 | 401 | 428 |
| Fannie Mae 4.00% 20435 | 331 | 352 |
| Fannie Mae 4.50% 20435 | 14,101 | 15,155 |
| Fannie Mae 3.50% 20445 | 18,216 | 18,721 |
| Fannie Mae 3.50% 20445 | 15,082 | 15,500 |
| Fannie Mae 3.50% 20445 | 1,613 | 1,658 |
American Balanced Fund — Page 22 of 33
unaudited
Bonds, notes & other debt instruments
Mortgage-backed obligations (continued) | Principal?amount
(000) | Value
(000) |
| Fannie Mae 3.50% 20455 | $20,579 | $21,252 |
| Fannie Mae 3.50% 20455 | 19,265 | 19,879 |
| Fannie Mae 4.00% 20455 | 71,827 | 76,270 |
| Fannie Mae 4.00% 20455 | 69,969 | 74,296 |
| Fannie Mae 4.00% 20455 | 52,911 | 55,661 |
| Fannie Mae 4.00% 20455 | 38,841 | 41,242 |
| Fannie Mae 4.00% 20455 | 34,447 | 36,570 |
| Fannie Mae 4.00% 20455 | 22,921 | 24,335 |
| Fannie Mae 4.00% 20455 | 16,925 | 17,969 |
| Fannie Mae 4.00% 20455 | 13,125 | 13,807 |
| Fannie Mae 3.00% 20465 | 196,520 | 196,413 |
| Fannie Mae 3.50% 20465 | 73,004 | 75,027 |
| Fannie Mae 3.50% 20465 | 62,895 | 64,637 |
| Fannie Mae 3.50% 20465 | 34,332 | 35,355 |
| Fannie Mae 3.50% 20465 | 28,314 | 29,244 |
| Fannie Mae 3.50% 20465 | 25,639 | 26,401 |
| Fannie Mae 3.50% 20465 | 20,802 | 21,418 |
| Fannie Mae 3.50% 20465 | 14,958 | 15,403 |
| Fannie Mae 3.50% 20465 | 11,116 | 11,424 |
| Fannie Mae 4.00% 20465 | 113,235 | 119,122 |
| Fannie Mae 4.00% 20465 | 35,422 | 37,264 |
| Fannie Mae 4.00% 20465 | 29,794 | 31,343 |
| Fannie Mae 4.00% 20465 | 4,730 | 5,010 |
| Fannie Mae 4.00% 20465 | 4,371 | 4,598 |
| Fannie Mae 4.00% 20465 | 3,908 | 4,111 |
| Fannie Mae 4.00% 20465 | 3,188 | 3,369 |
| Fannie Mae 4.50% 20465 | 4,612 | 4,948 |
| Fannie Mae 4.50% 20465 | 2,482 | 2,664 |
| Fannie Mae 3.50% 20475,8 | 124,025 | 127,354 |
| Fannie Mae 3.50% 20475,8 | 79,950 | 81,953 |
| Fannie Mae 3.50% 20475 | 3,784 | 3,897 |
| Fannie Mae 3.50% 20475 | 2,274 | 2,341 |
| Fannie Mae 4.00% 20475,8 | 414,000 | 434,401 |
| Fannie Mae 4.00% 20475,8 | 260,000 | 273,284 |
| Fannie Mae 4.00% 20475 | 175,882 | 185,027 |
| Fannie Mae 4.00% 20475 | 78,254 | 82,322 |
| Fannie Mae 4.50% 20475,8 | 50,000 | 53,629 |
| Fannie Mae 4.50% 20475,8 | 18,500 | 19,787 |
| Fannie Mae 4.50% 20475,8 | 2,000 | 2,143 |
| Fannie Mae 6.50% 20475 | 179 | 199 |
| Fannie Mae 6.50% 20475 | 119 | 132 |
| Fannie Mae 6.50% 20475 | 80 | 89 |
| Fannie Mae 7.00% 20475 | 181 | 204 |
| Fannie Mae 7.00% 20475 | 128 | 144 |
| Fannie Mae 7.00% 20475 | 89 | 100 |
| Fannie Mae 7.00% 20475 | 88 | 99 |
| Fannie Mae 7.00% 20475 | 10 | 12 |
| Fannie Mae 4.00% 20565 | 20,365 | 21,568 |
| Fannie Mae, Series 2014-M6, Class FA, multifamily (1-month USD-LIBOR + 0.29%) 1.285% 20175,6 | 1,065 | 1,064 |
| Fannie Mae, Series 2012-M8, multifamily 1.52% 20195 | 3,572 | 3,570 |
| Fannie Mae, Series 2012-M9, Class A2, multifamily 2.482% 20225 | 21,106 | 21,369 |
| Fannie Mae, Series 2012-M5, Class A2, multifamily 2.715% 20225 | 14,000 | 14,179 |
| Fannie Mae, Series 2013-M14, Class A2, multifamily 3.329% 20235,6 | 19,245 | 20,130 |
| Fannie Mae, Series 2014-M1, Class A2, multifamily 3.348% 20235,6 | 16,000 | 16,696 |
| Fannie Mae, Series 2014-M2, Class A2, multifamily 3.513% 20235,6 | 16,585 | 17,559 |
American Balanced Fund — Page 23 of 33
unaudited
Bonds, notes & other debt instruments
Mortgage-backed obligations (continued) | Principal?amount
(000) | Value
(000) |
| Fannie Mae, Series 2014-M9, Class A2, multifamily 3.103% 20245,6 | $16,865 | $17,450 |
| Fannie Mae, Series 2014-M3, Class A2, multifamily 3.501% 20245,6 | 18,000 | 19,127 |
| Fannie Mae, Series 2001-4, Class NA, 9.472% 20255,6 | 3 | 3 |
| Fannie Mae, Series 2017-M3, Class A2, multifamily 2.569% 20265,6 | 92,005 | 89,664 |
| Fannie Mae, Series 2017-M7, Class A2, multifamily 2.961% 20275,6 | 43,220 | 43,486 |
| Fannie Mae, Series 2001-20, Class D, 11.010% 20315,6 | 0 | 1 |
| Fannie Mae, Series 2006-43, Class JO, principal only, 0% 20365 | 1,043 | 937 |
| Fannie Mae, Series 2001-T10, Class A1, 7.00% 20415 | 217 | 255 |
| Fannie Mae, Series 2001-50, Class BA, 7.00% 20415 | 136 | 155 |
| Fannie Mae, Series 2002-W3, Class A5, 7.50% 20415 | 272 | 321 |
| Fannie Mae, Series 2002-W1, Class 2A, 6.104% 20425,6 | 301 | 341 |
| Freddie Mac 5.00% 20235 | 2,026 | 2,166 |
| Freddie Mac 5.00% 20235 | 1,464 | 1,565 |
| Freddie Mac 5.00% 20235 | 850 | 897 |
| Freddie Mac 5.00% 20235 | 439 | 468 |
| Freddie Mac 5.00% 20235 | 431 | 459 |
| Freddie Mac 5.00% 20235 | 299 | 312 |
| Freddie Mac 5.00% 20245 | 2,611 | 2,792 |
| Freddie Mac 6.50% 20275 | 469 | 525 |
| Freddie Mac 6.50% 20275 | 267 | 304 |
| Freddie Mac 6.50% 20275 | 46 | 52 |
| Freddie Mac 6.50% 20285 | 326 | 371 |
| Freddie Mac 3.50% 20345 | 51,395 | 53,726 |
| Freddie Mac 3.00% 20355 | 3,049 | 3,109 |
| Freddie Mac 3.00% 20355 | 3,003 | 3,062 |
| Freddie Mac 3.50% 20355 | 26,547 | 27,645 |
| Freddie Mac 3.50% 20355 | 8,175 | 8,513 |
| Freddie Mac 3.00% 20365 | 204 | 207 |
| Freddie Mac 3.00% 20375 | 55,154 | 55,983 |
| Freddie Mac 3.00% 20375 | 53,636 | 54,442 |
| Freddie Mac 5.50% 20375 | 327 | 363 |
| Freddie Mac 5.50% 20375 | 54 | 60 |
| Freddie Mac 5.50% 20385 | 180 | 201 |
| Freddie Mac 5.50% 20385 | 70 | 78 |
| Freddie Mac 6.00% 20385 | 1,201 | 1,353 |
| Freddie Mac 6.00% 20385 | 149 | 168 |
| Freddie Mac 5.50% 20395 | 289 | 323 |
| Freddie Mac 4.50% 20405 | 9,863 | 10,605 |
| Freddie Mac 4.50% 20405 | 716 | 770 |
| Freddie Mac 4.50% 20415 | 1,768 | 1,901 |
| Freddie Mac 4.50% 20415 | 1,488 | 1,600 |
| Freddie Mac 4.50% 20415 | 586 | 630 |
| Freddie Mac 4.50% 20415 | 519 | 557 |
| Freddie Mac 4.50% 20415 | 113 | 121 |
| Freddie Mac 4.50% 20415 | 88 | 94 |
| Freddie Mac 5.00% 20415 | 548 | 600 |
| Freddie Mac 3.50% 20425 | 1,613 | 1,664 |
| Freddie Mac 4.00% 20425 | 13,733 | 14,552 |
| Freddie Mac 3.50% 20435 | 1,370 | 1,413 |
| Freddie Mac 4.00% 20435 | 2,011 | 2,138 |
| Freddie Mac 4.00% 20435 | 857 | 911 |
| Freddie Mac 4.00% 20435 | 823 | 876 |
| Freddie Mac 4.00% 20435 | 401 | 428 |
| Freddie Mac 3.50% 20445 | 30,909 | 31,893 |
| Freddie Mac 4.00% 20445 | 6,517 | 6,936 |
American Balanced Fund — Page 24 of 33
unaudited
Bonds, notes & other debt instruments
Mortgage-backed obligations (continued) | Principal?amount
(000) | Value
(000) |
| Freddie Mac 4.00% 20455 | $79,692 | $84,697 |
| Freddie Mac 4.00% 20455 | 37,292 | 39,786 |
| Freddie Mac 4.00% 20455 | 21,597 | 23,041 |
| Freddie Mac 4.00% 20455 | 12,858 | 13,666 |
| Freddie Mac 3.50% 20465 | 127,151 | 130,731 |
| Freddie Mac 3.50% 20465 | 82,924 | 85,388 |
| Freddie Mac 3.50% 20465 | 42,214 | 43,403 |
| Freddie Mac 3.50% 20465 | 5,899 | 6,074 |
| Freddie Mac 4.00% 20465 | 31,334 | 33,145 |
| Freddie Mac 4.00% 20465 | 25,697 | 27,055 |
| Freddie Mac 4.00% 20465 | 9,404 | 9,964 |
| Freddie Mac 4.00% 20465 | 2,012 | 2,126 |
| Freddie Mac 4.50% 20465 | 3,469 | 3,717 |
| Freddie Mac 4.50% 20465 | 2,244 | 2,404 |
| Freddie Mac 3.50% 20475,8 | 170,000 | 174,310 |
| Freddie Mac 3.50% 20475,8 | 96,250 | 98,536 |
| Freddie Mac 4.00% 20475 | 651,773 | 686,519 |
| Freddie Mac 4.00% 20475,8 | 175,000 | 183,695 |
| Freddie Mac 4.00% 20475 | 122,681 | 129,784 |
| Freddie Mac 4.00% 20475,8 | 25,000 | 26,290 |
| Freddie Mac 4.50% 20475,8 | 241,000 | 258,111 |
| Freddie Mac Pool #1B7749 3.301% 20405,6 | 64 | 68 |
| Freddie Mac Pool #760014 2.981% 20455,6 | 7,060 | 7,265 |
| Freddie Mac, Series KS01, Class A1, multifamily 1.693% 20225 | 1,866 | 1,858 |
| Freddie Mac, Series K019, Class A2, multifamily 2.272% 20225 | 16,000 | 16,081 |
| Freddie Mac, Series K021, Class A2, multifamily 2.396% 20225 | 16,555 | 16,711 |
| Freddie Mac, Series K025, Class A2, multifamily 2.682% 20225 | 15,904 | 16,215 |
| Freddie Mac, Series K723, Class A2, multifamily 2.454% 20235 | 29,715 | 29,899 |
| Freddie Mac, Series KS01, Class A2, multifamily 2.522% 20235 | 1,075 | 1,088 |
| Freddie Mac, Series K034, Class A1, multifamily 2.669% 20235 | 6,637 | 6,772 |
| Freddie Mac, Series 2013-DN2, Class M1, (1-month USD-LIBOR + 1.45%) 2.666% 20235,6 | 2,007 | 2,016 |
| Freddie Mac, Series K036, Class A2, multifamily 3.527% 20235,6 | 16,500 | 17,524 |
| Freddie Mac, Series 2013-DN1, Class M1, (1-month USD-LIBOR + 3.40%) 4.616% 20235,6 | 3,352 | 3,393 |
| Freddie Mac, Series 2014-HQ2, Class M1, (1-month USD-LIBOR + 1.45%) 2.666% 20245,6 | 2,204 | 2,210 |
| Freddie Mac, Series 2014-DN2, Class M2, (1-month USD-LIBOR + 1.65%) 2.866% 20245,6 | 8,526 | 8,664 |
| Freddie Mac, Series K726, Class A2, multifamily 2.905% 20245 | 28,420 | 29,072 |
| Freddie Mac, Series K725, Class A2, multifamily 3.002% 20245 | 44,445 | 45,794 |
| Freddie Mac, Series K043, Class A2, multifamily 3.062% 20245 | 36,400 | 37,560 |
| Freddie Mac, Series 2014-HQ2, Class M2, (1-month USD-LIBOR + 2.20%) 3.416% 20245,6 | 21,320 | 21,909 |
| Freddie Mac, Series 2014-DN3, Class M2, (1-month USD-LIBOR + 2.40%) 3.616% 20245,6 | 376 | 378 |
| Freddie Mac, Series 2014-HQ1, Class M2, (1-month USD-LIBOR + 2.50%) 3.716% 20245,6 | 5,949 | 6,035 |
| Freddie Mac, Series K056, Class A1, multifamily 2.20% 20255 | 22,902 | 22,613 |
| Freddie Mac, Series 2015-HQ2, Class M1, (1-month USD-LIBOR + 1.10%) 2.316% 20255,6 | 635 | 637 |
| Freddie Mac, Series K044, Class A2, multifamily 2.811% 20255 | 13,505 | 13,697 |
| Freddie Mac, Series 2015-HQ2, Class M2, (1-month USD-LIBOR + 1.95%) 3.166% 20255,6 | 11,200 | 11,416 |
| Freddie Mac, Series K050, Class A2, multifamily 3.334% 20255,6 | 24,000 | 25,157 |
| Freddie Mac, Series K047, Class A2, multifamily 3.329% 20255 | 20,000 | 20,966 |
| Freddie Mac, Series 2015-DN1, Class M2, (1-month USD-LIBOR + 2.40%) 3.616% 20255,6 | 3,827 | 3,844 |
| Freddie Mac, Series K062, Class A2, multifamily, 3.413% 20265 | 80,345 | 84,423 |
| Freddie Mac, Series K064, Class A2, multifamily 3.224% 20275 | 21,050 | 21,683 |
| Freddie Mac, Series T-041, Class 3A, 5.662% 20325,6 | 1,470 | 1,602 |
| Freddie Mac, Series 3156, Class PO, principal only, 0% 20365 | 2,610 | 2,277 |
| Freddie Mac, Series 3146, Class PO, principal only, 0% 20365 | 1,832 | 1,591 |
| Freddie Mac, Series 3318, Class JT, 5.50% 20375 | 3,123 | 3,373 |
| Freddie Mac, Series K063, Class A2, multifamily 3.43% 20505 | 17,500 | 18,412 |
American Balanced Fund — Page 25 of 33
unaudited
Bonds, notes & other debt instruments
Mortgage-backed obligations (continued) | Principal?amount
(000) | Value
(000) |
| Government National Mortgage Assn. 10.00% 20215 | $55 | $59 |
| Government National Mortgage Assn. 6.00% 20385 | 7,008 | 7,921 |
| Government National Mortgage Assn. 6.50% 20385 | 3,622 | 4,125 |
| Government National Mortgage Assn. 4.00% 20395 | 1,596 | 1,680 |
| Government National Mortgage Assn. 4.00% 20395 | 1,429 | 1,504 |
| Government National Mortgage Assn. 4.00% 20395 | 869 | 915 |
| Government National Mortgage Assn. 4.00% 20405 | 12,239 | 13,026 |
| Government National Mortgage Assn. 4.00% 20405 | 8,520 | 9,022 |
| Government National Mortgage Assn. 4.00% 20405 | 2,706 | 2,881 |
| Government National Mortgage Assn. 4.00% 20405 | 2,422 | 2,551 |
| Government National Mortgage Assn. 4.00% 20405 | 2,245 | 2,383 |
| Government National Mortgage Assn. 4.00% 20405 | 1,267 | 1,338 |
| Government National Mortgage Assn. 4.00% 20405 | 1,255 | 1,324 |
| Government National Mortgage Assn. 4.00% 20415 | 17,963 | 18,968 |
| Government National Mortgage Assn. 4.00% 20415 | 2,486 | 2,626 |
| Government National Mortgage Assn. 4.00% 20415 | 1,336 | 1,411 |
| Government National Mortgage Assn. 4.00% 20415 | 284 | 300 |
| Government National Mortgage Assn. 4.50% 20435 | 2,321 | 2,468 |
| Government National Mortgage Assn. 4.00% 20445 | 172 | 182 |
| Government National Mortgage Assn. 4.50% 20455 | 66,554 | 70,785 |
| Government National Mortgage Assn. 4.50% 20455 | 40,728 | 43,317 |
| Government National Mortgage Assn. 4.50% 20455 | 29,869 | 31,768 |
| Government National Mortgage Assn. 4.50% 20455 | 28,440 | 30,248 |
| Government National Mortgage Assn. 4.50% 20455 | 17,674 | 18,798 |
| Government National Mortgage Assn. 4.50% 20455 | 1,628 | 1,731 |
| Government National Mortgage Assn. 4.50% 20465 | 6,843 | 7,278 |
| Government National Mortgage Assn. 4.50% 20465 | 1,831 | 1,947 |
| Government National Mortgage Assn. 4.00% 20475,8 | 342,500 | 360,401 |
| Government National Mortgage Assn. 4.00% 20475 | 238,770 | 252,249 |
| Government National Mortgage Assn. 4.00% 20475 | 147,421 | 155,694 |
| Government National Mortgage Assn. 4.00% 20475 | 53,365 | 56,326 |
| Government National Mortgage Assn. 4.50% 20475 | 94,717 | 100,785 |
| Government National Mortgage Assn. 4.50% 20475 | 37,000 | 39,397 |
| Government National Mortgage Assn. 4.50% 20475 | 9,572 | 10,180 |
| Government National Mortgage Assn. 5.081% 20615 | 974 | 1,009 |
| Greenwich Capital Commercial Funding Corp., Series 2007-GG11, Class A1A, 5.704% 20495 | 2,986 | 2,985 |
| GS Mortgage Securities Corp. II, Series 2015-GS1, Class AAB, 3.553% 20485 | 5,000 | 5,219 |
| J.P. Morgan Chase Commercial Mortgage Securities Trust, Series 2006-LDP9, Class AM, 5.372% 20475 | 9,361 | 9,354 |
| J.P. Morgan Chase Commercial Mortgage Securities Trust, Series 2007-C1, Class A4, 5.716% 20515 | 13,720 | 13,798 |
| L.A. Arena Funding, LLC, Series 1, Class A, 7.656% 20264,5 | 6,783 | 7,140 |
| LB-UBS Commercial Mortgage Trust, Series 2007-C6, Class AM, 6.114% 20405,6 | 19,152 | 19,177 |
| LB-UBS Commercial Mortgage Trust, Series 2007-C7, Class AM, 6.414% 20455,6 | 11,575 | 11,727 |
| ML-CFC Commercial Mortgage Trust, Series 2007-8, Class A3, 6.076% 20495,6 | 580 | 579 |
| Morgan Stanley Bank of America Merrill Lynch Trust, Series 2015-C27, Class ASB, 3.557% 20475 | 4,000 | 4,191 |
| Morgan Stanley Bank of America Merrill Lynch Trust, Series 2015-C22, Class ASB, 3.04% 20485 | 3,380 | 3,457 |
| Morgan Stanley Capital I Trust, Series 2014-CPT, Class A, 3.35% 20294,5 | 14,570 | 15,127 |
Mortgage Repurchase Agreement Financing Trust, Series 2017-1, Class A1,
(1-month USD-LIBOR + 0.85%) 1.967% 20194,5,6 | 41,740 | 41,760 |
| National Australia Bank 1.25% 20184,5 | 14,120 | 14,083 |
| National Australia Bank 2.00% 20194,5 | 4,925 | 4,935 |
| Nationstar HECM Loan Trust, Series 2016-3A, Class A, 2.013% 20263,4,5 | 3,319 | 3,354 |
| Nationstar HECM Loan Trust, Series 2016-2A, Class A, 2.2394% 20263,4,5,6 | 3,763 | 3,805 |
| Nationstar HECM Loan Trust, Series 2017-1A, Class A, 1.968 % 20273,4,5 | 4,001 | 4,001 |
| Nationstar HECM Loan Trust, Series 2017-1A, Class M1, 2.9419% 20274,5 | 3,155 | 3,154 |
| Royal Bank of Canada 2.00% 20195 | 3,550 | 3,565 |
American Balanced Fund — Page 26 of 33
unaudited
Bonds, notes & other debt instruments
Mortgage-backed obligations (continued) | Principal?amount
(000) | Value
(000) |
| Royal Bank of Canada 2.20% 20195 | $37,700 | $37,854 |
| Royal Bank of Canada 1.875% 20205 | 18,000 | 17,912 |
| Royal Bank of Canada 2.10% 20205 | 5,000 | 4,994 |
| Seasoned Credit Risk Transfer, Series 2017-1, Class HA, 2.00% 20565 | 80,501 | 80,644 |
| Seasoned Credit Risk Transfer, Series 2017-1, Class MA, 3.00% 20565 | 21,003 | 21,283 |
| Station Place Securitization Trust, Series 2017-1, Class A, (1-month USD-LIBOR + 0.90%) 2.116% 20494,5,6 | 5,188 | 5,190 |
| Swedbank AB 1.375% 20184,5 | 925 | 924 |
| Towd Point Mortgage Trust, Series 2016-4, Class A1, 2.25% 20564,5,6 | 7,123 | 7,110 |
| Towd Point Mortgage Trust, Series 2017-1, Class A1, 2.75% 20564,5,6 | 86,963 | 87,845 |
| Wachovia Bank Commercial Mortgage Trust, Series 2007-C33, Class AM, 6.174% 20515,6 | 17,000 | 16,984 |
| Wells Fargo Mortgage-backed Securities Trust, Series 2005-AR10, Class IIA6, 3.116% 20355,6 | 5,198 | 5,504 |
| Westpac Banking Corp. 1.25% 20174,5 | 800 | 800 |
| Westpac Banking Corp. 1.375% 20184,5 | 3,325 | 3,317 |
| Westpac Banking Corp. 1.85% 20184,5 | 8,300 | 8,346 |
| Westpac Banking Corp. 2.00% 20194,5 | 28,300 | 28,387 |
| Westpac Banking Corp. 2.25% 20204,5 | 12,500 | 12,535 |
| Westpac Banking Corp. 2.00% 20214,5 | 10,825 | 10,808 |
| | | 8,594,783 |
| Asset-backed obligations1.49% | | |
| Aesop Funding LLC, Series 2013-2A, Class A, 2.97% 20204,5 | 16,535 | 16,709 |
| Aesop Funding LLC, Series 2015-1, Class A, 2.50% 20214,5 | 29,000 | 28,890 |
| Aesop Funding LLC, Series 2014-2A, Class A, 2.50% 20214,5 | 14,000 | 13,973 |
| Aesop Funding LLC, Series 2015-2A, Class A, 2.63% 20214,5 | 1,150 | 1,144 |
| American Express Credit Account Master Trust, Series 2014-4, Class A, 1.43% 20205 | 13,510 | 13,513 |
| AmeriCredit Automobile Receivables Trust, Series 2014-3, Class A3, 1.15% 20195 | 650 | 650 |
| AmeriCredit Automobile Receivables Trust, Series 2015-1, Class A3, 1.26% 20195 | 3,482 | 3,481 |
| AmeriCredit Automobile Receivables Trust, Series 2014-4, Class A3, 1.27% 20195 | 2,102 | 2,101 |
| AmeriCredit Automobile Receivables Trust, Series 2016-4, Class A2A, 1.34% 20205 | 4,615 | 4,610 |
| AmeriCredit Automobile Receivables Trust, Series 2016-3, Class B, 1.80% 20215 | 1,020 | 1,014 |
| AmeriCredit Automobile Receivables Trust, Series 2016-1, Class C, 2.89% 20225 | 4,875 | 4,939 |
Angel Oak Capital Advisors, LLC, Series 2013-9A, Class A1R, CLO, (3-month USD-LIBOR + 1.01%)
2.166% 20254,5,6 | 20,175 | 20,175 |
| Avant Loans Funding Trust, Series 2016-C, Class A, 2.96% 20194,5 | 745 | 745 |
| Avant Loans Funding Trust, Series 2016-B, Class A, 3.92% 20194,5 | 75 | 75 |
| Avant Loans Funding Trust, Series 2017-A, Class A, 2.41% 20214,5 | 6,350 | 6,354 |
| Bank of the West Auto Trust, Series 2014-1, Class A3, 1.09% 20194,5 | 783 | 783 |
| BlueMountain CLO Ltd., Series 2014-2A, Class AR, CLO, (3-month USD LIBOR + 0.93%) 2.225% 20264,5,6 | 36,645 | 36,654 |
| BlueMountain CLO Ltd., Series 2013-4A, Class AR, (3-month USD-LIBOR + 1.01%) 2.160% 20254,5,6 | 44,315 | 44,318 |
| Cabela’s Master Credit Card Trust, Series 2016-1, Class A1, 1.78% 20225 | 19,600 | 19,577 |
| Capital One Multi-Asset Execution Trust, Series 2014-A5, Class A, 1.48% 20205 | 15,110 | 15,115 |
| Capital One Multi-Asset Execution Trust, Series 2017-A1, Class A1, 2.00% 20235 | 40,000 | 40,185 |
| CarMaxAuto Owner Trust, Series 2014-4, Class A3, 1.25% 20195 | 5,565 | 5,561 |
| Chase Issuance Trust, Series 2016-A7, Class A, 1.06% 20195 | 55,000 | 54,965 |
| Chase Issuance Trust, Series 2016-A6, Class A6, 1.10% 20205 | 98,630 | 98,489 |
| Chrysler Capital Auto Receivables Trust, Series 2015-AA, Class A3, 1.22% 20194,5 | 5,347 | 5,345 |
| Chrysler Capital Auto Receivables Trust, Series 2014-AA, Class A4, 1.31% 20194,5 | 1,007 | 1,007 |
| Chrysler Capital Auto Receivables Trust, Series 2015-BA, Class A3, 1.91% 20204,5 | 4,645 | 4,659 |
| Chrysler Capital Auto Receivables Trust, Series 2015-AA, Class B, 2.07% 20214,5 | 2,500 | 2,505 |
| Citi Held For Issuance, Series 2015-PM3, Class A, 2.56% 20224,5 | 135 | 135 |
| Citi Held For Issuance, Series 2016-PM1, Class A, 4.65% 20254,5 | 1,011 | 1,022 |
Citibank Credit Card Issuance Trust, Series 2008-A2, Class A2, (1-month USD-LIBOR + 1.15%)
2.366% 20205,6 | 8,000 | 8,050 |
| Citibank Credit Card Issuance Trust, Series 2014-A6, Class A6, 2.15% 20215 | 16,725 | 16,868 |
| CLI Funding V LLC, Series 2013-2A, Class Note, 3.22% 20284,5 | 550 | 546 |
American Balanced Fund — Page 27 of 33
unaudited
Bonds, notes & other debt instruments
Asset-backed obligations (continued) | Principal?amount
(000) | Value
(000) |
| CLI Funding V LLC, Series 2014-1A, Class A, 3.29% 20294,5 | $3,846 | $3,831 |
| CLI Funding V LLC, Series 2014-2A, Class A, 3.38% 20294,5 | 4,915 | 4,915 |
| CPS Auto Receivables Trust, Series 2015-A, Class A, 1.53% 20194,5 | 602 | 602 |
| CPS Auto Receivables Trust, Series 2015-C, Class A, 1.77% 20194,5 | 1,067 | 1,068 |
| CPS Auto Receivables Trust, Series 2016-B, Class A, 2.07% 20194,5 | 942 | 944 |
| CPS Auto Receivables Trust, Series 2017-B, Class A, 1.75% 20204,5 | 23,074 | 23,060 |
| CPS Auto Receivables Trust, Series 2015-A, Class B, 2.79% 20214,5 | 1,250 | 1,260 |
| CPS Auto Receivables Trust, Series 2016-A, Class C, 3.80% 20214,5 | 10,350 | 10,522 |
| CPS Auto Receivables Trust, Series 2015-A, Class C, 4.00% 20214,5 | 960 | 980 |
| CWABS, Inc., Series 2004-BC1, Class M1, (1-month USD-LIBOR + 0.50%) 1.966% 20345,6 | 2,014 | 1,951 |
| Discover Card Execution Note Trust, Series 2014-A4, Class A4, 2.12% 20215 | 7,595 | 7,654 |
| Drive Auto Receivables Trust, Series 2017-BA, Class A1, 1.20% 20184,5 | 12,513 | 12,513 |
| Drive Auto Receivables Trust, Series 2017-AA, Class A2A, 1.48% 20194,5 | 6,077 | 6,075 |
| Drive Auto Receivables Trust, Series 2015-DA, Class B, 2.59% 20194,5 | 516 | 516 |
| Drive Auto Receivables Trust, Series 2017-BA, Class B, 2.20% 20204,5 | 3,800 | 3,806 |
| Drive Auto Receivables Trust, Series 2015-BA, Class C, 2.76% 20214,5 | 16,029 | 16,120 |
| Drive Auto Receivables Trust, Series 2015-CA, Class C, 3.01% 20214,5 | 6,692 | 6,744 |
| Drive Auto Receivables Trust, Series 2015-AA, Class C, 3.06% 20214,5 | 8,003 | 8,062 |
| Drive Auto Receivables Trust, Series 2015-DA, Class C, 3.38% 20214,5 | 20,790 | 20,994 |
| Drive Auto Receivables Trust, Series 2016-AA, Class C, 3.91% 20214,5 | 29,000 | 29,454 |
| Drive Auto Receivables Trust, Series 2017-AA, Class C, 2.98% 20224,5 | 4,665 | 4,701 |
| Drivetime Auto Owner Trust, Series 2016-2A, Class A, 1.73% 20194,5 | 879 | 879 |
| Drivetime Auto Owner Trust, Series 2016-1A, Class C, 3.54% 20214,5 | 2,730 | 2,753 |
| Enterprise Fleet Financing LLC, Series 2014-1, Class A3, 1.38% 20194,5 | 2,937 | 2,937 |
| Enterprise Fleet Financing LLC, Series 2014-2, Class A2, 1.05% 20204,5 | 1,100 | 1,099 |
| Enterprise Fleet Financing LLC, Series 2015-1, Class A2, 1.30% 20204,5 | 5,320 | 5,317 |
| Enterprise Fleet Financing LLC, Series 2016-2, Class A2, 1.74% 20224,5 | 7,290 | 7,284 |
| Enterprise Fleet Financing LLC, Series 2017-1, Class A2, 2.13% 20224,5 | 7,060 | 7,074 |
| Enterprise Fleet Financing LLC, Series 2017-1, Class A3, 2.60% 20224,5 | 7,345 | 7,381 |
| Fifth Third Auto Trust, Series 2014-3, Class A3, 0.96% 20195 | 1,645 | 1,643 |
| First Investors Auto Owner Trust, Series 2014-2A, Class C, 2.70% 20204,5 | 3,600 | 3,618 |
| First Investors Auto Owner Trust, Series 2014-1A, Class C, 2.74% 20204,5 | 2,250 | 2,263 |
| Ford Credit Auto Owner Trust, Series 2014-1A, 2.26% 20254,5 | 4,250 | 4,291 |
| Ford Credit Auto Owner Trust, Series 2015-1, Class A, 2.12% 20264,5 | 19,800 | 19,889 |
| Ford Credit Auto Owner Trust, Series 2014-2A, 2.31% 20264,5 | 26,380 | 26,649 |
| Ford Credit Auto Owner Trust, Series 2016-2, Class A, 2.03% 20274,5 | 50,000 | 49,676 |
| Ford Credit Auto Owner Trust, Series 2016-1, Class A, 2.31% 20274,5 | 35,370 | 35,584 |
| Ford Credit Auto Owner Trust, Series 2015-2, Class A, 2.44% 20274,5 | 33,450 | 33,830 |
| Ford Credit Auto Owner Trust, Series 2017-1, Class A, 2.62% 20284,5 | 122,000 | 123,590 |
| Ford Credit Floorplan Master Owner Trust, Series 2015-1, Class A1, 1.42% 20205 | 18,860 | 18,854 |
| Ford Credit Floorplan Master Owner Trust, Series 2016-3, Class A1, 1.55% 20215 | 22,500 | 22,400 |
| Ford Credit Floorplan Master Owner Trust, Series 2015-2, Class A1, 1.98% 20225 | 14,390 | 14,415 |
| Global SC Finance II SRL, Series 2017-1A, Class A, 3.85% 20374,5 | 34,035 | 34,454 |
| Hertz Fleet Lease Funding LP, Series 2014-1A, (1-month USD-LIBOR + 0.40%) 1.517% 20284,5,6 | 2,014 | 2,013 |
| Hertz Vehicle Financing LLC, Rental Car Asset-backed Notes, Series 2013-1A, Class A2, 1.83% 20194,5 | 23,840 | 23,769 |
| Hertz Vehicle Financing LLC, Rental Car Asset-backed Notes, Series 2015-3A, Class A, 2.67% 20214,5 | 5,505 | 5,479 |
| Hertz Vehicle Financing LLC, Rental Car Asset-backed Notes, Series 2015-1, Class A, 2.73% 20214,5 | 19,113 | 19,017 |
| Hertz Vehicle Financing LLC, Rental Car Asset-backed Notes, Series 2015-1, Class A, 3.52% 20214,5 | 1,263 | 1,267 |
| Honda Auto Receivables Owner Trust, Series 2014-3, Class A3, 0.88% 20185 | 1,231 | 1,230 |
Madison Park Funding Ltd., CLO, Series 2014-13A, Class AR, (3-month USD-LIBOR + 1.11%)
2.216% 20254,5,6 | 41,600 | 41,600 |
| MarketPlace Loan Trust, Series 2015-AV1, Class A, 4.00% 20213,4,5 | 88 | 88 |
| Palmer Square Ltd., Series 2013-1, Class A1R, (3-month USD-LIBOR + 0.97%) 2.152% 20254,5,6 | 16,845 | 16,863 |
| RAMP Trust, Series 2003-RS11, Class AI7, 4.828% 20335 | 332 | 338 |
| Santander Drive Auto Receivables Trust, Series 2013-3, Class C, 1.81% 20195 | 1,485 | 1,485 |
American Balanced Fund — Page 28 of 33
unaudited
Bonds, notes & other debt instruments
Asset-backed obligations (continued) | Principal?amount
(000) | Value
(000) |
| Santander Drive Auto Receivables Trust, Series 2013-2, Class C, 1.95% 20195 | $561 | $561 |
| Santander Drive Auto Receivables Trust, Series 2013-5, Class C, 2.25% 20195 | 2,434 | 2,438 |
| Santander Drive Auto Receivables Trust, Series 2014-2, Class C, 2.33% 20195 | 3,481 | 3,491 |
| Santander Drive Auto Receivables Trust, Series 2013-A, Class C, 3.12% 20194,5 | 316 | 317 |
| Santander Drive Auto Receivables Trust, Series 2017-1, Class A2, 1.49% 20205 | 2,610 | 2,608 |
| Santander Drive Auto Receivables Trust, Series 2017-1, Class A3, 1.77% 20205 | 2,815 | 2,817 |
| Santander Drive Auto Receivables Trust, Series 2015-5, Class B, 1.96% 20205 | 4,500 | 4,507 |
| Santander Drive Auto Receivables Trust, Series 2014-1, Class C, 2.36% 20205 | 5,286 | 5,298 |
| Santander Drive Auto Receivables Trust, Series 2013-4, Class C, 3.25% 20205 | 289 | 290 |
| Santander Drive Auto Receivables Trust, Series 2015-2, Class C, 2.44% 20215 | 15,310 | 15,385 |
| Santander Drive Auto Receivables Trust, Series 2016-2, Class C, 2.66% 20215 | 5,555 | 5,597 |
| Santander Drive Auto Receivables Trust, Series 2015-5, Class C, 2.74% 20215 | 17,985 | 18,072 |
| Santander Drive Auto Receivables Trust, Series 2015-3, Class C, 2.74% 20215 | 125 | 126 |
| Santander Drive Auto Receivables Trust, Series 2015-4, Class C, 2.97% 20215 | 10,500 | 10,632 |
| Santander Drive Auto Receivables Trust, Series 2016-1, Class C, 3.09% 20225 | 3,000 | 3,043 |
| SMB Private Education Loan Trust, Series 2015-A, Class A2A, 2.49% 20274,5 | 2,100 | 2,110 |
Social Professional Loan Program LLC, Series 2015-C, Class A1,
(1-month USD-LIBOR + 1.05%) 2.266% 20354,5,6 | 4,375 | 4,413 |
| Social Professional Loan Program LLC, Series 2015-D, Class A2, 2.72% 20364,5 | 17,344 | 17,530 |
| Sound Point CLO Ltd, Series 2013-2A, Class A1R, CLO, (3-month USD LIBOR + 0.99%) 2.148% 20254,5,6 | 29,745 | 29,747 |
| South Carolina Student Loan Corp., Series 2014-1, Class A1, (1-month USD-LIBOR + 0.75%) 1.801% 20305,6 | 4,550 | 4,546 |
| South Carolina Student Loan Corp., Series 2014-1, Class A2, (1-month USD-LIBOR + 1.00%) 2.051% 20335,6 | 12,240 | 12,068 |
| Symphony CLO Ltd, Series 2013-12A, Class AR, CLO, (3-month USD-LIBOR + 1.03%) 2.180% 20254,5,6 | 76,825 | 76,832 |
| TAL Advantage V LLC, Series 2013-1A, Class A, 2.83% 20384,5 | 2,541 | 2,504 |
| TAL Advantage V LLC, Series 2013-2A, Class A, 3.55% 20384,5 | 5,765 | 5,763 |
| TAL Advantage V LLC, Series 2014-3A, Class A, 3.27% 20394,5 | 645 | 643 |
| TAL Advantage V LLC, Series 2014-2A, Class A2, 3.33% 20394,5 | 14,460 | 14,473 |
| TAL Advantage V LLC, Series 2014-1A, Class A, 3.51% 20394,5 | 7,100 | 7,097 |
| TAL Advantage V LLC, Series 2017-1A, Class A, 4.50% 20424,5 | 14,322 | 14,906 |
| Triton Container Finance LLC, Series 2017-1A, Class A, 3.52% 20424,5 | 38,780 | 38,720 |
| Utility Debt Securitization Auth., Series 2013-T, 2.042% 20215 | 3,322 | 3,320 |
| Utility Debt Securitization Auth., Series 2013-T, 3.435% 20255 | 2,625 | 2,725 |
| Verizon Owner Trust, Series 2016-1A, Class A, 1.42% 20214,5 | 18,945 | 18,875 |
| Verizon Owner Trust, Series 2016-2A, Class A, 1.68% 20214,5 | 16,300 | 16,263 |
| Verizon Owner Trust, Series 2017-2A, Class A, 1.92% 20214,5 | 44,210 | 44,203 |
| Verizon Owner Trust, Series 2017-1A, Class A, 2.06% 20214,5 | 72,860 | 73,161 |
| Volkswagen Auto Loan Enhanced Trust, Series 2014-2, Class A3, 0.95% 20195 | 9,463 | 9,458 |
| Voya CLO Ltd., Series 2014-4A, Class A1R, (3-month USD-LIBOR + 0.95%) 2.224% 20264,5,6 | 14,540 | 14,544 |
| Westlake Automobile Receivables Trust, Series 2017-1A, Class A2, 1.78% 20204,5 | 11,375 | 11,382 |
| Westlake Automobile Receivables Trust, Series 2016-1A, Class C, 3.29% 20214,5 | 4,500 | 4,546 |
World Financial Network Credit Card Master Note Trust, Series 2015-A, Class A,
(1-month USD-LIBOR + 0.48%) 1.639% 20225,6 | 2,625 | 2,632 |
| World Omni Auto Receivables Trust, Series 2014-B, Class A3, 1.14% 20205 | 3,889 | 3,882 |
| | | 1,690,483 |
| Bonds & notes of governments & government agencies outside the U.S.0.34% | | |
| CPPIB Capital Inc. 1.25% 20194 | 23,300 | 23,085 |
| CPPIB Capital Inc. 2.25% 20224 | 25,714 | 25,825 |
| European Investment Bank 2.25% 2022 | 37,550 | 37,762 |
| FMS Wertmanagement 1.625% 2018 | 5,000 | 5,013 |
| Israel (State of) 3.15% 2023 | 35,000 | 36,092 |
| Landwirtschaftliche Rentenbank 1.75% 2019 | 8,880 | 8,907 |
| Manitoba (Province of) 3.05% 2024 | 13,500 | 13,890 |
| Ontario (Province of) 3.20% 2024 | 10,000 | 10,389 |
| Quebec (Province of) 2.375% 2022 | 51,867 | 52,141 |
American Balanced Fund — Page 29 of 33
unaudited
Bonds, notes & other debt instruments
Bonds & notes of governments & government agencies outside the U.S. (continued) | Principal?amount
(000) | Value
(000) |
| Quebec (Province of) 2.75% 2027 | $26,000 | $25,767 |
| Spain (Kingdom of) 4.00% 20184 | 54,950 | 55,785 |
| Swedish Export Credit Corp. 2.875% 20234 | 3,000 | 2,995 |
| United Mexican States 4.125% 2026 | 26,650 | 27,769 |
| United Mexican States 4.15% 2027 | 41,977 | 43,520 |
| United Mexican States 5.55% 2045 | 15,000 | 16,856 |
| | | 385,796 |
| Federal agency bonds & notes0.26% | | |
| Fannie Mae 2.00% 2022 | 30,000 | 30,152 |
| Fannie Mae 2.125% 2026 | 45,510 | 44,503 |
| Fannie Mae 6.25% 2029 | 4,000 | 5,434 |
| Federal Home Loan Bank 0.875% 2018 | 77,140 | 76,828 |
| Federal Home Loan Bank 1.875% 2020 | 25,660 | 25,860 |
| Federal Home Loan Bank 3.375% 2023 | 16,840 | 18,063 |
| Federal Home Loan Bank 5.50% 2036 | 600 | 814 |
| Freddie Mac 0.75% 2018 | 38,120 | 37,967 |
| Freddie Mac 0.75% 2018 | 22,612 | 22,554 |
| Private Export Funding Corp. 3.55% 2024 | 25,897 | 27,882 |
| | | 290,057 |
Municipals0.11%
California0.03% | | |
| Industry Public Facs. Auth., Tax Allocation Rev. Ref. Bonds (Civic - Recreational-Industrial Redev. Project No. 1), Series 2015-A, Assured Guaranty Municipal insured, 3.821% 2022 | 11,640 | 12,151 |
Los Angeles Community College Dist. (County of Los Angeles), G.O. Build America
Bonds, 2008 Election, Series 2010-E, 6.60% 2042 | 15,000 | 21,900 |
| Veterans G.O. Ref. Bonds, Series 2015-CM, AMT, 2.45% 2031 | 2,080 | 2,095 |
| | | 36,146 |
| New Jersey0.03% | | |
Econ. Dev. Auth., School Facs. Construction Rev. Ref. Bonds, Series 2013-I,
(SIFMA Municipal Swap Index + 1.60%) 2.51% 20286 | 5,000 | 4,681 |
Econ. Dev. Auth., School Facs. Construction Rev. Ref. Bonds, Series 2015-YY,
4.447% 2020 | 12,000 | 12,324 |
| Transportation Trust Fund Auth., Transportation System Rev. Ref. Bonds, Series 2013-B, 1.758% 2018 | 15,250 | 15,101 |
| | | 32,106 |
| Michigan0.02% | | |
| City of Detroit, Sewage Disposal System Rev. Ref. Bonds, Series 2006-D, Assured Guaranty Municipal insured, (3-month USD-LIBOR + 0.60%) 1.369% 20326 | 5,000 | 4,347 |
| Fin. Auth., Local Government Loan Program Rev. Bonds (City of Detroit Fin. Recovery Income Tax Local Project), Series 2014-F-2, 4.60% 2022 | 9,000 | 9,466 |
| Fin. Auth., Student Loan Rev. Ref. Bonds, Series 2015-B-1, (1-month USD-LIBOR + 0.75%) 1.972% 20305,6 | 8,015 | 8,013 |
| | | 21,826 |
| Florida0.02% | | |
| Hurricane Catastrophe Fund Fin. Corp., Rev. Bonds, Series 2013-A, 2.995% 2020 | 4,000 | 4,089 |
| State Board of Administration Fin. Corp., Rev. Bonds, Series 2016-A, 2.638% 2021 | 16,500 | 16,568 |
| | | 20,657 |
| Puerto Rico0.01% | | |
| Electric Power Auth., Power Rev. Ref. Bonds, Series UU, Assured Guaranty Municipal insured, (3-month USD-LIBOR x 0.67 + 0.52%) 1.289% 20296 | 10,200 | 8,160 |
American Balanced Fund — Page 30 of 33
unaudited
Bonds, notes & other debt instruments
Municipals (continued)
South Dakota0.00% | Principal?amount
(000) | Value
(000) |
| Housing Dev. Auth., Homeownership Mortgage Bonds, Series 2014-F, 4.00% 2034 | $1,075 | $1,110 |
| Housing Dev. Auth., Homeownership Mortgage Bonds, Series 2013-E, AMT, 4.00% 2044 | 515 | 539 |
| Housing Dev. Auth., Homeownership Mortgage Bonds, Series 2015-D, 4.00% 2045 | 3,240 | 3,474 |
| | | 5,123 |
| Connecticut0.00% | | |
| Housing Fin. Auth., Housing Mortgage Fin. Program Bonds, Series 2014-A-1, 4.00% 2044 | 1,480 | 1,582 |
| Maine0.00% | | |
| Housing Auth., Mortgage Purchase Rev. Ref. Bonds, Series 2014-A-1, AMT, 3.25% 2043 | 610 | 630 |
| Iowa0.00% | | |
Fin. Auth., Single Family Mortgage Bonds (Mortgage-backed Securities Program),
Series 2013-1, 2.15% 20435 | 570 | 553 |
| Texas0.00% | | |
| Board of Regents of the Texas A&M University System, Rev. Fncg. System Bonds, Taxable Series 2016-B, 2.766% 2026 | 300 | 297 |
| | | 127,080 |
| Miscellaneous0.06% | | |
| Other bonds & notes in initial period of acquisition | | 68,223 |
| Total bonds, notes & other debt instruments (cost: $37,642,765,000) | | 38,047,948 |
| Short-term securities8.15% | | |
| Apple Inc. 0.88%–1.17% due 7/11/2017–9/26/20174 | 170,200 | 169,946 |
| CAFCO, LLC 1.17% due 8/3/20174 | 50,000 | 49,944 |
| Chariot Funding, LLC 1.00% due 7/12/20174 | 100,000 | 99,960 |
| Ciesco LLC 1.37% due 12/12/20174 | 75,000 | 74,513 |
| Citibank, N.A. 1.10% due 8/7/2017 | 50,000 | 49,995 |
| Coca-Cola Co. 1.00% due 7/17/20174 | 25,000 | 24,987 |
| Colgate-Palmolive Co. 1.09% due 7/11/20174 | 55,000 | 54,982 |
| ExxonMobil Corp. 1.05%–1.14% due 7/17/2017–9/12/2017 | 193,200 | 192,877 |
| Federal Farm Credit Banks 0.61%–1.23% due 7/6/2017–4/30/2018 | 164,000 | 163,070 |
| Federal Home Loan Bank 0.64%–1.05% due 7/3/2017–10/10/2017 | 5,316,960 | 5,310,535 |
| Freddie Mac 0.80%–0.99% due 8/2/2017–10/11/2017 | 650,000 | 648,959 |
| John Deere Capital Corp. 1.14% due 8/2/20174 | 50,000 | 49,948 |
| Johnson & Johnson 1.08%–1.12% due 9/6/2017–9/19/20174 | 265,200 | 264,560 |
| Microsoft Corp. 0.89% due 7/7/20174 | 50,000 | 49,989 |
| National Rural Utilities Cooperative Finance Corp. 1.12% due 7/19/2017 | 39,800 | 39,776 |
| Paccar Financial Corp. 1.08% due 7/18/2017 | 30,000 | 29,983 |
| Pfizer Inc. 1.03%–1.17% due 7/24/2017–9/18/20174 | 75,000 | 74,901 |
| Qualcomm Inc. 0.90% due 7/6/20174 | 75,000 | 74,986 |
| U.S. Bank, N.A. 1.21% due 10/27/2017 | 100,000 | 100,008 |
| U.S. Treasury Bills 0.59%–1.08% due 7/6/2017–12/21/2017 | 1,542,900 | 1,539,243 |
American Balanced Fund — Page 31 of 33
unaudited
| Short-term securities | Principal?amount
(000) | Value
(000) |
| Wal-Mart Stores, Inc. 0.87%–1.10% due 7/5/2017–7/17/20174 | $150,000 | $149,951 |
| Walt Disney Co. 0.92% due 8/4/20174 | 25,000 | 24,973 |
| Total short-term securities (cost: $9,237,740,000) | | 9,238,086 |
| Total investment securities 101.97% (cost: $91,126,799,000) | | 115,606,853 |
| Other assets less liabilities (1.97)% | | (2,231,869) |
| Net assets 100.00% | | $113,374,984 |
As permitted by U.S. Securities and Exchange Commission regulations, “Miscellaneous” securities include holdings in their first year of acquisition that have not previously been publicly disclosed.
The following footnotes apply to either the individual securities noted or one or more of the securities aggregated and listed as a single line item.
| 1 | Security did not produce income during the last 12 months. |
| 2 | Represents an affiliated company as defined under the Investment Company Act of 1940. |
| 3 | Valued under fair value procedures adopted by authority of the board of trustees. The total value of all such securities was $122,709,000, which represented .11% of the net assets of the fund. |
| 4 | Acquired in a transaction exempt from registration under Rule 144A or Section 4(2) of the Securities Act of 1933. May be resold in the U.S. in transactions exempt from registration, normally to qualified institutional buyers. The total value of all such securities was $5,557,884,000, which represented 4.90% of the net assets of the fund. |
| 5 | Principal payments may be made periodically. Therefore, the effective maturity date may be earlier than the stated maturity date. |
| 6 | Coupon rate may change periodically. |
| 7 | Index-linked bond whose principal amount moves with a government price index. |
| 8 | Purchased on a TBA basis. |
| Key to abbreviations | | |
| ADR = American Depositary Receipts | | |
| AMT = Alternative Minimum Tax | | |
| Auth. = Authority | | |
| CLO = Collateralized Loan Obligations | | |
| Dev. = Development | | |
| Dist. = District | | |
| Econ. = Economic | | |
| Facs. = Facilities | | |
| Fin. = Finance | | |
| Fncg. = Financing | | |
| G.O. = General Obligation | | |
| LIBOR = London Interbank Offered Rate | | |
| Redev. = Redevelopment | | |
| Ref. = Refunding | | |
| Rev. = Revenue | | |
| SIFMA = Securities Industry and Financial Markets Association | | |
| TBA = To-be-announced | | |
American Balanced Fund — Page 32 of 33
unaudited
Additional financial disclosures are included in the fund’s current shareholder report and should be read in conjunction with this report.
Investments are not FDIC-insured, nor are they deposits of or guaranteed by a bank or any other entity, so they may lose value.
Investors should carefully consider investment objectives, risks, charges and expenses. This and other important information is contained in the fund prospectus and summary prospectus, which can be obtained from your financial professional and should be read carefully before investing. You may also call American Funds Service Company (AFS) at (800) 421-4225 or visit the American Funds website at americanfunds.com. Securities offered through American Funds Distributors, Inc.
| MFGEFPX-011-0817O-S60642 | American Balanced Fund — Page 33 of 33 |
ITEM 7 – Disclosure of Proxy Voting Policies and Procedures for Closed-End Management Investment Companies
Not applicable to this Registrant, insofar as the Registrant is not a closed-end management investment company.
ITEM 8 – Portfolio Managers of Closed-End Management Investment Companies
Not applicable to this Registrant, insofar as the Registrant is not a closed-end management investment company.
ITEM 9 – Purchases of Equity Securities by Closed-End Management Investment Company and Affiliated Purchasers
Not applicable to this Registrant, insofar as the Registrant is not a closed-end management investment company.
ITEM 10 – Submission of Matters to a Vote of Security Holders
There have been no material changes to the procedures by which shareholders may recommend nominees to the Registrant’s board of trustees since the Registrant last submitted a proxy statement to its shareholders. The procedures are as follows. The Registrant has a nominating and governance committee comprised solely of persons who are not considered ‘‘interested persons’’ of the Registrant within the meaning of the
Investment Company Act of 1940, as amended. The committee periodically reviews such issues as the board’s composition, responsibilities, committees, compensation and other relevant issues, and recommends any appropriate changes to the full board of trustees. While the committee normally is able to identify from its own resources an ample number of qualified candidates, it will consider shareholder suggestions of persons to be considered as nominees to fill future vacancies on the board. Such suggestions must be sent in writing to the nominating and governance committee of the Registrant, c/o the Registrant’s Secretary, and must be accompanied by complete biographical and occupational data on the prospective nominee, along with a written consent of the prospective nominee for consideration of his or her name by the nominating and governance committee.
ITEM 11 – Controls and Procedures
| (a) | The Registrant’s Principal Executive Officer and Principal Financial Officer have concluded, based on their evaluation of the Registrant’s disclosure controls and procedures (as such term is defined in Rule 30a-3 under the Investment Company Act of 1940), that such controls and procedures are adequate and reasonably designed to achieve the purposes described in paragraph (c) of such rule. |
| | |
| (b) | There were no changes in the Registrant’s internal controls over financial reporting (as defined in Rule 30a-3(d) under the Investment Company Act of 1940) that occurred during the Registrant’s second fiscal quarter of the period covered by this report that has materially affected, or is reasonably likely to materially affect, the Registrant’s internal control over financial reporting. |
ITEM 12 – Exhibits
| (a)(1) | Not applicable for filing of semi-annual reports to shareholders. |
| | |
| (a)(2) | The certifications required by Rule 30a-2 of the Investment Company Act of 1940 and Sections 302 and 906 of the Sarbanes-Oxley Act of 2002 are attached as exhibits hereto. |
SIGNATURES
Pursuant to the requirements of the Securities Exchange Act of 1934 and the Investment Company Act of 1940, the Registrant has duly caused this report to be signed on its behalf by the undersigned, thereunto duly authorized.
| | AMERICAN BALANCED FUND |
| | |
| | By /s/ Gregory D. Johnson |
| | Gregory D. Johnson, Vice Chairman, President and Principal Executive Officer |
| | |
| | Date: August 31, 2017 |
Pursuant to the requirements of the Securities Exchange Act of 1934 and the Investment Company Act of 1940, this report has been signed below by the following persons on behalf of the Registrant and in the capacities and on the dates indicated.
| By /s/ Gregory D. Johnson |
Gregory D. Johnson, Vice Chairman, President and Principal Executive Officer |
| |
| Date: August 31, 2017 |
| By /s/ Brian C. Janssen |
Brian C. Janssen, Treasurer and Principal Financial Officer |
| |
| Date: August 31, 2017 |