Exhibit 99.1
2013 KeyBanc Capital Markets Industrial, Automotive and Transportation Conference
May 29, 2013
Patrick Decker, President and CEO
© 2013 Harsco Corporation, All Rights Reserved.
Administrative Items
Safe Harbor
This presentation contains forward-looking statements based on management’s current expectations, estimates and projections. All statements that address expectations or projections about the future, including statements about the company’s strategy for growth, product development, market position, expected expenditures and financial results are forward-looking statements. Some of the forward-looking statements may be identified by words like “may,” “could,” “believes,” “expects,” “anticipates,” “plans,” “intends,” “projects,” “indicates,” and similar expressions. These statements are not guarantees of future performance and involve a number of risks, uncertainties and assumptions. Many factors, including those discussed more fully elsewhere in this presentation and in documents filed with the Securities and Exchange Commission by Harsco, particularly its latest annual report on Form 10-K and quarterly report on Form 10-Q, as well as others, could cause results to differ materially from those stated. These factors include, but are not limited to, changes in the worldwide business environment in which the Company operates, including as a result of the current global financial and credit crisis; changes in the performance of the equity and debt markets; changes in governmental laws and regulations; market and competitive changes, including pricing pressures, market demand and acceptance for new products, services, and technologies; unforeseen business disruptions in one or more of the many countries in which the Company operates; the seasonal nature of the Company’s business; our ability to successfully enter into new contracts and complete new acquisitions in the timeframe contemplated; the financial condition of the Company’s customers; the successful integration of the Company’s strategic acquisitions; and the amount and timing of repurchases of the Company’s common stock, if any. The Company undertakes no duty to update forward-looking statements.
Non-GAAP Measures
This presentation contains non-GAAP financial information including adjusted operating income margin, adjusted diluted earnings per share from continuing operations, free cash flow and adjusted return on invested capital. These non-GAAP measures exclude special items in certain fiscal periods. For a reconciliation of these non-GAAP measures to U.S. GAAP results and the Company’s rationale for its usage of non-GAAP measures, please see the Appendix .
© 2013 Harsco Corporation, All Rights Reserved.
| 1
Harsco at a Glance
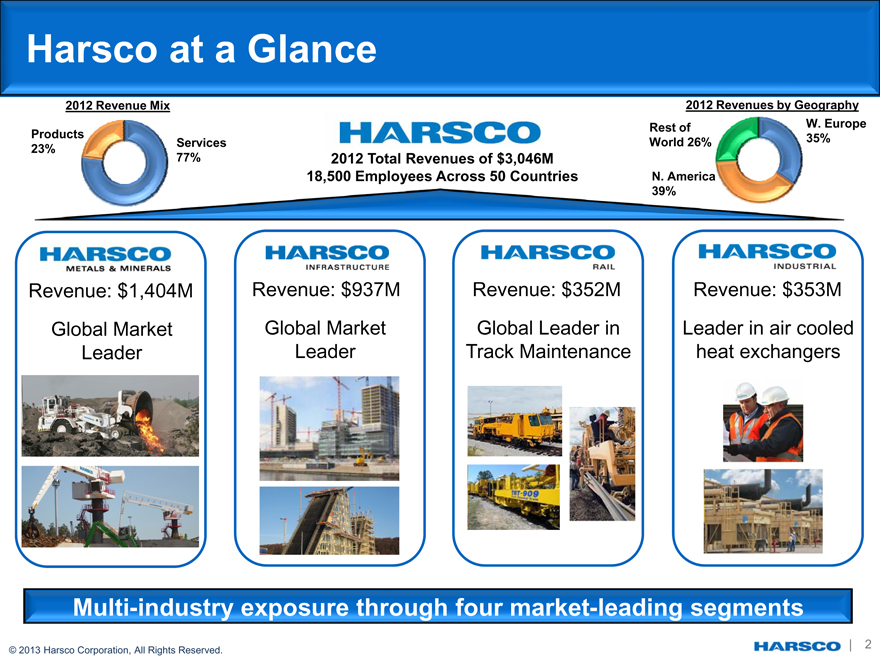
2012 Revenue Mix 2012 Revenues by Geography Products Rest of W. Europe 23% Services World 26% 35% 77% 2012 Total Revenues of $3,046M
18,500 Employees Across 50 Countries N. America 39%
Revenue: $1,404M Revenue: $937M Revenue: $352M Revenue: $353M Global Market Global Market Global Leader in Leader in air cooled Leader Leader Track Maintenance heat exchangers
Multi-industry exposure through four market-leading segments
| 2
© 2013 Harsco Corporation, All Rights Reserved.
Historical Harsco Performance
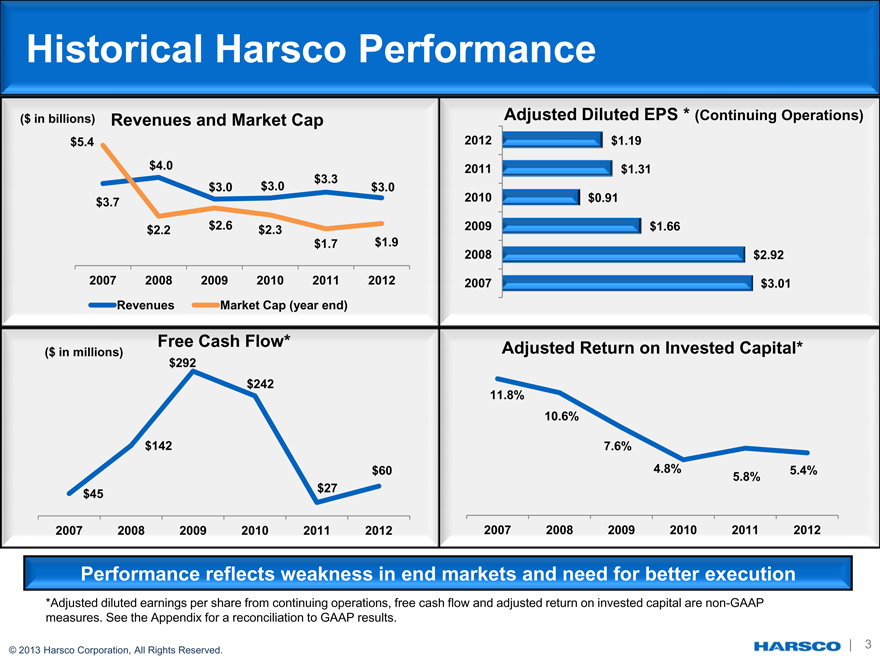
($ in billions) Revenues and Market Cap Adjusted Diluted EPS * (Continuing Operations)
$5.4 2012 $1.19 $4.0 2011 $1.31 $3.3 $3.0 $3.0 $3.0 2010 $0.91 $3.7 $2.2 $2.6 $2.3 2009 $1.66 $1.7 $1.9
2008 $2.92
2007 2008 2009 2010 2011 2012 2007 $3.01
Revenues Market Cap (year end)
Free Cash Flow* Adjusted Return on Invested Capital*
($ in millions) $292 $242 11.8%
10.6%
$142 7.6%
$60 4.8% 5.4%
$27 5.8% $45
2007 2008 2009 2010 2011 2012 2007 2008 2009 2010 2011 2012
Performance reflects weakness in end markets and need for better execution
*Adjusted diluted earnings per share from continuing operations, free cash flow and adjusted return on invested capital are non-GAAP measures. See the Appendix for a reconciliation to GAAP results.
© 2013 Harsco Corporation, All Rights Reserved.
| 3
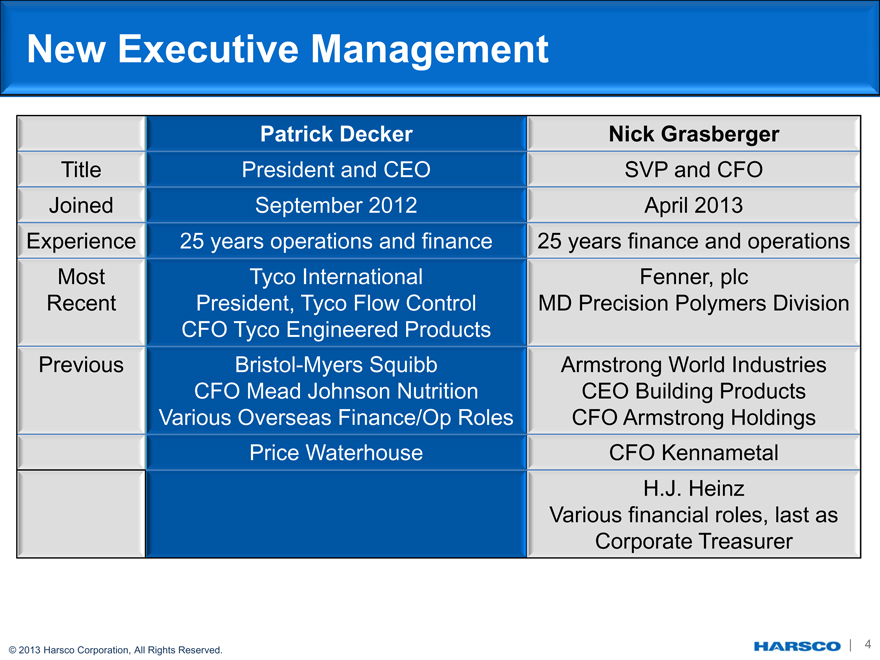
New Executive Management
Patrick Decker Nick Grasberger
Title President and CEO SVP and CFO Joined September 2012 April 2013
Experience 25 years operations and finance 25 years finance and operations Most Tyco International Fenner, plc Recent President, Tyco Flow Control MD Precision Polymers Division CFO Tyco Engineered Products Previous Bristol-Myers Squibb Armstrong World Industries CFO Mead Johnson Nutrition CEO Building Products Various Overseas Finance/Op Roles CFO Armstrong Holdings Price Waterhouse CFO Kennametal H.J. Heinz Various financial roles, last as Corporate Treasurer
© 2013 Harsco Corporation, All Rights Reserved.
| 4
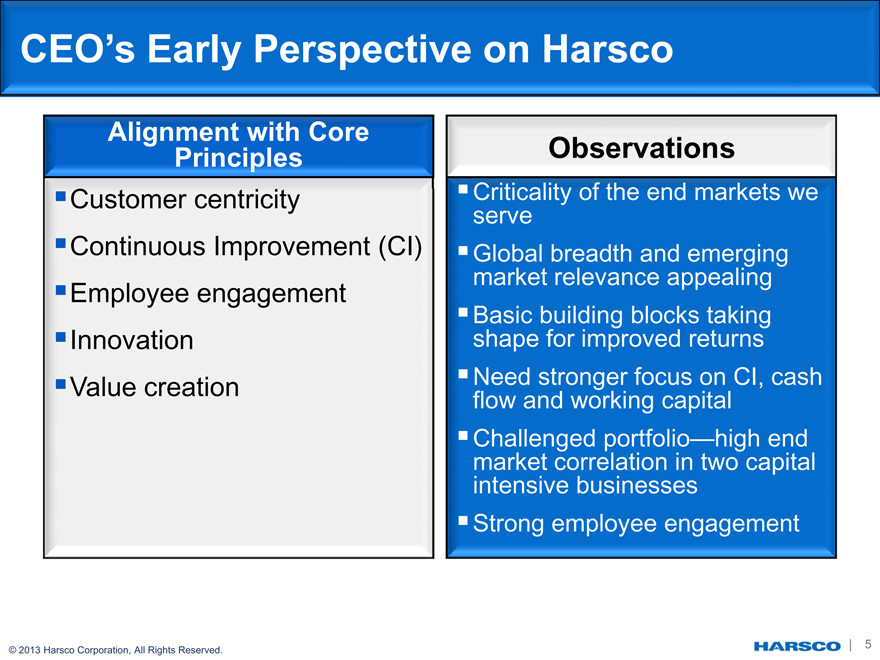
CEO’s Early Perspective on Harsco
Alignment with Core Principles
Customer centricity
Continuous Improvement (CI)
Employee engagement
Innovation
Value creation
Observations
Criticality of the end markets we serve
Global breadth and emerging market relevance appealing
Basic building blocks taking shape for improved returns
Need stronger focus on CI, cash flow and working capital
Challenged portfolio—high end market correlation in two capital intensive businesses
Strong employee engagement
© 2013 Harsco Corporation, All Rights Reserved.
| 5
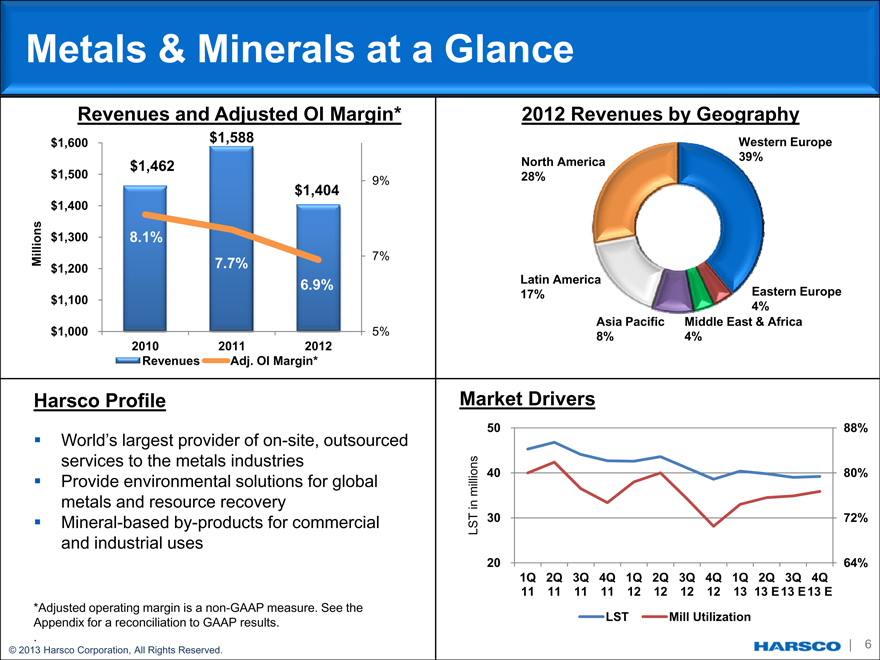
Metals & Minerals at a Glance
Revenues and Adjusted OI Margin*
$1,600 $1,588 $1,462 $1,500
9% $1,404 $1,400
$1,300 8.1%
Millions 7% $1,200 7.7% 6.9% $1,100
$1,000 5% 2010 2011 2012 Revenues Adj. OI Margin*
Harsco Profile
World’s largest provider of on-site, outsourced services to the metals industries
Provide environmental solutions for global metals and resource recovery
Mineral-based by-products for commercial and industrial uses
*Adjusted operating margin is a non-GAAP measure. See the Appendix for a reconciliation to GAAP results.
.
© 2013 Harsco Corporation, All Rights Reserved.
2012 Revenues by Geography
Western Europe North America 39% 28%
Latin America
17% Eastern Europe 4% Asia Pacific Middle East & Africa
8% 4%
Market Drivers
50 88%
ns millio 40 80% in LST 30 72%
20 64%
1Q 2Q 3Q 4Q 1Q 2Q 3Q 4Q 1Q 2Q 3Q 4Q
11 11 11 11 12 12 12 12 13 13 E 13 E 13 E
LST Mill Utilization
| 6
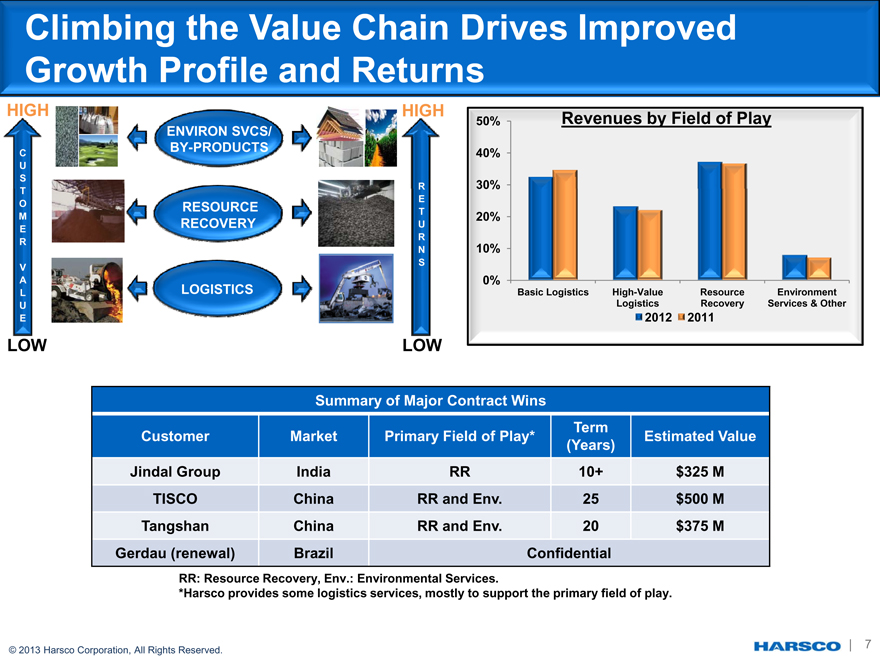
Climbing the Value Chain Drives Improved Growth Profile and Returns
HIGH HIGH
ENVIRON SVCS/ 50% Revenues by Field of Play
C BY-PRODUCTS 40%
U S
R 30%
T
E
O RESOURCE
T
M 20%
RECOVERY U
E
R R
N 10%
S V
A 0%
L LOGISTICS Basic Logistics High-Value Resource Environment U Logistics Recovery Services & Other
E 2012 2011
LOW LOW
Summary of Major Contract Wins
Term
Customer Market Primary Field of Play* Estimated Value (Years) Jindal Group India RR 10+ $325 M
TISCO China RR and Env. 25 $500 M Tangshan China RR and Env. 20 $375 M
Gerdau (renewal) Brazil Confidential
RR: Resource Recovery, Env.: Environmental Services.
*Harsco provides some logistics services, mostly to support the primary field of play.
© 2013 Harsco Corporation, All Rights Reserved. | 7
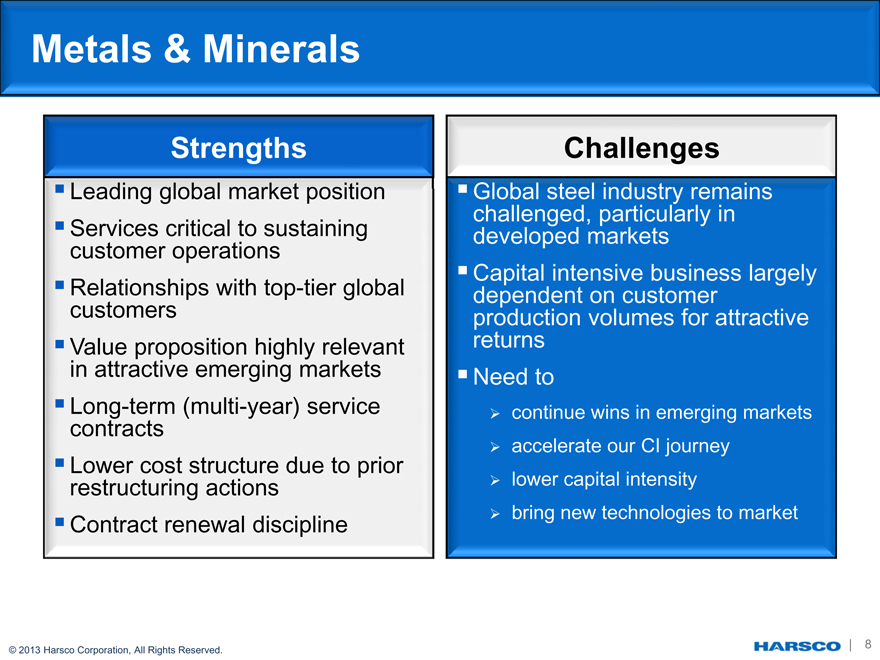
Metals & Minerals
Strengths
Leading global market position
Services critical to sustaining customer operations
Relationships with top-tier global customers
Value proposition highly relevant in attractive emerging markets
Long-term (multi-year) service contracts
Lower cost structure due to prior restructuring actions
Contract renewal discipline
Challenges
Global steel industry remains challenged, particularly in developed markets
Capital intensive business largely dependent on customer production volumes for attractive returns
Need to
continue wins in emerging markets
accelerate our CI journey
lower capital intensity
bring new technologies to market
© 2013 Harsco Corporation, All Rights Reserved.
| 8
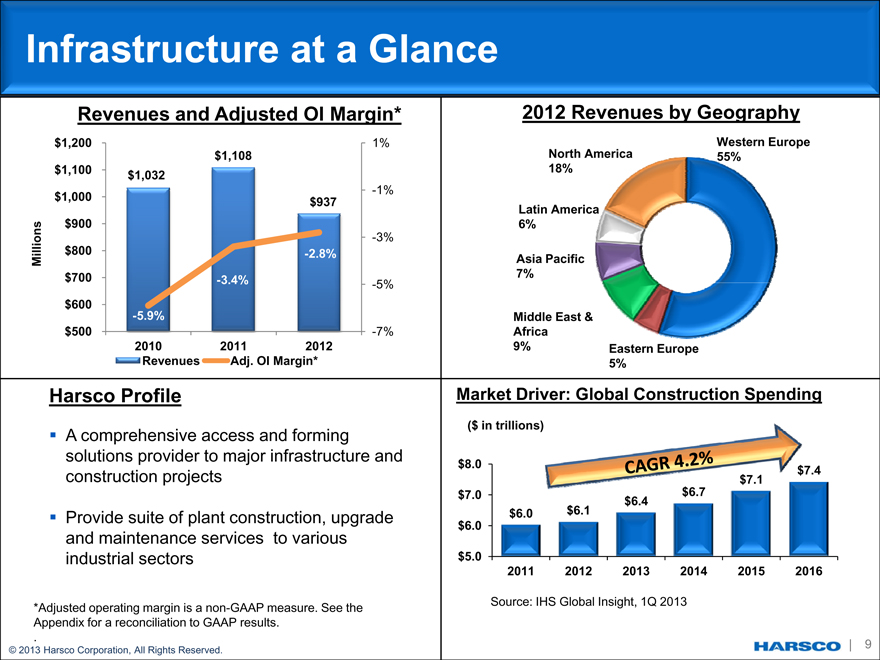
Infrastructure at a Glance
Revenues and Adjusted OI Margin*
$1,200 1% $1,108 $1,100 $1,032
-1% $1,000 $937 $900
-3%
Millions $800 -2.8% $700 -3.4%
-5% $600 -5.9% $500 -7% 2010 2011 2012 Revenues Adj. OI Margin*
Harsco Profile
A comprehensive access and forming solutions provider to major infrastructure and construction projects
Provide suite of plant construction, upgrade and maintenance services to various industrial sectors
*Adjusted operating margin is a non-GAAP measure. See the Appendix for a reconciliation to GAAP results.
.
© 2013 Harsco Corporation, All Rights Reserved.
2012 Revenues by Geography
Western Europe North America 55% 18%
Latin America 6%
Asia Pacific 7%
Middle East & Africa
9% Eastern Europe 5%
Market Driver: Global Construction Spending
($ in trillions)
$8.0 $7.4 $7.0 $6.7 $6.4 $6.0 $6.1 $6.0
$5.0
2011 2012 2013 2014 2015 2016
Source: IHS Global Insight, 1Q 2013
| 9
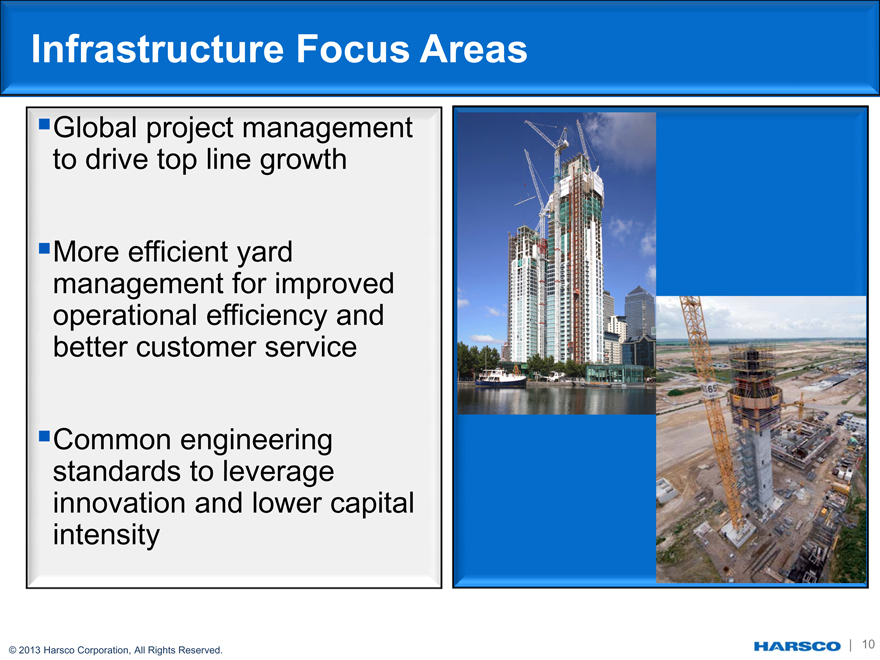
Infrastructure Focus Areas
Global project management
to drive top line growth
More efficient yard
management for improved
operational efficiency and
better customer service
Common engineering
standards to leverage
innovation and lower capital
intensity
© 2013 Harsco Corporation, All Rights Reserved.
| 10
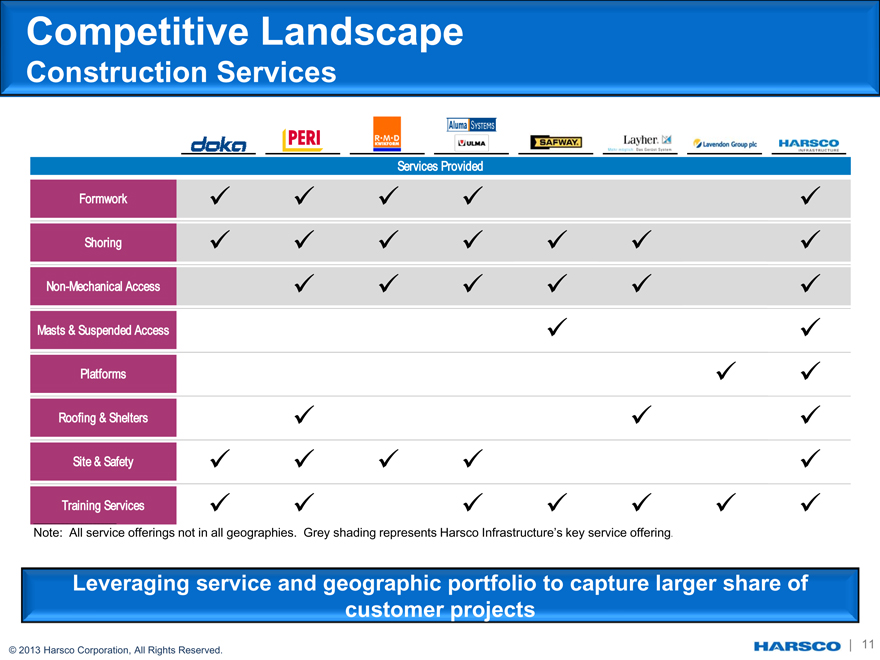
Competitive Landscape
Construction Services
Services Provided
Formwork
Shoring
Non-Mechanical Access
Masts & Suspended Access
Platforms
Roofing & Shelters
Site & Safety
Training Services
Note: All service offerings not in all geographies. Grey shading represents Harsco Infrastructure’s key service offering.
Leveraging service and geographic portfolio to capture larger share of customer projects
© 2013 Harsco Corporation, All Rights Reserved.
| 11
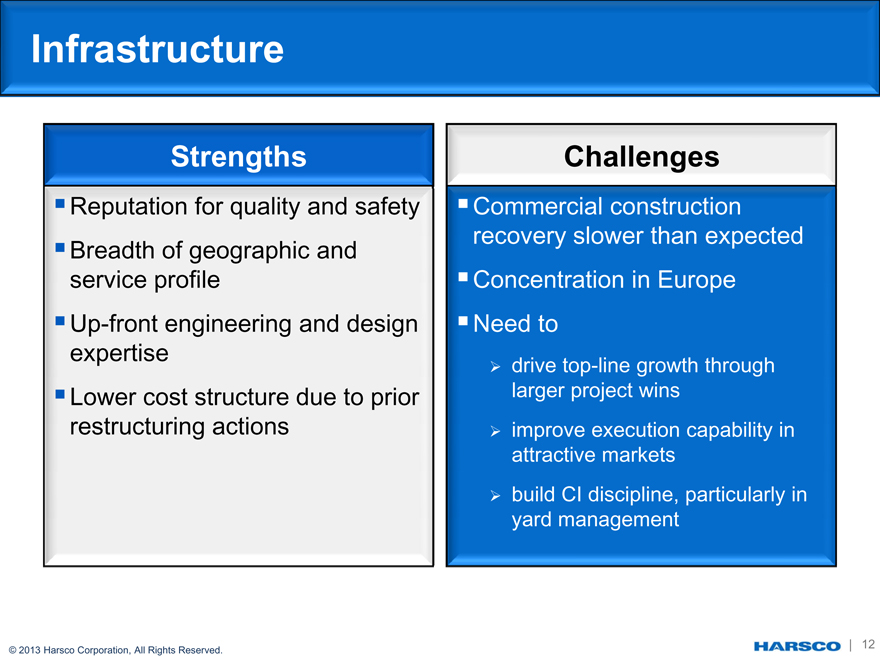
Infrastructure
Strengths
Reputation for quality and safety
Breadth of geographic and service profile
Up-front engineering and design expertise
Lower cost structure due to prior restructuring actions
Challenges
Commercial construction recovery slower than expected
Concentration in Europe
Need to
drive top-line growth through larger project wins
improve execution capability in attractive markets
build CI discipline, particularly in yard management
© 2013 Harsco Corporation, All Rights Reserved.
| 12
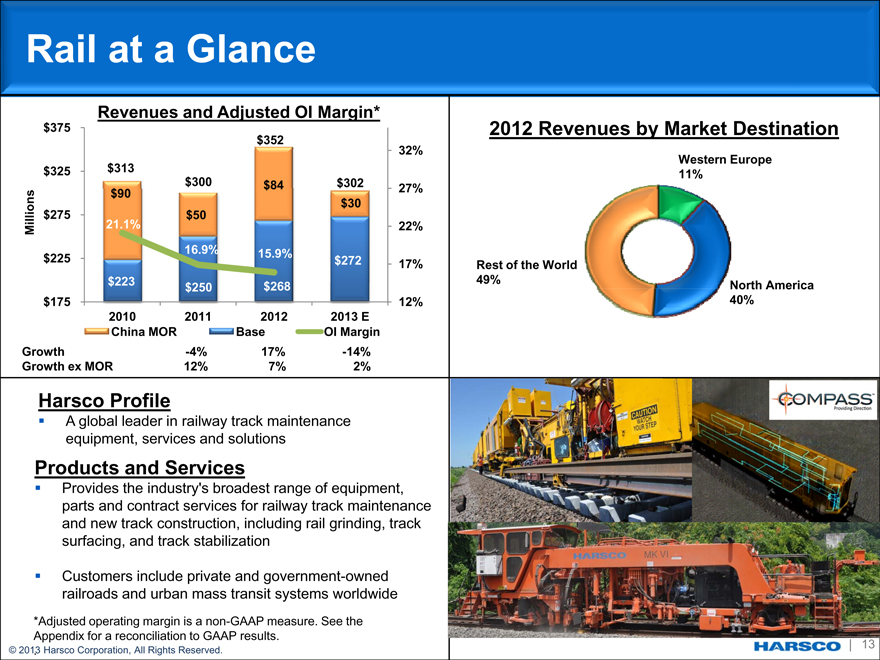
Rail at a Glance
Revenues and Adjusted OI Margin*
$375 2012 Revenues by Market Destination
$352
32%
Western Europe $325 $313 11% $300 $84 $302
$90 27% $275 $30 $50 Millions 21.1% 22%
16.9% 15.9% $225 $272
17% Rest of the World $223 49% $250 $268 North America $175 12% 40% 2010 2011 2012 2013 E
China MOR Base OI Margin Growth -4% 17% -14% Growth ex MOR 12% 7% 2%
Harsco Profile
A global leader in railway track maintenance equipment, services and solutions
Products and Services
Provides the industry’s broadest range of equipment, parts and contract services for railway track maintenance and new track construction, including rail grinding, track surfacing, and track stabilization
Customers include private and government-owned railroads and urban mass transit systems worldwide
*Adjusted operating margin is a non-GAAP measure. See the
Appendix for a reconciliation to GAAP results.
© 2013. Harsco Corporation, All Rights Reserved. | 13
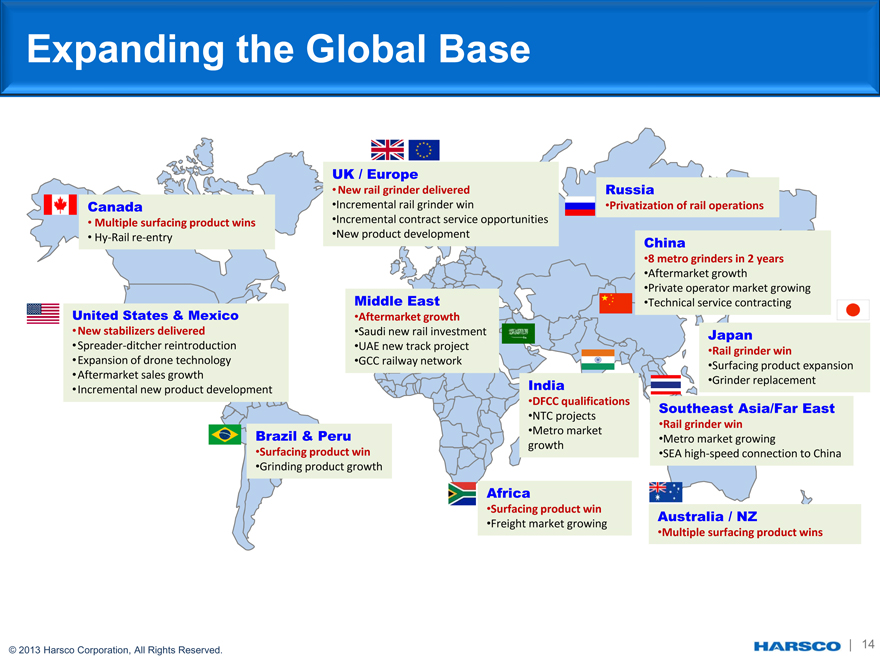
Expanding the Global Base
UK / Europe
•New rail grinder delivered Russia
Canada •Incremental rail grinder win •Privatization of rail operations
• Multiple surfacing product wins •Incremental contract service opportunities
• Hy Rail re entry •New product development China
•8 metro grinders in 2 years
•Aftermarket growth
•Private operator market growing United States & Mexico Middle East •Technical service contracting
•Aftermarket growth
•New stabilizers delivered •Saudi new rail investment Japan
•Spreader ditcher reintroduction •UAE new track project • of drone Rail grinder win
•Expansion technology •GCC railway network
•Surfacing product expansion •Aftermarket sales growth Incremental new product India •Grinder replacement • development
•DFCC qualifications Southeast Asia/Far East
•NTC projects
•Rail grinder win
Brazil & Peru •Metro market
•Metro market growing growth
•Surfacing product win •SEA high speed connection to China •Grinding product growth
Africa
•Surfacing product win Australia / NZ
•Freight market growing Multiple surfacing wins • product
© 2013 Harsco Corporation, All Rights Reserved.
| 14
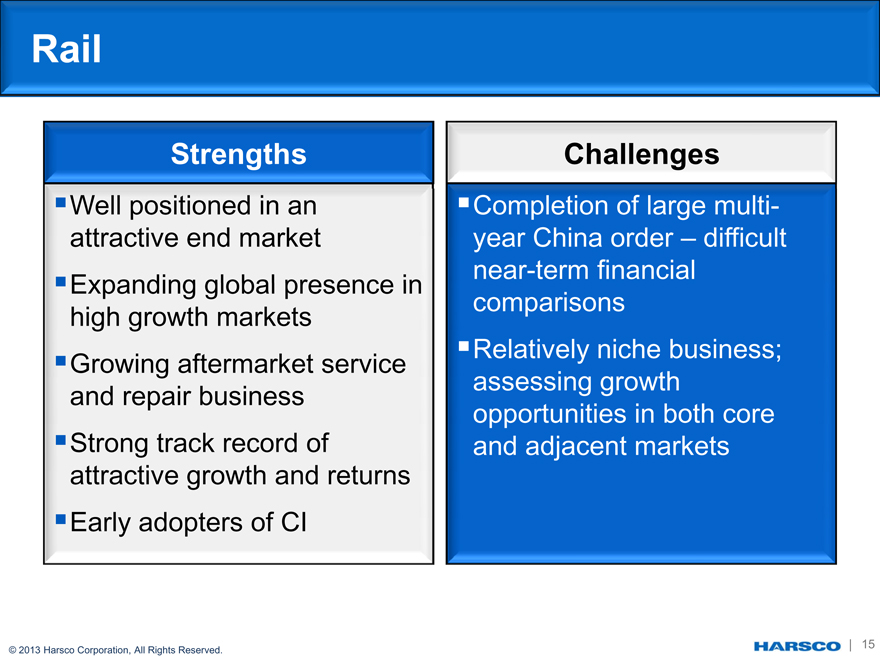
Rail
Strengths Challenges
Well positioned in an Completion of large multi-attractive end market year China order – difficult near-term financial
Expanding global presence in comparisons high growth markets
Relatively niche business;
Growing aftermarket service assessing growth and repair business opportunities in both core
Strong track record of and adjacent markets attractive growth and returns
Early adopters of CI
© 2013 Harsco Corporation, All Rights Reserved.
| 15
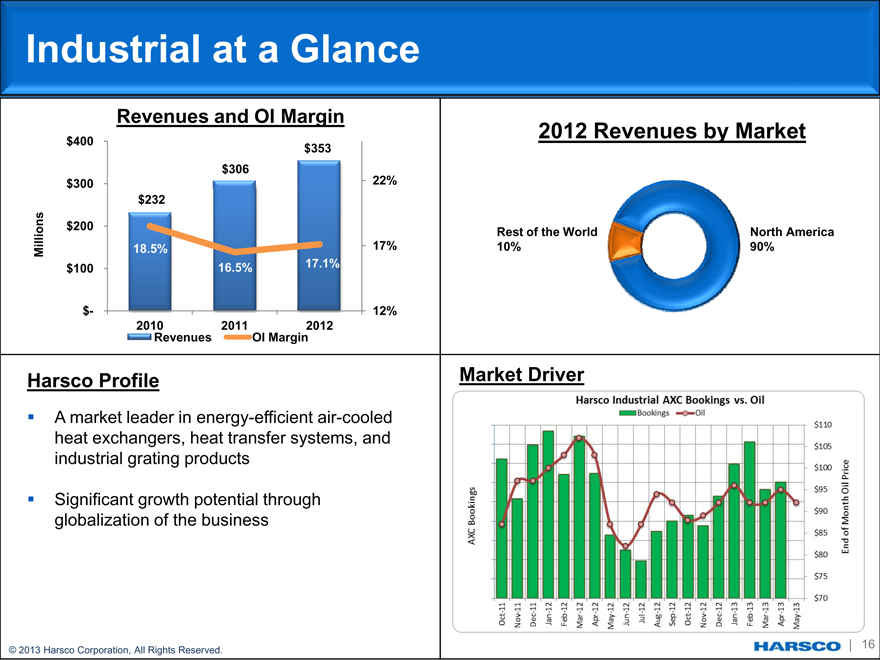
Industrial at a Glance
Revenues and OI Margin
2012 Revenues by Market
$400 $353 $306 22% $300 $232
$200
Rest of the World North America Millions 18.5% 17% 10% 90% $100 16.5% 17.1%
$- 12% 2010 Revenues 2011 OI Margin2012
Harsco Profile Market Driver
A market leader in energy-efficient air-cooled heat exchangers, heat transfer systems, and industrial grating products
Significant growth potential through globalization of the business
© 2013 Harsco Corporation, All Rights Reserved.
| 16
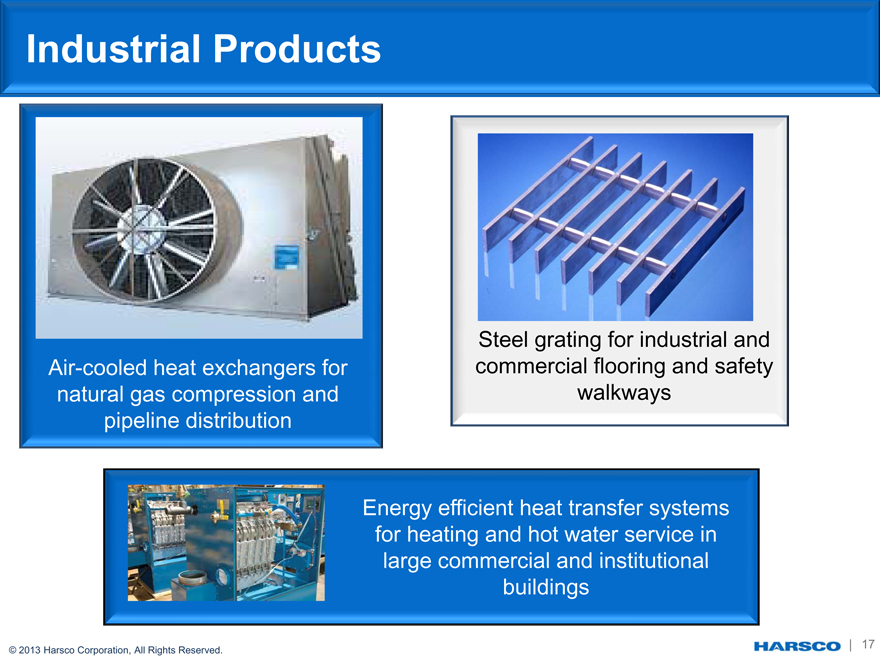
Industrial Products
Steel grating for industrial and Air-cooled heat exchangers for commercial flooring and safety natural gas compression and walkways pipeline distribution
Energy efficient heat transfer systems for heating and hot water service in large commercial and institutional buildings
© 2013 Harsco Corporation, All Rights Reserved.
| 17
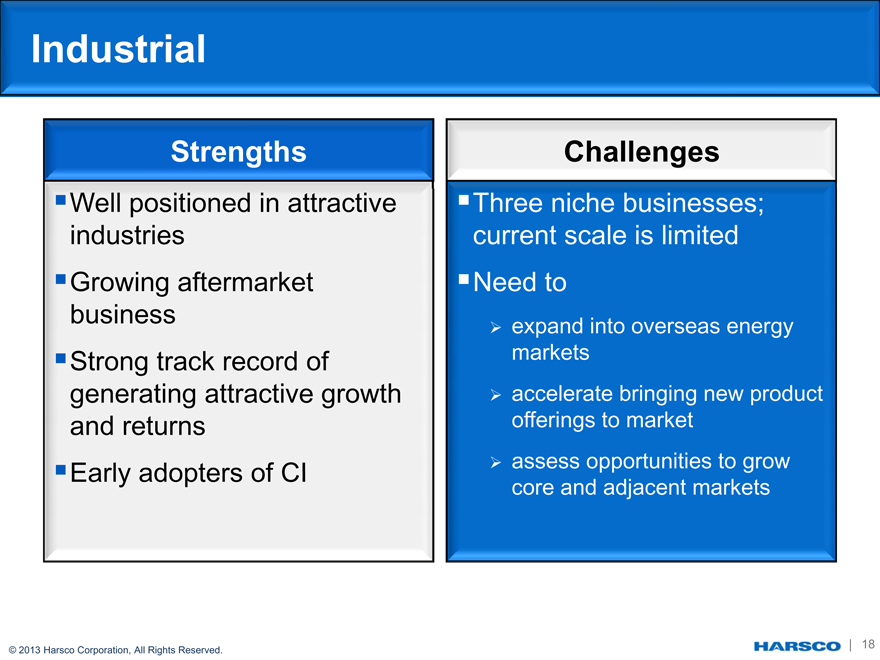
Industrial
Strengths
Well positioned in attractive industries
Growing aftermarket business
Strong track record of generating attractive growth and returns
Early adopters of CI
Challenges
Three niche businesses; current scale is limited
Need to
expand into overseas energy markets
accelerate bringing new product offerings to market
assess opportunities to grow core and adjacent markets
© 2013 Harsco Corporation, All Rights Reserved.
| 18
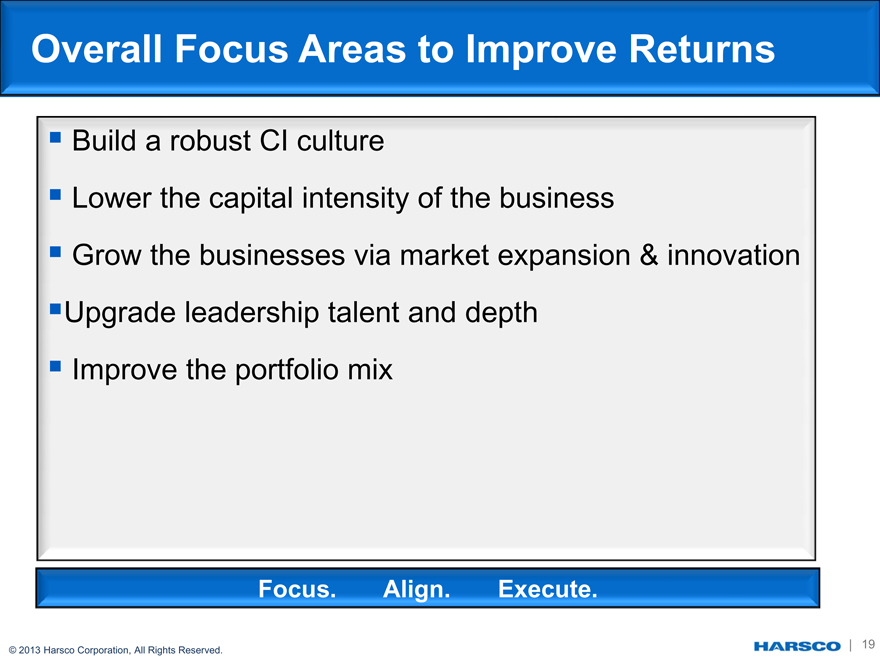
Overall Focus Areas to Improve Returns
Build a robust CI culture
Lower the capital intensity of the business
Grow the businesses via market expansion & innovation
Upgrade leadership talent and depth
Improve the portfolio mix
Focus. Align. Execute.
| 19
© 2013 Harsco Corporation, All Rights Reserved.
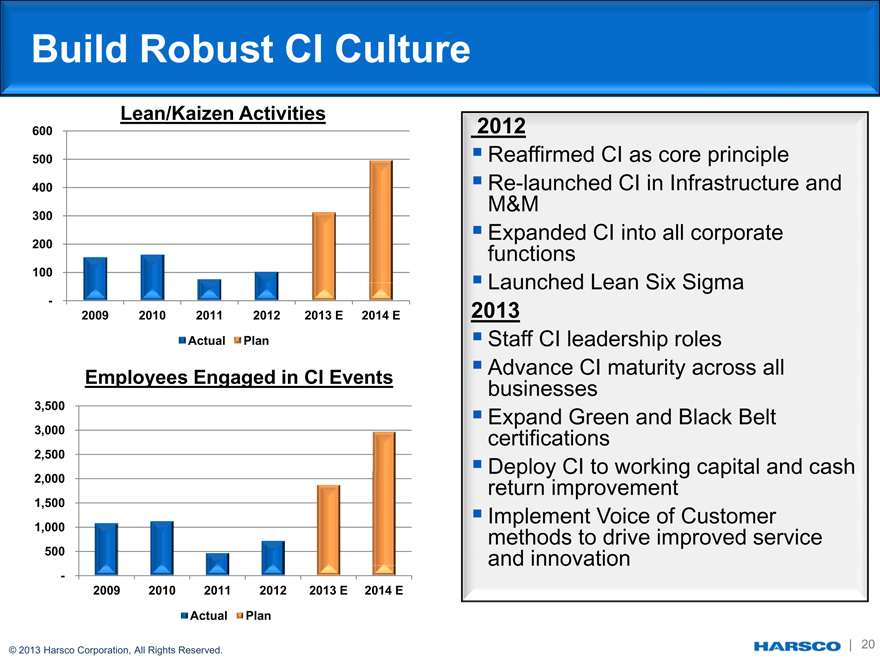
Build Robust CI Culture
Lean/Kaizen Activities
600 2012
500 Reaffirmed CI as core principle 400 Re-launched CI in Infrastructure and M&M
300 Expanded CI into all corporate
200 functions
100 Launched Lean Six Sigma
- 2013
2009 2010 2011 2012 2013 E 2014 E
Actual Plan Staff CI leadership roles
Advance CI maturity across all
Employees Engaged in CI Events businesses
3,500 Expand Green and Black Belt 3,000 certifications
2,500
Deploy CI to working capital and cash 2,000 return improvement
1,500
Implement Voice of Customer 1,000 methods to drive improved service 500 and innovation
-
2009 2010 2011 2012 2013 E 2014 E
Actual Plan
| 20
© 2013 Harsco Corporation, All Rights Reserved.
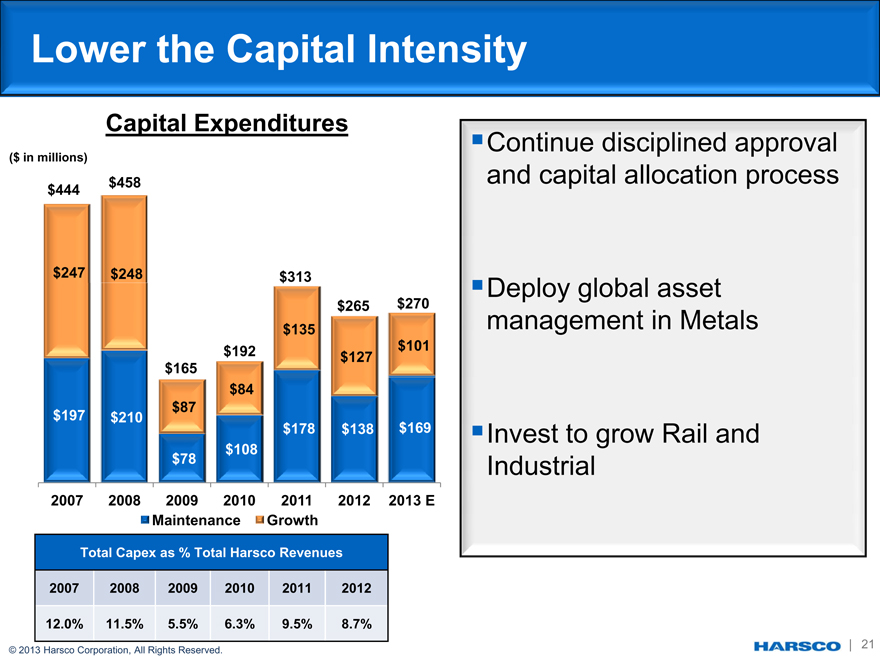
Lower the Capital Intensity
Capital Expenditures
($ in millions) $458 $444
$247 $248 $313 $265 $270 $135 $192 $101 $127 $165 $84 $87 $197 $210 $178 $138 $169 $108 $78
2007 2008 2009 2010 2011 2012 2013 E Maintenance Growth
Total Capex as % Total Harsco Revenues
2007 2008 2009 2010 2011 2012
12.0% 11.5% 5.5% 6.3% 9.5% 8.7%
© 2013 Harsco Corporation, All Rights Reserved.
Continue disciplined approval and capital allocation process
Deploy global asset management in Metals
Invest to grow Rail and Industrial
| 21
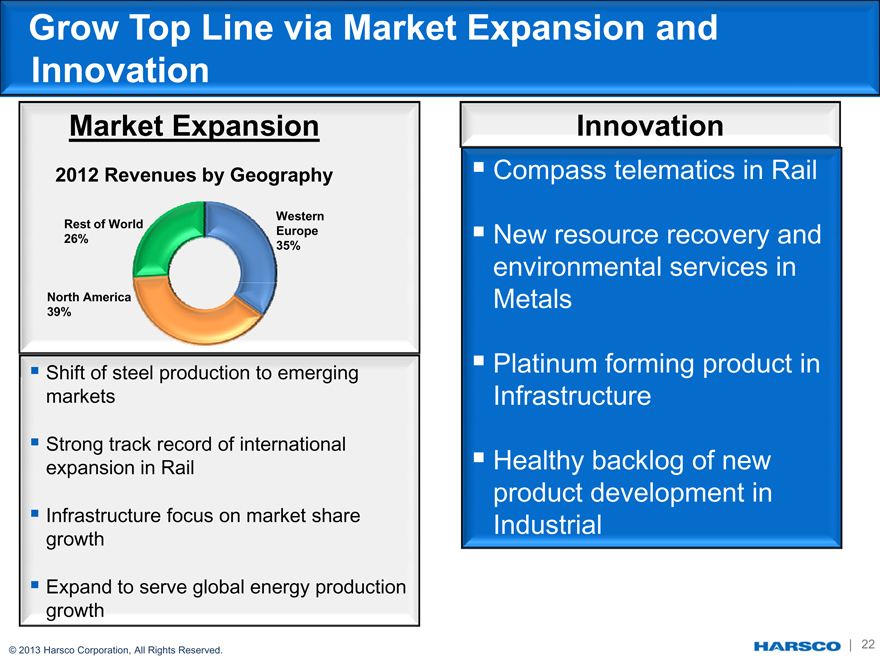
Grow Top Line via Market Expansion and Innovation
Market Expansion
2012 Revenues by Geography
Western
Rest of World Europe
26% 35%
Shift of steel production to emerging markets
Strong track record of international expansion in Rail
Infrastructure focus on market share growth
Expand to serve global energy production growth
© 2013 Harsco Corporation, All Rights Reserved.
Innovation
Compass telematics in Rail
New resource recovery and environmental services in Metals
Platinum forming product in Infrastructure
Healthy backlog of new product development in Industrial
| 22
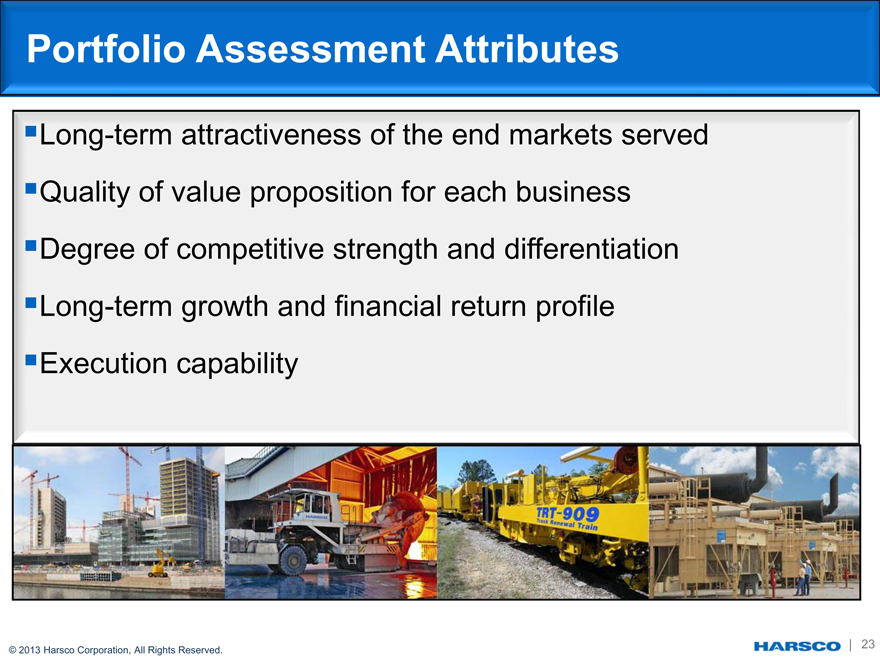
Portfolio Assessment Attributes
Long-term attractiveness of the end markets served
Quality of value proposition for each business
Degree of competitive strength and differentiation
Long-term growth and financial return profile
Execution capability
| 23
© 2013 Harsco Corporation, All Rights Reserved.
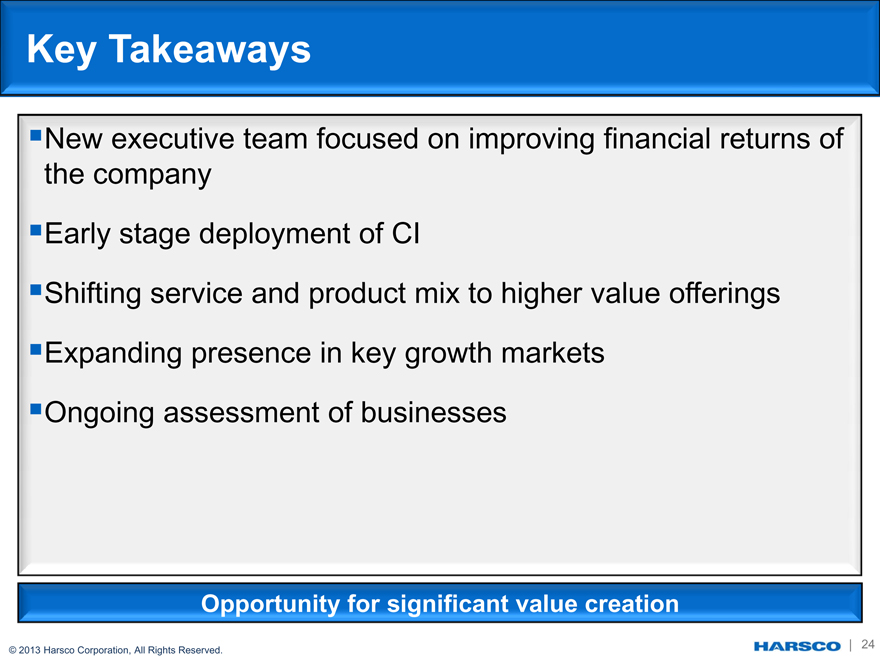
Key Takeaways
New executive team focused on improving financial returns of the company
Early stage deployment of CI
Shifting service and product mix to higher value offerings
Expanding presence in key growth markets
Ongoing assessment of businesses
Opportunity for significant value creation
© 2013 Harsco Corporation, All Rights Reserved.
| 24
2013 KeyBanc Capital Markets Industrial, Automotive and Transportation Conference
May 29, 2013
Appendix
© 2013 Harsco Corporation, All Rights Reserved.
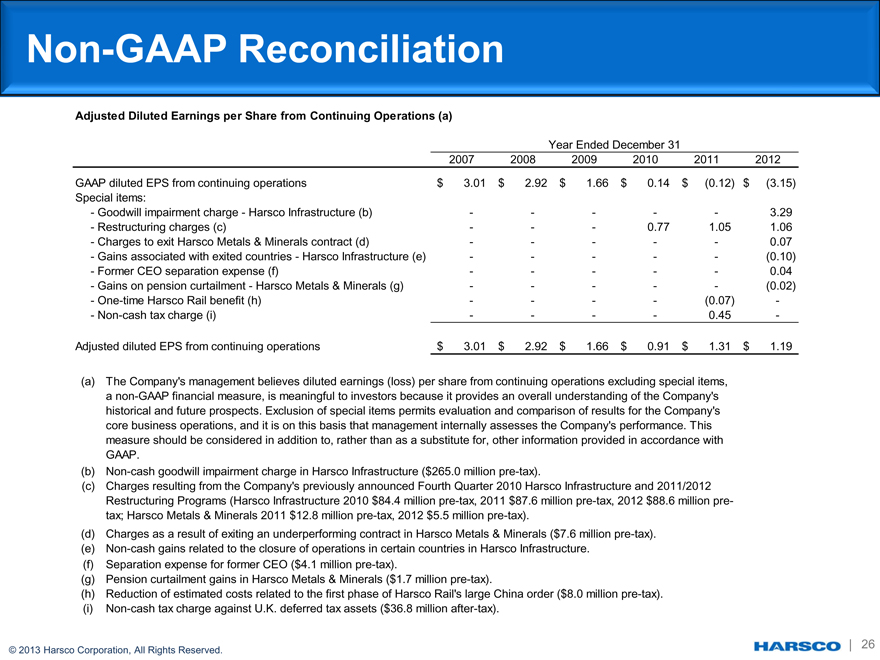
Non-GAAP Reconciliation
- Goodwill impairment charge—Harsco Infrastructure (b) — — — — — 3.29
- Restructuring charges (c) — — — 0.77 1.05 1.06
- Charges to exit Harsco Metals & Minerals contract (d) — — — — — 0.07
- Gains associated with exited countries—Harsco Infrastructure (e) — — — — — (0.10)
- Former CEO separation expense (f) — — — — — 0.04
- Gains on pension curtailment—Harsco Metals & Minerals (g) — — — — — (0.02)
- One-time Harsco Rail benefit (h) — — — — (0.07) -
- Non-cash tax charge (i) — — — — 0.45 -
Adjusted diluted EPS from continuing operations $ 3.01 $ 2.92 $ 1.66 $ 0.91 $ 1.31 $ 1.19
The Company’s management believes diluted earnings (loss) per share from continuing operations excluding special items, a non-GAAP financial measure, is meaningful to investors because it provides an overall understanding of the Company’s historical and future prospects. Exclusion of special items permits evaluation and comparison of results for the Company’s core business operations, and it is on this basis that management internally assesses the Company’s performance. This measure should be considered in addition to, rather than as a substitute for, other information provided in accordance with GAAP.
Non-cash goodwill impairment charge in Harsco Infrastructure ($265.0 million pre-tax).
Charges resulting from the Company’s previously announced Fourth Quarter 2010 Harsco Infrastructure and 2011/2012 Restructuring Programs (Harsco Infrastructure 2010 $84.4 million pre-tax, 2011 $87.6 million pre-tax, 2012 $88.6 million pre- tax; Harsco Metals & Minerals 2011 $12.8 million pre-tax, 2012 $5.5 million pre-tax).
Charges as a result of exiting an underperforming contract in Harsco Metals & Minerals ($7.6 million pre-tax).
Non-cash gains related to the closure of operations in certain countries in Harsco Infrastructure.
Separation expense for former CEO ($4.1 million pre-tax).
Pension curtailment gains in Harsco Metals & Minerals ($1.7 million pre-tax).
Reduction of estimated costs related to the first phase of Harsco Rail’s large China order ($8.0 million pre-tax).
Non-cash tax charge against U.K. deferred tax assets ($36.8 million after-tax).
© 2013 Harsco Corporation, All Rights Reserved.
26
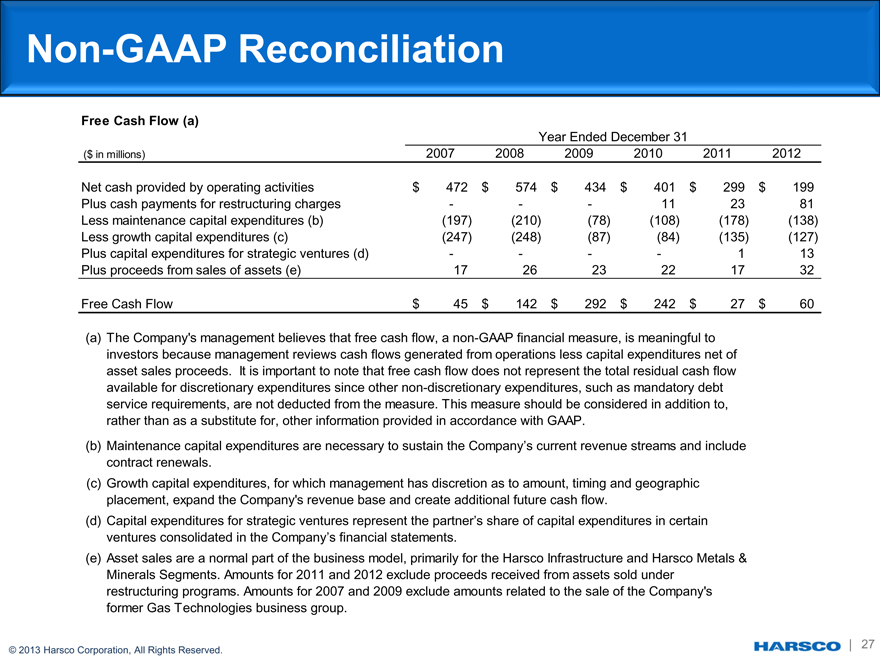
Non-GAAP Reconciliation
Free Cash Flow (a)
Year Ended December 31
($ in millions) 2007 2008 2009 2010 2011 2012
Net cash provided by operating activities $ 472 $ 574 $ 434 $ 401 $ 299 $ 199
Plus cash payments for restructuring charges — — — 11 23 81
Less maintenance capital expenditures (b) (197) (210) (78) (108) (178) (138)
Less growth capital expenditures (c) (247) (248) (87) (84) (135) (127)
Plus capital expenditures for strategic ventures (d) — — — — 1 13
Plus proceeds from sales of assets (e) 17 26 23 22 17 32
Free Cash Flow $ 45 $ 142 $ 292 $ 242 $ 27 $ 60
The Company’s management believes that free cash flow, a non-GAAP financial measure, is meaningful to investors because management reviews cash flows generated from operations less capital expenditures net of asset sales proceeds. It is important to note that free cash flow does not represent the total residual cash flow available for discretionary expenditures since other non-discretionary expenditures, such as mandatory debt service requirements, are not deducted from the measure. This measure should be considered in addition to, rather than as a substitute for, other information provided in accordance with GAAP.
Maintenance capital expenditures are necessary to sustain the Company’s current revenue streams and include contract renewals.
Growth capital expenditures, for which management has discretion as to amount, timing and geographic placement, expand the Company’s revenue base and create additional future cash flow.
Capital expenditures for strategic ventures represent the partner’s share of capital expenditures in certain ventures consolidated in the Company’s financial statements.
Asset sales are a normal part of the business model, primarily for the Harsco Infrastructure and Harsco Metals & Minerals Segments. Amounts for 2011 and 2012 exclude proceeds received from assets sold under restructuring programs. Amounts for 2007 and 2009 exclude amounts related to the sale of the Company’s former Gas Technologies business group.
© 2013 Harsco Corporation, All Rights Reserved.
| 27
Non-GAAP Reconciliation
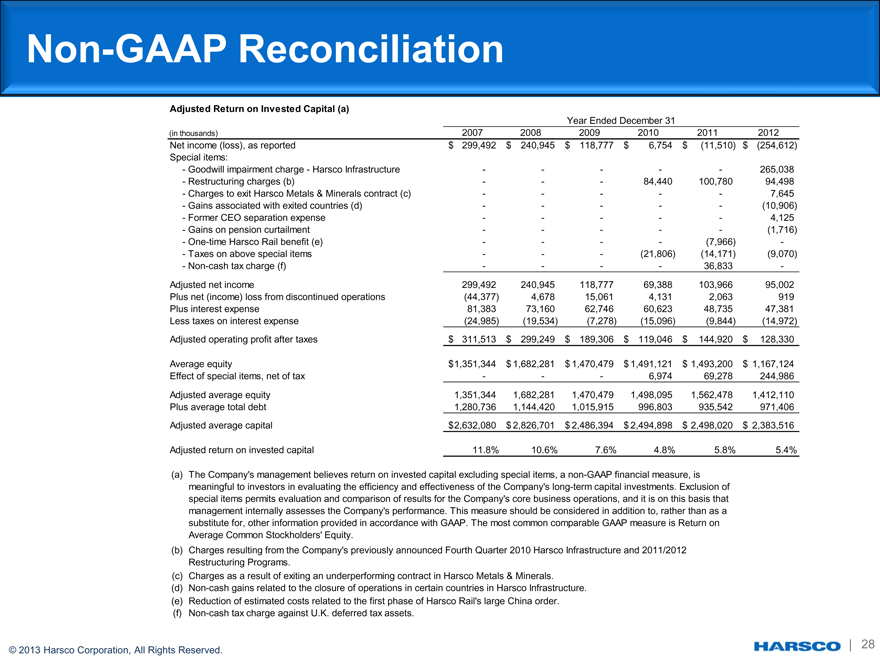
Adjusted Return on Invested Capital (a)
Year Ended December 31
(in thousands) 2007 2008 2009 2010 2011 2012 Net income (loss), as reported $ 299,492 $ 240,945 $ 118,777 $ 6,754 $ (11,510) $ (254,612) Special items:
- Goodwill impairment charge—Harsco Infrastructure — — — — — 265,038
- Restructuring charges (b) — — — 84,440 100,780 94,498
- Charges to exit Harsco Metals & Minerals contract (c) — — — — — 7,645
- Gains associated with exited countries (d) — — — — — (10,906)
- Former CEO separation expense — — — — — 4,125
- Gains on pension curtailment — — — — — (1,716)
- One-time Harsco Rail benefit (e) — — — — (7,966) -
- Taxes on above special items — — — (21,806) (14,171) (9,070)
- Non-cash tax charge (f) — — — — 36,833 -Adjusted net income 299,492 240,945 118,777 69,388 103,966 95,002 Plus net (income) loss from discontinued operations (44,377) 4,678 15,061 4,131 2,063 919 Plus interest expense 81,383 73,160 62,746 60,623 48,735 47,381 Less taxes on interest expense (24,985) (19,534) (7,278) (15,096) (9,844) (14,972) Adjusted operating profit after taxes $ 311,513 $ 299,249 $ 189,306 $ 119,046 $ 144,920 $ 128,330
Average equity $ 1,351,344 $ 1,682,281 $ 1,470,479 $ 1,491,121 $ 1,493,200 $ 1,167,124 Effect of special items, net of tax — — — 6,974 69,278 244,986 Adjusted average equity 1,351,344 1,682,281 1,470,479 1,498,095 1,562,478 1,412,110 Plus average total debt 1,280,736 1,144,420 1,015,915 996,803 935,542 971,406 Adjusted average capital $ 2,632,080 $ 2,826,701 $ 2,486,394 $ 2,494,898 $ 2,498,020 $ 2,383,516
Adjusted return on invested capital 11.8% 10.6% 7.6% 4.8% 5.8% 5.4%
The Company’s management believes return on invested capital excluding special items, a non-GAAP financial measure, is meaningful to investors in evaluating the efficiency and effectiveness of the Company’s long-term capital investments. Exclusion of special items permits evaluation and comparison of results for the Company’s core business operations, and it is on this basis that management internally assesses the Company’s performance. This measure should be considered in addition to, rather than as a substitute for, other information provided in accordance with GAAP. The most common comparable GAAP measure is Return on Average Common Stockholders’ Equity.
Charges resulting from the Company’s previously announced Fourth Quarter 2010 Harsco Infrastructure and 2011/2012 Restructuring Programs.
Charges as a result of exiting an underperforming contract in Harsco Metals & Minerals.
Non-cash gains related to the closure of operations in certain countries in Harsco Infrastructure.
Reduction of estimated costs related to the first phase of Harsco Rail’s large China order.
Non-cash tax charge against U.K. deferred tax assets.
© 2013 Harsco Corporation, All Rights Reserved.
| 28
Non-GAAP Reconciliation
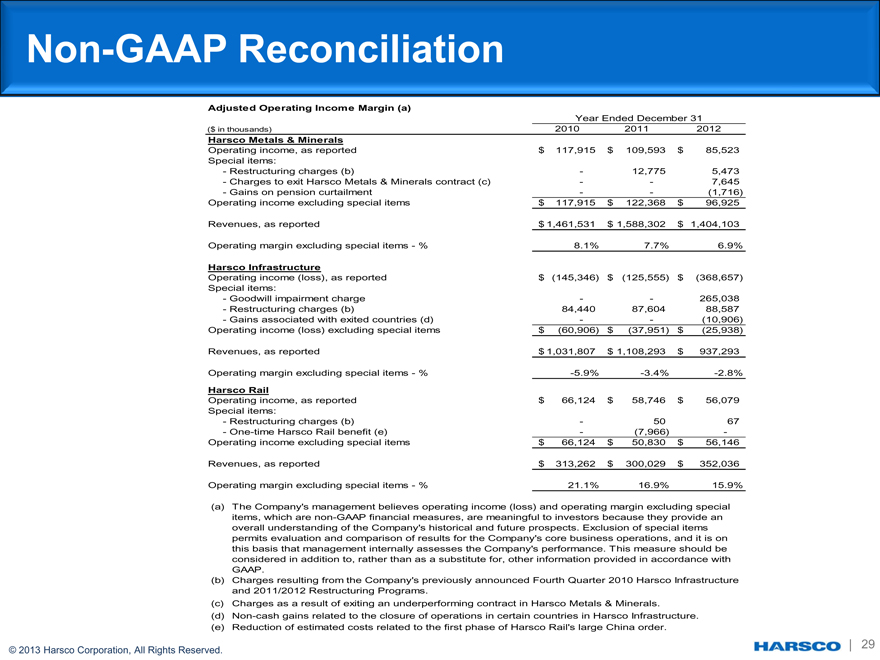
Adjusted Operating Income Margin (a)
Year Ended December 31
($ in thousands) 2010 2011 2012
Harsco Metals & Minerals
Operating income, as reported $ 117,915 $ 109,593 $ 85,523 Special items:
- Restructuring charges (b) — 12,775 5,473
- Charges to exit Harsco Metals & Minerals contract (c) — — 7,645
- Gains on pension curtailment — — (1,716) Operating income excluding special items $ 117,915 $ 122,368 $ 96,925
Revenues, as reported $ 1,461,531 $ 1,588,302 $ 1,404,103
Operating margin excluding special items—% 8.1% 7.7% 6.9%
Harsco Infrastructure
Operating income (loss), as reported $ (145,346) $ (125,555) $ (368,657) Special items:
- Goodwill impairment charge — — 265,038
- Restructuring charges (b) 84,440 87,604 88,587
- Gains associated with exited countries (d) — — (10,906) Operating income (loss) excluding special items $ (60,906) $ (37,951) $ (25,938)
Revenues, as reported $ 1,031,807 $ 1,108,293 $ 937,293
Operating margin excluding special items—% -5.9% -3.4% -2.8%
Harsco Rail
Operating income, as reported $ 66,124 $ 58,746 $ 56,079 Special items:
- Restructuring charges (b) — 50 67
- One-time Harsco Rail benefit (e) — (7,966) -Operating income excluding special items $ 66,124 $ 50,830 $ 56,146
Revenues, as reported $ 313,262 $ 300,029 $ 352,036
Operating margin excluding special items—% 21.1% 16.9% 15.9%
The Company’s management believes operating income (loss) and operating margin excluding special items, which are non-GAAP financial measures, are meaningful to investors because they provide an overall understanding of the Company’s historical and future prospects. Exclusion of special items permits evaluation and comparison of results for the Company’s core business operations, and it is on this basis that management internally assesses the Company’s performance. This measure should be considered in addition to, rather than as a substitute for, other information provided in accordance with GAAP.
Charges resulting from the Company’s previously announced Fourth Quarter 2010 Harsco Infrastructure and 2011/2012 Restructuring Programs.
Charges as a result of exiting an underperforming contract in Harsco Metals & Minerals.
Non-cash gains related to the closure of operations in certain countries in Harsco Infrastructure.
Reduction of estimated costs related to the first phase of Harsco Rail’s large China order.
© 2013 Harsco Corporation, All Rights Reserved.
| 29