TALCOTT RESOLUTION LIFE INSURANCE COMPANY0000045947424B3trueRestated annual reporthttp://fasb.org/us-gaap/2022#GainLossOnInvestmentshttp://fasb.org/us-gaap/2022#GainLossOnInvestmentshttp://fasb.org/us-gaap/2022#GainLossOnInvestmentshttp://fasb.org/us-gaap/2022#OtherAssetshttp://fasb.org/us-gaap/2022#OtherAssets0000045947us-gaap:CurrencySwapMemberus-gaap:ReclassificationOutOfAccumulatedOtherComprehensiveIncomeMemberus-gaap:AccumulatedGainLossNetCashFlowHedgeParentMember2021-07-022021-12-31
Filed Pursuant to Rule 424(b)(3)
Registration Number 333-255242
TALCOTT RESOLUTION LIFE INSURANCE COMPANY
CRC Select II
SUPPLEMENT DATED DECEMBER 21, 2023, TO THE
PROSPECTUS DATED MAY 1, 2023
This supplement updates the prospectus for the contract listed above (the “Contract”). Please read this supplement carefully and retain it for future reference. Any capitalized terms not defined herein have the same meanings as in the prospectus.
For liability purposes, the date of this supplement shall be deemed to be a new effective date of the registration statement, and shall be deemed to be the initial bona fide offering of the securities to which the registration statement relates. Provided, however, that no statement made in this supplement will, as to a sale of securities under the registration statement prior to the date of this supplement, supersede or modify any statement that was made in the registration statement or prospectus that was part of the registration statement or made in any such document immediately prior to the date of this supplement.
Restatement of Company Financial Statements
Effective immediately, under “Talcott Resolution Life Insurance Company and Subsidiaries” in the prospectus, the audited financial statements for Talcott Resolution Life Insurance Company and its subsidiaries (“TL” or the “Company”) are deleted and replaced with the restated financial statements provided below.
The Company’s financial statements have been restated to correct an error. The error related to the accounting associated with affiliated reinsurance agreements (“Reinsurance Agreements”) entered into between the Company and its parent TR Re, Ltd. (“TR Re”), in which certain of the Company’s liabilities were reinsured to TR Re. As a result of the error, reinsurance recoverables and stockholder's equity was overstated by $314 million and $258 million, respectively, other liabilities was understated by $13 million on the Company’s consolidated balance sheets as of December 31, 2022, and certain Notes to Consolidated Financial Statements were corrected. Additionally, net income in the consolidated statements of operations for the year ended December 31, 2022 was overstated by $258 million. Financial statements for other periods have not been changed. Please refer to the Company’s restated financial statements for additional information.
In connection with the restatement, Company’s management has reassessed the effectiveness of internal controls over financial reporting. Management has determined that there was a material weakness in the Company’s processes and procedures related to the appropriate accounting for intercompany reinsurance, which limited the Company’s ability to detect the above-referenced error. The Company is taking steps to remediate this material weakness by enhancing those processes and procedures. The Company believes these changes will remediate the material weakness, but the Company will continue to assess those controls, through testing over future time periods, to determine whether the controls are operating effectively. If the Company's changes in internal controls fails to remediate this material weakness, or if it experiences additional internal control weaknesses, current and future financial statements may not be accurate.
Neither the restatement nor the controls weakness has any material impact on the Company’s financial strength and claims-paying ability, or the Company’s ability to perform its obligations under the terms of your Contract. These changes to the Company's GAAP financial statements do not affect the Company's statutory financial statements nor the capital position reported therein to regulators. No action is required on your part.
Other Prospectus Revisions Related to Restatement
(Dollar amounts in millions, unless otherwise stated)
Under “Description of Business – Organization,” the second paragraph is deleted and replaced with the following:
The Company’s results of operations are primarily influenced by the financial results of the variable annuity, fixed and payout annuity, reinsured FIA products, and private placement products, as well as the capital gain and loss activity associated with the Company’s variable annuity hedging program. Total assets and total stockholder’s equity were approximately $153 billion and $356, respectively, as of December 31, 2022 (as restated).
The section “Management’s Discussion and Analysis of Financial Condition and Results of Operations” is deleted in its entirety and replaced with the following:
Management's Discussion and Analysis of Financial Condition and Results of Operations
The MD&A addresses the financial condition of the Company as of December 31, 2022 (Successor Company) and 2021 (Successor Company), along with the year ended December 31, 2022 (Successor Company), the period ended July 1, 2021 through December 31, 2021 (Successor Company), the six months ended June 30, 2021 (Predecessor Company) and the year ended December 31, 2020 (Predecessor Company). This discussion should be read in conjunction with the Consolidated Financial Statements and related Notes which appear elsewhere in this document.
HV-8073
INDEX
CONSOLIDATED RESULTS OF OPERATIONS
Operating Summary
| | | | | | | | | | | | | | |
| Successor Company | Predecessor Company |
| As Restated | | | |
| For the Year Ended December 31, 2022 | For the Period of July 1, 2021 to December 31, 2021 | For the Six Months Ended June 30, 2021 | For the Year Ended December 31, 2020 |
| (In millions) |
| Revenues | | | | |
| Policy charges and fee income | $ | 506 | | $ | 410 | | $ | 438 | | $ | 741 | |
| Premiums | 109 | | 31 | | 24 | | 35 | |
| Net investment income | 778 | | 498 | | 534 | | 816 | |
| | | | |
| | | | |
| | | | |
| | | | |
| | | | |
| Net realized capital losses | (10) | | (20) | | (242) | | (74) | |
| Amortization of deferred gains | 33 | | — | | 26 | | 53 | |
| Total revenues | 1,416 | | 919 | | 780 | | 1,571 | |
| Benefits, losses and expenses | | | | |
| Benefits and losses | 637 | | 285 | | 375 | | 626 | |
| Amortization of value of business acquired ("VOBA") and deferred acquisition costs ("DAC") | 79 | | 90 | | (43) | | 50 | |
| Insurance operating costs and other expenses | 294 | | 208 | | 228 | | 364 | |
| | | | |
| Other intangible asset amortization | 6 | | 3 | | 3 | | 6 | |
| Dividends to policyholders | 3 | | 2 | | 1 | | 60 | |
| Total benefits, losses and expenses | 1,019 | | 588 | | 564 | | 1,106 | |
| Income before income taxes | 397 | | 331 | | 216 | | 465 | |
| Income tax expense | 38 | | 51 | | 30 | | 66 | |
| | | | |
| | | | |
| Net income | $ | 359 | | $ | 280 | | $ | 186 | | $ | 399 | |
| | | | |
| | | | |
[1] The effective tax rate differs from the U.S. Federal statutory rate of 21% primarily due to the separate account dividends received deduction. For a reconciliation of the income tax provision at the U.S. Federal statutory rate to the provision for income taxes, see Note 10 - Income Taxes of Notes to Consolidated Financial Statements.
For the year ended December 31, 2022 (Successor Company) (as Restated)
Policy charges and fee income was primarily driven by affiliated reinsurance and lower assets under management on the variable annuity block of business, net of increases due to reinsurance with Guardian.
Net investment income was primarily driven by lower limited partnership and other alternative investment results and impacts of affiliated reinsurance, net of increases in fixed maturities.
Net realized capital losses were primarily driven by trading losses on AFS and equity securities, FIA hedging results and losses on interest rate derivatives, mostly offset by modified coinsurance reinsurance embedded derivative gains and gains on embedded derivatives associated with FIA guarantees.
Benefits and losses were primarily driven by the assumed FIA block of business, net of lower retained annuity benefits from reinsurance with a related party.
Insurance operating costs and other expenses were primarily driven by reinsurance with a related party, net of increases operating costs associated with the reinsured blocks from Allianz and Guardian.
For the period of July 1, 2021 to December 31, 2021 (Successor Company)
Fee income was primarily driven by fees from the variable annuity block of business and COLI.
Total net investment income was primarily driven by strong limited partnership and other alternatives, as well as fixed maturities income.
Realized capital losses were primarily driven by macro hedge program losses.
Benefits and losses were primarily driven by the variable annuity block of business, COLI and interest credited.
Insurance operating costs and other expenses were primarily driven by operating costs. In addition, there were transaction costs related to the Sixth Street and Allianz transactions.
For the six months ended June 30, 2021 (Predecessor Company)
Fee Income was primarily driven by fees from the variable annuity block of business and COLI.
Total net investment income was primarily driven by fixed maturities and strong limited partnership and other alternatives income.
Realized capital losses were primarily driven by macro hedge program losses partially offset by net realized gains on sales.
Benefits and losses were primarily driven by operating costs.
For the year the ended December 31, 2020 (Predecessor Company)
Fee income decreased primarily due to lower COLI fees due to favorable mortality on experience rated business and the continued decline of the variable annuity block of business. Lower COLI fees are offset by favorable benefits and losses.
Total net investment income decreased primarily due to lower yields on fixed maturity investments resulting from lower reinvestment rates and lower yields on floating rate securities, and to a lesser extent, holding lower asset levels and fewer non-routine items. Also contributing to the decrease was lower income from limited partnerships and other alternative investments in the second quarter of 2020 which was a result of unfavorable impact on valuations from the economic impacts of the COVID-19 pandemic. For further discussion, see MD&A - Investments Results, Net Investment Income.
Lower net realized capital losses were primarily driven by lower variable annuity macro hedge program losses as well as higher interest rate derivatives gains and trading gains. For further information, see MD&A - Investment Results, Net Realized Capital Gains (Losses).
The deferred reinsurance gain is amortized into income over the life of the underlying policies reinsured.
Benefits and losses were due to lower death benefits and change in life reserves primarily due to lower death claims on the COLI business, release of a mortality contingency reserve and the continued decline of the variable annuity block of business, partially offset by an unlock charge. The unlock charge was primarily related to variable annuity assumptions updates, partially offset by updates to projected risk-based capital requirements, which affected the products' underlying additional reserves established through the purchase accounting fair value allocation process. Amortization of VOBA increased primarily due to an unlock charge.
Insurance operating costs and other expenses were lower primarily due to the continued decline of the variable annuity block of business and lower stand up costs.
Dividends to Policyholders increased due to surrenders of participating COLI policies. This is offset by the release of mortality contingency reserves.
INVESTMENT RESULTS
| | | | | | | | | | | | | | |
| Composition of Invested Assets |
| Successor Company |
| | December 31, 2022 | December 31, 2021 |
| | As Restated | | |
| | Amount | Percent | Amount | Percent |
| Fixed maturities, available-for-sale ("AFS"), at fair value | $ | 15,383 | | 67.5 | % | $ | 20,971 | | 77.1 | % |
| Fixed maturities, at fair value, using the fair value option ("FVO") | 331 | | 1.5 | % | — | | — | % |
| Equity securities, at fair value | 179 | | 0.8 | % | 203 | | 0.7 | % |
| Mortgage loans (net of allowance for credit losses ("ACL") of $15 and $12) | 2,520 | | 11.1 | % | 2,131 | | 7.8 | % |
| Policy loans, at outstanding balance | 1,495 | | 6.6 | % | 1,484 | | 5.5 | % |
| Limited partnerships and other alternative investments (portion at fair value: $58 and $0) | 1,300 | | 5.7 | % | 1,147 | | 4.2 | % |
| Other investments [1] | 95 | | 0.3 | % | 26 | | 0.1 | % |
| Short-term investments | 1,489 | | 6.5 | % | 1,254 | | 4.6 | % |
| Total investments | $ | 22,792 | | 100 | % | $ | 27,216 | | 100 | % |
[1] Primarily includes derivative instruments and real estate acquired in satisfaction of debt.
Total investments decreased since December 31, 2021 (Successor Company) primarily due to unrealized losses on fixed maturities, AFS due to lower valuations caused by rising interest rates and credit spreads during the year and decreases in retained assets under management. Partially offsetting this were increases from investments acquired through reinsurance from Guardian. In addition, there was a shift from fixed maturities to mortgage loans, limited partnerships and other alternative investments, as well as increases to short-term investments and cash to provide additional liquidity for strategic redeployments.
| | | | | | | | | | | | | | | | | | | | | | | | | | |
| Net Investment Income |
| Successor Company | Predecessor Company |
| For the Year Ended December 31, 2022 | For the Period of July 1, 2021 to December 31, 2021 | For the Six Months Ended June 30, 2021 | For the Year Ended December 31, 2020 |
|
| (Before-tax) | Amount | Yield [1] | Amount | Yield [1] | Amount | Yield [1] | Amount | Yield [1] |
| Fixed maturities [2] | $ | 620 | | 3.2 | % | $ | 174 | | 2.5 | % | $ | 243 | | 3.6 | % | $ | 518 | | 3.7 | % |
| Equity securities | 10 | | 5.1 | % | 10 | | 14.8 | % | 2 | | 5.3 | % | 7 | | 16.1 | % |
| Mortgage loans | 74 | | 3.1 | % | 32 | | 2.9 | % | 45 | | 4.2 | % | 92 | | 4.2 | % |
| Policy loans | 82 | | 3.9 | % | 36 | | 4.9 | % | 40 | | 5.4 | % | 82 | | 5.7 | % |
| Limited partnerships and other alternative investments | 168 | | 15.6 | % | 259 | | 50.9 | % | 216 | | 45.7 | % | 130 | | 14.3 | % |
| Other [3] | (146) | | | 1 | | | 1 | | | 13 | | |
| Investment expense | (30) | | | (14) | | | (13) | | | (26) | | |
| Total net investment income | $ | 778 | | 3.6 | % | $ | 498 | | 5.3 | % | $ | 534 | | 5.9 | % | $ | 816 | | 4.4 | % |
| | | | | | | | |
| | | | | | | | |
| Total net investment income, excluding limited partnerships and other alternative investments | $ | 610 | | 3.1 | % | $ | 239 | | 2.7 | % | $ | 318 | | 3.7 | % | $ | 686 | | 3.9 | % |
[1] Yields calculated using annualized net investment income divided by the monthly average invested assets at amortized cost as applicable, excluding repurchase agreement and securities lending collateral, if any, and derivatives book value. In addition, the yield calculation for the period of July 1, 2021 to December 31, 2021 (Successor Company) excludes assets acquired from the Allianz reinsurance agreement entered into on December 30, 2021.
[2] Includes net investment income on short-term investments and excludes amounts related to fixed maturities where the FVO was elected.
[3] Includes amounts related to the change in a modified coinsurance embedded derivative due to the change in the risk-free rate on the host contract.
Year ended December 31, 2022 (Successor Company)
Net investment income for the year ended December 31, 2022 was $778. Total net investment income was primarily driven by fixed maturities income and income from limited partnerships and other alternative investments primarily driven by valuations and cash distributions within private equity funds, partially offset by adjustments related to modified coinsurance embedded derivatives.
The annualized net investment income yield including limited partnerships and other alternative investments was 3.6% for the year ended December 31, 2022. Excluding limited partnerships other alternative investments and non-routine items, the annualized investment income yield was 3.1% for the same period.
The new money yield for the year ended December 31, 2022, excluding certain U.S. Treasury securities and cash equivalent securities, was approximately 4.5%, which was above the average yield of sales and maturities of 2.5% for the same period.
Period of July 1 to December 31, 2021 (Successor Company)
Total net investment income for the period of July 1, 2021 to December 31, 2021 was $498. Total net investment income was primarily impacted by greater income from limited partnerships and other alternative investments primarily driven by higher valuations and cash distributions within private equity funds, partially offset by a decrease in fixed maturities income due to greater amortization of premium due to book value being written up to market value as a result of pushdown accounting for the Sixth Street transaction, and continued lower yield on fixed maturities resulting from reinvesting at lower rates.
The annualized net investment income yield, excluding the Allianz coinsurance assets, limited partnerships and other alternative investments, was 2.7% for the period of July 1, 2021 to December 31, 2021. Excluding limited partnerships other alternative investments and non-routine items, the annualized investment income yield was 2.6% for the same period.
The new money yield for the period of July 1, 2021 to December 31, 2021, excluding certain U.S. Treasury securities and cash equivalent securities, was approximately 2.8%, which was above the average yield of sales and maturities of 2.1% for the same period.
Six months ended June 30, 2021 (Predecessor Company)
Total net investment income for the six months ended June 30, 2021 was $534. Total net investment income was primarily impacted by greater income from limited partnerships and other alternative investments primarily driven by higher valuations and sales of underlying investments within private equity funds, partially offset by a lower yield on fixed maturities resulting from reinvesting at lower rates and a lower yield on floating rate investments.
The annualized net investment income yield, excluding limited partnerships and other alternative investments, was 3.7% for the six months ended June 30, 2021. Excluding limited partnerships other alternative investments and non-routine items, the annualized investment income yield was 3.6% for the same period.
The new money yield for the six months ended June 30, 2021, excluding certain U.S. Treasury securities and cash equivalent securities, was approximately 2.5%, which was below the average yield of sales and maturities of 3.2% for the same period.
Year ended December 31, 2020 (Predecessor Company)
Total net investment income for the year ended December 31, 2020 was $816. Total net investment income decreased primarily due to lower yields on fixed maturity investments resulting from lower reinvestment rates and lower yields on floating rate securities, and to a lesser extent, holding lower asset levels and fewer non-routine items. Also contributing to the decrease was lower income from limited partnerships and other alternative investments in the second quarter of 2020, which was a result of unfavorable impact on valuations from the economic impacts of the COVID-19 pandemic.
The annualized net investment income yield, excluding limited partnerships and other alternative investments, and non-routine items, which primarily include mortgage loan pre-payments was 3.9% for the year ended December 31, 2020.
The new money yield for the year ended December 31, 2020, excluding certain U.S. Treasury securities, was approximately 3.2%, which was below the average yield of sales and maturities of 3.7% for the same period.
| | | | | | | | | | | | | | |
| Net Realized Capital Gains (Losses) |
| Successor Company | Predecessor Company |
| As Restated | | | |
| For the Year Ended December 31, 2022 | For the Period of July 1, 2021 to December 31, 2021 | For the Six Months Ended June 30, 2021 | For the Year Ended December 31, 2020 |
| (Before-tax) |
| Gross gains on sales | $ | 2 | | $ | 14 | | $ | 55 | | $ | 166 | |
| Gross losses on sales | (532) | | (20) | | (8) | | (32) | |
| Equity securities [1] | (19) | | 17 | | — | | 1 | |
| Net credit losses on fixed maturities, AFS | (1) | | — | | — | | (1) | |
| Change in ACL on mortgage loans | (3) | | — | | 6 | | (8) | |
| Intent-to-sell impairments [2] | — | | — | | — | | (6) | |
| | | | |
| Change in fair value of fixed maturities, FVO | (21) | | | | |
| Change in fair value of LPs and other alternative investments, FVO | 16 | | | | |
| FIA embedded derivative | 270 | | | | |
| FIA hedging program | (247) | | | | |
| GMWB derivatives, net | | | | 82 | |
| Variable annuity macro hedge program | (1) | | (67) | | (243) | | (414) | |
| Transactional foreign currency revaluation | — | | — | | — | | 3 | |
| Non-qualifying foreign currency derivatives | 7 | | 5 | | (2) | | (7) | |
| Modified coinsurance reinsurance derivative contracts | 809 | | 15 | | 22 | | (50) | |
| Other, net [3] | (290) | | 16 | | (72) | | 192 | |
| Net realized capital losses | $ | (10) | | $ | (20) | | $ | (242) | | $ | (74) | |
[1] The net unrealized gains (losses) on equity securities included in net realized capital gains (losses) related to equity securities still held as of December 31, 2022, were $(24) for the year ended December 31, 2022 (Successor Company). The net unrealized gains (losses) on equity securities included in net realized capital gains (losses) related to equity securities still held as of December 31, 2021, were $(3) for the period of July 1, 2021 to December 31, 2021 (Successor Company). The net unrealized gains (losses) on equity securities included in net realized capital gains (losses) related to equity securities still held as of June 30, 2021, were $1 for the six months ended June 30, 2021 (Predecessor Company). The net unrealized gains (losses) on equity securities included in net realized capital gains (losses) related to equity securities still held as of December 31, 2020 were $4 for year ended December 31, 2020 (Predecessor Company).
[2] See Credit Losses on Fixed Maturities, AFS and intent-to-sell Impairments within the Investment Portfolio Risks section of the MD&A.
[3] Includes gains (losses) on non-qualifying derivatives, excluding foreign currency derivatives, of $(303) for the year ended December 31, 2022 (Successor Company), $22 for the period of July 1, 2021 to December 31, 2021 (Successor Company), $(76) for the six months ended June 30, 2021 (Predecessor Company) and $199 for the year ended December 31, 2020 (Predecessor Company).
Gross Gains and Losses on Sales
•Gross gains and losses on sales for the year ended December 31, 2022 (Successor Company) were primarily driven by issuer specific selling within investment grade corporates and sales of U.S. Treasury securities for duration and/or liquidity management.
•Gross gains and losses on sales for the period of July 1, 2021 to December 31, 2021 (Successor Company) were primarily driven by issuer specific selling within investment grade corporates and sales of U.S. Treasury securities for duration and/or liquidity management.
•Gross gains and losses on sales for the six months ended June 30, 2021 (Predecessor Company) were primarily driven by sales of investment grade corporate securities, CMBS, and sales of U.S. Treasury securities for duration and/or liquidity management.
•Gross gains and losses on sales for the year ended December 31, 2020 (Predecessor Company) were primarily driven by issuer-specific sales and tenders of corporate securities and sales of U.S. Treasury securities for duration and/or liquidity management.
Variable Annuity Hedge Program
•For the year ended December 31, 2022 (Successor Company), losses on the macro hedge program was $1.
•For the period of July 1, 2021 to December 31, 2021 (Successor Company), losses on the macro hedge program were primarily due to losses of $50 driven by improvements in the equity markets, $46 driven by time decay of options and $32 driven by improvements in interest rates, partially offset by $27 due to equity volatility.
•For the six months ended June 30, 2021 (Predecessor Company), losses on the macro hedge program were primarily due to losses of $98 driven by improvements in the equity markets, $62 driven by improvements in interest rates and $67 driven by time decay of options.
•For the year ended December 31, 2020 (Predecessor Company), losses on the variable annuity macro hedge program were primarily due to losses of $564 driven by improvements in the equity markets and $69 driven by time decay of options, partially offset by $117 due to the transfer of derivatives from GMWB derivatives, net and $99 due to a decline in interest rates. These losses were partially offset by gains on the combined GMWB derivatives, net, which include the GMWB product derivatives and GMWB reinsurance contracts, primarily due to gains of $172 driven by improvements in the equity markets, $28 driven by equity volatility, $19 driven by a decline in interest rates and $11 due to assumption updates, partially offset by $117 due to the transfer of derivatives to the macro hedge program and $24 due to the correlation effect of market variables.
Modified coinsurance reinsurance derivative contracts
•For the year ended December 31, 2022 (Successor Company), net realized capital gains on modified coinsurance reinsurance derivative contracts, where the Company is the ceding entity, were primarily due to higher interest rates, which lowered the value of the underlying investments withheld from reinsurers. Modified coinsurance reinsurance contracts are accounted for as embedded derivatives and transfer to the reinsurer the investment experience related to the assets supporting the reinsured policies.
Other, net
•Other, net gains for the year ended December 31, 2022 (Successor Company), were primarily due to losses on interest rate derivatives driven by an increase in interest rates on swaps.
•Other, net gains for the period of July 1, 2021 to December 31, 2021 (Successor Company), were primarily due to gains on interest rate derivatives driven by a decrease in longer tenor interest rates, and gains associated with modified coinsurance reinsurance contracts driven by an increase in interest rates. Modified coinsurance reinsurance contracts are accounted for as embedded derivatives and transfer to the reinsurer the investment experience related to the assets supporting the reinsured policies.
•Other, net losses for the six months ended June 30, 2021 (Predecessor Company), were primarily due to losses on interest rate derivatives, partially offset by gains associated with modified coinsurance reinsurance contracts, both driven by an increase in interest rates.
•Other, net gains for the year ended December 31, 2020 (Predecessor Company), were primarily due to gains on interest rate derivatives partially offset by losses associated with modified coinsurance reinsurance contracts, both driven by a decrease in interest rates.
CRITICAL ACCOUNTING ESTIMATES
The preparation of financial statements, in conformity with accounting principles generally accepted in the United States of America ("U.S. GAAP"), requires management to make estimates and assumptions that affect the reported amounts of assets and liabilities and disclosure of contingent assets and liabilities at the date of the financial statements and the reported amounts of revenues and expenses during the reporting period. Actual results could differ materially from those estimates.
The Company has identified the following estimates as critical in that they involve a higher degree of judgment and are subject to a significant degree of variability:
•valuation of investments and derivative instruments, including the underlying investments within the funds withheld liability and embedded derivatives;
•deferred gain or acquisition cost related to reinsurance transactions;
•estimated gross profits ("EGPs") used in the valuation and amortization of assets (including VOBA) and liabilities associated with variable annuity, FIA, and other universal life-type contracts, as well as any deferred reinsurance amounts;
•valuation of living withdrawal benefits and FIAs required to be fair valued (in other policyholder funds and benefits payable);
•evaluation of credit losses on fixed maturities, AFS, intent to sell impairments, and ACL on mortgage loans;
•evaluation of goodwill and other intangible assets for impairment;
•valuation allowance on deferred tax assets; and
•contingencies relating to corporate litigation and regulatory matters.
Certain of these estimates are particularly sensitive to market conditions, and deterioration and/or volatility in the worldwide debt or equity markets could have a material impact on the Consolidated Financial Statements. In developing these estimates management makes subjective and complex judgments that are inherently uncertain and subject to material change as facts and circumstances develop. Although variability is inherent in these estimates, management believes the amounts provided are appropriate based upon the facts available upon compilation of the financial statements.
Valuation of Investments and Derivative Instruments, Including the Underlying Investments within the Funds Withheld Liability and Embedded Derivatives
Fixed Maturities, Equity Securities, Limited Partnerships and Other Alternative Investments for Which the Company has Elected the FVO, Short-term Investments and Freestanding and Embedded Derivatives
The Company generally determines fair values using valuation techniques that use prices, rates, and other relevant information evident from market transactions involving identical or similar instruments. Valuation techniques also include, where appropriate, estimates of future cash flows that are converted into a single discounted amount using current market expectations. The Company uses a "waterfall" approach comprised of the following pricing sources which are listed in priority order: quoted prices, prices from third-party pricing services, internal matrix pricing, and independent broker quotes. The fair value of freestanding derivative instruments is determined primarily using a discounted cash flow model or option model technique and incorporates counterparty credit risk. In some cases, quoted market prices for exchange-traded transactions and transactions cleared through central clearing houses ("OTC-cleared") may be used and in other cases independent broker quotes may be used. Valuations for certain limited partnerships and other alternative investments, FVO, is determined by updating the previous valuation and adjusting for current market factors. Valuations provided directly to the Company will be used in the event they become available as of the reporting date.
For further discussion, see the Fixed Maturities, Equity Securities, Short-term Investments, Limited Partnerships and Other Alternative Investments, FVO and Freestanding Derivatives section in Note 2 - Fair Value Measurements of Notes to Consolidated Financial Statements. For further discussion on the GMWB customized derivative valuation methodology, see the GMWB Embedded, Customized and Reinsurance Derivatives section in Note 2 - Fair Value Measurements of Notes to Consolidated Financial Statements.
Deferred Gain or Acquisition Cost Related to Reinsurance Transactions
Deferred gains or acquisition costs related to reinsurance transactions are amortized over the life of the underlying reinsured policies, using assumptions consistent with those used to account for these policies.
A deferred gain was recorded in other liabilities on the Consolidated Balance Sheets related to certain reinsurance agreements. The deferred gain related to the Guardian, TR Re and Allianz transactions was calculated based on the consideration received less consideration paid under the reinsurance agreements. The deferred gain related to Commonwealth Annuity was calculated based on the underlying contract values and adjusted to zero as a result of pushdown accounting on July 1, 2021.
Estimated Gross Profits
EGPs are used in the valuation and amortization of the VOBA asset. Portions of EGPs are also used in the valuation of reserves for death and other insurance benefit features on variable annuity and other universal life-type contracts, as well as certain deferred reinsurance amounts.
| | | | | | | | |
| Significant EGP-based Balances |
| Successor Company |
| As of December 31, |
| | 2022 | 2021 |
| VOBA [1] | $ | 508 | | $ | 479 | |
| Death and other insurance benefit reserves, net of reinsurance [2] | $ | 56 | | $ | 645 | |
| Deferred acquisition cost | $ | 11 | | $ | 23 | |
[1] For additional information on VOBA, refer to Note 6 - Value of Business Acquired and Deferred Acquisition Costs of Notes to Consolidated Financial Statements.
[2] For additional information on death and other insurance benefit reserves, refer to Note 8 - Reserves for Future Policy Benefits and Separate Account Liabilities of Notes to Consolidated Financial Statements.
| | | | | | | | | | | | | | |
| Benefit (Charge) to Income, Net of Tax, as a Result of Unlock [1] |
| Successor Company | Predecessor Company |
| For the Year Ended December 31, 2022 | For the Period of July 1, 2021 to December 31, 2021 | For the Six Months Ended June 30, 2021 | For the Year Ended December 31, 2020 |
| VOBA | $ | (34) | | $ | (73) | | $ | 14 | | $ | (64) | |
| Death and other insurance benefit reserves | (4) | | 2 | | (6) | | (25) | |
| Change in reserves (FIA) | (22) | | — | | — | | 18 | |
| | | | |
| Total (before tax) | (60) | | (71) | | 8 | | (71) | |
| Income tax effect | (13) | | (15) | | 2 | | (15) | |
| Total (after tax) | $ | (47) | | $ | (56) | | $ | 6 | | $ | (56) | |
[1] For further information, see Note 1 - Basis of Presentation and Significant Accounting Policies and Note 6 - Value of Business Acquired and Deferred Acquisition Costs of Notes to Consolidated Financial Statements.
The Unlock benefits (charges) in the table above includes both assumption unlocks and market unlocks.
Successor Company
The VOBA unlock charge, after-tax, for the year ended December 31, 2022, was primarily related to the reduction in future gross profits as a result of negative performance in the equity markets. The change in reserves unlock charge, after-tax, was driven by updates to projected future investment margins.
The VOBA unlock charge, after-tax, for the period of July 1, 2021 to December 31, 2021, was primarily related to the reduction in future gross profits associated with the related party reinsurance transaction with TR Re on December 30, 2021. For further information regarding the elimination of DAC and the establishment of VOBA during pushdown accounting, see Note 1 - Basis of Presentation and Significant Accounting Policies and Note 6 - Value of Business Acquired and Deferred Acquisition Costs of Notes to Consolidated Financial Statements.
Predecessor Company
The Unlock charge, after-tax, for the six months ended June 30, 2021, was primarily associated with separate account returns being above our aggregated estimated returns due to an increase in equity markets.
The Unlock charge, after-tax, for the year ended December 31, 2020 was primarily associated with updates to projected hedging costs and updates to variable annuity partial withdrawal assumptions, partially offset by separate account returns being above our aggregated estimated returns largely due to an increase in equity markets.
Use of Estimated Gross Profits in Amortization and Reserving
For variable annuity contracts, the Company estimates gross profits over 20 years as EGPs emerging subsequent to that time frame are immaterial. Future gross profits are projected over the estimated lives of the underlying contracts, based on future account value projections for variable annuity products. The projection of future account values requires the use of certain assumptions including: separate account returns; separate account fund mix; fees assessed against the contract holder’s account balance; full and partial surrender rates; interest credited; mortality; and annuitization rates. Changes in these assumptions and changes to other assumptions such as expenses and hedging costs cause EGPs to fluctuate, which impacts earnings.
Annual Unlock of Assumptions
In the third quarter of 2022, the Company completed a comprehensive policyholder behavior assumption study which includes assumptions related to VOBA, death and other insurance benefit reserves, and additional liability values established in the purchase fair value allocation process. This study resulted in a non-market related after-tax charge of $(7) to VOBA. Additionally, throughout the year, the Company evaluates various aspects of policyholder behavior and will revise its policyholder assumptions if credible emerging data indicates that changes are warranted. Upon completion of an annual assumption study or evaluation of credible new information, the Company will revise its assumptions to reflect its current best estimate. These assumption revisions will change the projected account values and the related EGPs in the VOBA amortization models and the death and other insurance benefit reserving model.
All assumption changes that affect the estimate of future EGPs, including the update of current account values and policyholder behavior assumptions, are considered an Unlock in the period of revision. An Unlock adjusts VOBA and death and other insurance benefit reserve balances on the Consolidated Balance Sheets with an offsetting benefit or charge on the Consolidated Statements of Operations in the period of the revision. An Unlock that results in an after-tax benefit generally occurs as a result of actual experience or future expectations of product profitability being favorable compared to previous estimates. An Unlock that results in an after-tax charge generally occurs as a result of actual experience or future expectations of product profitability being unfavorable compared to previous estimates.
EGPs are also used to determine the expected excess benefits and assessments included in the measurement of death and other insurance benefit reserves. The determination of death and other insurance benefit reserves is also impacted by discount rates, lapses, volatilities, mortality assumptions and benefit utilization, including assumptions around annuitization rates.
Aggregate Recoverability
After each quarterly Unlock, the Company also tests the aggregate recoverability of VOBA by comparing the VOBA balance to the present value of future EGPs. The margin between the VOBA balance and the present value of future EGPs for variable annuities was 45% as of December 31, 2022 (Successor Company). If the margin between the VOBA asset and the present value of future EGPs is exhausted, then further reductions in EGPs would cause portions of VOBA to be unrecoverable and the VOBA asset would be written down to equal future EGPs.
Living Benefits and Fixed Indexed Annuities Required to be Fair Valued
Fair values for variable annuity GMWBs and FIA benefits classified as embedded derivatives and included in other policyholder funds and benefits payable, are calculated using the income approach (for variable annuities) and the option budget approach (for FIAs) based upon internally developed models, because active, observable markets do not exist for those items. The fair value of these embedded derivatives and the related reinsurance are calculated as an aggregation of the following components: Best Estimate Benefits; Credit Standing Adjustment; Margins; and (for variable annuities only) Fees. The resulting aggregation is reconciled or calibrated, if necessary, to market information that is, or may be, available to the Company, but may not be observable by other market participants, including reinsurance discussions and transactions. The Company believes the aggregation of these components, as calibrated to the market information, results in an amount that the Company would be required to transfer to or receive from market participants in an active liquid market, if one existed, for those market participants to assume the risks associated with the GMWB and FIA benefits and the related reinsurance. The fair value is likely to materially diverge from the ultimate settlement of the liability as the Company believes settlement will be based on our best estimate assumptions rather than those best estimate assumptions plus risk margins. In the absence of any transfer of the benefit liability to a third party, the release of risk margins is likely to be reflected as realized gains in future periods’ net income.
A multidisciplinary group of finance, actuarial and risk management professionals review and approve changes to the Company's valuation model as well as associated controls.
For further discussion on the impact of fair value changes from living benefits see Note 2 - Fair Value Measurements of Notes to the Consolidated Financial Statements, and for a discussion on the sensitivities of certain living benefits due to capital market factors see Item 7, MD&A - Managing Equity Risk on Variable Annuity Products.
Evaluation of Credit Losses on Fixed Maturities, AFS, Intent-to-Sell Impairments and ACL on Mortgage Loans
Each quarter, a group of investment and accounting professionals evaluates investments to determine if a credit loss is present for fixed maturities, AFS or an ACL is required for mortgage loans. These evaluations are quantitative and qualitative processes, which are subject to risks and uncertainties. For further discussion of the accounting policies, see Note 1 - Basis of Presentation and Significant Accounting Policies of Notes to Consolidated Financial Statements. For a discussion of impairments recorded, see the Credit Losses on Fixed Maturities, AFS and Intent-to-Sell Impairments and ACL on Mortgage Loans sections within the Investment Portfolio Risks section of the MD&A.
Evaluation of Goodwill and Other Intangible Assets for Impairment
Goodwill and other intangible assets include the excess of the fair value of the net identifiable assets recorded in connection with acquisitions that have been pushed down to the Company, as well as indefinite lived assets that are not amortized. These non-amortizing intangible assets are reviewed for impairment at least annually, or more frequently if events occur or circumstances change that would indicate that a triggering event for a potential impairment has occurred. Intangible assets that do not have indefinite lives are amortized over their estimated useful lives. Each year, an annual goodwill and intangible asset impairment test is performed in the third quarter.
Valuation Allowance on Deferred Tax Assets
Deferred tax assets represent the tax benefit of future deductible temporary differences and tax credit carryforwards. Deferred tax assets are measured using the enacted tax rates expected to be in effect when such benefits are realized if there is no change in tax law. Under U.S. GAAP, we test the value of deferred tax assets for impairment on a quarterly basis at the entity level within each tax jurisdiction, consistent with our filed tax returns. Deferred tax assets are reduced by a valuation allowance if, based on the weight of available evidence, it is more likely than not that some portion, or all, of the deferred tax assets will not be realized. The determination of the valuation allowance for our deferred tax assets requires management to make certain judgments and assumptions. In evaluating the ability to recover deferred tax assets, we have considered all available evidence as of December 31, 2022 (Successor Company) including past operating results, forecasted earnings, future taxable income, and prudent and feasible tax planning strategies. In the event we determine it is more likely than not that we will not be able to realize all or part of our deferred tax assets in the future, an increase to the valuation allowance would be charged to earnings in the period such determination is made. Likewise, if it is later determined that it is more likely than not that those deferred tax assets would be realized, the previously provided valuation allowance would be reversed. Our judgments and assumptions are subject to change given the inherent uncertainty in predicting future performance and specific industry and investment market conditions.
As of December 31, 2022 and 2021 (Successor Company), the Company had no valuation allowance. In assessing the need for a valuation allowance, management considered future taxable temporary difference reversals, future taxable income exclusive of reversing temporary differences and carryovers, taxable income in open carry back years and other tax planning strategies. From time to time, tax planning strategies could include holding a portion of debt securities with market value losses until recovery, making investments which have specific tax characteristics, and business considerations such as asset-liability matching. Management views such tax planning strategies as prudent and feasible and would implement them, if necessary, to realize the deferred tax assets.
Contingencies Relating to Corporate Litigation and Regulatory Matters
Management evaluates each contingent matter separately. A loss is recorded if probable and reasonably estimable. Management establishes reserves for these contingencies at its “best estimate,” or, if no one number within the range of possible losses is more probable than any other, the Company records an estimated reserve at the low end of the range of losses.
The Company has a quarterly monitoring process involving legal and accounting professionals. Legal personnel first identify outstanding corporate litigation and regulatory matters posing a reasonable possibility of loss. These matters are then jointly reviewed by accounting and legal personnel to evaluate the facts and changes since the last review in order to determine if a provision for loss should be recorded or adjusted, the amount that should be recorded, and the appropriate disclosure. The outcomes of certain contingencies currently being evaluated by the Company, which relate to corporate litigation and regulatory matters, are inherently difficult to predict, and the reserves that have been established for the estimated settlement amounts are subject to significant changes. Management expects that the ultimate liability, if any, with respect to such lawsuits, after consideration of provisions made for estimated losses, will not be material to the consolidated financial condition of the Company. In view of the uncertainties regarding the outcome of these matters, as well as the tax-deductibility of payments, it is possible that the ultimate cost to the Company of these matters could exceed the reserve by an amount that would have a material adverse effect on the Company’s consolidated results of operations and liquidity in a particular quarterly or annual period.
ENTERPRISE RISK MANAGEMENT
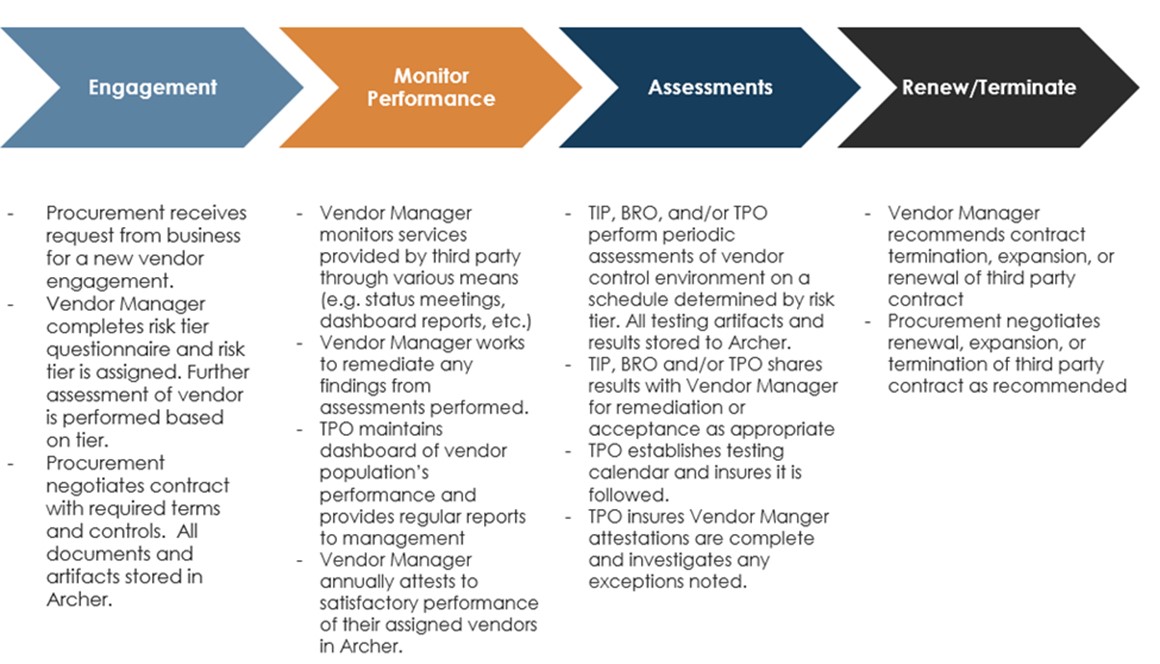
Since the business profile of Talcott Financial Group has grown significantly over the past two years through the addition of three new operating insurance companies in two new jurisdictions (i.e., two Bermuda insurers and one Cayman insurer), risk committees were streamlined and consolidated to efficiently and effectively manage risks on an enterprise basis as well as at each operating company in December 2022. The Talcott Resolution Life Insurance Company's Finance, Investment and Enterprise Risk Committee ("FIRMCo") was dissolved in December of 2022 and the responsibilities of the FIRMCo reverted to the Company’s Board. As such, the Company’s Board of Directors (“the Board”) has ultimate responsibility for risk oversight while management is tasked with the day-to-day management of the Company’s risks.
Enterprise management risk committees and working groups were established and consist of Talcott Resolution Life Insurance Company participants and participants from the other operating insurance companies. The EMRCC reports up to the Enterprise Risk Committee of the Talcott Financial Group Investments, LLC Board (“ERC”) and reports out to the Talcott Resolution Life Insurance Company Board of Directors.
The Company manages and monitors risk through risk policies, controls and limits. Talcott Resolution's risk profile, risk management practices, and adherence to risk limits are monitored and reported to the Board. The enterprise management risk committee and working groups provide oversight of specific risk areas.
| | | | | | | | | | | | | | | | | | | | | | | | | | | | | | | | | | | | | | | | | | | | | | | | | | | | | | | | | | | |
| | | | | Talcott Financial Group Investments, LLC Enterprise
Board Risk Committee | |
| | | | | | | | | | | | | | | | | | | |
| TL Board | | | Enterprise Risk Management Finance, Investment, Liquidity, Capital Committee ("EMRCC") | |
| | |
| | | | | | | | | | | | | | | | | | | |
| | | | | | | | | | | | | | | | | | | |
| | | | Enterprise Finance, Investment and Capital Working Group ("EFICWG") | | | | Enterprise Insurance Risk Working Group ("EIRWG") | | | | Enterprise Risk Governance Working Group ("ERGWG") | |
| | | | | | | | | | | | | | | | | | | |
| | | | | Policyholder Behavior Risk | | | | | Liquidity Risk | | | | | Emerging Risk | |
| | | | | | | | | Market and
Credit Risk | | | | | Operational Risk | |
| | | | | Mortality Risk | | | | | | | | | | |
| | | | | Longevity Risk | | | | | | | | | | | | | |
| | | | | Model Oversight | | | | | | | | | | | | | |
The Company's enterprise risk management ("ERM") function supports the ERC, Board of operating companies, and enterprise risk committees and working groups, and is tasked with, among other things:
• risk identification and assessment;
• the development of risk appetites, tolerances, and limits;
• risk monitoring; and
• internal and external risk reporting.
The Company categorizes its main risks as financial risk, operational risk, and insurance risk, each of which are described in more detail below.
Financial Risk Management
Financial risks include direct and indirect risks to the Company's financial objectives coming from events that impact market conditions or prices. Some events may cause correlated movement in multiple risk factors. The primary sources of financial risks are the Company's general account and separate account assets and the liabilities and the guarantees which the company has written over various liability products, particularly its fixed and variable annuities. Consistent with its risk appetite, the Company establishes financial risk limits to control potential loss on a U.S. statutory and economic basis. Exposures are actively monitored and mitigated where appropriate. The Company uses various risk management strategies, including reinsurance and over-the-counter and exchange traded derivatives with counterparties meeting the
appropriate regulatory and due diligence requirements. Derivatives are utilized to achieve one of four Company-approved objectives: hedging risk arising from interest rate, equity market, commodity market, credit spread and issuer default, price or currency exchange rate risk or volatility; managing liquidity; controlling transaction costs; or entering into synthetic replication transactions. Derivative activities are monitored and evaluated by the Company’s compliance and risk management teams and reviewed by senior management.
The Company identifies different categories of financial risk, including liquidity, credit, interest rate and equity as described below.
Liquidity Risk
Liquidity risk is the risk to current or prospective earnings or capital arising from the Company's inability or perceived inability to meet its contractual funding obligations when they come due.
Sources of Liquidity Risk
Sources of liquidity risk include funding risk, company-specific liquidity risk and market liquidity risk resulting from differences in the amount and timing of sources and uses of cash as well as company-specific and general market conditions. Stressed market conditions may impact the ability to sell assets or otherwise transact business and may result in a significant loss in value.
Impact
Inadequate capital resources and liquidity could negatively affect the Company’s overall financial strength and its ability to generate cash flows from its businesses, borrow funds at competitive rates, and raise new capital to meet operating and growth needs.
Management
The Company has defined ongoing monitoring and reporting requirements to assess liquidity across the enterprise under both current and stressed market conditions. The Company measures and manages liquidity risk exposures and funding needs within prescribed limits across legal entities, taking into account legal, regulatory and operational limitations to the transferability of liquidity. The Company also monitors internal and external conditions and identifies material risk changes and emerging risks that may impact liquidity. The Company's Treasurer has primary responsibility for liquidity risk.
For further discussion on liquidity, see the Liquidity Requirements and Sources of Capital section within Capital Resources and Liquidity.
Credit Risk
Credit risk is the risk to earnings or capital due to uncertainty of an obligor’s or counterparty’s ability or willingness to meet its obligations in accordance with contractually agreed upon terms. Credit risk is comprised of three major factors: the risk of change in credit quality, or credit migration risk; the risk of default; and the risk of a change in value due to changes in credit spread.
Sources of Credit Risk
The majority of the Company’s credit risk is concentrated in its investment holdings, but it is also present in the Company's derivative counterparty exposure, reinsurance transactions, and to a lesser extent variable annuity fund assets under management.
Impact
A decline in creditworthiness is typically associated with an increase in an investment’s credit spread, potentially resulting in an increase in credit losses and an increased probability of a realized loss upon sale. Derivative exposure and reinsurance recoverables are also subject to credit risk based on the counterparty’s unwillingness or inability to pay. The value of variable annuity fund assets under management can also be affected by an increase in investment credit spreads or defaults on underlying investments.
Management
The objective of the Company’s enterprise credit risk management strategy is to identify, quantify, and manage credit risk on an aggregate portfolio basis and to limit potential losses in accordance with an established credit risk management policy. The Company primarily manages its credit risk by holding a diversified mix of investment grade issuers and counterparties across its investment, reinsurance, and insurance portfolios. Potential losses are also limited within portfolios by diversifying across geographic regions, asset types and sectors.
The Company manages credit risk on an on-going basis through the use of various processes and analyses. Both the investment and reinsurance areas have formulated procedures for counterparty approvals and authorizations, which establish minimum levels of creditworthiness and financial stability. Credits considered for investment are subjected to underwriting reviews. Within the investment portfolio, private securities are subject to management approval. Mitigation strategies vary across the three sources of credit risk, but may include:
•Investing in a portfolio of high-quality and diverse securities;
•Selling investments subject to credit risk;
•Hedging through use of single name or basket credit default swaps;
•Clearing transactions through central clearing houses that require daily variation margin;
•Entering into contracts only with strong creditworthy institutions and
•Requiring collateral.
The Company has developed credit exposure thresholds which are based upon counterparty ratings. Aggregate counterparty credit quality and exposure is monitored on a monthly basis utilizing an enterprise-wide credit exposure information system that contains data on issuers, ratings, exposures, and credit limits. Exposures are tracked on a current and potential basis and aggregated by ultimate parent across investments, reinsurance receivables, insurance products with credit risk, and derivative counterparties.
As of December 31, 2022 (Successor Company) and 2021 (Successor Company), the Company had no investment exposure to any credit concentration risk of a single issuer, or derivative counterparty greater than 10% of the Company's stockholder's equity, other than the U.S. government and certain U.S. government securities. For further discussion of concentration of credit risk in the investment portfolio, see the Concentration of Credit Risk section in Note 3 - Investments of Notes to Consolidated Financial Statements.
Credit Risk of Derivatives
The Company uses various derivative counterparties in executing its derivative transactions. The use of counterparties creates credit risk that the counterparty may not perform in accordance with the terms of the derivative transaction. A reduction in the financial strength ratings as set by nationally recognized statistical agencies or a decline in the RBC ratio of the Company’s insurance operating companies may have adverse implications for its use of derivatives including those used to hedge benefit guarantees of variable annuities. Derivative counterparties for over-the-counter ("OTC") derivatives and clearing brokers for OTC-cleared derivatives have the right to cancel and settle outstanding derivative trades or require additional collateral to be posted if the Company's financial strength falls below certain thresholds. In addition, if the Company does not meet these thresholds, counterparties and clearing brokers may becoming unwilling to engage in or clear additional derivatives or may require collateralization before entering into any new trades. This would restrict the supply of derivative instruments commonly used to hedge variable annuity guarantees, particularly long-dated equity derivatives and interest rate swaps.
Managing the Credit Risk of Counterparties to Derivative Instruments
The Company has derivative counterparty exposure policies which limit the Company’s exposure to credit risk. The Company monitors counterparty exposure on a monthly basis to ensure compliance with Company policies and statutory limitations. The Company’s policies with respect to derivative counterparty exposure establishes market-based credit limits, favors long-term financial stability and creditworthiness of the counterparty and typically requires credit enhancement/credit risk reducing agreements, which are monitored and evaluated by the Company’s risk management team and reviewed by senior management.
The Company minimizes the credit risk of derivative instruments by entering into transactions with high quality counterparties primarily rated A or better. The Company also generally requires that OTC derivative contracts be governed by an International Swaps and Derivatives Association ("ISDA") Master Agreement, which is structured by legal entity and by counterparty and permits right of offset. The Company enters into credit support annexes in conjunction with the ISDA agreements, which require daily collateral settlement based upon agreed upon thresholds.
The Company has developed credit exposure thresholds which are based upon counterparty ratings. Credit exposures are measured using the market value of the derivatives, resulting in amounts owed to the Company by its counterparties or potential payment obligations from the Company to its counterparties. The notional amounts of derivative contracts represent the basis upon which pay or receive amounts are calculated and are not reflective of credit risk. For purposes of daily derivative collateral maintenance, credit exposures are generally quantified based on the prior business day’s market value and collateral is pledged to and held by, or on behalf of, the Company to the extent the current value of the derivatives exceed the contractual thresholds. In accordance with industry standard and the contractual agreements, collateral is typically settled on same business day. The Company has exposure to credit risk for amounts below the exposure thresholds which are uncollateralized, as well as for market fluctuations that may occur between contractual settlement periods of collateral movements.
Most of the Company's derivative counterparty relationships have a zero uncollateralized threshold. Currently, the Company only transacts OTC derivatives with two counterparties and in one legal entity where the collateralized thresholds to the Company is greater than zero. The maximum combined threshold in those relationships is $10. Based on the contractual terms of the collateral agreements, these thresholds may be immediately reduced due to a downgrade in the counterparty's credit rating. For further discussion, see the Derivative Commitments section of Note 11 - Commitments and Contingencies of Notes to Consolidated Financial Statements.
For the year ended December 31, 2022 (Successor Company), the Company incurred no losses on derivative instruments due to counterparty default.
Use of Credit Derivatives
The Company may also use credit default swaps to manage credit exposure or to assume credit risk to enhance yield. The Company uses credit derivatives to purchase credit protection with respect to a single entity, referenced index, or asset pool. The Company purchases credit protection through credit default swaps to economically hedge and manage credit risk of certain fixed maturity investments across multiple sectors of the investment portfolio. As of December 31, 2022 (Successor Company) and 2021 (Successor Company), the notional amount related to credit derivatives that purchase credit protection was $0 and $0, respectively, while the fair value was $0 for both years. These amounts do not include positions that are in offsetting relationships.
The Company may also enter into credit default swaps that assume credit risk as part of replication transactions. Replication transactions are used as an economical means to synthetically replicate the characteristics and performance of assets that are permissible investments under the Company’s investment policies. These swaps reference investment grade single corporate issuers and baskets, which include customized diversified portfolios of corporate issuers. These baskets are established within sector concentration limits and may be divided into tranches which possess different credit ratings. As of December 31, 2022 (Successor Company) and 2021 (Successor Company), the notional amount related to credit derivatives that assume credit risk was $500 and $100, respectively, while the fair value was $4 and $2, respectively. These amounts do not include positions that are in offsetting relationships.
For further information on credit derivatives, see Note 4 - Derivatives of Notes to Consolidated Financial Statements.
Interest Rate Risk
Interest rate risk is the risk of financial loss due to adverse changes in the value of assets and liabilities arising from movements in interest rates. Interest rate risk encompasses exposures with respect to changes in the level of interest rates, the shape of the term structure of rates and the volatility of interest rates. Interest rate risk does not include exposure to changes in credit spreads.
Sources of Interest Rate Risk
The Company has exposure to interest rates arising from its fixed maturity securities and interest sensitive liabilities. In addition, certain product liabilities, including those containing GMWB or GMDB, expose the Company to interest rate risk but also have significant equity risk. These liabilities are discussed as part of the Managing Equity Risk on Variable Annuity Products section. Management also evaluates performance of certain products based on net investment spread which is, in part, influenced by changes in interest rates.
Impact
Changes in interest rates from current levels can have both favorable and unfavorable effects for the Company.
| | | | | | | | | | | | | | |
| Change in Interest Rates | | Favorable Effects | | Unfavorable Effects |
| ñ | | Additional investment income | | Decrease in the fair value of the fixed maturity investment portfolio |
| Lower cost of the variable annuity hedge program | | Potential increase in policyholder surrenders, requiring the Company to liquidate assets in an unrealized loss position to fund liability surrender value |
| Lower margin erosion associated with minimum guaranteed crediting rates on certain products | | Potential impact on the Company's tax planning strategies |
| | | Higher interest expense |
| ò | | Increase in the fair value of the fixed maturity investment portfolio | | Lower net investment income due to reinvesting at lower investment yields |
| Lower interest expense | | Lower interest income on variable rate investments |
| | | Acceleration in paydowns and prepayments or calls of certain mortgage-backed and municipal bonds |
| | | Increased cost of variable annuity hedge program |
| | | Potential margin erosion associated with minimum guaranteed crediting rates on certain products |
Management
The Company primarily manages its exposure to interest rate risk by constructing investment portfolios that maintain asset allocation limits and asset/liability duration matching targets which may include the use of derivatives. The Company analyzes interest rate risk using various models including parametric models and cash flows simulation under various market scenarios of the liabilities and their supporting investment portfolios. Key metrics that the Company uses to quantify its exposure to interest rate risk inherent in its invested assets and interest rate sensitive liabilities include duration, convexity and key rate duration.
The Company may also utilize a variety of derivative instruments to mitigate interest rate risk associated with its investment portfolio or to hedge liabilities. Interest rate caps, floors, swaps, swaptions and futures may be used to manage portfolio duration. Interest rate swaps are primarily used to convert interest receipts or payments to a fixed or variable rate. The use of such swaps enables the Company to customize contract terms and conditions to desired objectives and manage the duration profile within established tolerances. Interest rate swaps are also used to hedge the variability in the cash flow of a forecasted purchase or sale of fixed rate securities due to changes in interest rates.
As of December 31, 2022 (Successor Company) and 2021 (Successor Company), notional amounts pertaining to derivatives utilized to manage the interest rate risk of investments, including offsetting positions, totaled $1.6 billion and $3.2 billion, respectively. The fair value of these derivatives was $(1) and $(7) as of December 31, 2022 (Successor Company) and 2021 (Successor Company), respectively. These amounts do not include derivatives associated with the Variable Annuity Hedging Program.
Assets and Liabilities Subject to Interest Rate Risk
Fixed Income Investments
The fair value of fixed income investments, which include fixed maturities, commercial mortgage loans, and short-term investments, was $19.7 billion at December 31, 2022 (Successor Company) and $24.4 billion at December 31, 2021 (Successor Company), respectively. The weighted average duration of the portfolio, including derivative instruments, was approximately 6.7 years as of December 31, 2022 (Successor Company) and 8.3 years as of December 31, 2021 (Successor Company).
Liabilities
The Company’s issued investment contracts and certain insurance product liabilities, other than non-guaranteed separate accounts, include asset accumulation vehicles such as fixed annuities, guaranteed investment products, and other investment and universal life-type contracts. The primary risk associated with these products is that, despite the use of market value adjustment features and surrender charges, the spread between investment return and credited rate may not be sufficient to earn targeted returns.
Asset accumulation vehicles primarily require a fixed rate payment, often for a specified period of time, and fixed rate annuities contain surrender values that are based upon a market value adjusted formula if held for shorter periods. As of December 31, 2022 (Successor Company) and 2021 (Successor Company), the Company had $3.0 billion and $2.7 billion, respectively, of liabilities for fixed annuities predominantly with 3% minimum interest guarantees.
In addition, certain products such as COLI contracts and the general account portion of variable annuity products credit interest to policyholders subject to market conditions and minimum interest rate guarantees. As of both December 31, 2022 (Successor Company) and 2021 (Successor Company), the Company had $1.7 billion of general account COLI account value, with minimum interest guarantees on unloaned account value ranging from 4.0% to 4.5%. As of December 31, 2022 (Successor Company) and 2021 (Successor Company), the general account portion of the variable annuity contracts was $3.0 billion and $2.6 billion, respectively, with minimum guarantees ranging from 1.5% to 4.0%.
The Company's issued non-investment type contracts include structured settlement contracts, terminal funding agreements, and on-benefit payout annuities (i.e., the annuitant is currently receiving benefits). The cash outflows associated with these policy liabilities are not interest rate sensitive but do vary based on actual to expected mortality experience. Similar to investment-type products, the aggregate cash flow payment streams are relatively predictable. Products in this category may rely upon actuarial pricing assumptions (including mortality and morbidity) and have an element of cash flow uncertainty. Additionally, due to the long duration of these liabilities, these products are subject to reinvestment risk. As of December 31, 2022 (Successor Company) and 2021 (Successor Company), the Company had $12.6 billion and $12.9 billion, respectively, of liabilities for combined structured settlements and terminal funding agreements and $1.5 billion and $1.6 billion, respectively, of liabilities for on-benefit payout annuities.
Interest Rate Sensitivity
Fixed Liabilities and the Invested Assets Supporting Them
Included in the following table is the before-tax change in the net economic value of investment contracts including structured settlements, fixed annuity contracts and terminal funding agreements for which the payment rates are fixed at contract issuance and/or the investment experience is substantially absorbed by the Company’s operations, along with the corresponding invested assets. Also included in this analysis are the interest rate sensitive derivatives used by the Company to hedge its exposure to interest rate risk in the investment portfolios supporting these contracts. Note that for purposes of the sensitivities outlined below, the net economic value is shown, which is net of reinsurance and is the difference between the change in the market value of the assets, and the change in the market value of the liabilities utilizing the Company's internal methodology for calculating economic value.
The calculation of the estimated hypothetical change in net economic value below assumes a 100 basis point upward and downward parallel shift in the yield curve.
| | | | | | | | | | | | | | |
| Change in Net Economic Value as of December 31, |
| Successor Company |
| Interest Rate Sensitivity of Fixed Liabilities and Invested Assets Supporting Them | As of December 31, 2022 | As of December 31, 2021 |
| Basis point shift | -100 | +100 | -100 | +100 |
| Increase (decrease) in economic value, before tax | $ | (9) | | $ | (7) | | $ | (712) | | $ | 487 | |
The carrying value of fixed maturities, commercial mortgage loans and short-term investments related to the businesses included in the table above was $19.6 billion and $20.7 billion, as of December 31, 2022 (Successor Company) and 2021 (Successor Company), respectively. The assets supporting the fixed liabilities are monitored and managed within set duration guidelines, and are evaluated on a daily basis, as well as annually using scenario simulation techniques in compliance with regulatory requirements. For further discussion on the reinsurance agreements with Commonwealth and the impact to invested assets, please see Item 7, MD&A - Investment Results, Composition of Invested Assets.
Invested Assets Not Supporting Fixed Liabilities
The following table provides an analysis showing the estimated before-tax change in the fair value of the Company’s investments and related derivatives, excluding assets supporting fixed liabilities which are included in the table above, assuming 100 basis point upward and downward parallel shifts in the yield curve as of December 31, 2022 (Successor Company) and 2021 (Successor Company).
| | | | | | | | | | | | | | |
| Change in Fair Value as of December 31, |
| Successor Company | Predecessor Company |
| Interest Rate Sensitivity of Invested Assets Not Supporting Fixed Liabilities | As of December 31, 2022 | As of December 31, 2021 |
| Basis point shift | -100 | +100 | -100 | +100 |
| Increase (decrease) in fair value, before tax | $ | 207 | | $ | (158) | | $ | 311 | | $ | (293) | |
The carrying value of fixed maturities, commercial mortgage loans and short-term investments related to the businesses included in the table above was $2.0 billion and $2.5 billion, as of December 31, 2022 (Successor Company) and 2021 (Successor Company), respectively.
The selection of the 100 basis point parallel shift in the yield curve was made only as an illustration of the potential hypothetical impact of such an event and should not be construed as a prediction of future market events. Actual results could differ materially from those illustrated above due to the nature of the estimates and assumptions used in the above analysis. The Company’s sensitivity analysis calculation assumes that the composition of invested assets and liabilities remain materially consistent throughout the year and that the current relationship between short-term and long-term interest rates will remain constant over time. As a result, these calculations may not fully capture the impact of portfolio re-allocations, significant product sales or non-parallel changes in interest rates.
Equity Risk
Equity risk is the risk of financial loss due to changes in the value of global equities or equity indices, alternative investment models, private equities and hedge funds.
Sources of Equity Risk
The Company has exposure to equity risk from general account assets, variable annuity fund assets under management, embedded derivatives within the Company’s variable annuity products and the Company's FIA and variable annuity reinsurance treaties. The Company’s variable products are significantly influenced by the U.S. and other equity markets, as discussed below.
Impact of Equity Risk on General Account Products
Declines in equity markets may result in losses due to sales or reductions in market value that are recorded within reported earnings. Declines in equity markets may also decrease the value of limited partnerships and other alternative investments or result in losses on derivatives, including on embedded product derivatives, thereby negatively impacting our reported earnings.
Managing Equity Risk on Fixed Indexed Annuity Products
The Company has reinsurance treaties in place with Allianz on blocks of fixed indexed annuities. In these contracts, interest is credited based on the performance of an index, generally equity-related. As part of the treaties, the Company has a contractual agreement with Allianz whereby the Company pays Allianz an option budget and Allianz provides corresponding index credits based on actual market performance. Allianz bears the primary risk of slippage to the extent that the hedges they purchase with the option budget do not provide sufficient index credits. A portion of this business has been retroceded to our parent company TR Re.
Impact
The Company retains some equity risk from the fixed indexed annuity block. Generally, declines in equity markets will:
•Reduce the value of the index credits that Allianz will provide, while also reducing the potential index credits to be credited to the annuity block;
•Reduce the carrying value of the index credit receivable from the Allianz hedging agreement, potentially resulting in a need to increase funding of the reinsurance trust; and
•Increase the Company’s liability for guaranteed payouts, as future payouts will be offset by lower account value.
Managing Equity Risk on Variable Annuity Products
Most of the Company’s variable annuities, including the variable annuity contracts reinsured through the GIAC reinsurance treaty, include GMDB and certain contracts with GMDB also include GMWB features. The Company also has a reinsurance treaty in place in which it reinsures a block of riders on Lincoln variable annuity contracts.
Impact
The Company’s variable annuity contracts are significantly influenced by the U.S. and other equity markets. Generally, declines in equity markets will:
•reduce the value of assets under management and the amount of fee income generated from those assets;
•increase the value of derivative assets used to hedge product guarantees and fee income resulting in realized capital gains;
•increase the costs of the hedging instruments we use in our hedging program;
•increase the Company’s net amount at risk ("NAR"), described below, for GMDB and GMWB;
•increase the amount of required assets to be held backing variable annuity guarantees to maintain required regulatory reserve levels and targeted risk-based capital ratios; and
•decrease the Company’s estimated future gross profits, resulting in a VOBA unlock charge.
Increases in equity markets will generally have the inverse impact of those listed in the preceding discussion.
Declines in the equity markets will increase the Company’s liability for these benefits. Many contracts with a GMDB include a MAV, which in rising markets resets the guarantee on the anniversary to be "at the money". As the MAV increases, it can increase the NAR for subsequent declines in account value. Generally, a GMWB contract is "in the money" if the contractholder’s GRB becomes greater than the account value.
The NAR is generally defined as the guaranteed minimum benefit amount in excess of the contractholder’s current account value. Variable annuity account values with guarantee features were $32.9 billion and $34.3 billion as of December 31, 2022 (Successor Company) and 2021 (Successor Company), respectively.
The following tables summarize the account values of the Company’s variable annuities with guarantee features and the NAR split between various guarantee features (retained net amount at risk is net of reinsurance, but does not take into consideration the effects of the variable annuity hedge programs currently in place as of each balance sheet date).
| | | | | | | | | | | | | | | | | |
| Total Variable Annuity Guarantees as of December 31, 2022 |
| Successor Company |
| ($ in billions) | Account Value | Gross Net Amount at Risk | Retained Net Amount at Risk | % of Contracts In the Money [2] | % In the Money
[2][3] |
| Variable Annuity [1] | | | | | |
| GMDB [4] | $ | 32.9 | | $ | 4.2 | | $ | 1.0 | | 60 | % | 17 | % |
| GMWB | 18.6 | | 0.4 | | 0.2 | | 9 | % | 17 | % |
| | | | | | | | | | | | | | | | | |
| Total Variable Annuity Guarantees as of December 31, 2021 |
| Successor Company |
| ($ in billions) | Account Value | Gross Net Amount at Risk | Retained Net Amount at Risk | % of Contracts In the Money [2] | % In the Money
[2][3] |
| Variable Annuity [1] | | | | | |
| GMDB [4] | $ | 34.3 | | $ | 2.2 | | $ | 0.2 | | 15 | % | 21 | % |
| GMWB | 14.5 | | 0.1 | | — | | 3 | % | 23 | % |
[1] Contracts with a guaranteed living benefit also have a guaranteed death benefit. The NAR for each benefit is shown; however these benefits are not additive.
[2] Excludes contracts that are fully reinsured.
[3] For all contracts that are “in the money”, this represents the percentage by which the average contract was "in the money".
[4] Excludes contracts without a GMDB due to certain elections made by policyholders or their beneficiaries. Such contracts had $2.6 billion and $3.0 billion of account value as of December 31, 2022 (Successor Company) and 2021 (Successor Company), respectively.
Many policyholders with a GMDB also have a GMWB. These benefits are not additive. Policyholders that have a product with both guarantees can receive, at most, the greater of the GMDB or GMWB. The GMDB NAR disclosed in the preceding tables is a point in time measurement and assumes that all participants utilize the GMDB on that measurement date.
The Company expects to incur GMDB payments in the future only if the policyholder has an "in the money" GMDB at their death. For policies with a GMWB rider, the company expects to incur GMWB payments in the future only if the account value is reduced over time to a specified level through a combination of market performance and periodic withdrawals, at which point the contractholder will receive an annuity with total payments equal to the GRB which is generally equal to premiums less withdrawals. For the Company’s “lifetime” GMWB products, this annuity can have total payments exceeding the GRB. As the account value fluctuates with equity market returns on a daily basis and the “lifetime” GMWB payments may exceed the GRB, the ultimate amount to be paid by the Company, if any, is uncertain and could be significantly more or less than the Company’s current carried liability. For additional information on the Company’s GMWB liability, see Note 2 - Fair Value Measurements of Notes to Consolidated Financial Statements. For additional information on the Company's GMDB liability, see Note 8 - Reserves for Future Policy Benefits and Separate Account Liabilities of Notes to Consolidated Financial Statements.
Variable Annuity Market Risk Exposures
The following table summarizes the broad variable annuity guarantees offered by the Company and the market risks to which the guarantee is most exposed from a U.S. GAAP accounting perspective.
| | | | | | | | |
| Variable Annuity Guarantees [1] | U.S. GAAP Treatment [1] | Primary Market Risk Exposures [1] |
| GMDB and life-contingent component of the GMWB | Accumulation of the portion of fees required to cover expected claims, less accumulation of actual claims paid | Equity Market Levels / Interest Rates |
| GMWB (excluding life-contingent portions) | Fair value | Equity Market Levels / Implied Volatility / Interest Rates |
[1] Each of these guarantees and the related U.S. GAAP accounting volatility will also be influenced by actual and estimated policyholder behavior.
Risk Hedging
Variable Annuity Hedging Program
Through the use of reinsurance, capital market derivatives and other derivative instruments, the Company’s variable annuity hedging program is primarily focused on reducing the economic exposure to market risks associated with guaranteed benefits that are embedded in the variable annuity contracts that we have written directly or acquired via reinsurance. The variable annuity hedging program also considers the potential impacts on statutory capital.
Reinsurance
The Company uses reinsurance for a portion of GMWB risks. The Company also uses reinsurance for a portion of GMDB risks, where the GMDB is higher than a return of premium death benefit or account value benefit.
Macro Hedge Program
The Company’s macro hedging program is designed to hedge risk pertaining to variable annuity exposures, including GMWB and GMDB liabilities, protect expected fee revenue to be received on variable annuity contracts, and reduce statutory reserve and capital volatility. The macro hedge program uses interest rate swaps, swaptions, and futures, and equity swaps, options, forwards, and futures on certain indices including the S&P 500 index, EAFE index, NASDAQ 100 index and Russell 2000 index. Additionally, for a portion of 2021, the Company held customized capital market derivative contracts to provide protection from certain capital market risks for the remaining term of specified blocks of GMWB riders written on a direct basis. These customized derivative contracts were based on policyholder behavior assumptions specified at the inception of the derivative contracts. The Company retained the risk for differences between assumed and actual policyholder behavior and between the performance of the actively managed funds underlying the separate accounts and their respective indices.
Management assesses the risks under various deterministic and stochastic scenarios in designing and executing the macro hedge program. The increased U.S. GAAP earnings volatility may result from factors including, but not limited to: policyholder behavior, capital markets, divergence between the performance of the underlying funds and the hedging indices, changes in hedging positions and the relative emphasis placed on various risk management objectives. Additionally, the hedge program will result in U.S. GAAP earnings volatility as changes in the value of the macro hedge derivatives may not be closely aligned to changes in U.S. GAAP liabilities.
Variable Annuity Hedging Program Sensitivities
The underlying guaranteed withdrawal benefit liabilities (excluding the life contingent portion of GMWB contracts) and hedge assets within the GMWB hedge and macro hedge programs are carried at fair value.
The following table presents our estimates of the potential instantaneous impacts from sudden market stresses related to equity market prices, interest rates and implied market volatilities. The following sensitivities represent: (1) the net estimated difference between the change in the fair value of GMWB liabilities and the underlying hedge instruments and (2) the estimated change in fair value of the hedge instruments for the macro program, before the impacts of amortization of VOBA and taxes. As noted in the preceding discussion, certain hedge assets are used to hedge liabilities that are not carried at fair value and will not have a liability offset in the U.S. GAAP sensitivity analysis. All sensitivities are measured as of December 31, 2022 (Successor Company) and are related to the fair value of liabilities and hedge instruments in place at that date for the Company’s variable annuity hedge programs. The impacts presented in the table that follows are estimated individually and measured without consideration of any correlation among market risk factors.
| | | | | | | | | | | |
| Sensitivity Analysis (before tax and VOBA) as of December 31, 2022 (Successor Company) [1] |
| Variable Annuity Macro Hedge Program |
| Equity market return | -20 | % | -10 | % | 10 | % |
| Potential net fair value impact | $ | 438 | | $ | 216 | | $ | (176) | |
| Interest rates | -50bps | -25bps | +25bps |
| Potential net fair value impact | $ | 46 | | $ | 23 | | $ | (22) | |
| Implied volatilities | 10 | % | 2 | % | -10 | % |
| Potential net fair value impact | $ | 192 | | $ | 38 | | $ | (174) | |
[1] These sensitivities are based on the following key market levels as of December 31, 2022 (Successor Company): 1) S&P of 3,840; 2) 10 year U.S. swap rate of 3.84%; and 3) S&P 10 year volatility of 23.88%.
The preceding sensitivity analysis is an estimate and should not be used to predict the future financial performance of the Company's variable annuity hedge programs. The actual net changes in the fair value liability and the hedging assets illustrated in the preceding table may vary materially depending on a variety of factors which include but are not limited to:
•The sensitivity analysis is only valid as of the measurement date and assumes instantaneous changes in the capital market factors and no ability to re-balance hedge positions prior to the market changes;
•Changes to the underlying hedging program, policyholder behavior, and variation in underlying fund performance relative to the hedged index, which could materially impact the liability; and
•The impact of elapsed time on liabilities or hedge assets, any non-parallel shifts in capital market factors, or correlated moves across the sensitivities.
Operational Risk
Operational risk is the risk of loss resulting from inadequate or failed internal processes, people, and systems, or from external events.
The Company has classified operational risk into the following risk categories:
| | | | | |
• Business Resiliency • Claims • Corporate Governance • Cyber and Information Protection •Disaster Recovery • Environmental, Social and Governance ("ESG") • Financial Operations • Fraud | • Human Resources •Legal, Compliance and Tax • Model Risk • Operations • Product Risk (In-force and New Business) • Technology • Third-Party (Vendor) |
Sources of Operational Risk
Operational risk is inherent in all aspects of the Company's business and functional areas.
Impact
Operational risk can result in financial loss, disruption of the Company's business, regulatory actions or damage to the Company's reputation.
Management
Responsibility for day-to-day management of operational risk lies within each functional area. ERM is responsible for establishing, maintaining and communicating the framework, principles and guidelines of the Company's operational risk management program. In addition, ERM, as a second line of defense, provides an independent enterprise view and assessment of operational risks that the Company faces. Operational risk mitigation strategies include the following:
•Establishing policies and monitoring risk tolerances and exceptions;
•Conducting business risk self-assessments and implementing action plans where necessary;
•Validating existing crisis management protocols;
•Identifying and monitoring emerging operational risks; and
•Purchasing insurance coverage.
Business Resiliency
The Company has a developed business resiliency program that is consistent with industry best practices that provides reasonable assurance that the Company is prepared for, and can recover from, emergencies and disasters. Foundational elements of the Company’s business resiliency strategy consist of a lead Business Resiliency Officer, a business resilience program, business continuity plans, IT disaster recovery plans, a pandemic response plan, an Emergency Response Plan, a Crisis Management Team ("CMT"), and a Crisis Management Plan.
The Company's Business Resiliency Office proactively monitors events at the local, regional, and national levels and when necessary will be responsible for executing a response to a potential significant business disruption.
To provide resiliency against an event, the Company uses a portfolio of resiliency plans to safeguard the Company’s business functions, information systems, personnel, data, and facilities. The Business Continuity Plans ("BCP") are updated annually and are maintained across business units in accordance with established organizational policies and standards to ensure a constant state of readiness as well as to ensure that services can be recovered within reasonable timeframes and to acceptable levels in the event of a disruption or catastrophe.
Cybersecurity Risk
Talcott Resolution’s Chief Information Security Officer (CISO) has overall responsibility for Talcott Resolution’s Information Protection Program.
The Company has implemented an information protection with established governance routines that promote an adaptive approach for assessing and managing risks. The Company has invested to build a ‘defense-in-depth’ strategy that uses multiple security measures to protect the integrity of the Company's information assets. This ‘defense-in-depth’ strategy aligns to the National Institute of Standards and Technology ("NIST") Cyber Security Framework and provides preventative, detective and responsive measures that collectively protects the Company. Various cyber assurance methods, including security metrics, third party security assessments, external penetration testing, vulnerability scanning, and cyber war game incident response exercises are used to test the effectiveness of the overall cybersecurity control environment.
Members of Talcott Resolution’s ERM, Legal and Compliance, and Internal Audit teams work with the CISO and members of the Talcott Resolution’s Information Protection team to ensure that required policies exist and are tested as necessary.
Talcott Resolution’s current operating model retains some security services in-house, uses industry leading third parties to provide certain managed security capabilities and other third parties for consulting services, as shown in the chart below.
| | | | | | | | | | | | | | |
| Information Protection Governance |
| Internal Services | | Managed Services | | Third-party Services |
| Regulatory Compliance | | Network Security (Firewalls) | | Incident Response Forensics |
| Security Policies | | Endpoint Detection & Response | | Penetration Testing |
| Third-party Security Cyber Risk | | Network Detection & Response | | Independent Risk Assessments |
| Data Classification | | Threat Hunting | | |
| Incident Response | | Patching | | |
| Email Security | | Data Loss Prevention | | |
| Application Security | | DDoS Protection | | |
| Security Training | | Web Application Firewall | | |
| Security Consulting | | Email Phish Testing | | |
| Access Management | | | | |
| Audit Log Management ("SIEM") | | | | |
| Vulnerability Scanning & Remediation | | | | |
The Company has implemented information protection and privacy programs with established governance routines that promote an adaptive approach for assessing and managing risks. The Company has invested to build a ‘defense-in-depth’ strategy that uses multiple security measures to protect the integrity of the Company's information assets. This ‘defense-in-depth’ strategy aligns to the National Institute of Standards and Technology ("NIST") Cyber Security Framework and provides preventative, detective and responsive measures that collectively protects the Company. Various cyber assurance methods, including security metrics, third party security assessments, external penetration testing, vulnerability scanning, and cyber war game exercises are used to test the effectiveness of the overall cybersecurity control environment.
The Company, like many other large financial services companies, blocks attempted cyber intrusions on a daily basis. In the event of a cyber intrusion, the company invokes its Cyber Incident Response Program commensurate with the nature of the intrusion. While the actual methods employed differ based on the event, the approach employs internal teams and outside advisors with specialized skills to support the response and recovery efforts and requires elevation of issues, as necessary, to senior management.
From a governance perspective, senior members of our Enterprise Risk Management, Information Protection and Internal Audit functions provide detailed reports on cybersecurity matters to the Company's Board, including the Audit Committee, which has principal responsibility for oversight of cybersecurity risk, and/or the Board, which oversees controls for the Company's major risk exposures. The topics to be covered by these updates include the Company's activities, policies and procedures to prevent, detect and respond to cybersecurity incidents, as well as lessons learned from cybersecurity incidents and internal and external testing of our protection measures. The Audit Committee will meet at each regular Board meeting and will be briefed on cyber risks at least annually.
COVID-19 Response
Talcott Resolution has a centralized control structure for crisis management and a cross-functional Crisis Management Team (CMT). The CMT coordinated Talcott’s COVID-19 response. Beginning in May 2022, Talcott Resolution returned to the office on a hybrid schedule. As the pandemic evolves, Talcott will continue to monitor conditions and will adjust its health and safety protocols as needed.
Vendor Risk Management
Talcott Resolution maintains a Vendor Oversight Policy that provides an end-to-end control structure for Talcott Resolution’s vendor relationships. The Policy is designed to:
•Establish processes and controls during the contracting process to provide for reasonable information protection standards and Talcott Resolution’s right to monitor those standards.
•Define roles and requirements within Talcott Resolution’s business units to ensure effective ongoing management of third-party relationships and performance.
•Describe the process for regular risk-based reviews of third parties.
•Establish a governing oversight framework to ensure all phases of the third-party oversight are followed and functioning effectively.
•Provide a clear process for escalation and review of significant risks or performance issues.
To accomplish this, the Policy has assigned all of Talcott Resolution’s vendors and third parties risk ratings. A vendor’s risk rating is determined based on the following criteria: access to Talcott Resolution’s network and systems, process reliance, data sensitivity and criticality. Talcott Resolution has three vendor tier levels.
| | | | | | | | |
| High Risk | Medium Risk | Low Risk |
| Provides the most critical services or products | Provides essential, bot nut critical, services or products | Provides necessary services or products |
| Has the highest risk factors (e.g. access to PII, offshore network access/data storage, etc.) | Has medium risk factors (e.g. access to company confidential data, domestic network access/data storage etc.) | Has the lowest risk factors (e.g. no data access, no network connectivity, etc.) |
| Robust control environment | Enhanced control environment (e.g. regular reports, assessments at engagement and reevaluated every 3 years, etc.) | Control environment equal to risk (e.g. reporting as needed, risk evaluation at engagement and contract renewal, etc.) |
| Vendors are assessed on a biennial schedule | | |
New vendors are assigned risk ratings at the time of engagement based on a risk rating questionnaire completed by designated risk assessors.
The Program establishes defined roles and responsibilities for each phase of the vendor life cycle. These roles include:
•Head of Vendor Management: Day-to-day management of the Program. They ensure adherence and effective execution of the program for all phases and makes regular status reports to leadership.
•Procurement: Solicits RFP’s from the market upon identification of a need by the business. Procurement negotiates and drafts initial contract terms and any subsequent renewals or expansions of work. They also ensure payment of invoices.
•Talcott Resolution Information Protection and Business Resiliency Governance: Assesses the respective information security and resiliency capability of third parties.
•Vendor Managers: Monitor and manage the day-to-day performance of a third party or vendor.
Below is the typical life cycle for Talcott Resolution’s vendors.
Insurance Risks - Policyholder Behavior, Mortality and Longevity Risk Management
Insurance risks exist in the form of adverse policyholder behavior, mortality, and longevity risks that can affect value within our underlying annuity products.
Policyholder behavior risk is the risk of policyholders utilizing benefits/options within their annuity contracts in a manner or to a degree different than the Company's current expectations.
Additional insurance risks that exist within the annuity products covered by the Company include mortality and longevity risk. Mortality and longevity risk are contingent risks on variable annuity products. The impact of higher or lower mortality only impacts these products to the extent the equity markets perform below longer term market growth expectations, thus increasing the guaranteed benefit amounts and exposing the Company to withdrawal benefit or death benefit guarantees that exceed the variable annuity account value during the payout phase or at death.
Longevity risk also exists across the Company's payout annuity blocks of business, which includes structured settlements, terminal funding, single premium immediate annuities, and fixed indexed annuities with GLWB riders. Longevity risks for these businesses include medical advances that would specifically impact the life expectancy of annuitants for substandard structured settlements as well as mortality improvement at a greater rate than the Company's current expectations.
Management
The Company’s procedures for managing these risks include periodic experience exposure monitoring and reporting, risk modeling, risk transfer and capital management strategies.
Reinsurance as a Risk Management Strategy
The Company cedes insurance to affiliated and unaffiliated insurers to enable the Company to manage capital and risk exposure. Such arrangements do not relieve the Company of its primary liability to policyholders.
Impact
Failure of reinsurers to honor their obligations could result in losses to the Company.
Management
Reinsurance is a centralized function across the Company to support a consistent strategy and to ensure that the reinsurance activities are fully integrated into the organization's risk management processes.
The Company uses reinsurance for its life insurance, retirement and a portion of its fixed and payout annuity businesses. In addition, in 2022 and 2021 the Company reinsured a portion of assumed FIA and its variable annuity GMDB and GMWB risks, respectively, to its parent, TR Re.
The Company closely monitors the financial condition, ratings and current market information of all its counterparty reinsurers and records an ACL considering the credit quality of the reinsurer, the invested assets in trust, and the period over which the recoverable balances are expected to be collected.
The components of the gross and net reinsurance recoverables are summarized as follows:
| | | | | | | | |
| Reinsurance Recoverables, net |
| Successor Company |
| As Restated | |
| As of December 31, 2022 | As of December 31, 2021 |
| Gross reinsurance recoverables | $ | 40,427 | | $ | 35,885 | |
| Less: ACL | 27 | | 37 | |
| Reinsurance recoverables, net | $ | 40,400 | | $ | 35,848 | |
As of December 31, 2022 (Successor Company) (as restated), the Company had reinsurance recoverables, net from Commonwealth, Massachusetts Mutual Life Insurance Company ("MassMutual"), Prudential Financial, Inc. ("Prudential") and TR Re of approximately $8.0 billion, $6.7 billion, $13.5 billion and $11.2 billion, respectively. As of December 31, 2021 (Successor Company), the Company had reinsurance recoverables, net from Commonwealth, MassMutual, Prudential and TR Re of $8.7 billion, $6.8 billion and $13.1 billion and $6.1 billion, respectively. The Company's obligations to its direct policyholders that have been reinsured to Commonwealth, MassMutual and Prudential are primarily secured by invested assets held in trust. The Company's obligations to its direct policyholders reinsured to TR Re are secured by invested assets through segregated portfolios held by the Company.
Financial Risk on Statutory Capital
Statutory surplus amounts and RBC ratios may increase or decrease in any period depending upon a variety of factors and may be compounded in extreme scenarios or if multiple factors occur at the same time. In general, as equity market levels and interest rates decline, the amount and volatility of both our actual or potential obligation, as well as the related statutory surplus and capital margin can be materially negatively affected, sometimes at a greater than linear rate. At times the impact of changes in certain market factors or a combination of multiple factors on RBC ratios can be counterintuitive. Factors include:
•Differences in performance of variable sub-accounts relative to indices and/or realized equity and interest rate volatilities may affect RBC ratios.
•In times of significant market volatility, the ability to estimate statutory surplus and RBC ratios is inherently difficult as these factors are heavily influenced by both the liability dynamics and the nature of the Company's hedge program and its effectiveness. Additionally, reserve requirements for variable annuity death and living benefit guarantees and RBC requirements could increase with rising equity markets or rising interest rates, resulting in lower RBC ratios. The Company has reinsured a portion of its risk associated with GMWB and its risk associated with the aggregate GMDB exposure. These reinsurance agreements reduce the Company’s exposure to changes in the statutory reserves and the related capital and RBC ratios associated with changes in the capital markets.
•A decrease in the value of certain fixed-income, alternative investments, and equity securities in our investment portfolio, due in part to credit spreads widening and/or equity markets declining, may result in a decrease in statutory surplus and RBC ratios.
•Credit spreads on invested assets may increase sharply for certain sub-sectors of the overall credit market, resulting in statutory separate account asset market value losses. As actual credit spreads are not fully reflected in the current crediting rates, the calculation of statutory reserves may not substantially offset the change in fair value of the statutory separate account assets, resulting in reductions in statutory surplus. This may result in the need to devote additional capital to support the fixed MVA product and certain of our terminal funding contracts.
•Decreases in the value of certain derivative instruments that do not qualify for hedge accounting, may reduce statutory surplus and RBC ratios.
•Sustained low interest rates with respect to the fixed annuity business may result in a reduction in statutory surplus and an increase in NAIC required capital.
•Non-market factors, which can also impact the amount and volatility of both our actual potential obligation, as well as the related statutory surplus and capital margin, include actual and estimated policyholder behavior experience as it pertains to lapsation, partial withdrawals and mortality.
Most of these factors are outside of the Company’s control. The Company’s financial strength and credit ratings are significantly influenced by its statutory surplus amounts and RBC ratios of its insurance company subsidiaries. In addition, rating agencies may implement changes to their internal models that have the effect of increasing or decreasing the amount of statutory capital we must hold in order to maintain our current ratings.
Investment Portfolio Risk
Investment Portfolio Composition
The following table presents the Company’s fixed maturities, AFS, by credit quality. The credit ratings referenced throughout this section are based on availability, and are generally the midpoint of the available ratings among Moody’s, S&P, and Fitch. If no rating is available from a rating agency, then an internally developed rating is used. Accrued interest receivable related to fixed maturities, AFS is recorded in other assets on the Consolidated Balance Sheets and is not included in the amortized cost or fair value of the fixed maturities. For further information, see Note 3 - Investments of Notes to Consolidated Financial Statements.
| | | | | | | | | | | | | | | | | | | | |
| Fixed Maturities, AFS by Credit Quality |
| Successor Company | Successor Company |
| | December 31, 2022 | December 31, 2021 |
| | Amortized Cost | Fair
Value | Percent of Total Fair Value | Amortized Cost | Fair
Value | Percent of Total Fair Value |
| U.S. Government/Government Agencies | $ | 1,395 | | $ | 1,070 | | 7.0 | % | $ | 1,860 | | $ | 1,887 | | 9.0 | % |
| AAA | 1,305 | | 1,160 | | 7.5 | % | 2,085 | | 2,082 | | 9.9 | % |
| AA | 1,665 | | 1,342 | | 8.7 | % | 2,197 | | 2,195 | | 10.5 | % |
| A | 6,131 | | 5,088 | | 33.1 | % | 6,753 | | 6,746 | | 32.2 | % |
| BBB | 7,614 | | 6,199 | | 40.3 | % | 7,493 | | 7,465 | | 35.6 | % |
| BB & below | 579 | | 524 | | 3.4 | % | 598 | | 596 | | 2.8 | % |
| Total fixed maturities, AFS | $ | 18,689 | | $ | 15,383 | | 100 | % | $ | 20,986 | | $ | 20,971 | | 100 | % |
The fair value of fixed maturities, AFS decreased, as compared with December 31, 2021 (Successor Company), primarily due to a decrease in valuations due to higher interest rates and wider spreads and decreased holdings of corporate securities and securitized products.
The following table presents the Company’s fixed maturities, AFS by type, at fair value:
| | | | | | | | | | | | | | | | | | | | | | | | | | | | | | | | | | | | | | | | | | | | | | |
| Fixed Maturities, AFS by Type | | | | | | | | | | | | |
| Successor Company | | | | | | | | | | | | |
| | December 31, 2022 | December 31, 2021 | | | | | | | | | | | | |
| | Cost or Amortized Cost | | Gross Unrealized Gains | Gross Unrealized Losses | Fair Value | Percent of Total Fair Value | Cost or Amortized Cost | | Gross Unrealized Gains | Gross Unrealized Losses | Fair Value | Percent of Total Fair Value | | | | | | | | | | | | |
| Asset backed securities ("ABS") | | | | | | | | | | | | | | | | | | | | | | | | |
| Consumer loans | $ | 116 | | | $ | — | | $ | (8) | | $ | 108 | | 1.2 | % | $ | 166 | | | $ | — | | $ | (1) | | $ | 165 | | 1.3 | % | | | | | | | | | | | | |
| Other | 160 | | | — | | (14) | | 146 | | 1.5 | % | 94 | | | — | | (1) | | 93 | | 0.7 | % | | | | | | | | | | | | |
| | | | | | | | | | | | | | | | | | | | | | | | |
| | | | | | | | | | | | | | | | | | | | | | | | |
| Collateralized loan obligations ("CLOs") | 703 | | | — | | (27) | | 676 | | 7.1 | % | 945 | | | — | | (1) | | 944 | | 7.3 | % | | | | | | | | | | | | |
| | | | | | | | | | | | | | | | | | | | | | | | |
| | | | | | | | | | | | | | | | | | | | | | | | |
| | | | | | | | | | | | | | | | | | | | | | | | |
| | | | | | | | | | | | | | | | | | | | | | | | |
| Commercial mortgage-backed securities ("CMBS") | | | | | | | | | | | | | | | | | | | | | | | | |
| Agency backed [1] | 113 | | | 1 | | (13) | | 101 | | 1.1 | % | 151 | | | 1 | | (1) | | 151 | | 1.2 | % | | | | | | | | | | | | |
| Bonds | 1,555 | | | — | | (191) | | 1,364 | | 8.4 | % | 2,107 | | | 3 | | (12) | | 2,098 | | 6.9 | % | | | | | | | | | | | | |
| Interest only (“IOs”) | 56 | | | — | | (7) | | 49 | | 0.5 | % | 87 | | | — | | (1) | | 86 | | 0.7 | % | | | | | | | | | | | | |
| Corporate | | | | | | | | | | | | | | | | | | | | | | | | |
| Basic industry | 420 | | | — | | (77) | | 343 | | 5.3 | % | 417 | | | 2 | | (4) | | 415 | | 2.0 | % | | | | | | | | | | | | |
| Capital goods | 518 | | | — | | (92) | | 426 | | 3.0 | % | 727 | | | 2 | | (5) | | 724 | | 4.1 | % | | | | | | | | | | | | |
| Consumer cyclical | 787 | | | — | | (145) | | 642 | | 2.5 | % | 762 | | | 2 | | (2) | | 762 | | 2.3 | % | | | | | | | | | | | | |
| Consumer non-cyclical | 844 | | | — | | (178) | | 666 | | 5.3 | % | 1,135 | | | 5 | | (8) | | 1,132 | | 6.7 | % | | | | | | | | | | | | |
| Energy | 1,228 | | | — | | (234) | | 994 | | 6.1 | % | 1,316 | | | 3 | | (10) | | 1,309 | | 6.2 | % | | | | | | | | | | | | |
| Financial services | 4,216 | | | 1 | | (658) | | 3,559 | | 15.7 | % | 4,221 | | | 12 | | (14) | | 4,219 | | 13.6 | % | | | | | | | | | | | | |
| Technology/communications | 1,627 | | | — | | (374) | | 1,253 | | 8.4 | % | 1,956 | | | 15 | | (11) | | 1,960 | | 10.0 | % | | | | | | | | | | | | |
| Transportation | 251 | | | — | | (53) | | 198 | | 2.1 | % | 271 | | | 2 | | (2) | | 271 | | 2.1 | % | | | | | | | | | | | | |
| Utilities | 1,771 | | | 1 | | (349) | | 1,423 | | 10.0 | % | 1,718 | | | 4 | | (15) | | 1,707 | | 10.2 | % | | | | | | | | | | | | |
| Other | 903 | | | — | | (166) | | 737 | | 1.2 | % | 857 | | | 3 | | (2) | | 858 | | 1.3 | % | | | | | | | | | | | | |
| Foreign government/government agencies | 377 | | | — | | (62) | | 315 | | 1.8 | % | 365 | | | 1 | | (4) | | 362 | | 1.6 | % | | | | | | | | | | | | |
| Municipal bonds | | | | | | | | | | | | | | | | | | | | | | | | |
| Taxable | 1,309 | | | — | | (269) | | 1,040 | | 4.9 | % | 1,452 | | | 10 | | (6) | | 1,456 | | 6.0 | % | | | | | | | | | | | | |
| | | | | | | | | | | | | | | | | | | | | | | | |
| Residential mortgage-backed securities ("RMBS") | | | | | | | | | | | | | | | | | | | | | | | | |
| Agency | 50 | | | — | | (7) | | 43 | | 0.3 | % | 71 | | | — | | (1) | | 70 | | 0.5 | % | | | | | | | | | | | | |
| Non-agency | 437 | | | — | | (79) | | 358 | | 3.7 | % | 686 | | | — | | (6) | | 680 | | 3.7 | % | | | | | | | | | | | | |
| Alt-A | 2 | | | — | | — | | 2 | | — | % | 3 | | | — | | — | | 3 | | — | % | | | | | | | | | | | | |
| Sub-prime | 14 | | | — | | — | | 14 | | 0.1 | % | 58 | | | — | | — | | 58 | | 0.4 | % | | | | | | | | | | | | |
| U.S. Treasuries | 1,232 | | | — | | (306) | | 926 | | 9.8 | % | 1,421 | | | 28 | | (1) | | 1,448 | | 11.2 | % | | | | | | | | | | | | |
| | | | | | | | | | | | | | | | | | | | | | | | |
| | | | | | | | | | | | | | | | | | | | | | | | |
| | | | | | | | | | | | | | | | | | | | | | | | |
| | | | | | | | | | | | | | | | | | | | | | | | |
| | | | | | | | | | | | | | | | | | | | | | | | |
| Total fixed maturities, AFS | $ | 18,689 | | | $ | 3 | | $ | (3,309) | | $ | 15,383 | | 100 | % | $ | 20,986 | | | $ | 93 | | $ | (108) | | $ | 20,971 | | 100 | % | | | | | | | | | | | | |
| | | | | | | | | | | | | | | | | | | | | | | | |
[1] Includes securities with pools of loans issued by the U.S. Small Business Administration, which are backed by the full faith and credit of the U.S. Government.
Bank Exposure
The recent failures of Silvergate Bank, Silicon Valley Bank, and Signature Bank, the forced merger of Credit Suisse with UBS, and stresses in the regional bank sector have raised concerns about the potential for systemic financial risk. While the rapid rise in interest rates is a concern for banks’ balance sheets, the impact of central bank intervention to provide liquidity seems to have stemmed the immediate fears of contagion and bank runs. The Company continues to closely monitor the situation.
The Company had approximately $1.8 billion in nominal value exposure to the banking sector as of March 24, 2023, of which $1.5 billion was exposure to Global Systemically Important Banks. In addition, the Company had Regional bank exposure of $80 in nominal value.
Our investment management team continues to seek opportunities to de-risk and prudently add risk where and when appropriate.
Commercial and Residential Real Estate
The following tables present the Company's exposure to CMBS and RMBS by current credit quality included in the preceding Fixed Maturities, AFS by Type table.
| | | | | | | | | | | | | | | | | | | | | | | | | | | | | | | | | | | | | | |
| Exposure to CMBS and RMBS as of December 31, 2022 (Successor Company) |
| | AAA | AA | A | BBB | BB and Below | Total |
| Amortized
Cost | Fair
Value | Amortized
Cost | Fair
Value | Amortized
Cost | Fair
Value | Amortized
Cost | Fair
Value | Amortized
Cost | Fair
Value | Amortized
Cost | Fair
Value |
| CMBS | | | | | | | | | | | | |
| Agency | $ | 113 | | $ | 101 | | $ | — | | $ | — | | $ | — | | $ | — | | $ | — | | $ | — | | $ | — | | $ | — | | $ | 113 | | $ | 101 | |
| Bonds | 749 | | 664 | | 150 | | 129 | | 226 | | 187 | | 133 | | 113 | | 297 | | 271 | | 1,555 | | 1,364 | |
| IOs | 29 | | 26 | | 16 | | 14 | | 3 | | 3 | | 8 | | 6 | | — | | — | | 56 | | 49 | |
| Total CMBS | 891 | | 791 | | 166 | | 143 | | 229 | | 190 | | 141 | | 119 | | 297 | | 271 | | 1,724 | | 1,514 | |
| RMBS | | | | | | | | | | | | |
| Agency | 34 | | 30 | | 16 | | 13 | | — | | — | | — | | — | | — | | — | | 50 | | 43 | |
| Non-agency | 51 | | 45 | | 61 | | 51 | | 108 | | 91 | | 207 | | 163 | | 10 | | 8 | | 437 | | 358 | |
| Alt-A | — | | — | | — | | — | | — | | — | | 1 | | 1 | | 1 | | 1 | | 2 | | 2 | |
| Sub-prime | — | | — | | 3 | | 3 | | 2 | | 2 | | 1 | | 1 | | 8 | | 8 | | 14 | | 14 | |
| Total RMBS | 85 | | 75 | | 80 | | 67 | | 110 | | 93 | | 209 | | 165 | | 19 | | 17 | | 503 | | 417 | |
| Total CMBS & RMBS | $ | 976 | | $ | 866 | | $ | 246 | | $ | 210 | | $ | 339 | | $ | 283 | | $ | 350 | | $ | 284 | | $ | 316 | | $ | 288 | | $ | 2,227 | | $ | 1,931 | |
| | | | | | | | | | | | | | | | | | | | | | | | | | | | | | | | | | | | | | |
| Exposure to CMBS and RMBS as of December 31, 2021 (Successor Company) |
| | AAA | AA | A | BBB | BB and Below | Total |
| Amortized
Cost | Fair
Value | Amortized
Cost | Fair
Value | Amortized
Cost | Fair
Value | Amortized
Cost | Fair
Value | Amortized
Cost | Fair
Value | Amortized
Cost | Fair
Value |
| CMBS | | | | | | | | | | | | |
| Agency | $ | 145 | | $ | 145 | | $ | 6 | | $ | 6 | | $ | — | | $ | — | | $ | — | | $ | — | | $ | — | | $ | — | | $ | 151 | | $ | 151 | |
| Bonds | 1,308 | | 1,307 | | 177 | | 175 | | 230 | | 228 | | 120 | | 117 | | 272 | | 271 | | 2,107 | | 2,098 | |
| IOs | 49 | | 48 | | 25 | | 25 | | 4 | | 4 | | 9 | | 9 | | — | | — | | 87 | | 86 | |
| Total CMBS | 1,502 | | 1,500 | | 208 | | 206 | | 234 | | 232 | | 129 | | 126 | | 272 | | 271 | | 2,345 | | 2,335 | |
| RMBS | | | | | | | | | | | | |
| Agency | 71 | | 70 | | — | | — | | — | | — | | — | | — | | — | | — | | 71 | | 70 | |
| Non-Agency | 267 | | 267 | | 81 | | 80 | | 134 | | 132 | | 185 | | 182 | | 19 | | 19 | | 686 | | 680 | |
| Alt-A | — | | — | | — | | — | | — | | — | | — | | — | | 3 | | 3 | | 3 | | 3 | |
| Sub-Prime | 1 | | 1 | | 6 | | 6 | | 12 | | 12 | | 13 | | 13 | | 26 | | 26 | | 58 | | 58 | |
| Total RMBS | 339 | | 338 | | 87 | | 86 | | 146 | | 144 | | 198 | | 195 | | 48 | | 48 | | 818 | | 811 | |
| Total CMBS & RMBS | $ | 1,841 | | $ | 1,838 | | $ | 295 | | $ | 292 | | $ | 380 | | $ | 376 | | $ | 327 | | $ | 321 | | $ | 320 | | $ | 319 | | $ | 3,163 | | $ | 3,146 | |
The Company also has exposure to commercial mortgage loans. These loans are collateralized by real estate properties that are diversified both geographically throughout the U.S. and by property type. These loans are primarily in the form of whole loans and may include participations. A loan participation interest represents a pro-rata share in interest and principal payments generated by the participated loan pursuant to the terms of the participation agreement.
As of December 31, 2022 (Successor Company), there were no loans within the Company’s mortgage loan portfolio that have had extensions or restructurings other than what is allowable under the original terms of the contract. As of December 31, 2022 (Successor Company), mortgage loans had an amortized cost and carrying value of $2.5 billion, with an ACL of $15. As of December 31, 2021 (Successor Company), mortgage loans had an amortized cost and carrying value of $2.1 billion, with an ACL of $12. Amortized cost represents carrying value prior to valuation allowances, if any. The increase
in the allowance was primarily attributable to the deteriorating economic conditions and the potential impact on real estate property valuations and, to a lesser extent, net additions of new loans.
The Company purchased $568 of commercial whole loans with a weighted average loan-to-value (“LTV”) ratio of 64% and a weighted average yield of 6.1% for the year ended December 31, 2022 (Successor Company). The Company continues to invest in commercial mortgage loans in high growth markets across the country focusing primarily on institutional-quality multi-family and industrial with strong LTV ratios. There were no mortgage loans held for sale as of December 31, 2022 (Successor Company) or 2021 (Successor Company).
Limited Partnerships and Other Alternative Investments
The following table presents the Company’s investments in limited partnerships and other alternative investments which include hedge funds, real estate funds, and private equity funds. Real estate funds consist of investments primarily in real estate joint ventures and, to a lesser extent, equity funds. Private equity funds primarily consist of investments in funds whose assets typically consist of a diversified pool of investments in small to mid-sized non-public businesses with high growth potential and strong owner sponsorship, as well as limited exposure to public markets. Income or losses on investments in limited partnerships and other alternative investments are recognized on a lag as results from private equity investments and other funds are generally reported on a three-month delay. The Company has elected to report certain rated feeder limited partnership interests and other alternative investments under the Fair Value Option ("FVO"), allowing the better alignment of the valuation of the equity and debt components of the investment. Limited partnership interests and other alternative investments accounted under the FVO totaled $58 at December 31, 2022. There were no limited partnerships or other alternative investments accounted for under the FVO at December 31, 2021
| | | | | | | | | | | | | | | | | | | | | | | | | | |
| Limited Partnerships and Other Alternative Investments Investment Income |
| Successor Company | Predecessor Company |
| For the Year Ended December 31, 2022 | For the Period of July 1, 2021 to December 31, 2021 | For the Six Months Ended June 30, 2021 | For the Year Ended December 31, 2020 |
|
| Amount | Yield | Amount | Yield | Amount | Yield | Amount | Yield |
| Hedge funds | $ | 8 | | 8.0 | % | $ | 11 | | 21.9 | % | $ | 12 | | 22.8 | % | $ | 3 | | 2.8 | % |
| Real estate funds | 39 | | 606.0 | % | 15 | | 131.8 | % | 5 | | 25.2 | % | 11 | | 25.3 | % |
| Private equity and other funds | 121 | | 12.6 | % | 233 | | 52.2 | % | 199 | | 49.7 | % | 116 | | 15.3 | % |
| Total | $ | 168 | | 15.6 | % | $ | 259 | | 50.9 | % | $ | 216 | | 45.7 | % | $ | 130 | | 14.3 | % |
| | | | | | | | | | | | | | |
| Investments in Limited Partnerships and Other Alternative Investments |
| Successor Company |
| December 31, 2022 | December 31, 2021 |
| Amount | Percent | Amount | Percent |
| Hedge funds | $ | 99 | | 7.6 | % | $ | 110 | | 9.6 | % |
| Real estate funds | 42 | | 3.3 | % | 23 | | 2.0 | % |
| Private equity and other funds | 1,159 | | 89.1 | % | 1,014 | | 88.4 | % |
| Total | $ | 1,300 | | 100 | % | $ | 1,147 | | 100 | % |
Fixed Maturities, AFS — Unrealized Loss Aging
The total gross unrealized losses were $3,309 as of December 31, 2022 (Successor Company), and have increased $3,201, from December 31, 2021 (Successor Company), primarily due to a decline in valuations due to higher interest rates and wider credit spreads. As of December 31, 2022 (Successor Company), $1,199 of the gross unrealized losses were associated with fixed maturities, AFS depressed less than 20% of amortized cost. Gross unrealized losses associated with fixed maturities, AFS depressed greater than 20% were $2,110.
As part of the Company’s ongoing investment monitoring process, the Company has reviewed its fixed maturities, AFS in an unrealized loss position and concluded that these fixed maturities are temporarily depressed and are expected to recover in value as the investments approach maturity or as market spreads tighten. For these fixed maturities in an unrealized loss position where an ACL has not been recorded, the Company’s best estimate of expected future cash flows are sufficient to recover the amortized cost basis of the investment. Furthermore, the Company neither has an intention to sell nor does it
expect to be required to sell these investments. For further information regarding the Company’s ACL analysis, see the Credit Losses on Fixed Maturities, AFS and Intent-to-Sell Impairments section below.
The following table presents the Company’s unrealized loss aging for fixed maturities, AFS by length of time that the securities were in a continuous unrealized loss position.
| | | | | | | | | | | | | | | | | | | | | | | | | | |
| Successor Company |
| December 31, 2022 | December 31, 2021 |
| Consecutive Months | Items | Cost or
Amortized
Cost | Fair
Value | Unrealized
Loss | Items | Cost or
Amortized
Cost | Fair
Value | Unrealized
Loss |
| Three months or less | 48 | | $ | 327 | | $ | 315 | | $ | (12) | | 697 | | $ | 4,306 | | $ | 4,275 | | $ | (31) | |
| Greater than three to six months | 112 | | 947 | | 839 | | (107) | | 983 | | 4,818 | | 4,741 | | (77) | |
| Greater than six to nine months | 141 | | 1,158 | | 1,001 | | (157) | | — | | — | | — | | — | |
| Greater than nine to eleven months | 2,827 | | 9,939 | | 7,965 | | (1,975) | | — | | — | | — | | — | |
| Twelve months or more | 1,298 | | 5,989 | | 4,931 | | (1,058) | | — | | — | | — | | — | |
| Total | 4,426 | | $ | 18,360 | | $ | 15,051 | | $ | (3,309) | | 1,680 | | $ | 9,124 | | $ | 9,016 | | $ | (108) | |
Credit Losses on Fixed Maturities, AFS and Intent-to-Sell Impairments
For the year ended December 31, 2022 (Successor Company)
The Company recorded net credit losses of $1, primarily related to one private corporate utilities issuer. Unrealized losses on securities with an ACL recognized in other comprehensive income were less than $1. There were no intent-to-sell impairments.
The Company incorporates its best estimate of future performance using internal assumptions and judgments that are informed by economic and industry specific trends, as well as our expectations with respect to security specific developments.
Future intent-to-sell impairments or credit losses may develop as the result of changes in our intent to sell specific securities that are in an unrealized loss position or if modeling assumptions, such as macroeconomic factors or security specific developments, change unfavorably from our current modeling assumptions, resulting in lower cash flow expectations.
For the period of July 1, 2021 to December 31, 2021 (Successor Company)
For the period of July 1, 2021 to December 31, 2021, there were no additions to the ACL and no intent-to-sell impairments.
For the six months ended June 30, 2021 (Predecessor Company)
For the six months ended June 30, 2021, there were no new additions to the ACL or improvements on issuers that had an ACL in prior period periods. Unrealized losses on securities with an ACL recognized in other comprehensive income were less than $1 for the period.
There were no intent-to-sell impairments in the six months ended June 30, 2021.
For the year ended December 31, 2020 (Predecessor Company)
The Company recorded net credit losses on fixed maturities, AFS of $1. The losses were attributable to corporate fixed maturities and were identified through security specific reviews and resulted from changes in the financial condition of the issuers. Unrealized losses on securities with ACL recognized in other comprehensive income were $1.
Intent-to-sell impairments of $6 were primarily related to corporate issuers in the energy sector and one corporate cruise line issuer.
ACL on Mortgage Loans
The Company reviews mortgage loans on a quarterly basis to estimate the ACL with changes in the ACL recorded in net realized capital gains and losses. Apart from an ACL recorded on individual mortgage loans where the borrower is experiencing financial difficulties, the Company records an ACL on the pool of mortgage loans based on lifetime expected credit losses. For further information, refer to Note 3 - Investments of Notes to Consolidated Financial Statements.
For the year ended December 31, 2022, the Company increased the ACL on mortgage loans by $3. The increase was primarily attributable to the deteriorating economic conditions and the potential impact on real estate property valuations, and to a lesser extent, net additions of new loans. The Company did not record an ACL on any individual mortgage loans.
For the period of July 1, 2021 to December 31, 2021 (Successor Company), there was no change in the ACL on mortgage loans. The Company did not record an ACL on any individual mortgage loans for the same period.
For the six months ended June 30, 2021 (Predecessor Company), the Company recorded a decrease in the ACL on mortgage loans of $6. The decrease in the allowance was the result of improved economic scenarios. The Company did not record an ACL on any individual mortgage loans for the same period.
For the year ended December 31, 2020 (Predecessor Company), the Company recorded an increase in the ACL on mortgage loans of $8. The increase in the allowance was due to the effects of the COVID-19 pandemic and its impacts on the economic forecasts, as well as lower estimated property values and operating income. The Company did not record an ACL on any individual mortgage loans for the same period.
CAPITAL RESOURCES AND LIQUIDITY
Capital resources and liquidity represent the financial resources of Talcott Resolution Life Insurance Company and its ability to generate strong cash flows and to borrow funds at competitive rates to meet operating needs over the next twelve months.
Liquidity Requirements and Sources of Capital
TL has an intercompany liquidity agreement that allows for short-term advances of funds to its subsidiaries of up to $1.0 billion for liquidity and other general corporate purposes. The CTDOI granted approval for certain affiliated insurance companies that are parties to the agreement to treat receivables from a subsidiary, including Talcott Resolution Life and Annuity Insurance Company ("TLA"), as admitted assets for statutory accounting purposes. As of December 31, 2022 (Successor Company), there were no amounts outstanding between TL and its subsidiaries.
TL and TLI also have an intercompany liquidity agreement that allows for short-term advances of funds between the two entities of up to $25 for liquidity and general corporate purposes. As of December 31, 2022 (Successor Company), there were no amounts outstanding between these two entities.
Derivative Commitments
Certain of the Company’s derivative agreements contain provisions that are tied to the financial strength ratings, as set by nationally recognized statistical agencies or RBC tests, of the individual legal entity that entered into the derivative agreement. If the legal entity’s financial strength were to fall below certain thresholds, the counterparties to the derivative agreements could demand immediate and ongoing full collateralization and in certain instances enable the counterparties to terminate the agreements and demand immediate settlement of all outstanding derivative positions traded under each impacted bilateral agreement. The settlement amount is determined by netting the derivative positions transacted under each agreement. If the termination rights were to be exercised by the counterparties, it could impact the legal entity’s ability to conduct hedging activities by increasing the associated costs and decreasing the willingness of counterparties to transact with the legal entity. The aggregate fair value of all derivative instruments with credit-risk-related contingent features that are in a net liability position as of December 31, 2022 (Successor Company) is $110. Of this $110, the legal entities have posted collateral of $111 in the normal course of business. These collateral amounts could change as derivative market values change, as a result of changes in our hedging activities or to the extent changes in contractual terms are negotiated. The nature of the collateral that we would post, if required, would be primarily in the form of U.S. Treasury bills, U.S. Treasury notes and government agency securities.
Insurance Operations
Total general account contractholder obligations are supported by $23 billion of cash and total general account invested assets, which includes the following fixed maturities, AFS and short-term investments to meet liquidity needs.
| | | | | |
| As of December 31, 2022 (Successor Company) |
| Fixed maturities, available-for-sale, at fair value | $ | 15,383 | |
| Fixed maturities, at fair value, using fair value option | 331 | |
| Short-term investments | 1,489 | |
| Cash | 173 | |
| Less: derivative collateral | 368 | |
| Total | $ | 17,008 | |
Capital resources available to fund liquidity upon contractholder surrender or termination are a function of the legal entity in which the liquidity requirement resides. Obligations related to life and annuity insurance products will be generally funded by both TL and TLA; obligations related to retirement and institutional investment products will be generally funded by TL.
The Company is a member of the Federal Home Loan Bank of Boston ("FHLBB"). Membership allows the Company access to collateralized advances, which may be used to support various spread-based business and enhance liquidity management. FHLBB membership requires the company to own member stock and advances require the purchase of activity stock. The amount of advances that can be taken are dependent on the asset types pledged to secure the advances. The CTDOI will permit the Company to pledge approximately $922 in qualifying assets to secure FHLBB advances for 2023. The pledge limit is recalculated annually based on statutory admitted assets and surplus of TL and TLA. The Company would need to seek the prior approval of the CTDOI in order to exceed these limits. As of December 31, 2022 (Successor Company), TL and TLA had no advances outstanding under the FHLBB facility.
| | | | | |
| Contractholder Obligations | As of December 31, 2022 |
| Total Contractholder obligations | $ | 139,989 | |
| Less: Separate account assets [1] | 87,255 | |
| General account contractholder obligations | $ | 52,734 | |
| Composition of General Account Contractholder Obligations | |
| Contracts without a surrender provision and/or fixed payout dates [2] | $ | 25,611 | |
| Fixed MVA annuities [3] | 2,623 | |
| Other [4] | 24,500 | |
| General account contractholder obligations | $ | 52,734 | |
[1] In the event customers elect to surrender separate account assets, the Company will use the proceeds from the sale of the assets to fund the surrender, and the Company’s liquidity position will not be impacted. In some instances the Company will receive a percentage of the surrender amount as compensation for early surrender (surrender charge), increasing the Company’s liquidity position. In addition, a surrender of variable annuity separate account or general account assets (see the following) will decrease the Company’s obligation for payments on guaranteed living and death benefits.
[2] Relates to contracts such as payout annuities, institutional notes, term life, group benefit contracts, or death and living benefit reserves, which cannot be surrendered for cash.
[3] Relates to annuities that are recorded in the general account under U.S. GAAP as the contractholders are subject to the Company's credit risk, although these annuities are held in a statutory separate account. In the statutory separate account, the Company is required to maintain invested assets with a fair value greater than or equal to the MVA surrender value of the Fixed MVA contract. In the event assets decline in value at a greater rate than the MVA surrender value of the Fixed MVA contract, the Company is required to contribute additional capital to the statutory separate account. The Company will fund these required contributions with operating cash flows or short-term investments. In the event that operating cash flows or short-term investments are not sufficient to fund required contributions that are not covered by reinsurance, the Company may have to sell other invested assets at a loss, potentially resulting in a decrease in statutory surplus. As the fair value of invested assets in the statutory separate account are at least equal to the MVA surrender value of the Fixed MVA contract, surrender of Fixed MVA annuities will have an insignificant impact on the liquidity requirements of the Company.
[4] Surrenders of, or policy loans taken from, as applicable, these general account liabilities, may be funded through operating cash flows of the Company, available short-term investments, or the Company may be required to sell fixed maturity investments to fund the surrender payment. These obligations include the general account option for individual variable annuities and the variable life contracts of the former Individual Life business, the general account option for annuities of the former Retirement Plans business and universal life contracts sold by the former Individual Life business. Sales of fixed maturity investments could result in the recognition of significant realized losses and insufficient proceeds to fully fund the surrender amount. In this circumstance, the Company may need to take other actions, including enforcing certain contract provisions which could restrict surrenders and/or slow or defer payouts. The Company has ceded reinsurance in connection with the sales of its Retirement Plans and Individual Life businesses to MassMutual and Prudential, respectively. The Company has also ceded a significant portion of its variable annuity and payout annuity liabilities to its parent, TR Re. The reinsurance transactions do not extinguish the Company's primary liability on the insurance policies issued under these businesses.
Off-Balance Sheet Arrangements and Aggregate Contractual Obligations
The Company does not have any off-balance sheet arrangements that are reasonably likely to have a material effect on the financial condition, results of operations, liquidity, or capital resources of the Company, except for unfunded commitments to purchase investments in limited partnerships and other alternative investments, mortgage loans and private debt of $974 as disclosed in Note 11 - Commitments and Contingencies of Notes to Consolidated Financial Statements.
The following table summarizes the Company’s contractual obligations as of December 31, 2022 (Successor Company):
| | | | | | | | | | | | | | | | | |
| Payments Due by Period |
| Total | Less Than
1 Year | 1-3
years | 3-5
years | More
Than
5 Years |
| Life and annuity obligations [1] | $ | 232,729 | | $ | 12,502 | | $ | 17,868 | | $ | 16,658 | | $ | 185,701 | |
| | | | | |
| Purchase obligations | 977 | | 977 | | — | | — | | — | |
| Other liabilities reflected on the balance sheet | 834 | | 834 | | — | | — | | — | |
| Total | $ | 234,540 | | $ | 14,313 | | $ | 17,868 | | $ | 16,658 | | $ | 185,701 | |
[1] Estimated life and annuity obligations include death claims, other charges associated with policyholder reserves, policy surrenders and policyholder dividends, offset by expected future deposits on in-force contracts. Estimated life and annuity obligations are based on mortality, morbidity and lapse assumptions comparable with the Company’s historical experience, modified for recent observed trends. The Company has also assumed market growth and interest crediting consistent with other assumptions. In contrast to this table, the majority of the Company’s obligations are recorded on the balance sheet at the current account values and do not incorporate an expectation of future market growth, interest crediting, or future deposits. Therefore, the estimated obligations presented in this table significantly exceed the liabilities recorded in reserve for future policy benefits, other policyholder funds and benefits payable, and separate account liabilities. Due to the significance of the assumptions used, the amounts presented could materially differ from actual results.
Dividends
As a condition to the Sixth Street Acquisition, the CTDOI requires any dividends from the Company, for a two-year period following the acquisition, be approved by the state insurance commissioner. Subsequent to this approval condition, dividends to the Company from its insurance subsidiaries and dividends from the Company to its parent are restricted by insurance regulation. The payment of dividends by Connecticut-domiciled insurers is limited under the insurance holding company laws of Connecticut. These laws require notice to and approval by the state insurance commissioner for the declaration or payment of any dividend, which, together with other dividends or distributions made within the preceding twelve months, exceeds the greater of (i) 10% of the insurer’s policyholder surplus as of December 31 of the preceding year or (ii) net income (or net gain from operations, if such company is a life insurance company) for the twelve-month period ending on the thirty-first day of December last preceding, in each case determined under statutory insurance accounting principles. In addition, if any dividend of a domiciled insurer exceeds the insurer’s earned surplus or certain other thresholds as calculated under applicable state insurance law, the dividend requires the prior approval of the domestic regulator. In addition to statutory limitations on paying dividends, the Company also takes other items into consideration when determining dividends from subsidiaries. These considerations include, but are not limited to, expected earnings and capitalization of the subsidiary, regulatory capital requirements and liquidity requirements of the individual operating company.
On January 18, 2021 the Company's indirect owners, Hopmeadow Holdings GP LLC and Hopmeadow Holdings LP, entered into a definitive agreement to merge Talcott Holdings, L.P. with a subsidiary of Sixth Street, a global investment firm. Prior to the close on June 30, 2021, the Company paid $500 in dividends to its previous direct parent, TLI.
Absent the restrictions noted above, the Company would be permitted to pay up to a maximum of $578 in dividends and the Company's subsidiaries are permitted to pay up to a maximum of $96 in dividends as determined by the above mentioned insurance regulations.
Cash Flows
| | | | | | | | | | | | | | |
| Successor Company | Predecessor Company |
| For the Year Ended December 31, 2022 | For the Period of July 1, 2021 to December 31, 2021 | For the Six Months Ended June 30, 2021 | For the Year Ended December 31, 2020 |
|
| Net cash provided by (used for) operating activities | $ | 880 | | $ | (376) | | $ | 444 | | $ | 866 | |
| Net cash provided by (used for) investing activities | 279 | | 540 | | (2) | | (89) | |
| Net cash used for financing activities | (1,035) | | (165) | | (432) | | (865) | |
| Cash — end of year | $ | 173 | | $ | 49 | | $ | 50 | | $ | 40 | |
For the year ended December 31, 2022 (Successor Company)
Net cash provided by operating activities included net income adjusted for non-cash items, including interest credited on investment and universal life-type contracts of $534 and amortization of premium related to bonds of approximately $215. In addition, cash provided by operating activities related to cash received from the Guardian reinsurance transaction of $121, partially offset by lower cash received from reinsurance recoverables related to certain insurance reserves.
Net cash provided by investing activities was primarily related to net proceeds from available-for-sale securities of $1.9 billion, partially offset by net payments for derivatives and mortgage loans of $559 and $409, respectively.
Net cash used for financing activities was driven by net payments for deposits, transfers and withdrawals for investment and universal life-type contracts of $936 and net decrease from securities loaned or sold under agreements to repurchase of $99.
For the period of July 1, 2021 to December 31, 2021 (Successor Company)
Net cash used for operating activities was primarily related to net payments for the Allianz and TR Re reinsurance transactions of $877, partially offset by various non-cash items added back to net income including depreciation and amortization of $102, as well VOBA amortization of $90.
Net cash provided by investing activities was related to net proceeds from available-for-sale securities of $1 billion, partially offset by net payments for short-term investments of $314, as a result of the Company's liquidity management, and net payments for derivatives of $161.
Net cash used for financing activities was primarily related to net payments for deposits, transfers and withdrawals for investment and universal life-type contracts of $296, partially offset by net increase in securities loaned or sold under agreements to repurchase of $131.
For the period of January 1, 2021 to June 30, 2021 (Predecessor Company)
Net cash provided by operating activities included net income adjusted for non-cash net realized capital losses of $242, mainly driven by losses associated with the macro hedge program and other non-cash items, partially offset by cash paid for claims and losses.
Net cash used for investing activities was primarily related to net payments for derivatives of $539, partially offset by net proceeds from available-for-sale securities of $425.
Net cash used for financing activities was primarily related to net payments for deposits, transfers and withdrawals for investment and universal life-type contracts of $202 and a pre-close dividend paid of $500 related to the Sixth Street Acquisition on June 30, 2021.
For the year ended December 31, 2020 (Predecessor Company)
Net cash provided by operating activities was primarily due to net income adjusted for non-cash net realized capital losses of $74, mainly driven by losses associated with the macro hedge program and other non-cash items, partially offset by cash paid for claims and losses.
Net cash used for investing activities was primarily related to net payments for short-term investments of $234 as a result of the Company's liquidity management, partially offset by net proceeds from mortgage loans of $131.
Net cash used for financing activities was primarily related to dividends paid of $319 to the Company's parent, TLI, and net payments for deposits, transfers and withdrawals for investment and universal life-type contracts of $539.
Ratings
Ratings can have an impact on the Company's reinsurance and derivative contracts. There can be no assurance that the Company’s ratings will continue for any given period of time or that they will not be changed. In the event the Company’s ratings are downgraded, reinsurance contracts may be adversely impacted and the Company may be required to post additional collateral on certain derivative contracts. Additionally, there are limited COLI and Bank Owned Life Insurance ("BOLI") contracts which have ratings triggers that could allow the insured to require the Company to attempt to reinsure those contracts with a higher rated insurer.
The following table summarizes Talcott Resolution Life Insurance Company’s significant member companies’ financial ratings from the major independent rating organizations as of March 31, 2023:
| | | | | | | | | | | |
| Insurance Financial Strength Ratings: | A.M. Best | Standard & Poor’s | Moody’s |
| Talcott Resolution Life Insurance Company | B++ | BBB+ | Baa2 |
| Talcott Resolution Life and Annuity Insurance Company | B++ | BBB+ | Baa2 |
These ratings are not a recommendation to buy or hold any of the Company’s securities and they may be revised or revoked at any time at the sole discretion of the rating organization.
The agencies consider many factors in determining the final rating of an insurance company. One consideration is the relative level of statutory capital and surplus, (referred to collectively as "statutory capital") necessary to support the business written and is reported in accordance with accounting practices prescribed by the applicable state insurance department.
Statutory Capital
The Company’s stockholder's equity, as prepared using U.S. GAAP, was $356 as of December 31, 2022 (Successor Company) (as restated). The Company’s estimated aggregate statutory capital and surplus as prepared in accordance with the Accounting Practices Prescribed or Permitted by the CTDOI was $2.7 billion as of December 31, 2022 (Successor Company).
Below is a reconciliation of estimated aggregate statutory capital and surplus to U.S. GAAP stockholder's equity as of December 31, 2022 (Successor Company):
| | | | | |
| As Restated |
| U.S. statutory capital as of December 31, 2022 [1] | $ | 2,738 | |
| U.S. GAAP adjustments: | |
| VOBA and DAC | 518 | |
| Non-admitted deferred tax assets | 106 | |
| Deferred taxes | 910 | |
| Goodwill and other intangible assets | 155 | |
| Non-admitted assets other than deferred tax assets | 37 | |
| Asset valuation reserve and interest maintenance reserve | 831 | |
| Benefit reserves | (1,485) | |
| Unrealized loss on investments | (2,334) | |
| Deferred gain on reinsurance | (1,099) | |
| SSAP 108 | (43) | |
| Other, net | 22 | |
| U.S. GAAP stockholder's equity as of December 31, 2022 | $ | 356 | |
[1] The Company relies upon a prescribed practice allowed by Connecticut state laws that allow the Company to receive a reinsurance reserve credit for reinsurance treaties that provide for a limited right of unilateral cancellation by the reinsurer. The benefit from this prescribed practice was approximately $40 as of December 31, 2022 (Successor Company).
Significant differences between U.S. GAAP stockholder’s equity and aggregate statutory capital prepared in accordance with the National Association of Insurance Commissioners' Accounting Practices and Procedures Manual ("U.S. STAT") include the following:
•Temporary differences between the book and tax basis of an asset or liability. which are recorded as deferred tax assets are evaluated for recoverability under U.S. GAAP while those amounts deferred are subject to limitations under U.S. STAT.
•The assumptions used in the determination of benefit reserves are prescribed under U.S. STAT, while the assumptions used under U.S. GAAP are generally the Company’s best estimates which are locked in at issuance date. However, the Company reset assumptions effective July 1, 2021 with the election of pushdown accounting. The sensitivity of life insurance reserves to changes in equity markets, as applicable, will be different between U.S. GAAP and U.S. STAT.
•The difference between the amortized cost and fair value of fixed maturity and other investments, net of tax, is recorded as an increase or decrease to the carrying value of the related asset and to equity under U.S. GAAP, while U.S. STAT only records certain securities at fair value, such as equity securities and certain lower rated bonds required by the NAIC to be recorded at the lower of amortized cost or fair value.
•The pushdown of purchase accounting for U.S. GAAP results in the Company reflecting goodwill in its U.S. GAAP financial statements. while pushdown of purchase accounting is not an accounting concept under U.S. STAT.
•U.S. STAT for life insurance companies establishes a formula reserve for realized and unrealized losses due to default and equity risks associated with certain invested assets (the Asset Valuation Reserve), while U.S. GAAP does not. Also, for those realized gains and losses caused by changes in interest rates, U.S. STAT for life insurance companies defers and amortizes the gains and losses, caused by changes in interest rates, into income over the original life to maturity of the asset sold (the Interest Maintenance Reserve) while U.S. GAAP does not.
•Deferred gains on reinsurance transactions are a restricted component of surplus on a U.S. STAT basis, while in U.S. GAAP it is included in liabilities and amortized into income over the life of the underlying policies reinsured.
In addition, certain assets, including a portion of premiums receivable and fixed assets, are non-admitted (recorded at zero value and charged against surplus) under U.S. STAT. U.S. GAAP generally evaluates assets based on their recoverability.
Risk-Based Capital
The Company's U.S. insurance companies' states of domicile impose RBC requirements. The requirements provide a means of measuring the minimum amount of statutory capital appropriate for an insurance company to support its overall business operations, based on its size and risk profile. Regulatory compliance is determined by a ratio of a company's total adjusted capital ("TAC") to its authorized control level RBC ("ACL RBC"). Companies below specific trigger points or ratios are classified within certain levels, each of which requires specified corrective action. The minimum level of TAC before corrective action commences ("Company Action Level") is two times the ACL RBC. The adequacy of a company's capital is determined by the ratio of a company's TAC to its Company Action Level, known as the "RBC ratio". The Company and all of its operating insurance subsidiaries had RBC ratios in excess of the minimum levels required by the applicable insurance regulations. The RBC ratios for the Company and its principal life insurance operating subsidiaries were all in excess of 300% of their Company Action Levels as of December 31, 2022 (Successor Company) and 2021 (Successor Company).The reporting of RBC ratios is not intended for the purpose of ranking any insurance company, or for use in connection with any marketing, advertising or promotional activities.
Contingencies
Legal Proceedings
For further information on other contingencies, see Note 11 - Commitments and Contingencies of Notes to Consolidated Financial Statements.
Legislative and Regulatory Developments
Privacy and Cybersecurity
Legislative activity aimed at protecting consumer privacy and augmenting cybersecurity protections continues to increase. In addition to the NAIC proposed Consumer Privacy Protection Model Law, there are three Federal proposals amending the Gramm-Leach-Bliley Act. These proposals would all require changes to the Company's current consumer privacy protections with varying degrees of complexity. The Company continues to implement the California Privacy Rights Act ("CPRA") and subsequent regulations which increased its scope to include business to business transaction and employee consumer protections.
Cybersecurity legislation continues to be a growing area of priority. For example, the New York’s Department of Financial Services has proposed amendments to their Cybersecurity Regulation which was enacted in February 2017. The proposed amendments move beyond administrative and technical safeguards and are focused on cybersecurity governance and risk management. The proposed amendments will require certain technologies, and increased board involvement.
Compliance with the ever increasing number of privacy and cybersecurity regulations involves a significant amount of resources and can be costly to implement.
Guaranty Fund and Other Insurance-related Assessments
For a discussion regarding Guaranty Fund and Other Insurance-related Assessments, see Note 11 - Commitments and Contingencies of Notes to Consolidated Financial Statements.
IMPACT OF NEW ACCOUNTING STANDARDS
For a discussion of new accounting standards, see Note 1 - Basis of Presentation and Significant Accounting Policies of Notes to Consolidated Financial Statements.
Talcott Resolution Life Insurance Company and Subsidiaries
Audited Financial Statements
As of December 31, 2022 (Successor Company) (as Restated) and 2021 (Successor Company)
For year ended December 31, 2022 (Successor Company) (as Restated), the period of July 1, 2021 to December 31, 2021 (Successor Company), the six months ended June 30, 2021 (Predecessor Company) and the year ended December 31, 2020 (Predecessor Company)
TALCOTT RESOLUTION LIFE INSURANCE COMPANY
INDEX TO CONSOLIDATED FINANCIAL STATEMENTS AND SCHEDULES
| | | | | |
| Description | Page |
| |
Consolidated Statements of Operations — For year ended December 31, 2022 (Successor Company) (as Restated), the period of July 1, 2021 to December 31, 2021 (Successor Company), the six months ended June 30, 2021 (Predecessor Company) and the year ended December 31, 2020 (Predecessor Company) | |
| Consolidated Statements of Comprehensive Income (Loss) — For year ended December 31, 2022 (Successor Company) (as Restated), the period of July 1, 2021 to December 31, 2021 (Successor Company), the six months ended June 30, 2021 (Predecessor Company) and the year ended December 31, 2020 (Predecessor Company) | |
| |
| Consolidated Statements of Changes in Stockholder's Equity — For year ended December 31, 2022 (Successor Company) (as Restated), the period of July 1, 2021 to December 31, 2021 (Successor Company), the six months ended June 30, 2021 (Predecessor Company) and the year ended December 31, 2020 (Predecessor Company) | |
| Consolidated Statements of Cash Flows — For year ended December 31, 2022 (Successor Company) (as Restated), the period of July 1, 2021 to December 31, 2021 (Successor Company), the six months ended June 30, 2021 (Predecessor Company) and the year ended December 31, 2020 (Predecessor Company) | |
| |
| Report of Independent Registered Public Accounting Firm | |
| |
| |
| |
REPORT OF INDEPENDENT REGISTERED PUBLIC ACCOUNTING FIRM
To the Board of Directors and Stockholder of Talcott Resolution Life Insurance Company:
Opinion on the Financial Statements
We have audited the accompanying consolidated balance sheets of Talcott Resolution Life Insurance Company and subsidiaries (the "Company") as of December 31, 2022 and 2021 (Successor Company), the related consolidated statements of operations, comprehensive income (loss), changes in stockholder’s equity, and cash flows, for the year ended December 31, 2022 (Successor Company), the period of July 1, 2021 to December 31, 2021 (Successor Company), the six months ended June 30, 2021 (Predecessor Company) and the year ended December 31, 2020 (Predecessor Company) and the related notes (collectively referred to as the "financial statements"). In our opinion, the financial statements present fairly, in all material respects, the financial position of the Company as of December 31, 2022 (Successor Company) and 2021 (Successor Company), and the results of its operations and its cash flows for the year ended December 31, 2022 (Successor Company), period of July 1, 2021 to December 31, 2021 (Successor Company), the six months ended June 30, 2021 (Predecessor Company) and for the year ended December 31, 2020 (Predecessor Company) in conformity with accounting principles generally accepted in the United States of America.
Basis for Opinion
These financial statements are the responsibility of the Company's management. Our responsibility is to express an opinion on the Company's financial statements based on our audits. We are a public accounting firm registered with the Public Company Accounting Oversight Board (United States) (PCAOB) and are required to be independent with respect to the Company in accordance with the U.S. federal securities laws and the applicable rules and regulations of the Securities and Exchange Commission and the PCAOB.
We conducted our audits in accordance with the standards of the PCAOB and in accordance with auditing standards generally accepted in the United States of America. Those standards require that we plan and perform the audit to obtain reasonable assurance about whether the financial statements are free of material misstatement, whether due to error or fraud. The Company is not required to have, nor were we engaged to perform, an audit of its internal control over financial reporting. As part of our audits, we are required to obtain an understanding of internal control over financial reporting but not for the purpose of expressing an opinion on the effectiveness of the Company’s internal control over financial reporting. Accordingly, we express no such opinion.
Our audits included performing procedures to assess the risks of material misstatement of the financial statements, whether due to error or fraud, and performing procedures that respond to those risks. Such procedures included examining, on a test basis, evidence regarding the amounts and disclosures in the financial statements. Our audits also included evaluating the accounting principles used and significant estimates made by management, as well as evaluating the overall presentation of the financial statements. We believe that our audits provide a reasonable basis for our opinion.
Restatement of the 2022 Financial Statements
As discussed in Note 1 to the financial statements, the accompanying 2022 financial statements have been restated to correct a misstatement.
Critical Audit Matters
The critical audit matters communicated below are matters arising from the current-period audit of the financial statements that were communicated or required to be communicated to the audit committee and that (1) relate to accounts or disclosures that are material to the financial statements and (2) involved our especially challenging, subjective, or complex judgments. The communication of critical audit matters does not alter in any way our opinion on the financial statements, taken as a whole, and we are not, by communicating the critical audit matters below, providing separate opinions on the critical audit matters or on the accounts or disclosures to which they relate.
Future Policy Benefits, Embedded Derivatives and Amortization of Value of Business Acquired — Refer to Notes 1, 2, 4, 6 and 8 to the Consolidated Financial Statements
Critical Audit Matter Description
The Company’s products include universal life-type annuity contracts with guarantees that result in death and other insurance benefit liabilities to the Company. These liabilities are reported as a component of Reserves for Future Policy Benefits.
Certain annuity contracts offered riders with guaranteed minimum withdrawal benefits, the non-life contingent portion of which are accounted for as embedded derivatives and are reported as a component of Other Policyholder Funds and Benefits Payable.
The Company assumes via reinsurance fixed indexed annuity contracts with guaranteed lifetime withdrawal benefit riders. Certain fixed indexed annuity contracts contain a second notional account value which provides additional annuitization benefits. These features result in other insurance benefit liabilities to the Company. These liabilities are reported as a component of Reserves for Future Policy Benefits. Additionally, fixed indexed annuity contracts with indexed-crediting rates include embedded derivatives and are reported as a component of Other Policyholder Funds and Benefits Payable.
Value of business acquired (VOBA) is an intangible asset, and represents an estimated value assigned to the right to receive future gross profits from cash flows and earnings of acquired insurance and investment contracts. VOBA is amortized over the estimated gross profits of those acquired contracts.
The valuation of the reserves for such future policy benefits, valuation of embedded derivatives included within other policyholder funds and benefits payable, and the amortization of VOBA are measured based on actuarial methodologies and underlying economic and future policyholder behavior assumptions. Significant judgment is involved in the selection of the assumptions used to determine the valuation of the reserves for such future policy benefits, in the methods and assumptions used in the valuation of embedded derivatives, and the estimated gross profits used in the valuation of the amortization of VOBA. The principal assumptions include mortality, lapse, withdrawal, persistency, expenses, and discount rates.
Given the high level of estimation uncertainty of management’s actuarial assumptions, performing audit procedures to evaluate these assumptions required a high degree of auditor judgment and an increased extent of effort, including the need to involve our actuarial specialists.
How the Critical Audit Matter Was Addressed in the Audit
Our audit procedures related to testing assumptions used by management to estimate the valuation of future policy benefits, valuation of embedded derivatives included within other policyholder funds and benefits payable and amortization of VOBA included the following, among others:
•We tested the completeness and accuracy of the underlying data that served as the basis for the assumptions.
•With the assistance of our actuarial specialists, we evaluated the appropriateness of the assumptions and methodologies used by management.
•With the assistance of our actuarial specialists, on a sample basis, we developed independent estimates of the valuations derived from those assumptions and methodologies and compared our estimates to management’s estimates.
Investments in Fixed Maturities Classified as Available-for-Sale or Using Fair Value Option and Freestanding Derivatives — Refer to Notes 1, 2, 3 and 4 to the Consolidated Financial Statements
Critical Audit Matter Description
Investments in fixed maturities classified as available-for-sale or using fair value option are reported at fair value in the consolidated financial statements. Freestanding derivatives, which are reported in other investments or other liabilities, as appropriate, after considering the impact of master netting agreements, are also reported at fair value in the consolidated financial statements. Where fair values cannot be determined based on observable inputs, management uses unobservable inputs, such as credit spreads, equity volatility and interest rates beyond the observable curve, requiring judgment by management to determine the estimated fair value.
We identified the valuation of certain investments in fixed maturities classified as available-for-sale or using fair value option and freestanding derivatives as a critical audit matter because of the unobservable inputs management uses to estimate fair value. Auditing these unobservable inputs used by management required a high degree of auditor judgment, and an increased extent of effort, including the need to involve our fair value specialists.
How the Critical Audit Matter Was Addressed in the Audit
Our audit procedures related to testing the valuation of fixed maturities classified as available-for-sale or using fair value option and freestanding derivatives included the following, among others:
•We tested the effectiveness of controls over the valuation of these investments, including controls over inputs, methods, and assumptions used in the Company’s estimation processes.
•On a sample basis, we tested the accuracy and completeness of the investments owned as of December 31, 2022, and the relevant attributes used in the determination of their fair values.
•With the assistance of our fair value specialists, for a sample of investments, we tested the mathematical accuracy of the fair value calculation and developed independent estimates of the fair value and compared our estimates to the Company’s estimates. In addition to developing independent estimates, we obtained an understanding of the models and inputs used by the Company and assessed those models and inputs for reasonableness. Such assessment included comparing inputs to external sources or developing independent inputs.
/s/ DELOITTE & TOUCHE LLP
Hartford, CT
April 27, 2023 (December 21, 2023 as to the effects of the restatement discussed in Note 1)
We have served as the Company’s auditor since 2002.
TALCOTT RESOLUTION LIFE INSURANCE COMPANY AND SUBSIDIARIES
Consolidated Statements of Operations
| | | | | | | | | | | | | | |
| Successor Company | Predecessor Company |
| As Restated | | | |
| For the Year Ended December 31, 2022 | For the Period of July 1, 2021 to December 31, 2021 | For the Six Months Ended June 30, 2021 | For the Year Ended December 31, 2020 |
| (In millions) |
| Revenues | | | | |
| Policy charges and fee income (related party 2022: $(279)) | $ | 506 | | $ | 410 | | $ | 438 | | $ | 741 | |
| Premiums (related party 2022: $(27)) | 109 | | 31 | | 24 | | 35 | |
| Net investment income (related party 2022: $(136)) | 778 | | 498 | | 534 | | 816 | |
| | | | |
| | | | |
| | | | |
| | | | |
| | | | |
| Net realized capital losses (related party 2022: $663) | (10) | | (20) | | (242) | | (74) | |
| Amortization of deferred gains (related party 2022: $27) | 33 | | — | | 26 | | 53 | |
| Total revenues | 1,416 | | 919 | | 780 | | 1,571 | |
| Benefits, losses and expenses | | | | |
| Benefits and losses (related party 2022: $(184)) | 637 | | 285 | | 375 | | 626 | |
| Amortization of value of business acquired ("VOBA") and deferred acquisition costs ("DAC") | 79 | | 90 | | (43) | | 50 | |
| Insurance operating costs and other expenses (related party:$(119) and $0) | 294 | | 208 | | 228 | | 364 | |
| | | | |
| Other intangible asset amortization | 6 | | 3 | | 3 | | 6 | |
| Dividends to policyholders | 3 | | 2 | | 1 | | 60 | |
| Total benefits, losses and expenses | 1,019 | | 588 | | 564 | | 1,106 | |
| Income before income taxes | 397 | | 331 | | 216 | | 465 | |
| Income tax expense | 38 | | 51 | | 30 | | 66 | |
| | | | |
| | | | |
| Net income | $ | 359 | | $ | 280 | | $ | 186 | | $ | 399 | |
| | | | |
| | | | |
See Notes to Consolidated Financial Statements.
TALCOTT RESOLUTION LIFE INSURANCE COMPANY AND SUBSIDIARIES
Consolidated Statements of Comprehensive Income (Loss)
| | | | | | | | | | | | | | |
| | Successor Company | Predecessor Company |
| As Restated | | | |
| For the Year Ended December 31, 2022 | For the Period of July 1, 2021 to December 31, 2021 | For the Six Months Ended June 30, 2021 | For the Year Ended December 31, 2020 |
| (In millions) |
| Net income | $ | 359 | | $ | 280 | | $ | 186 | | $ | 399 | |
| Other comprehensive income (loss) ("OCI"): | | | | |
| Change in net unrealized gain or loss on fixed maturities, AFS | (2,129) | | (10) | | (275) | | 565 | |
| | | | |
| Change in net gain or loss on cash flow hedging instruments | (27) | | — | | 1 | | (1) | |
| | | | |
| OCI, net of tax | (2,156) | | (10) | | (274) | | 564 | |
| Comprehensive income (loss) | $ | (1,797) | | $ | 270 | | $ | (88) | | $ | 963 | |
See Notes to Consolidated Financial Statements.
TALCOTT RESOLUTION LIFE INSURANCE COMPANY AND SUBSIDIARIES
Consolidated Balance Sheets
| | | | | | | | |
| Successor Company |
| As Restated | |
| As of December 31, |
| (In millions, except for share data) | 2022 | 2021 |
| Assets | | |
| Investments: | | |
| Fixed maturities, available-for-sale, at fair value (net of ACL of $0 and $0) (amortized cost of $18,689 and $20,986) | $ | 15,383 | | $ | 20,971 | |
| Fixed maturities, at fair value, using fair value option | 331 | | — | |
| Equity securities, at fair value | 179 | | 203 | |
| Mortgage loans (net of ACL of $15 and $12) | 2,520 | | 2,131 | |
| Policy loans | 1,495 | | 1,484 | |
| Limited partnerships and other alternative investments (portion at fair value: $58 and $0) | 1,300 | | 1,147 | |
| Other investments | 95 | | 26 | |
| Short-term investments | 1,489 | | 1,254 | |
| Total investments | 22,792 | | 27,216 | |
| Cash | 173 | | 49 | |
| Reinsurance recoverables (net of ACL of $27 and $37) (related party: $11,223 and $6,130) (portion at fair value: $335 and $(8)) | 40,400 | | 35,848 | |
| VOBA and DAC | 518 | | 479 | |
| Deferred income taxes, net | 1,120 | | 603 | |
| Goodwill and other intangible assets | 155 | | 161 | |
| Other assets | 453 | | 416 | |
| Separate account assets | 87,255 | | 111,592 | |
| Total assets | $ | 152,866 | | $ | 176,364 | |
| Liabilities | | |
| Reserve for future policy benefits | $ | 21,432 | | $ | 21,698 | |
| Other policyholder funds and benefits payable (portion at fair value: $254 and $575) | 31,302 | | 32,622 | |
| Funds withheld liability (related party: $9,248 and $5,128) (portion at fair value: $(560) and $(15)) | 10,485 | | 6,379 | |
| Other liabilities (related party: $928 and $818) | 2,036 | | 1,920 | |
| Separate account liabilities | 87,255 | | 111,592 | |
| Total liabilities | 152,510 | | 174,211 | |
| Commitments and Contingencies (Note 11) | | |
| Stockholder’s Equity | | |
| Common stock—1,000 shares authorized, issued and outstanding, par value $5,690 | 6 | | 6 | |
| Additional paid-in capital | 1,877 | | 1,877 | |
| Accumulated other comprehensive loss, net of tax | (2,166) | | (10) | |
| Retained earnings | 639 | | 280 | |
| Total stockholder’s equity | 356 | | 2,153 | |
| Total liabilities and stockholder’s equity | $ | 152,866 | | $ | 176,364 | |
See Notes to Consolidated Financial Statements.
TALCOTT RESOLUTION LIFE INSURANCE COMPANY AND SUBSIDIARIES
Consolidated Statements of Changes in Stockholder's Equity
| | | | | | | | | | | | | | | | | |
| For the Year Ended December 31, 2022 (Successor Company) |
| As Restated |
| (In millions) | Common Stock | Additional Paid-In Capital | Accumulated Other Comprehensive Loss | Retained Earnings | Total
Stockholder's
Equity |
| Balance, beginning of period | $ | 6 | | $ | 1,877 | | $ | (10) | | $ | 280 | | $ | 2,153 | |
| Net income | — | | — | | — | | 359 | | 359 | |
| Total other comprehensive loss | — | | — | | (2,156) | | — | | (2,156) | |
| | | | | |
| | | | | |
| Balance, end of period | $ | 6 | | $ | 1,877 | | $ | (2,166) | | $ | 639 | | $ | 356 | |
| | | | | | | | | | | | | | | | | |
| For the Period of July 1, 2021 to December 31, 2021 (Successor Company) |
| (In millions) | Common Stock | Additional Paid-In Capital | Accumulated Other Comprehensive Loss | Retained Earnings | Total
Stockholder's
Equity |
| Balance, beginning of period | $ | 6 | | $ | 1,877 | | $ | — | | $ | — | | $ | 1,883 | |
| Net income | — | | — | | — | | 280 | | 280 | |
| Total other comprehensive loss | — | | — | | (10) | | — | | (10) | |
| | | | | |
| | | | | |
| Balance, end of period | $ | 6 | | $ | 1,877 | | $ | (10) | | $ | 280 | | $ | 2,153 | |
| | | | | | | | | | | | | | | | | |
| For the Six Months Ended June 30, 2021 (Predecessor Company) |
| (In millions) | Common Stock | Additional Paid-In Capital | Accumulated Other Comprehensive Income | Retained Earnings | Total
Stockholder's
Equity |
| Balance, beginning of period | $ | 6 | | $ | 1,761 | | $ | 1,281 | | $ | 137 | | $ | 3,185 | |
| Net income | — | | — | | — | | 186 | | 186 | |
| Total other comprehensive loss | — | | — | | (274) | | — | | (274) | |
| Capital contribution to parent | — | | (235) | | — | | — | | (235) | |
| Dividends paid | — | | — | | — | | (265) | | (265) | |
| Balance, end of period | $ | 6 | | $ | 1,526 | | $ | 1,007 | | $ | 58 | | $ | 2,597 | |
| | | | | | | | | | | | | | | | | |
| For the Year Ended December 31, 2020 (Predecessor Company) |
| (In millions) | Common Stock | Additional Paid-In Capital | Accumulated Other Comprehensive Income | Retained Earnings | Total
Stockholder's
Equity |
| Balance, beginning of period | $ | 6 | | $ | 1,761 | | $ | 717 | | $ | 68 | | $ | 2,552 | |
| Cumulative effect of accounting changes, net of tax | $ | — | | $ | — | | $ | — | | $ | (11) | | $ | (11) | |
| Adjusted balance, beginning of period | 6 | | 1,761 | | 717 | | 57 | | 2,541 | |
| Net income | — | | — | | — | | 399 | | 399 | |
| Total other comprehensive income | — | | — | | 564 | | — | | 564 | |
| | | | | |
| Dividends paid | — | | — | | — | | (319) | | (319) | |
| Balance, end of period | $ | 6 | | $ | 1,761 | | $ | 1,281 | | $ | 137 | | $ | 3,185 | |
See Notes to Consolidated Financial Statements.
TALCOTT RESOLUTION LIFE INSURANCE COMPANY AND SUBSIDIARIES
Consolidated Statements of Cash Flows
| | | | | | | | | | | | | | |
| Successor Company | Predecessor Company |
| As Restated | | | |
| (In millions) | For the Year Ended December 31, 2022 | For the Period of July 1, 2021 to December 31, 2021 | For the Six Months Ended June 30, 2021 | For the Year Ended December 31, 2020 |
| Operating Activities | | | | |
| Net income | $ | 359 | | $ | 280 | | $ | 186 | | $ | 399 | |
| Adjustments to reconcile net income to net cash provided by (used for) operating activities | | | | |
| Net realized capital losses (related party 2022: $663) | 10 | | 20 | | 242 | | 74 | |
| Amortization of deferred reinsurance gain (related party 2022: $27) | (33) | | — | | (26) | | (53) | |
| Amortization of VOBA | 79 | | 90 | | (43) | | 50 | |
| | | | |
| | | | |
| Depreciation and amortization | 227 | | 102 | | 38 | | 69 | |
| Deferred income tax expense | 56 | | 138 | | 29 | | 54 | |
| Interest credited on investment and universal life-type contracts | 534 | | 314 | | 152 | | 379 | |
| Other operating activities, net | (38) | | (208) | | (114) | | (120) | |
| Change in assets and liabilities: | | | | |
| Increase in reinsurance recoverables | (758) | | (63) | | (134) | | (331) | |
| Increase (decrease) for future policy benefits and unearned premiums | 230 | | (40) | | 63 | | 160 | |
| | | | |
| | | | |
| Net changes in other assets and other liabilities | 93 | | (132) | | 51 | | 185 | |
| Net proceeds from (payments for) reinsurance transactions | 121 | | (877) | | — | | — | |
| Net cash provided by (used for) operating activities | 880 | | (376) | | 444 | | 866 | |
| Investing Activities | | | | |
| Proceeds from the sale/maturity/prepayment of: | | | | |
| Fixed maturities, available-for-sale | 6,185 | | 2,976 | | 1,622 | | 2,824 | |
| | | | |
| Equity securities, at fair value | 26 | | 47 | | 3 | | 7 | |
| Mortgage loans | 258 | | 294 | | 158 | | 373 | |
| Partnerships | 64 | | 102 | | 71 | | 77 | |
| Payments for the purchase of: | | | | |
| Fixed maturities, available-for-sale | (4,255) | | (1,974) | | (1,197) | | (2,866) | |
| Fixed maturities, fair value option | (352) | | — | | — | | — | |
| Equity securities, at fair value | (22) | | (121) | | (45) | | (26) | |
| Mortgage loans | (667) | | (207) | | (177) | | (242) | |
| Partnerships | (158) | | (100) | | (74) | | (134) | |
| Net proceeds from (payments for) repurchase agreements program | 25 | | (11) | | 8 | | (16) | |
| Net proceeds from (payments for) derivatives | (559) | | (161) | | (539) | | 143 | |
| Net proceeds from (payments for) policy loans | (11) | | 9 | | (32) | | 15 | |
| | | | |
| Net proceeds from (payments for) short-term investments | (255) | | (314) | | 200 | | (234) | |
| Other investing activities, net | — | | — | | — | | (10) | |
| Net cash provided by (used for) investing activities | 279 | | 540 | | (2) | | (89) | |
| Financing Activities | | | | |
| Deposits and other additions to investment and universal life-type contracts | 2,033 | | 872 | | 1,001 | | 1,971 | |
| Withdrawals and other deductions from investment and universal life-type contracts | (8,109) | | (4,766) | | (4,862) | | (9,627) | |
| Net transfers from separate accounts related to investment and universal life-type contracts | 5,140 | | 3,598 | | 3,659 | | 7,117 | |
| Net increase (decrease) in securities loaned or sold under agreements to repurchase | (99) | | 131 | | 270 | | (7) | |
| Dividend paid on shares outstanding | — | | — | | (265) | | (319) | |
| Return of capital to parent | — | | — | | (235) | | — | |
| | | | |
| Net cash used for financing activities | (1,035) | | (165) | | (432) | | (865) | |
| | | | |
| Net increase (decrease) in cash | 124 | | (1) | | 10 | | (88) | |
| Cash — beginning of period | 49 | | 50 | | 40 | | 128 | |
| Cash — end of period | $ | 173 | | $ | 49 | | $ | 50 | | $ | 40 | |
| Supplemental Disclosure of Cash Flow Information: | | | | |
| Income taxes received (paid) | $ | 142 | | $ | (13) | | $ | 2 | | $ | — | |
| | | | |
| | | | |
| | | | |
See Notes to Consolidated Financial Statements.
TALCOTT RESOLUTION LIFE INSURANCE COMPANY AND SUBSIDIARIES
NOTES TO CONSOLIDATED FINANCIAL STATEMENTS
(Dollar amounts in millions, unless otherwise stated)
1. Basis of Presentation and Significant Accounting Policies
Basis of Presentation
Talcott Resolution Life Insurance Company, together with its consolidated subsidiaries, (collectively, "TL," the "Company," "we" or "our") is a life insurance and annuity company and comprehensive risk solutions-provider in the United States ("U.S.") and is a wholly-owned subsidiary of TR Re, Ltd. ("TR Re"), a Bermuda based entity. Talcott Resolution Life, Inc. ("TLI"), a Delaware corporation and Talcott Holdings, L.P. ("THLP") are indirect parents of the Company and the Company has an ultimate parent of Talcott Financial Group, Ltd. ("TFG" or "Talcott Financial Group").
The Consolidated Financial Statements have been prepared in accordance with accounting principles generally accepted in the U.S. (“U.S. GAAP”), which differ materially from the accounting practices prescribed by various insurance regulatory authorities. Certain reclassifications have been made to conform to current year presentation.
On June 30, 2021, the Company’s previous indirect owner, Hopmeadow Holdings GP LLC, completed the sale of the Company (the "Sixth Street Acquisition") through the merger of an affiliate of Sixth Street, a global investment firm, with and into THLP pursuant to an Agreement and Plan of Merger (the “Agreement"). Through the Agreement, TFG indirectly obtained 100% control of THLP and its life and annuity operating subsidiaries for a total purchase price of approximately $2.2 billion, comprised of a $500 pre-closing dividend and cash of $1.7 billion. The merger was accounted for using business combination accounting, together with an election to apply pushdown accounting. Under this method, the purchase price paid was assigned to the identifiable assets acquired and liabilities assumed as of the acquisition date based on their fair value. Determining the fair value of certain assets acquired and liabilities assumed is judgmental in nature and often involves the use of significant estimates and assumptions. The Company’s financial statements and footnote disclosures are presented into two distinct periods. The periods prior to the consummation of the Agreement are labeled ("Predecessor Company") and the periods subsequent to that date are labeled ("Successor Company") to distinguish between the different basis of accounting between the periods presented. As a result of the application of purchase accounting, the financial statements for the year ended December 31, 2022 and period of July 1, 2021 to December 31, 2021, are not comparable to the prior periods presented. In addition, as a result of the acquisition the Company conformed to TFG’s accounting policies and modified its presentation for certain transactions.
Restatement of Previously Issued Financial Statements
We have restated herein our consolidated financial statements as of and for the year ended December 31, 2022 (Successor Company).
Restatement Background
On December 30, 2021, the Company entered into affiliated reinsurance agreements (“Reinsurance Agreements”) with TR Re, in which liabilities were ceded on a modified coinsurance basis. Upon further investigation, the Company’s management has concluded that the retrocession of certain U.S. GAAP net losses within the Reinsurance Agreements were incorrectly calculated for year ended December 31, 2022 (Successor Company), which resulted in an overstatement of reinsurance recoverables and stockholder's equity on the consolidated balance sheets of $314 and $258, respectively. For the year ended December 31, 2022 (Successor Company), the impact of correcting the error was a $258 decrease to the previously reported net income of $617. In addition, certain disclosures were corrected as a result of the error. There was no impact from the restatement on the consolidated balance sheets as of December 31, 2021 (Predecessor Company) and in the consolidated statements of income the periods of July 1, 2021 to December 31, 2021 (Successor Company) and January 1, 2021 to June 30, 2021 (Predecessor Company).
Other Immaterial Misstatements
As part of the restatement, we made a correction to previously identified errors that the Company determined to be immaterial, both individually and in the aggregate for the year ended December 31, 2022. This resulted in an increase of other liabilities by $13 for the year ended December 31, 2022 (Successor Company) as well as corrections to certain Notes to Consolidated Financial Statements.
Impact of the Restatement:
The following tables present the amounts previously reported and a reconciliation to the restated amounts reported on the restated consolidated balance sheets as of December 31, 2022 (Successor Company) and the restated consolidated statements of operations, the restated consolidated statements of comprehensive income (loss), the restated consolidated statements of changes in stockholder’s equity and the restated consolidated statements of cash flows for the year ended December 31, 2022 (Successor Company).
TALCOTT RESOLUTION LIFE INSURANCE COMPANY AND SUBSIDIARIES
NOTES TO CONSOLIDATED FINANCIAL STATEMENTS
1. Basis of Presentation and Significant Accounting Policies (continued)
| | | | | | | | | | | |
| Consolidated Balance Sheet |
| Successor Company |
| As of December 31, 2022 |
| (In millions, except for share data) | As Previously
Reported | Restatement Impacts | As
Restated |
| Assets | | | |
| Investments: | | | |
| Fixed maturities, available-for-sale, at fair value | $ | 15,383 | | $ | — | | $ | 15,383 | |
| Fixed maturities, at fair value, using fair value option | 331 | | — | | 331 | |
| Equity securities, at fair value | 179 | | — | | 179 | |
| Mortgage loans | 2,520 | | — | | 2,520 | |
| Policy loans | 1,495 | | — | | 1,495 | |
| Limited partnerships and other alternative investments | 1,300 | | — | | 1,300 | |
| Other investments | 95 | | — | | 95 | |
| Short-term investments | 1,489 | | — | | 1,489 | |
| Total investments | 22,792 | | — | | 22,792 | |
| Cash | 173 | | — | | 173 | |
| Reinsurance recoverables | 40,714 | | (314) | | 40,400 | |
| VOBA and DAC | 518 | | — | | 518 | |
| Deferred income taxes, net | 1,051 | | 69 | | 1,120 | |
| Goodwill and other intangible assets | 155 | | — | | 155 | |
| Other assets | 453 | | — | | 453 | |
| Separate account assets | 87,255 | | — | | 87,255 | |
| Total assets | 153,111 | | (245) | | $ | 152,866 | |
| Liabilities | | | |
| Reserve for future policy benefits | 21,432 | | — | | 21,432 | |
| Other policyholder funds and benefits payable | 31,302 | | — | | 31,302 | |
| Funds withheld liability | 10,485 | | — | | 10,485 | |
| Other liabilities | 2,023 | | 13 | | 2,036 | |
| Separate account liabilities | 87,255 | | — | | 87,255 | |
| Total liabilities | 152,497 | | 13 | | 152,510 | |
| Stockholder’s Equity | | | |
| Common stock—1,000 shares authorized, issued and outstanding, par value $5,690 | 6 | | — | | 6 | |
| Additional paid-in capital | 1,877 | | — | | 1,877 | |
| Accumulated other comprehensive loss, net of tax | (2,166) | | — | | (2,166) | |
| Retained earnings | 897 | | (258) | | 639 | |
| Total stockholder’s equity | 614 | | (258) | | 356 | |
| Total liabilities and stockholder’s equity | $ | 153,111 | | $ | (245) | | $ | 152,866 | |
TALCOTT RESOLUTION LIFE INSURANCE COMPANY AND SUBSIDIARIES
NOTES TO CONSOLIDATED FINANCIAL STATEMENTS
1. Basis of Presentation and Significant Accounting Policies (continued)
| | | | | | | | | | | |
| Consolidated Statement of Operations |
| Successor Company |
| For the Year Ended December 31, 2022 |
| (In millions) | As Previously
Reported | Restatement
Impact | As
Restated |
| Revenues | | | |
| Policy charges and fee income | $ | 506 | | $ | — | | $ | 506 | |
| Premiums | 109 | | — | | 109 | |
| Net investment income | 778 | | — | | 778 | |
| Net realized capital gains (losses) | 317 | | (327) | | (10) | |
| Amortization of deferred gains | 33 | | — | | 33 | |
| Total revenues | 1,743 | | (327) | | 1,416 | |
| Benefits, losses and expenses | | | |
| Benefits and losses | 637 | | — | | 637 | |
| Amortization of VOBA and DAC | 79 | | — | | 79 | |
| Insurance operating costs and other expenses | 294 | | — | | 294 | |
| Other intangible asset amortization | 6 | | — | | 6 | |
| Dividends to policyholders | 3 | | — | | 3 | |
| Total benefits, losses and expenses | 1,019 | | — | | 1,019 | |
| Income before income taxes | 724 | | (327) | | 397 | |
| Income tax expense | 107 | | (69) | | 38 | |
| Net income | $ | 617 | | $ | (258) | | $ | 359 | |
| | | | | | | | | | | |
| Consolidated Statement of Comprehensive Loss |
| | Successor Company |
| For the Year Ended December 31, 2022 |
| (In millions) | As Previously
Reported | Restatement
Impact | As
Restated |
| Net income | $ | 617 | | $ | (258) | | $ | 359 | |
| Other comprehensive loss ("OCI"): | | | |
| Change in net unrealized loss on fixed maturities, AFS | (2,129) | | — | | (2,129) | |
| | | |
| Change in net gain or loss on cash flow hedging instruments | (27) | | — | | (27) | |
| | | |
| OCI, net of tax | (2,156) | | — | | (2,156) | |
| Comprehensive loss | $ | (1,539) | | $ | (258) | | $ | (1,797) | |
TALCOTT RESOLUTION LIFE INSURANCE COMPANY AND SUBSIDIARIES
NOTES TO CONSOLIDATED FINANCIAL STATEMENTS
1. Basis of Presentation and Significant Accounting Policies (continued)
| | | | | | | | | | | |
| Consolidated Statement of Stockholder's Equity |
| For the Year Ended December 31, 2022 (Successor Company) |
| As Previously
Reported | Restatement
Impacts | As
Restated |
| Common Stock | | | |
| Beginning balance | $ | 6 | | $ | — | | $ | 6 | |
| Ending balance | 6 | | — | | 6 | |
| | | |
| Additional Paid-In Capital | | | |
| Beginning balance | 1,877 | | — | | 1,877 | |
| Ending balance | 1,877 | | — | | 1,877 | |
| | | |
| Accumulated Other Comprehensive Loss | | | |
| Beginning balance | (10) | | — | | (10) | |
| Other comprehensive loss | (2,156) | | — | | (2,156) | |
| Ending balance | (2,166) | | — | | (2,166) | |
| | | |
| Retained Earnings | | | |
| Beginning balance | 280 | | — | | 280 | |
| Net income | 617 | | (258) | | 359 | |
| Ending balance | 897 | | (258) | | 639 | |
| Total stockholder's equity, ending balance | $ | 614 | | $ | (258) | | $ | 356 | |
TALCOTT RESOLUTION LIFE INSURANCE COMPANY AND SUBSIDIARIES
NOTES TO CONSOLIDATED FINANCIAL STATEMENTS
1. Basis of Presentation and Significant Accounting Policies (continued)
| | | | | | | | | | | |
| Consolidated Statement of Cash Flows |
| Successor Company |
| For the Year Ended December 31, 2022 |
| (In millions) | As Previously
Reported | Restatement
Impacts | As
Restated |
| Operating Activities | | | |
| Net income | $ | 617 | | $ | (258) | | $ | 359 | |
| Adjustments to reconcile net income to net cash provided by operating activities | | | |
| Net realized capital (gains) losses | (317) | | 327 | | 10 | |
| Amortization of deferred reinsurance gain | (33) | | — | | (33) | |
| Amortization of VOBA | 79 | | — | | 79 | |
| | | |
| | | |
| Depreciation and amortization | 227 | | — | | 227 | |
| Deferred income tax expense | 125 | | (69) | | 56 | |
| Interest credited on investment and universal life-type contracts | 534 | | — | | 534 | |
| Other operating activities, net | (38) | | — | | (38) | |
| Change in assets and liabilities: | | | |
| Increase in reinsurance recoverables | (758) | | — | | (758) | |
| Increase for future policy benefits and unearned premiums | 230 | | — | | 230 | |
| | | |
| | | |
| Net changes in other assets and other liabilities | 93 | | — | | 93 | |
| Net proceeds from reinsurance transactions | 121 | | — | | 121 | |
| Net cash provided by operating activities | 880 | | — | | 880 | |
| Investing Activities | | | |
| Proceeds from the sale/maturity/prepayment of: | | | |
| Fixed maturities, available-for-sale | 6,185 | | — | | 6,185 | |
| | | |
| Equity securities, at fair value | 26 | | — | | 26 | |
| Mortgage loans | 258 | | — | | 258 | |
| Partnerships | 64 | | — | | 64 | |
| Payments for the purchase of: | | | |
| Fixed maturities, available-for-sale | (4,255) | | — | | (4,255) | |
| Fixed maturities, fair value option | (352) | | — | | (352) | |
| Equity securities, at fair value | (22) | | — | | (22) | |
| Mortgage loans | (667) | | — | | (667) | |
| Partnerships | (158) | | — | | (158) | |
| Net proceeds from repurchase agreements program | 25 | | — | | 25 | |
| Net payments for derivatives | (559) | | — | | (559) | |
| Net payments for policy loans | (11) | | — | | (11) | |
| | | |
| Net payments for short-term investments | (255) | | — | | (255) | |
| Net cash provided by investing activities | 279 | | — | | 279 | |
| Financing Activities | | | |
| Deposits and other additions to investment and universal life-type contracts | 2,033 | | — | | 2,033 | |
| Withdrawals and other deductions from investment and universal life-type contracts | (8,109) | | — | | (8,109) | |
| Net transfers from separate accounts related to investment and universal life-type contracts | 5,140 | | — | | 5,140 | |
| Net decrease in securities loaned or sold under agreements to repurchase | (99) | | — | | (99) | |
| | | |
| Net cash used for financing activities | (1,035) | | — | | (1,035) | |
| | | |
| Net increase in cash | 124 | | — | | 124 | |
| Cash — beginning of period | 49 | | — | | 49 | |
| Cash — end of period | $ | 173 | | $ | — | | $ | 173 | |
| Supplemental Disclosure of Cash Flow Information: | | | |
| Income taxes received | $ | 142 | | $ | — | | $ | 142 | |
| | | |
| | | |
| | | |
TALCOTT RESOLUTION LIFE INSURANCE COMPANY AND SUBSIDIARIES
NOTES TO CONSOLIDATED FINANCIAL STATEMENTS
1. Basis of Presentation and Significant Accounting Policies (continued)
Description of Business
As of December 31, 2022, the Company managed approximately 490 thousand annuity contracts with an account value of approximately $36.7 billion, gross of reinsurance, and private placement life insurance with an account value of approximately $39.0 billion. Upon the Company's acquisition by Sixth Street, the Company's strategy changed to be one of a life insurance aggregator through reinsurance. Since the Sixth Street acquisition, the Company has participated in multiple assumed reinsurance transactions that have positioned the Company, as part of the Talcott Financial Group, as a leading participant in this area of the life insurance marketplace. As part of the Company's growth strategy, the Company assumes life insurance blocks of business, providing external insurers with solutions to create capital flexibility and risk management efficiencies. Since the Sixth Street Acquisition and as of December 31, 2022, the Company has assumed fixed indexed annuities of $6.4 billion and variable annuities of $6.6 billion.
On November 1, 2022, the Company entered into a reinsurance agreement with The Guardian Insurance & Annuity Company, Inc. (“GIAC” or "Guardian") to reinsure $7.1 billion in variable annuity reserves, primarily comprised of contracts with living withdrawal benefit and death benefit riders. The Company assumed 100% of $439 in general account reserves on a coinsurance basis and assumed 100% of $6.7 billion in separate account reserves on a modified coinsurance basis. The Company acquired general account assets to support the assumed reserves and received $121 in cash from GIAC upon closing, primarily relating to a ceding commission of $65 and cash settlements. A deferred gain on reinsurance was recorded in other liabilities upon the effective date for approximately $90 and will be recognized in income over the expected life of the underlying policies. As part of this transaction, the Company entered into an administration services agreement for the reinsured block and will ultimately administer the reinsured block within two years following the close of the transaction.
On December 30, 2021, pursuant to a reorganization approved by the Connecticut Department of Insurance ("CTDOI") on November 18, 2021, TLI contributed the Company to TR Re and TR Re subsequently became the Company's direct parent. TR Re was formed on June 28, 2021 and is an approved Class E insurer under the Bermuda Monetary Authority.
On December 30, 2021, the Company entered into a reinsurance agreement with Allianz Life Insurance Company of North America ("Allianz") to assume approximately $8.0 billion of fixed indexed annuities ("FIA") reserves ("Inforce Agreement"). The Company assumed 100% of one block (approximately $5.0 billion of FIA reserves) and 5% of another block (approximately $3.0 billion of FIA reserves) on a coinsurance basis and the Company acquired general account assets to support these assumed reserves. Certain of the FIAs included living withdrawal benefits. The Company paid $693 to Allianz upon closing, primarily relating to a ceding commission of $866, offset by cash settlements. The Company will participate in an aggregated hedging pool administered by Allianz, whereby the Company will pay Allianz a fee in order to participate in the pool and will receive an index credit payout based on the level of participation in the pool. A deferred gain on reinsurance was recorded in other liabilities upon the effective date for approximately $25 and will be recognized in income over the expected life of the underlying policies. On July 29, 2022, the Company executed a flow reinsurance agreement with Allianz. Under the terms of the transaction, the Company assumed certain FIA contracts issued by Allianz after August 2, 2022 on a coinsurance basis ("Flow Agreement"). Allianz will continue to service and administer the policies reinsured under the Inforce Agreement and Flow Agreement as the direct insurer of the business. On December 31, 2022, the Company retroceded 75% of the business assumed from Allianz to TR Re on a modified coinsurance basis. As a result of the retrocession, the Company recorded a deferred gain of $137.
On December 30, 2021, the Company entered into an affiliated reinsurance agreement with its parent TR Re. The Company generally ceded 50% of reserves related to variable and payout annuity blocks, with 100% of certain variable annuity guarantees and certain structured settlement contracts ceded at a lesser quota share percentage. All but the Company’s terminal funding block was ceded on a modified coinsurance basis, with the terminal funding block ceded on a coinsurance with funds withheld basis. The reinsured business ceded was the Company's direct written business and was not previously assumed. This affiliate reinsurance transaction was accounted for in accordance with reinsurance accounting. Under this method, a deferred gain on reinsurance was recorded in other liabilities of approximately $805 and will be recognized in income over the expected life of the underlying policies. The Company will continue to service and administer the policies as insurer of the reinsured block of business and will remain responsible for fulfilling its obligations to policyholders. The Company paid TR Re $100 in ceding commission and an additional $84 to settle tax balances associated with the transaction as part of the arrangement.
On September 17, 2021, the Company executed a flow reinsurance transaction with Lincoln National Corporation's ("Lincoln") insurance subsidiary, The Lincoln National Life Insurance Company. The Company coinsured a living benefit rider on variable annuity contracts issued by Lincoln between April 1, 2021 through June 30, 2022 up to a maximum of $1.5 billion of reinsured deposits. In June 2022, the Company entered into an extension of the agreement through June 30, 2023, at a lower quota share for contracts issued subsequent to June 30, 2022. Lincoln will continue to service and administer the policies as direct insurer of the business.
For additional information regarding reinsurance transactions, refer to Note 5 - Reinsurance.
TALCOTT RESOLUTION LIFE INSURANCE COMPANY AND SUBSIDIARIES
NOTES TO CONSOLIDATED FINANCIAL STATEMENTS
1. Basis of Presentation and Significant Accounting Policies (continued)
In conjunction with the sale from The Hartford Financial Services Group ("The Hartford") in 2018, the Company entered into a five year transition services agreement with The Hartford to provide general ledger, cash management, investment accounting and information technology infrastructure services. In March 2019, the Company converted its existing transition services agreement for investment accounting services into an administrative service agreement, which expires in May 2023. The transition services agreement with The Hartford for the remaining services ended in 2020, as those services had fully transitioned to the Company.
Consolidation
The Consolidated Financial Statements include the accounts of the Company and entities the Company directly or indirectly has a controlling financial interest in which the Company is required to consolidate. Entities in which the Company has significant influence over the operating and financing decisions but is not required to consolidate are reported using the equity method. All intercompany transactions and balances between the Company and its subsidiaries have been eliminated.
Use of Estimates
The preparation of financial statements, in conformity with U.S. GAAP, requires management to make estimates and assumptions that affect the reported amounts of assets and liabilities and the disclosure of contingent assets and liabilities at the date of the financial statements and the reported amounts of revenues and expenses during the reporting period. Actual results could differ materially from those estimates.
The most significant estimates include:
•Valuation of investments, including the underlying investments within the funds withheld liability;
•Evaluation of credit losses on fixed maturities, available for sale ("AFS");
•Allowance for credit losses (“ACL”) on mortgage loans;
•Valuation of derivative assets and liabilities, including embedded derivatives;
•Valuation of liabilities associated with FIA;
•Estimated gross profits ("EGPs") used to amortize VOBA and liabilities associated with variable annuities, FIA, and other universal life-type contracts, as well as certain deferred reinsurance amounts;
•Evaluation of goodwill and other intangible assets for impairment;
•Valuation of living withdrawal benefits and FIA required to be recorded at fair value;
•Valuation of value of business acquired ("VOBA"), deferred gains on reinsurance, and deferred acquisition costs ("DAC");
•Valuation allowance on deferred tax assets;
•Contingencies relating to corporate litigation and regulatory matters
Certain of these estimates are particularly sensitive to market conditions, and deterioration and/or volatility in the worldwide debt or equity markets could have a material impact on the Consolidated Financial Statements.
Pushdown Accounting
Sixth Street
The Sixth Street Acquisition was accounted for using business combination accounting, together with an election to apply pushdown accounting. The goodwill from the Sixth Street Acquisition is attributable to the Company's expectation that the combined group can leverage its insurance platform to become a life insurance aggregator. Goodwill for the Sixth Street Acquisition is not deductible for tax purposes.
TALCOTT RESOLUTION LIFE INSURANCE COMPANY AND SUBSIDIARIES
NOTES TO CONSOLIDATED FINANCIAL STATEMENTS
1. Basis of Presentation and Significant Accounting Policies (continued)
The following table represents the final determination of the fair value of the assets acquired and liabilities assumed for the Sixth Street Acquisition:
| | | | | |
| Cash and invested assets | $ | 19,711 | |
| VOBA | 565 | |
| Deferred income taxes | 737 | |
| Goodwill | 97 | |
| Other intangible assets | 67 | |
| Reinsurance recoverables and other assets [1] | 30,481 | |
| Separate account assets | 112,857 | |
| Total assets | 164,515 | |
| Reserves for future policy benefits | 21,122 | |
| Other policyholder funds and benefits payable | 25,961 | |
| Funds withheld liability [1] | 1,039 | |
| Other liabilities | 1,653 | |
| Separate account liabilities | 112,857 | |
| Total liabilities | 162,632 | |
| |
| Stockholder's equity | 1,883 | |
| Total liabilities and stockholder's equity | $ | 164,515 | |
[1] Previously reported table was updated to reflect the gross presentation for modified coinsurance reinsurance transactions.
The Successor Company's assets and liabilities are recognized based on TFG’s accounting basis, with an offset to additional paid-in capital. In addition, retained earnings and accumulated other comprehensive income (“AOCI”) of the Predecessor Company are not carried forward, as a new basis of accounting has been established.
Invested Assets
The acquired investments are recorded at fair value through adjustments to additional paid-in capital at the acquisition date.
Value of Business Acquired/Additional Reserves
In conjunction with the acquisition of the Company, a portion of the purchase price was allocated to the right to receive future gross profits from cash flows and earnings of the Company's insurance and investment contracts as of the date of the Sixth Street Acquisition. This intangible asset is called VOBA and is based on the actuarially estimated present value of future cash flows from the Company's insurance and investment contracts in-force as of the date of the transaction. The estimated fair value calculation of VOBA is based on certain assumptions, including equity market returns, mortality, persistency, expenses, discount rates, and other factors that the Company expects to experience in future years. Actual experience on the acquired contracts may vary from these projections and the recovery of VOBA is dependent upon the future profitability of the related business. The Company amortizes VOBA over EGPs and it is reviewed for recoverability quarterly. The fair value of certain acquired obligations of the Company exceeded the book value of assumed in-force policy liabilities resulting in additional reserve liabilities. These liabilities were increased to fair value, which is presented separately from VOBA as an additional insurance liability in other policyholder funds and benefits payable. The additional liability is amortized to income over the life of the underlying policies.
Goodwill
Goodwill represents the excess of the acquisition cost of an acquired business over the fair value of assets acquired and liabilities assumed. Goodwill is not amortized but is tested for impairment at the entity or reporting unit level annually or when events or circumstances arise, such as adverse changes in the business climate, that would more likely than not reduce the fair value of the entity or a reporting unit below its carrying value. Our methodology for conducting this goodwill impairment testing contains both a qualitative and quantitative assessment.
TALCOTT RESOLUTION LIFE INSURANCE COMPANY AND SUBSIDIARIES
NOTES TO CONSOLIDATED FINANCIAL STATEMENTS
1. Basis of Presentation and Significant Accounting Policies (continued)
The Company has the option to initially perform an assessment of qualitative factors in order to determine whether it is more likely than not that the fair value of the entity or a reporting unit is less than its carrying amount. The qualitative factors may include, but are not limited to, economic conditions, industry and market considerations, cost factors, overall financial performance of the entity or a reporting unit and other company and entity-level or reporting unit-specific events. If it is determined that it is more likely than not that the fair value of the entity or reporting unit is less than its carrying amount, we then perform the impairment evaluation using a more detailed quantitative assessment. If the carrying values of the entity or reporting units were to exceed their fair value under that quantitative assessment, the amount of the impairment would be calculated and goodwill would be adjusted accordingly. The Company could directly perform this quantitative assessment, bypassing the qualitative assessment and perform a quantitative impairment test.
As a result of the quantitative review performed for the year ended December 31, 2022, the Company determined that the estimated fair value of TL exceeded its respective carrying value and that goodwill was not impaired. For the year ended December 31, 2021, the Company determined that the goodwill associated with TL was not impaired.
For a discussion of goodwill from the Sixth Street Acquisition, refer to Note 7 - Goodwill and Other Intangible Assets.
Other Intangible Assets
Intangible assets with definite lives are amortized over the estimated useful life of the asset. Amortizing intangible assets primarily consists of internally developed software amortized over a period not to exceed seven years. Intangible assets with indefinite lives, primarily insurance licenses, are not amortized but are reviewed annually in the Company's impairment analysis. They will be tested for impairment more frequently if events or circumstances indicate the fair value of indefinitely lived intangibles is less than the carrying value.
The Company determined during its reviews for December 31, 2022 and 2021 that its other indefinite-lived intangible assets and finite-lived intangible assets were not impaired.
For a discussion of other intangible assets from the Sixth Street Acquisition, refer to Note 7 - Goodwill and Other Intangible Assets.
Future Adoption of New Accounting Standards
Troubled Debt Restructurings and Vintage Disclosures
The Financial Accounting Standards Board ("FASB") issued Accounting Standards Update (“ASU”) 2022-02, Financial Instruments – Credit Losses (Topic 326) – Troubled Debt Restructurings and Vintage Disclosures (“ASU 2022-02”) in March 2022, which eliminates the accounting guidance on troubled debt restructurings for creditors and amends the guidance on vintage disclosures. The amendments require that an entity evaluate whether the loan modification represents a new loan or a continuation of an existing loan, and introduce new requirements related to modifications made to borrowers experiencing financial difficulty. Additionally, ASU 2022-02 enhances disclosures for borrowers experiencing financial difficulty, by requiring current-period gross write-offs by year of origination for creditors with respect to loan refinancing and restructurings and internal risk ratings for financing receivables. ASU 2022-02 is effective for annual periods beginning after December 15, 2022 and interim periods within those annual periods, with early adoption permitted. The Company will adopt the amendments of ASU 2022-02 prospectively in the first quarter of 2023 and does not expect it to have a material impact on the Company.
Fair Value Measurement of Equity Securities Subject to Contractual Sale Restrictions
The FASB issued ASU 2022-03, Fair Value Measurement of Equity Securities Subject to Contractual Sale Restrictions (“ASU 2022-03”) in June 2022. ASU 2022-03 clarifies that a contractual sales restriction is not considered in measuring an equity security at fair value and to introduce new disclosure requirements for equity securities subject to contractual sale restrictions that are measured at fair value. ASU 2022-03 applies to both holders and issuers of equity and equity-linked securities measured at fair value. The amendments in ASU 2022-03 are effective for the Company in fiscal years beginning after December 15, 2023, and interim periods within those fiscal years, with early adopted permitted. The Company will adopt the provisions of ASU 2022-03 in the first quarter of 2024 and does not expect it to have a material impact on the Company.
Accounting for Contract Assets and Contract Liabilities from Contracts with Customers
The FASB issued ASU 2021-08, Accounting for Contract Assets and Contract Liabilities from Contracts with Customers (“ASU 2021-08”) in October 2021, which requires acquiring entities to apply Topic 606, Revenue from Contracts with Customers upon recognizing and measuring contract assets and liabilities in a business combination. This update is intended to improve comparability after a business combination, by providing consistent recognition and measurement of revenue contracts with customers acquired and not acquired in a business combination. ASU 2021-08 is effective for annual periods beginning after December 15, 2022 and interim periods within those annual periods, with early adoption permitted.
TALCOTT RESOLUTION LIFE INSURANCE COMPANY AND SUBSIDIARIES
NOTES TO CONSOLIDATED FINANCIAL STATEMENTS
1. Basis of Presentation and Significant Accounting Policies (continued)
The amendments in ASU 2021-08 should be applied prospectively. We will adopt the provisions of this ASU in the first quarter of 2023 and do not expect it to have a material impact on the Company.
Targeted Improvements to the Accounting for Long Duration Contracts
The FASB issued ASU 2018-12, Targeted Improvements to the Accounting for Long-Duration Contracts ("ASU 2018-12") in August 2018, which impacts the existing recognition, measurement, presentation, and disclosure requirements for certain long-duration contracts issued by an insurance company. The guidance is intended to improve the timeliness of recognizing changes in the liability for future policy benefits ("LFPB"), by requiring annual or more frequent updates of insurance assumptions and modifying rates used to discount future cash flows. Further, the guidance seeks to improve the accounting for certain market-based options or guarantees associated with account balance contracts, simplify the amortization of DAC and other balances amortized on a basis consistent with DAC, and improve the effectiveness of the required disclosures.
This guidance was amended through the issuance of ASU 2020-11, which deferred the effective date the Company is required to adopt the guidance to January 1, 2023 with early adoption permitted. Through the issuance of ASU 2022-05, an insurance entity is permitted, prior to the effective date, to exclude certain contracts from applying the amendments in ASU 2018-12, when those contracts have been derecognized because of a sale or disposal of an individual or a group of contracts or legal entities and in which the insurance entity has no significant continuing involvement with the derecognized contracts. The Company does not currently intend to apply this accounting policy election.
The Company intends to use the full retrospective adoption method, as of the date of the Sixth Street Acquisition. The Company does not expect an impact to stockholder's equity as a result of the adoption of ASU 2018-12, due to the application of purchase accounting; whereby assets and liabilities were transacted at fair value as of the date of the acquisition. Upon the adoption of ASU 2018-12, the change in the carrying value of insurance assets and liabilities as of July 1, 2021 are recorded with an equal and offsetting adjustment to VOBA or an additional reserve. Refer below for further discussion of other impacts upon adoption to the new standard. The adoption is expected to have a material effect on the Company’s results of operations due to the updating of cash flow assumptions for LFPB, recognition of changes to the fair value of market risk benefits (“MRB”), and the change in amortization methodology for DAC and other DAC-like balances.
The Company has made key accounting policy decisions, including insurance policy groupings for recognition and measurement of LFPB, discount rate methodology, development of liability cash flow and claim expense assumptions, and DAC and other DAC-like amortization methodology. Outlined below are four key areas of change, although there are other less significant policy changes not noted below.
| | | | | | | | |
| Amended Topic | Description | Adoption Method and Transition Impact |
| Cash flow and discount rate assumptions underlying insurance liabilities | For nonparticipating traditional and limited-payment insurance contracts, the Company will evaluate, at least annually in the same fiscal quarter, as to whether an update to cash flow assumptions is needed. The Company will update the cash flows used to measure the LFPB, for both changes in future assumptions and actual experience, at least annually.
The updating of cash flows impacts the amount of the deferred profit liability (“DPL”) recorded for limited-payment contracts. The DPL will be adjusted concurrently with any updating of the LFPB.
Cash flows are required to be discounted with an upper-medium grade (or low credit risk) fixed-income instrument yield, with the effect of discount rate changes on the liability recorded in other comprehensive income (“OCI”). The discount rate utilized is intended to reflect the duration characteristics of the corresponding insurance liabilities. The Company will obtain yield curves and spreads for a range of tenors to determine spot yields to discount the cash flows of the insurance liabilities as of each valuation date. | The Company will adopt the guidance for LFPB, as of the date of the Sixth Street Acquisition. As of the acquisition date, the Company expects there will be a decrease to LFPB (and the associated reinsurance recoverable), which will be offset by a net increase to an additional reserve. This is due to the application of purchase accounting associated with the Sixth Street Acquisition, which employed lower discount rates for the fair value calculations than the required discount rates to value the cash flows on the insurance liabilities under ASU 2018-12. |
TALCOTT RESOLUTION LIFE INSURANCE COMPANY AND SUBSIDIARIES
NOTES TO CONSOLIDATED FINANCIAL STATEMENTS
1. Basis of Presentation and Significant Accounting Policies (continued)
| | | | | | | | |
| Amended Topic | Description | Adoption Method and Transition Impact |
| MRB | The Company currently offers and assumes certain guarantees and product features on variable annuity and FIA products, which protect the contractholder from other-than-nominal capital market risk and expose the Company to other-than-nominal capital market risk. These MRB features are required to be measured at fair value with changes in fair value recorded in net income, with the exception of the changes in MRB liabilities attributable to a change in an entity’s nonperformance risk, which is required to be recognized in OCI. For products that are reinsured, the portion of the change in MRB attributable to changes in the reinsurer’s nonperformance risk is recognized in income. The Company shall maximize the use of relevant observable information and minimize the use of unobservable information in determining the balance of the MRB upon adoption. | The Company will adopt the guidance for MRB using the full retrospective method. As of the acquisition date, the Company expects there to be an increase to the MRB liability (and the associated reinsurance recoverable) and a decrease to VOBA, as a result of the difference between the establishment of the MRB recorded at fair value under ASU 2018-12 and reserves previously recorded for those benefits. |
| Amortization of DAC and other DAC-like balances | The Company will amortize DAC and other DAC-like balances on a constant-level basis over the expected term for a group of contracts consistent with the groupings used in estimating the associated LFPB. The constant-level basis for the group approximates a pattern of straight-line amortization at an individual contract level by using a method specific to the underlying product. The amortization rate utilized is calculated at the end of the current reporting period, including actual experience and any assumption updates. The revised amortization rate is applied prospectively from the beginning of the current reporting period. | As a result of amortizing DAC and other DAC-like balances on a constant-level basis, the Company does not expect a significant impact upon the adoption of ASU 2018-12. |
| Reporting and Disclosures | ASU 2018-12 requires certain enhanced presentation and disclosures including disaggregated rollforwards for LFPB, policyholder account balances, MRB, separate account liabilities, DAC and other DAC-like balances, and information about significant inputs, judgments and methods used in the LFPB measurement. The enhanced disclosures are intended to improve the ability of users of the financial statements to evaluate the timing, amount, and uncertainty of cash flows arising from long-duration contracts. | The Company’s implementation efforts and the evaluation of the impacts of the guidance on its consolidated financial statements, as well as its systems, processes, and controls, continue to progress. Given the nature and extent of the required changes to a significant portion of the Company’s operations, the adoption of this guidance is expected to have a material impact on its financial position and results of operations. In addition, there will be a significant increase in required disclosures. |
TALCOTT RESOLUTION LIFE INSURANCE COMPANY AND SUBSIDIARIES
NOTES TO CONSOLIDATED FINANCIAL STATEMENTS
1. Basis of Presentation and Significant Accounting Policies (continued)
Significant Accounting Policies
The Company’s significant accounting policies are as follows:
Segment Information
The Company has no reportable segments and its principal products and services are comprised of variable, fixed and payout annuities, FIAs, and private-placement life insurance. The Company's determination that it has no reportable segments is based on the fact that the Company's chief operating decision maker reviews the Company's financial performance at a consolidated level.
Revenue Recognition
For investment and universal life-type contracts, the amounts collected from policyholders are considered deposits and are not included in revenue. Policy charges and fee income for variable annuity, FIA, deferred annuity and other universal life-type contracts primarily consists of policy charges for policy administration, cost of insurance charges and surrender charges assessed against policyholders’ account balances and are recognized in the period in which services are provided. For the Company’s traditional life products, premiums are recognized as revenue when due from policyholders.
Investments
Overview
The Company’s investments in fixed maturities include bonds, structured securities, redeemable preferred stock and commercial paper. Most of these investments are classified as AFS and are carried at fair value, net of ACL. The after-tax difference between fair value and cost or amortized cost is reflected in stockholder's equity as a component of AOCI, after adjustments for the effect of VOBA and reserve adjustments. Equity securities are measured at fair value with any changes in valuation reported in net income. Mortgage loans are recorded at the outstanding principal balance adjusted for amortization of premiums or discounts, net of ACL. Policy loans are carried at outstanding balance. Limited partnerships and other alternative investments are reported at their carrying value and are primarily accounted for under the equity method with the Company’s share of earnings included in net investment income. Recognition of income related to limited partnerships and other alternative investments accounted for under the equity method is delayed due to the availability of the related financial information, as private equity and other funds are generally on a three-month lag and hedge funds generally on a one-month lag. Accordingly, income for the year ended December 31, 2022 (Successor Company), the period of July 1, 2021 to December 31, 2021 (Successor Company), the period of January 1, 2021 to June 30, 2021 (Predecessor Company), and the year ended December 31, 2020 (Predecessor Company), may not include the full impact of current year changes in valuation of the underlying assets and liabilities of the funds, which are generally obtained from the limited partnerships and other alternative investments’ general partners. Other investments consist of derivative instruments which are carried at fair value and real estate acquired in satisfaction of debt. Short-term investments, including cash equivalents, are carried at amortized cost, which approximates fair value.
Fair Value Option ("FVO")
The Company has elected the FVO for rated feeder fund investments, where a single entity issues both debt securities and equity interests and the Company owns both the debt security and equity interest portions of the investment. The Company has elected the FVO for these investments to reflect changes in fair value in earnings and to align the timing of the fair value measurement for its multiple investments in that single entity.
Credit Losses
An ACL is recognized as an estimate of credit losses expected over the life of financial instruments, such as mortgage loans, reinsurance recoverables and off-balance sheet credit exposures that the Company cannot unconditionally cancel. The measurement of the expected credit loss estimate is based on historical loss data, current conditions, and reasonable and supportable forecasts.
Credit losses on fixed maturities, AFS carried at fair value are measured through an other-than-temporary impairment ("OTTI"); however, losses are recognized through the ACL and no longer as an adjustment to the amortized cost. Recoveries of OTTI on fixed maturities, AFS are recognized as reversals of the ACL recognized through net realized capital gains and losses and no longer accreted as net investment income through an adjustment to the investment yield. Additionally, purchased financial assets with a more-than-insignificant amount of credit deterioration since original issuance establishes an ACL at acquisition, which is recorded with the purchase price to establish the initial amortized cost of the investment.
TALCOTT RESOLUTION LIFE INSURANCE COMPANY AND SUBSIDIARIES
NOTES TO CONSOLIDATED FINANCIAL STATEMENTS
1. Basis of Presentation and Significant Accounting Policies (continued)
Net Realized Capital Gains and Losses
Net realized capital gains and losses from investment sales are reported as a component of revenues and are determined on a specific identification basis. Net realized capital gains and losses also result from fair value changes in equity securities, derivatives contracts (both freestanding and embedded) that do not qualify, or are not designated, as a hedge for accounting purposes, and certain investments where the FVO has been elected. The entire change in fair value of the FVO investment includes the components related to dividends and interest income. Impairments and changes in the ACL on fixed maturities, AFS; mortgage loans; and reinsurance recoverables are recognized as net realized capital losses in accordance with the Company’s impairment and ACL policies as discussed in Note 3 - Investments of Notes to Consolidated Financial Statements. Foreign currency transaction remeasurements are also included in net realized capital gains and losses.
Interest income from fixed maturities, FVO is recognized when earned on the constant effective yield method based on estimated timing of cash flows.
Net Investment Income
Interest income from fixed maturities, AFS and mortgage loans is recognized when earned on the constant effective yield method based on estimated timing of cash flows. The amortization of premium and accretion of discount for fixed maturities also takes into consideration call and maturity dates that produce the lowest yield. For securitized financial assets subject to prepayment risk, yields are recalculated and adjusted periodically to reflect historical and/or estimated future prepayments using the retrospective method; however, if these investments have previously recognized an ACL and for certain other asset-backed securities, any yield adjustments are made using the prospective method. Prepayment fees and make-whole payments on fixed maturities and mortgage loans are recorded in net investment income when earned. For equity securities, dividends are recognized as investment income on the ex-dividend date. Limited partnerships and other alternative investments primarily use the equity method of accounting to recognize the Company’s share of earnings. Expected credit losses on fixed maturities, AFS are recorded through an ACL. The Company’s non-income producing investments were not material for the year ended December 31, 2022 (Successor Company), the period of July 1, 2021 to December 31, 2021 (Successor Company), the period of January 1, 2021 to June 30, 2021 (Predecessor Company), and the year ended December 31, 2020 (Predecessor Company). In addition, net investment income includes a portion of the change in funds withheld at interest, as a result of the change in the risk-free rate on the host contract.
Derivative Instruments
Overview
The Company utilizes a variety of over-the-counter ("OTC") transactions, OTC cleared through central clearing houses ("OTC-cleared"), and exchange traded derivative instruments as part of its overall risk management strategy as well as to enter into replication transactions. The types of instruments may include swaps, caps, floors, forwards, futures and options to achieve one of four Company-approved objectives:
•to hedge risk arising from interest rate, equity market, commodity market, credit spread and issuer default, price or currency exchange rate risk or volatility;
•to manage liquidity;
•to control transaction costs;
•to enter into synthetic replication transactions.
Interest rate and credit default swaps involve the periodic exchange of cash flows with other parties, at specified intervals, calculated using agreed upon rates or other financial variables and notional principal amounts. Generally, little to no cash or principal payments are exchanged at the inception of the contract. Typically, at the time a swap is entered into, the cash flow streams exchanged by the counterparties are equal in value.
Interest rate cap and floor contracts entitle the purchaser to receive from the issuer at specified dates, the amount, if any, by which a specified market rate exceeds the cap strike interest rate or falls below the floor strike interest rate, applied to a notional principal amount. A premium payment determined at inception is made by the purchaser of the contract and no principal payments are exchanged.
Forward contracts are customized commitments that specify a rate of interest or currency exchange rate to be paid or received on an obligation beginning on a future start date and are typically settled in cash.
Financial futures are standardized commitments to either purchase or sell designated financial instruments, at a future date, for a specified price and may be settled in cash or through delivery of the underlying instrument. Futures contracts trade on organized exchanges. Margin requirements for futures are met by pledging securities or cash, and changes in the futures’ contract values are settled daily in cash.
TALCOTT RESOLUTION LIFE INSURANCE COMPANY AND SUBSIDIARIES
NOTES TO CONSOLIDATED FINANCIAL STATEMENTS
1. Basis of Presentation and Significant Accounting Policies (continued)
Option contracts grant the purchaser, for a premium payment, the right to either purchase from or sell to the issuer a financial instrument at a specified price, within a specified period or on a stated date. The contracts may reference commodities, which grant the purchaser the right to either purchase from or sell to the issuer commodities at a specified price, within a specified period or on a stated date. Option contracts are typically settled in cash.
Foreign currency swaps exchange an initial principal amount in two currencies, agreeing to re-exchange the currencies at a future date, at an agreed upon exchange rate. There may also be a periodic exchange of payments at specified intervals calculated using the agreed upon rates and exchanged principal amounts.
The Company’s derivative transactions conducted in insurance company subsidiaries are used in strategies permitted under the derivative use plans required by the State of Connecticut and the State of New York insurance departments.
Accounting and Financial Statement Presentation of Derivative Instruments and Hedging Activities
Derivative instruments are recognized on the Consolidated Balance Sheets at fair value and are reported in other investments and other liabilities. For balance sheet presentation purposes, the Company has elected to offset the fair value amounts, income accruals, and related cash collateral receivables and payables of OTC derivative instruments executed in a legal entity and with the same counterparty or under a master netting agreement, which provides the Company with the legal right of offset.
The Company clears certain interest rate swap and credit default swap derivative transactions through central clearing houses. OTC-cleared derivatives require initial collateral at the inception of the trade in the form of cash or highly liquid securities, such as U.S. Treasuries and government agency investments. Central clearing houses also require additional cash as variation margin based on daily market value movements. For information on collateral, see the derivative collateral arrangements section in Note 4 - Derivatives of Notes to Consolidated Financial Statements. In addition, OTC-cleared transactions include price alignment amounts either received or paid on the variation margin, which are reflected in realized capital gains and losses or, if characterized as interest, in net investment income.
On the date the derivative contract is entered into, the Company designates the derivative as (1) a hedge of the variability in cash flows of a forecasted transaction or of amounts to be received or paid related to a recognized asset or liability (“cash flow” hedge), (2) a hedge of a net investment in a foreign operation (“net investment” hedge) or (3) held for other investment and/or risk management purposes, which primarily involve managing asset or liability related risks and do not qualify for hedge accounting.
Cash Flow Hedges - Changes in the fair value of a derivative that is designated and qualifies as a cash flow hedge, including foreign-currency cash flow hedges, are recorded in AOCI and are reclassified into earnings when the variability of the cash flow of the hedged item impacts earnings. Gains and losses on derivative contracts that are reclassified from AOCI to current period earnings are included in the line item in the Consolidated Statements of Operations in which the cash flows of the hedged item are recorded. Periodic derivative net coupon settlements are recorded in the line item of the Consolidated Statements of Operations in which the cash flows of the hedged item are recorded. Cash flows from cash flow hedges are presented in the same category as the cash flows from the items being hedged on the Consolidated Statements of Cash Flows.
Other Investment and/or Risk Management Activities - The Company’s other investment and/or risk management activities primarily relate to strategies used to reduce economic risk or replicate permitted investments and do not receive hedge accounting treatment. Changes in the fair value, including periodic derivative net coupon settlements, of derivative instruments held for other investment and/or risk management purposes are reported in current period earnings as net realized capital gains and losses.
Hedge Documentation and Effectiveness Testing
To qualify for hedge accounting treatment, a derivative must be highly effective in mitigating the designated changes in fair value or cash flow of the hedged item. At hedge inception, the Company formally documents all relationships between hedging instruments and hedged items, as well as its risk-management objective and strategy for undertaking each hedge transaction. The documentation process includes linking derivatives that are designated as fair value, cash flow, or net investment hedges to specific assets or liabilities on the balance sheet or to specific forecasted transactions and defining the effectiveness testing methods to be used. The Company also formally assesses both at the hedge’s inception and ongoing on a quarterly basis, whether the derivatives that are used in hedging transactions have been and are expected to continue to be highly effective in offsetting changes in fair values, cash flows or net investment in foreign operations of hedged items. Hedge effectiveness is assessed primarily using quantitative methods as well as using qualitative methods. Quantitative methods include regression or other statistical analysis of changes in fair value or cash flows associated with the hedge relationship. Qualitative methods may include comparison of critical terms of the derivative to the hedged item.
TALCOTT RESOLUTION LIFE INSURANCE COMPANY AND SUBSIDIARIES
NOTES TO CONSOLIDATED FINANCIAL STATEMENTS
1. Basis of Presentation and Significant Accounting Policies (continued)
Discontinuance of Hedge Accounting
The Company discontinues hedge accounting prospectively when (1) it is determined that the qualifying criteria are no longer met; (2) the derivative is no longer designated as a hedging instrument; or (3) the derivative expires or is sold, terminated or exercised.
When cash flow hedge accounting is discontinued because the Company becomes aware that it is not probable that the forecasted transaction will occur, the derivative continues to be carried on the balance sheet at its fair value, and gains and losses that were accumulated in AOCI are recognized immediately in earnings.
In other situations in which hedge accounting is discontinued, including those where the derivative is sold, terminated or exercised, amounts previously deferred in AOCI are reclassified into earnings when earnings are impacted by the hedged item.
Embedded Derivatives
The Company purchases investments and has previously issued and assumed via reinsurance financial products that contain embedded derivative instruments. When it is determined that (1) the embedded derivative possesses economic characteristics that are not clearly and closely related to the economic characteristics of the host contract and (2) a separate instrument with the same terms would qualify as a derivative instrument, the embedded derivative is bifurcated from the host for measurement purposes. The embedded derivative, which is reported with the host instrument on the Consolidated Balance Sheets, is carried at fair value with changes in fair value reported in net realized capital gains and losses.
Credit Risk
Credit risk is defined as the risk of financial loss due to uncertainty of an obligor’s or counterparty’s ability or willingness to meet its obligations in accordance with agreed upon terms. Credit exposures are measured using the market value of the derivatives, resulting in amounts owed to the Company by its counterparties or potential payment obligations from the Company to its counterparties. The Company generally requires that OTC derivative contracts, other than certain forward contracts, be governed by International Swaps and Derivatives Association ("ISDA") agreements which are structured by legal entity and by counterparty and permit right of offset. Some agreements require daily collateral settlement based upon agreed upon thresholds. For purposes of daily derivative collateral maintenance, credit exposures are generally quantified based on the prior business day’s market value and collateral is pledged to and held by, or on behalf of, the Company to the extent the current value of the derivatives exceed the contractual thresholds. For the Company’s domestic derivative programs, the maximum uncollateralized threshold for a derivative counterparty for a single legal entity is $7. The Company also minimizes the credit risk of derivative instruments by entering into transactions with high quality counterparties primarily rated A or better, which are monitored and evaluated by the Company’s risk management team and reviewed by senior management. OTC-cleared derivatives are governed by clearing house rules. Transactions cleared through a central clearing house reduce risk due to their ability to require daily variation margin and act as an independent valuation source. In addition, the Company monitors counterparty credit exposure on a monthly basis to ensure compliance with Company policies and statutory limitations.
Cash
Cash represents cash on hand and demand deposits with banks or other financial institutions, as well as money market funds.
Reinsurance
The Company cedes to affiliated and unaffiliated insurers to enable the Company to manage capital and risk exposure. The Company also assumes from unaffiliated insurers to provide our counterparties with risk management solutions. The Company's historical reinsurance cessions provided a level of risk mitigation desired by prior ownership. The Company's current reinsurance assumptions and internal retrocessions provide strategic business growth opportunities. In ceding and assuming risks, the Company may use various types of reinsurance including coinsurance, modified coinsurance, coinsurance with funds withheld arrangements, and yearly renewable term. Failure of reinsurers to honor their obligations could result in losses to the Company. Ceded reinsurance arrangements do not discharge the Company as the primary insurer, except for instances where the primary policy or policies have been novated.
Premiums and benefits and losses reflect the net effects of ceded and assumed reinsurance transactions. Included in other assets are prepaid reinsurance premiums, which represent the portion of premiums ceded to reinsurers applicable to the unexpired terms of the reinsurance agreements. Included in reinsurance recoverables are balances due from reinsurance companies for paid and unpaid losses and are presented net of an ACL which is based on the expectation of lifetime credit loss.
TALCOTT RESOLUTION LIFE INSURANCE COMPANY AND SUBSIDIARIES
NOTES TO CONSOLIDATED FINANCIAL STATEMENTS
1. Basis of Presentation and Significant Accounting Policies (continued)
Reinsurance accounting is followed for ceded and assumed transactions that provide indemnification against loss or liability relating to insurance risk (risk transfer). To meet risk transfer requirements, a reinsurance agreement must include insurance risk, consisting of underwriting, investment, and timing risk, and a reasonable possibility of a significant loss to the reinsurer. If the ceded and assumed transactions do not meet risk transfer requirements, the Company accounts for these transactions as financing transactions. The deferred gain or acquisition cost related to long-duration contracts is accounted for over the life of the underlying reinsured policies using assumptions consistent with those used to account for the underlying policies and is primarily amortized on a constant-level basis.
Under coinsurance arrangements, reserves and investment assets are transferred from the ceding insurer to the reinsurer. In certain arrangements, the reinsurer will hold the assets supporting the reserves in a trust for the benefit of the ceding insurer.
Under modified coinsurance arrangements, both the ceded reserves and the investment assets that support the reserves are retained by the cedant and profit and loss with respect to the obligations and investment returns flow through periodic net settlements. Under coinsurance with funds withheld arrangements, ceded reserves are transferred to the reinsurer, however, investment assets that support the reserves are retained by the cedant, and profit and loss with respect to only the investment returns flow through periodic net settlements. Both modified coinsurance and coinsurance with funds withheld arrangements require the cedant to establish a mechanism which legally segregates the underlying assets. The Company has the right of offset on general account assets and liabilities reinsured on a modified coinsurance and coinsurance with funds withheld basis, but have elected to present balances due to and due from reinsurance counterparties on a gross basis, within reinsurance recoverables and funds withheld liability on the Consolidated Balance Sheets. Modified coinsurance of assumed separate accounts accounted for under reinsurance accounting is presented on a net basis on the Consolidated Balance Sheets. As a result of the net presentation of the reinsured separate account assets and liabilities, we have revenue recorded from the reinsurance separate accounts as fee income, but not an associated asset or liability on the Consolidated Balance Sheets.
A funds withheld liability is established which represents the fair value of investment assets segregated under ceded modified coinsurance or coinsurance with funds withheld reinsurance arrangements. The funds withheld liability is comprised of a host contract and an embedded derivative. For ceded reinsurance agreements, the cedant has an obligation to pay the total return on the assets supporting the funds withheld liability. Interest accrues at a risk-free rate on the host contract and is recorded as net investment income in the Consolidated Statements of Operations. The embedded derivative is similar to a total return swap on the income generated by the underlying assets held by the cedant. The change in the embedded derivative is recorded in net realized capital gains (losses).
The Company evaluates the financial condition of its reinsurers and concentrations of credit risk. Reinsurance is placed with reinsurers that meet strict financial criteria established by the Company.
Value of Business Acquired
VOBA represents the estimated value assigned to the right to receive future gross profits from cash flows and earnings of acquired insurance and investment contracts as of the date of the acquisition. It is based on the actuarially estimated present value of future cash flows from the acquired insurance and investment contracts in-force as of the date of the acquisition. The principal assumptions used in estimating VOBA include equity market returns, mortality, persistency, expenses, and discount rates, in addition to other factors that the Company expects to experience in future years. Actual experience on the acquired contracts may vary from these projections and the recovery of VOBA is dependent upon the future profitability of the related business. For certain transactions, the fair value of acquired obligations of the Company exceed the book value of assumed in-force policy liabilities resulting in additional insurance liabilities. In pushdown accounting, these liabilities were increased to fair value, which is presented separately from VOBA as an additional insurance liability included in other policyholder funds and benefits payable on the Consolidated Balance Sheets. The Company amortizes VOBA over EGPs and it is reviewed for recoverability quarterly.
The Company also uses the present value of EGPs to determine reserves for universal life type contracts (including VA) with death or other insurance benefits such as guaranteed minimum death benefits, life-contingent guaranteed minimum withdrawal and universal life insurance secondary guarantee benefits. These benefits are accounted for and collectively referred to as death and other insurance benefit reserves and are held in addition to the account value liability representing policyholder funds.
TALCOTT RESOLUTION LIFE INSURANCE COMPANY AND SUBSIDIARIES
NOTES TO CONSOLIDATED FINANCIAL STATEMENTS
1. Basis of Presentation and Significant Accounting Policies (continued)
For most life insurance product contracts, including variable annuities, the Company estimates gross profits over 20 years as EGPs emerging subsequent to that time frame are immaterial. Future gross profits are projected over the estimated lives of the underlying contracts, based on future account value projections for variable annuity products. The projection of future account values requires the use of certain assumptions including: separate account returns; separate account fund mix; fees assessed against the contract holder’s account balance; full and partial surrender rates; interest credited; mortality; and annuitization rates. Changes in these assumptions and changes to other assumptions such as expenses and hedging costs cause EGPs to fluctuate, which impacts earnings.
In the third quarter of 2022, the Company completed a comprehensive policyholder behavior assumption study which resulted in a non-market related after-tax charge and incorporated the results of that study into its projection of future gross profits. Additionally, throughout the year, the Company evaluates various aspects of policyholder behavior and will revise its policyholder behavior assumptions if credible emerging data indicates that changes are warranted. Upon completion of an annual assumption study or evaluation of credible new information, the Company will revise its assumptions to reflect its current best estimate. These assumption revisions will change the projected account values and the related EGPs in the VOBA models, as well as EGPs used in the death and other insurance benefit reserving models.
All assumption changes that affect the estimate of future EGPs including the update of current account values and policyholder behavior assumptions are considered an Unlock in the period of revision. An Unlock adjusts the VOBA, death and other insurance benefit reserve balances on the Consolidated Balance Sheets with an offsetting benefit or charge on the Consolidated Statements of Operations in the period of the revision. An Unlock revises EGPs to reflect the Company's current best estimate assumptions. The Company also tests the aggregate recoverability of VOBA by comparing the existing balance to the present value of future EGPs. An Unlock that results in an after-tax benefit generally occurs as a result of actual experience or future expectations of product profitability being favorable compared to previous estimates. An Unlock that results in an after-tax charge generally occurs as a result of actual experience or future expectations of product profitability being unfavorable compared to previous estimates.
Policyholders or their beneficiaries may make modifications to existing contracts. If the new modification results in a substantially changed replacement contract, the existing VOBA is written off through income. If the modified contract is not substantially changed, the existing VOBA continues to be amortized and incremental costs are expensed in the period incurred.
Income Taxes
The Company recognizes taxes payable or refundable for the current year and deferred taxes for the tax consequences of temporary differences between the financial reporting and tax basis of assets and liabilities. Deferred tax assets and liabilities are measured using enacted tax rates expected to apply to taxable income in the years the temporary differences are expected to reverse. A deferred tax provision is recorded for the tax effects of differences between the Company's current taxable income and its income before tax under U.S. GAAP in the Consolidated Statements of Operations. For deferred tax assets, the Company records a valuation allowance that is adequate to reduce the total deferred tax asset to an amount that will more likely than not be realized.
Separate Accounts
The Company records the variable account value portion of variable annuities, variable life insurance products and individual, institutional, and governmental investment contracts within separate accounts. Separate account assets are reported at fair value and separate account liabilities are reported at amounts consistent with separate account assets. Investment income and gains and losses from those separate account assets accrue directly to the policyholder, who assumes the related investment risk, and are offset by the change in the related liability. The Company earns fee income for investment management, certain administrative services and mortality and expense risks.
Reserve for Future Policy Benefits
Reserve for Future Policy Benefits on Universal Life-type Contracts
Certain contracts classified as universal life-type include death and other insurance benefit features. These features include guaranteed minimum death benefit ("GMDB") and the life-contingent portion of guaranteed minimum withdrawal benefit ("GMWB") riders offered with variable annuity contracts, including assumed variable annuity contracts, secondary guarantee benefits offered with universal life insurance contracts, as well as GLWB riders and guaranteed annuitization benefits offered by assumed variable annuity and FIA contracts. GMDB riders on variable annuities provide a death benefit during the accumulation phase that is generally equal to the greater of (a) the contract value at death or (b) premium payments less any prior withdrawals and may include adjustments that increase the benefit, such as for maximum anniversary value ("MAV"). For the Company's products with life-contingent GMWB riders, the withdrawal benefit can exceed the guaranteed remaining balance ("GRB"), which is generally equal to premiums less withdrawals. In addition to recording an account value liability that represents policyholder funds, the Company records a death and other insurance benefit liability for
TALCOTT RESOLUTION LIFE INSURANCE COMPANY AND SUBSIDIARIES
NOTES TO CONSOLIDATED FINANCIAL STATEMENTS
1. Basis of Presentation and Significant Accounting Policies (continued)
GMDBs, the life-contingent portion of GMWBs and the universal life insurance secondary guarantees. Universal life insurance secondary guarantee benefits ensure that the policy will not terminate, and will continue to provide a death benefit, even if there is insufficient policy value to cover the monthly deductions and charges. GLWBs on FIA contracts allow guaranteed lifetime withdrawals even if account value is otherwise insufficient. Certain FIA contracts contain a second notional account value which provides additional annuitization benefits. This death and other insurance benefit liability is reported in reserve for future policy benefits on the Company’s Consolidated Balance Sheets. Changes in the death and other insurance benefit reserves are recorded in benefits and losses in the Company’s Consolidated Statements of Operations.
The death and other insurance benefit liability is determined by estimating the expected present value of the benefits in excess of the policyholder’s expected account value in proportion to the present value of total expected assessments and investment margin. Total expected assessments are the aggregate of all contract charges, including those for administration, mortality, expense, and surrender. The liability is accrued as actual assessments are earned. The expected present value of benefits and assessments are generally derived from a set of stochastic scenarios that have been calibrated to assumed market rates of return and assumptions including volatility, discount rates, lapse rates and mortality experience. Consistent with the Company’s policy on the Unlock, the Company regularly evaluates estimates used and adjusts the liability, with a related charge or credit to benefits and losses. For further information on the Unlock, see the Value of Business Acquired accounting policy section within this footnote.
The Company reinsures a majority of its FIA, a portion of its in-force GMDB and GMWB risks, and all of its universal life insurance secondary guarantees.
Reserve for Future Policy Benefits on Traditional Annuity and Other Contracts
Traditional annuities recorded within the reserve for future policy benefits primarily include life-contingent contracts in the payout phase such as structured settlements and terminal funding agreements. Other contracts within the reserve for policyholder benefits include whole life and guaranteed term life insurance contracts. The reserve for future policy benefits is calculated using standard actuarial methods considering the present value of future benefits and related expenses to be paid less the present value of the portion of future premiums required using assumptions “locked in” at the time the policies were issued, including discount rate, withdrawal, mortality and expense assumptions deemed appropriate at the issue date. Future policy benefits are computed at amounts that, with additions from any estimated premiums to be received and with interest on such reserves compounded annually at assumed rates, are expected to be sufficient to meet the Company’s policy obligations at their maturities or in the event of an insured’s death. While assumptions are locked in upon issuance of new contracts and annuitizations of existing contracts, significant changes in experience or assumptions may require the Company to establish premium deficiency reserves. Premium deficiency reserves, if any, are established based on current assumptions without considering a provision for adverse deviation. Changes in or deviations from the assumptions used can significantly affect the Company’s reserve levels and results from operations.
The Company uses reinsurance for a portion of its fixed and payout annuity businesses and its life insurance business.
Other Policyholder Funds and Benefits Payable
Other policyholder funds and benefits payable primarily include the non-variable account values associated with variable annuities, including account values for assumed variable annuities, assumed FIA and other universal life-type contracts, investment contracts, assumed FIAs and the non-life contingent portion of variable annuity GMWBs that are accounted for as embedded derivatives at fair value as well as other policyholder account balances associated with our life insurance businesses and assumed reinsurance. Investment contracts are non-life contingent and include institutional and governmental deposits, structured settlements and fixed annuities. The liability for investment contracts is equal to the balance that accrues to the benefit of the contract holder as of the financial statement date, which includes the accumulation of deposits plus credited interest, less withdrawals, payments and assessments through the financial statement date. For discussion of the fair value of GMWBs and assumed FIAs that represent embedded derivatives, refer to Note 2 - Fair Value Measurements of Notes to Consolidated Financial Statements.
TALCOTT RESOLUTION LIFE INSURANCE COMPANY AND SUBSIDIARIES
NOTES TO CONSOLIDATED FINANCIAL STATEMENTS (continued)
2. Fair Value Measurements
The Company carries certain financial assets and liabilities at estimated fair value. Fair value is defined as the price that would be received to sell an asset or paid to transfer a liability in the principal or most advantageous market in an orderly transaction between market participants. Our fair value framework includes a hierarchy that gives the highest priority to the use of quoted prices in active markets, followed by the use of market observable inputs, followed by the use of unobservable inputs. The fair value hierarchy levels are as follows:
Level 1 Fair values based primarily on unadjusted quoted prices for identical assets or liabilities, in active markets that the Company has the ability to access at the measurement date.
Level 2 Fair values primarily based on observable inputs, other than quoted prices included in Level 1, or based on prices for similar assets and liabilities.
Level 3 Fair values derived when one or more of the significant inputs are unobservable (including assumptions about risk). With little or no observable market, the determination of fair values uses considerable judgment and represents the Company’s best estimate of an amount that could be realized in a market exchange for the asset or liability. Also included are securities that are traded within illiquid markets and/or priced by independent brokers.
The Company will classify the financial asset or liability by level based upon the lowest level input that is significant to the determination of the fair value. In most cases, both observable inputs (e.g., changes in interest rates) and unobservable inputs (e.g., changes in risk assumptions) are used to determine fair values that the Company has classified within Level 3.
TALCOTT RESOLUTION LIFE INSURANCE COMPANY AND SUBSIDIARIES
NOTES TO CONSOLIDATED FINANCIAL STATEMENTS (continued)
2. Fair Value Measurements (continued)
| | | | | | | | | | | | | | |
| Assets and (Liabilities) Carried at Fair Value by Hierarchy Level as of December 31, 2022 (Successor Company) |
| As Restated |
| | Total | Quoted Prices in Active Markets for Identical Assets (Level 1) | Significant Observable Inputs
(Level 2) | Significant Unobservable Inputs (Level 3) |
| Assets Accounted for at Fair Value on a Recurring Basis | | | | |
| Fixed maturities, AFS | | | | |
| Asset backed securities ("ABS") | $ | 254 | | $ | — | | $ | 213 | | $ | 41 | |
| Collateralized loan obligations ("CLOs") | 676 | | — | | 567 | | 109 | |
| Commercial mortgage-backed securities ("CMBS") | 1,514 | | — | | 1,237 | | 277 | |
| Corporate | 10,241 | | — | | 9,622 | | 619 | |
| Foreign government/government agencies | 315 | | — | | 311 | | 4 | |
| Municipal | 1,040 | | — | | 1,039 | | 1 | |
| Residential mortgage-backed securities ("RMBS") | 417 | | — | | 400 | | 17 | |
| U.S. Treasuries | 926 | | — | | 926 | | — | |
| Total fixed maturities, AFS | 15,383 | | — | | 14,315 | | 1,068 | |
| Fixed maturities, FVO | 331 | | — | | 25 | | 306 | |
| Equity securities, at fair value | 179 | | — | | 155 | | 24 | |
| Limited partnerships and other alternative investments, FVO | 58 | | — | | — | | 58 | |
| Derivative assets | | | | |
| | | | |
| | | | |
| Foreign exchange derivatives | 1 | | — | | 1 | | — | |
| | | | |
| | | | |
| Macro hedge program | 194 | | — | | 39 | | 155 | |
| Total derivative assets [1] | 195 | | — | | 40 | | 155 | |
| Short-term investments | 1,489 | | 742 | | 610 | | 137 | |
| Reinsurance recoverable for FIA options | 49 | | — | | — | | 49 | |
| Reinsurance recoverable for FIA embedded derivative | 288 | | — | | — | | 288 | |
| Reinsurance recoverable for GMWB | (131) | | — | | — | | (131) | |
| Modified coinsurance reinsurance contracts | 129 | | — | | 129 | | — | |
| Separate account assets [2] | 86,122 | | 52,642 | | 33,139 | | 53 | |
| Total assets accounted for at fair value on a recurring basis | $ | 104,092 | | $ | 53,384 | | $ | 48,413 | | $ | 2,007 | |
| (Liabilities) Accounted for at Fair Value on a Recurring Basis | | | | |
| Other policyholder funds and benefits payable | | | | |
| FIA embedded derivative | $ | (385) | | $ | — | | $ | — | | $ | (385) | |
| GMWB embedded derivative | 131 | | — | | — | | 131 | |
| | | | |
| Total other policyholder funds and benefits payable | (254) | | — | | — | | (254) | |
| Derivative liabilities | | | | |
| Credit derivatives | 4 | | — | | 4 | | — | |
| | | | |
| Foreign exchange derivatives | 14 | | — | | 14 | | — | |
| Interest rate derivatives | (1) | | — | | (1) | | — | |
| | | | |
| Macro hedge program | 17 | | — | | 24 | | (7) | |
| Total derivative liabilities [3] | 34 | | — | | 41 | | (7) | |
| | | | |
| Funds withheld on modified coinsurance reinsurance contracts | 560 | | — | | 597 | | (37) | |
| Total (liabilities) accounted for at fair value on a recurring basis | $ | 340 | | $ | — | | $ | 638 | | $ | (298) | |
TALCOTT RESOLUTION LIFE INSURANCE COMPANY AND SUBSIDIARIES
NOTES TO CONSOLIDATED FINANCIAL STATEMENTS (continued)
2. Fair Value Measurements (continued)
| | | | | | | | | | | | | | |
| Assets and (Liabilities) Carried at Fair Value by Hierarchy Level as of December 31, 2021 (Successor Company) |
| Total | Quoted Prices in Active Markets for Identical Assets (Level 1) | Significant Observable Inputs
(Level 2) | Significant Unobservable Inputs
(Level 3) |
| Assets Accounted for at Fair Value on a Recurring Basis | | | | |
| Fixed maturities, AFS | | | | |
| ABS | $ | 258 | | $ | — | | $ | 258 | | $ | — | |
| CLOs | 944 | | — | | 785 | | 159 | |
| CMBS | 2,335 | | — | | 2,059 | | 276 | |
| Corporate | 13,357 | | 39 | | 12,653 | | 665 | |
| Foreign government/government agencies | 362 | | — | | 362 | | — | |
| Municipal | 1,456 | | — | | 1,455 | | 1 | |
| RMBS | 811 | | — | | 737 | | 74 | |
| U.S. Treasuries | 1,448 | | 127 | | 1,321 | | — | |
| Total fixed maturities, AFS | 20,971 | | 166 | | 19,630 | | 1,175 | |
| | | | |
| Equity securities, at fair value | 203 | | 11 | | 171 | | 21 | |
| Derivative assets | | | | |
| Credit derivatives | 2 | | — | | 2 | | — | |
| | | | |
| Foreign exchange derivatives | 7 | | — | | 7 | | — | |
| Interest rate derivatives | 18 | | — | | 15 | | 3 | |
| | | | |
| Macro hedge program | 16 | | — | | (11) | | 27 | |
| Total derivative assets [1] | 43 | | — | | 13 | | 30 | |
| | | | |
| Short-term investments | 1,254 | | 744 | | 435 | | 75 | |
| | | | |
| | | | |
| Reinsurance recoverable for GMWB | (8) | | — | | — | | (8) | |
| | | | |
| Separate account assets [2] | 110,021 | | 69,089 | | 40,449 | | 79 | |
| Total assets accounted for at fair value on a recurring basis | $ | 132,484 | | $ | 70,010 | | $ | 60,698 | | $ | 1,372 | |
| (Liabilities) Accounted for at Fair Value on a Recurring Basis | | | | |
| Other policyholder funds and benefits payable | | | | |
| FIA embedded derivative | $ | (655) | | $ | — | | $ | — | | $ | (655) | |
| GMWB embedded derivative | 80 | | $ | — | | $ | — | | $ | 80 | |
| | | | |
| Total other policyholder funds and benefits payable | (575) | | — | | — | | (575) | |
| Derivative liabilities | | | | |
| | | | |
| | | | |
| Foreign exchange derivatives | 2 | | — | | 2 | | — | |
| Interest rate derivatives | (25) | | — | | (22) | | (3) | |
| | | | |
| Macro hedge program | (229) | | — | | (14) | | (215) | |
| Total derivative liabilities [3] | (252) | | — | | (34) | | (218) | |
| Funds withheld on modified coinsurance reinsurance contracts | 15 | | — | | 15 | | — | |
| Total (liabilities) accounted for at fair value on a recurring basis | $ | (812) | | $ | — | | $ | (19) | | $ | (793) | |
[1] Includes derivative instruments in a net positive fair value position (derivative asset) after consideration of the accrued interest and impact of collateral posting requirements which may be imposed by agreements and applicable law. See footnote 3 to this table for derivative liabilities.
[2] Approximately $1.1 billion and $1.6 billion of investment sales receivables, as of December 31, 2022 and 2021 (Successor Company), respectively, are excluded from this disclosure requirement because they are trade receivables in the ordinary course of business where the carrying amount approximates fair value. Included in the total fair value amount are $289 and $404 of investments, as of December 31, 2022 and 2021 (Successor Company), respectively, for which the fair value is estimated using the net asset value per unit as a practical expedient which are excluded from the disclosure requirement to classify amounts in the fair value hierarchy.
[3] Includes derivative instruments in a net negative fair value position (derivative liability) after consideration of the accrued interest and impact of collateral posting requirements which may be imposed by agreements and applicable law.
TALCOTT RESOLUTION LIFE INSURANCE COMPANY AND SUBSIDIARIES
NOTES TO CONSOLIDATED FINANCIAL STATEMENTS (continued)
2. Fair Value Measurements (continued)
Fixed Maturities, Equity Securities, Limited Partnerships and Other Alternative Investments for Which the Company has Elected the FVO, Short-term Investments, and Freestanding Derivatives, Including the Underlying Investments Within the Funds Withheld Liability
Valuation Techniques
The Company generally determines fair values using valuation techniques that use prices, rates, and other relevant information evident from market transactions involving identical or similar instruments. Valuation techniques also include, where appropriate, estimates of future cash flows that are converted into a single discounted amount using current market expectations. The Company uses a "waterfall" approach comprised of the following pricing sources and techniques, which are listed in priority order:
•Quoted prices, unadjusted, for identical assets or liabilities in active markets, which are classified as Level 1.
•Prices from third-party pricing services, which primarily utilize a combination of techniques. These services utilize recently reported trades of identical, similar, or benchmark securities making adjustments for market observable inputs available through the reporting date. If there are no recently reported trades, they may use a discounted cash flow technique to develop a price using expected cash flows based upon the anticipated future performance of the underlying collateral discounted at an estimated market rate. Both techniques develop prices that consider the time value of future cash flows and provide a margin for risk, including liquidity and credit risk. Most prices provided by third-party pricing services are classified as Level 2 because the inputs used in pricing the securities are observable. However, some securities that are less liquid or trade less actively are classified as Level 3. Additionally, certain long-dated securities, such as municipal securities and bank loans, include benchmark interest rate or credit spread assumptions that are not observable in the marketplace and are thus classified as Level 3.
•Internal matrix pricing is a valuation process internally developed for private placement securities for which the Company is unable to obtain a price from a third-party pricing service. Internal pricing matrices determine credit spreads that, when combined with risk-free rates, are applied to contractual cash flows to develop a price. The Company develops credit spreads using market based data for public securities adjusted for credit spread differentials between public and private securities, which are obtained from a survey of multiple private placement brokers. The market-based reference credit spread considers the issuer’s sector, financial strength, and term to maturity, using an independent public security index, while the credit spread differential considers the non-public nature of the security. Securities priced using internal matrix pricing are classified as Level 2 because the significant inputs are observable or can be corroborated with observable data.
•Independent broker quotes, which are typically non-binding use inputs that can be difficult to corroborate with observable market based data. Brokers may use present value techniques using assumptions specific to the security types, or they may use recent transactions of similar securities. Due to the lack of transparency in the process that brokers use to develop prices, valuations that are based on independent broker quotes are classified as Level 3.
The fair value of freestanding derivative instruments is determined primarily using a discounted cash flow model or option model technique and incorporates counterparty credit risk. In some cases, quoted market prices for exchange-traded and OTC cleared derivatives may be used and in other cases independent broker quotes may be used. The pricing valuation models primarily use inputs that are observable in the market or can be corroborated by observable market data. The valuation of certain derivatives may include significant inputs that are unobservable, such as volatility levels, and reflect the Company’s view of what other market participants would use when pricing such instruments. Unobservable market data is used in the valuation of customized derivatives that are used to hedge certain GMWB variable annuity riders. See the section “GMWB and FIA Embedded, Customized, and Reinsurance Derivatives” below for further discussion of the valuation model used to value these customized derivatives.
Valuation Inputs
Quoted prices for identical assets in active markets are considered Level 1 and consist of on-the-run U.S. Treasuries, money market funds, exchange-traded equity securities, open-ended mutual funds, certain short-term investments, and exchange traded futures and option contracts.
TALCOTT RESOLUTION LIFE INSURANCE COMPANY AND SUBSIDIARIES
NOTES TO CONSOLIDATED FINANCIAL STATEMENTS (continued)
2. Fair Value Measurements (continued)
| | | | | | | | |
| Valuation Inputs Used in Levels 2 and 3 Measurements for Securities and Freestanding Derivatives |
| Level 2
Primary Observable Inputs | Level 3
Primary Unobservable Inputs |
| Fixed Maturity Investments |
| Structured securities (includes ABS, CLOs, CMBS and RMBS) |
| • Benchmark yields and spreads
• Monthly payment information
• Collateral performance, which varies by vintage year and includes delinquency rates, loss severity rates and refinancing assumptions
• Credit default swap indices
Other inputs for ABS, CLOs, and RMBS:
• Estimate of future principal prepayments, derived from the characteristics of the underlying structure
• Prepayment speeds previously experienced at the interest rate levels projected for the collateral | • Independent broker quotes
• Credit spreads beyond observable curve
• Interest rates beyond observable curve
Other inputs for less liquid securities or those that trade less actively, including subprime RMBS:
• Estimated cash flows
• Credit spreads, which include illiquidity premium
• Constant prepayment rates
• Constant default rates
• Loss severity |
| Corporate |
| • Benchmark yields and spreads
• Reported trades, bids, offers of the same or similar securities
• Issuer spreads and credit default swap curves
Other inputs for investment grade privately placed securities that utilize internal matrix pricing:
• Credit spreads for public securities of similar quality, maturity, and sector, adjusted for non-public nature | • Independent broker quotes
• Credit spreads beyond observable curve
• Interest rates beyond observable curve
Other inputs for below investment grade privately placed securities and private bank loans:
• Credit spreads for public securities of similar quality, maturity, and sector, adjusted for non-public nature |
| U.S Treasuries, Municipals, and Foreign government/government agencies |
| • Benchmark yields and spreads
• Issuer credit default swap curves
• Political events in emerging market economies
• Municipal Securities Rulemaking Board reported trades and material event notices
• Issuer financial statements | • Credit spreads beyond observable curve
• Interest rates beyond observable curve |
| Equity Securities |
| • Quoted prices in markets that are not active | • For privately traded equity securities, internal discounted cash flow models utilizing earnings multiples or other cash flow assumptions that are not observable |
| Limited Partnerships and Other Alternative Investments, FVO |
| Not applicable | • Prices of privately traded securities
• Characteristics of privately traded securities, including yield, duration and spread duration |
| Short-term Investments |
| • Benchmark yields and spreads
• Reported trades, bids, offers
• Issuer spreads and credit default swap curves
• Material event notices and new issue money market rates | • Independent broker quotes |
| Derivatives |
| Credit derivatives |
| • Swap yield curve
• Credit default swap curves | Not applicable |
|
| | |
| Foreign exchange derivatives |
| • Swap yield curve
• Currency spot and forward rates
• Cross currency basis curves | Not applicable |
| Interest rate derivatives |
| • Swap yield curve | • Independent broker quotes
• Interest rate volatility
• Swap curve beyond 30 years |
TALCOTT RESOLUTION LIFE INSURANCE COMPANY AND SUBSIDIARIES
NOTES TO CONSOLIDATED FINANCIAL STATEMENTS (continued)
2. Fair Value Measurements (continued)
| | | | | | | | | | | | | | | | | | | | | | | |
| Significant Unobservable Inputs for Level 3 - Securities |
| As of December 31, 2022 (Successor Company) |
| Assets Accounted for at Fair Value on a Recurring Basis | Fair Value | Predominant
Valuation
Technique | Significant Unobservable Input | Minimum | Maximum | Weighted Average [1] | Impact of Increase in Input on Fair Value [2] |
| | | | | | | |
| CLOs [4] | $ | 109 | | Discounted cash flows | Spread | 55bps | 337bps | 325bps | Decrease |
| CMBS | 277 | | Discounted cash flows | Spread (encompasses
prepayment, default risk and loss severity) | 419bps | 1,001bps | 534bps | Decrease |
| Corporate [4] | 901 | | Discounted cash flows | Spread | 71bps | 719bps | 309bps | Decrease |
| | | | | | | |
| RMBS [3] | 13 | | Discounted cash flows | Spread [6] | 62bps | 227bps | 138bps | Decrease |
| | | Constant prepayment rate [6] | 2% | 10% | 6% | Decrease [5] |
| | | Constant default rate [6] | 1% | 4% | 2% | Decrease |
| | | Loss severity [6] | 10% | 65% | 25% | Decrease |
| | | | | | | |
| As of December 31, 2021 (Successor Company) |
| Assets Accounted for at Fair Value on a Recurring Basis | Fair Value | Predominant
Valuation
Technique | Significant Unobservable Input | Minimum | Maximum | Weighted Average [1] | Impact of Increase in Input on Fair Value [2] |
| CLOs | $ | 159 | | Discounted cash flows | Spread | 234bps | 258bps | 257bps | Decrease |
| CMBS | 276 | | Discounted cash flows | Spread (encompasses
prepayment, default risk and loss severity) | 203bps | 637bps | 303bps | Decrease |
| Corporate [4] | 623 | | Discounted cash flows | Spread | 125bps | 1,227bps | 278bps | Decrease |
| | | | | | | |
| RMBS [3] | 65 | | Discounted cash flows | Spread [6] | 39bps | 229bps | 90bps | Decrease |
| | | Constant prepayment rate [6] | 4% | 16% | 8% | Decrease [5] |
| | | Constant default rate [6] | 1% | 4% | 3% | Decrease |
| | | Loss severity [6] | —% | 100% | 64% | Decrease |
[1] The weighted average is determined based on the fair value of the securities.
[2] Conversely, the impact of a decrease in input would have the opposite impact to the fair value as that presented in the table.
[3] Excludes securities for which the Company bases fair value on broker quotations.
[4] Excludes securities for which the Company bases fair value on broker quotations; however, included are broker-priced lower-rated private placement securities for which the Company receives spread and yield information to corroborate the fair value. Amounts for December 31, 2022 include $306 of fixed maturities, FVO.
[5] Decrease for above market rate coupons and increase for below market rate coupons.
[6] Generally, a change in the assumption used for the constant default rate would have been accompanied by a directionally similar change in the assumption used for the loss severity and a directionally opposite change in the assumption used for constant prepayment rate and would have resulted in wider spreads.
TALCOTT RESOLUTION LIFE INSURANCE COMPANY AND SUBSIDIARIES
NOTES TO CONSOLIDATED FINANCIAL STATEMENTS (continued)
2. Fair Value Measurements (continued)
The tables below exclude certain securities for which fair values are predominately based on independent broker quotes.
| | | | | | | | | | | | | | | | | | | | | | | |
| Significant Unobservable Inputs for Level 3 - Freestanding Derivatives |
| As of December 31, 2022 (Successor Company) |
| Fair Value | Predominant Valuation Technique | Significant Unobservable Input | Minimum | Maximum | Weighted Average [1] | Impact of Increase in Input on Fair Value [2] |
| | | | | | | |
| | | | | | | |
| | | | | | | |
| | | | | | | |
| | | | | | | |
| | | | | | | |
| | | | | | | |
| | | | | | | |
| | | | | | | |
| | | | | | | |
| Macro hedge program [3] | | | | | | | |
| Equity options | $ | 65 | | Option model | Equity volatility | 18% | 64% | 26% | Increase |
| | | | | | | |
| Interest rate swaption | 97 | | Option model | Interest rate volatility | 1% | 1% | 1% | Increase |
| As of December 31, 2021 (Successor Company) |
| Fair Value | Predominant Valuation Technique | Significant Unobservable Input | Minimum | Maximum | Weighted Average [1] | Impact of Increase in Input on Fair Value [2] |
| Interest rate derivatives | | | | | | | |
| Interest rate swaps | $ | 3 | | Discounted cash flows | Swap curve beyond 30 years | 2% | 2% | 2% | Decrease |
| Interest rate swaptions | (3) | | Option Model | Interest rate volatility | 1% | 1% | 1% | Increase |
| | | | | | | |
| | | | | | | |
| | | | | | | |
| | | | | | | |
| | | | | | | |
| Macro hedge program [3] | | | | | | | |
| Equity options | (195) | | Option model | Equity volatility | 17% | 63% | 28% | Increase |
| | | | | | | |
| Interest rate swaption | 7 | | Option model | Interest rate volatility | 1% | 1% | 1% | Increase |
[1] The weighted average is determined based on the fair value of the securities.
[2] Conversely, the impact of a decrease in input would have the opposite impact to the fair value as that presented in the table. Changes are based on long positions, unless otherwise noted. Changes in fair value will be inversely impacted for short positions.
[3] Excludes derivatives for which the Company bases fair value on broker quotations.
GMWB and FIA Embedded, Customized and Reinsurance Derivatives
| | | | | |
| GMWB Embedded Derivatives | The Company formerly offered certain variable annuity products with GMWB riders that provide the policyholder with a GRB which is generally equal to premiums less withdrawals. If the policyholder’s account value is reduced to a specified level through a combination of market declines and withdrawals but the GRB still has value, the Company is obligated to continue to make annuity payments to the policyholder until the GRB is exhausted. When payments of the GRB are not life-contingent, the GMWB represents an embedded derivative carried at fair value reported in other policyholder funds and benefits payable on the Consolidated Balance Sheets with changes in fair value reported in net realized capital gains (losses). |
| FIA Embedded Derivative | The Company assumed through reinsurance FIA contracts that provide the policyholder with benefits that depend on the performance of market indices. Benefits in excess of contract guarantees represent an embedded derivative carried at fair value and reported in other policyholder funds and benefits payable on the Consolidated Balance Sheets with changes in fair value reported in net realized capital gains (losses). |
| Freestanding Customized Derivatives | The Company previously held freestanding customized derivative contracts to provide protection from certain capital markets risks for the remaining term of specified blocks of GMWB riders written on a direct basis. These customized derivatives are based on policyholder behavior assumptions specified at the inception of the derivative contracts. The Company retained the risk for differences between assumed and actual policyholder behavior and between the performance of the actively managed funds underlying the separate accounts and their respective indices. These derivatives were reported on the Consolidated Balance Sheets within other investments or other liabilities, as appropriate, after considering the impact of master netting agreements. |
| GMWB Reinsurance Derivative | The Company has reinsurance arrangements with affiliated and unaffiliated reinsurers in place to transfer a portion of its risk of loss due to GMWB. Certain of these arrangements are recognized as derivatives carried at fair value and reported in reinsurance recoverables on the Consolidated Balance Sheets. Changes in the fair value of the reinsurance agreements are reported in net realized capital gains (losses). |
Valuation Techniques
Fair values for FIA and GMWB embedded derivatives, freestanding customized derivatives and reinsurance derivatives are classified as Level 3 in the fair value hierarchy and are calculated using internally developed models that utilize significant unobservable inputs because active, observable markets do not exist for these items. In valuing the GMWB embedded
TALCOTT RESOLUTION LIFE INSURANCE COMPANY AND SUBSIDIARIES
NOTES TO CONSOLIDATED FINANCIAL STATEMENTS (continued)
2. Fair Value Measurements (continued)
derivative, the Company attributes to the derivative a portion of the expected fees to be collected over the expected life of the contract from the contract holder equal to the present value of future GMWB claims. The excess of fees collected from the contract holder in the current period over the portion of fees attributed to the embedded derivative in the current period are associated with the host variable annuity contract and reported in fee income.
Valuation Inputs
The fair value for each of the non-life contingent GMWBs, FIA embedded derivative, the freestanding customized derivatives and the GMWB reinsurance derivative is calculated as an aggregation of the following components: Best Estimate Benefits; Credit Standing Adjustment; and Margins. The Company believes the aggregation of these components results in an amount that a market participant in an active liquid market would require, if such a market existed, to assume the risks associated with the guaranteed minimum benefits and the related reinsurance and customized derivatives. Each component described in the following discussion is unobservable in the marketplace and requires subjectivity by the Company in determining its value.
Best Estimate Benefits
The Best Estimate Benefits are calculated based on actuarial and capital market assumptions related to projected cash flows, including the present value of benefits and related contract charges, over the lives of the contracts, incorporating unobservable inputs including expectations concerning policyholder behavior.
Credit Standing Adjustment
The credit standing adjustment is an estimate of the adjustment to the fair value that market participants would require in determining fair value to reflect the risk that GMWB benefit obligations or the GMWB reinsurance recoverables will not be fulfilled. The Company incorporates a blend of estimates of peer company and reinsurer bond spreads and credit default spreads from capital markets, adjusted for market recoverability.
Margins
The behavior risk margin adds a margin that market participants would require, in determining fair value, for the risk that the Company’s assumptions about policyholder behavior could differ from actual experience. The behavior risk margin is calculated by taking the difference between adverse policyholder behavior assumptions and best estimate assumptions.
| | | | | | | | |
| Valuation Inputs Used in Levels 2 and 3 Measurements for GMWB and FIA Embedded, Customized and Reinsurance Derivatives |
| Level 2
Primary Observable Inputs | Level 3
Primary Unobservable Inputs |
| • Risk-free rates as represented by the Eurodollar futures, LIBOR deposits and swap rates to derive forward curve rates • Correlations of 10 years of observed historical returns across underlying well-known market indices • Correlations of historical index returns compared to separate account fund returns • Equity index levels | • Market implied equity volatility assumptions
• Credit standing adjustment assumptions
• Option budgets
Assumptions about policyholder behavior, including:
• Withdrawal utilization
• Withdrawal rates
• Lapse rates
• Reset elections |
TALCOTT RESOLUTION LIFE INSURANCE COMPANY AND SUBSIDIARIES
NOTES TO CONSOLIDATED FINANCIAL STATEMENTS (continued)
2. Fair Value Measurements (continued)
| | | | | | | | | | | | | | |
| Significant Unobservable Inputs for Level 3 GMWB Embedded, Customized and Reinsurance Derivatives |
| As of December 31, 2022 (Successor Company) |
| Unobservable Inputs (Minimum) | Unobservable Inputs (Maximum) | Weighted
Average | Impact of Increase in Input
on Fair Value Liability [1] |
| Withdrawal utilization [2] | —% | 100% | 62% | Increase |
| Withdrawal rates [3] | 4% | 8% | 6% | Increase |
| Lapse rates [4] | —% | 40% | 3% | Decrease [8] |
| Reset elections [5] | —% | 99% | 10% | Decrease [8] |
| Equity volatility [6] | 18% | 28% | 23% | Increase |
| Credit standing adjustment [7] | 0.1% | 0.3% | 0.3% | Decrease |
| As of December 31, 2021 (Successor Company) |
| Unobservable Inputs (Minimum) | Unobservable Inputs (Maximum) | Weighted
Average | Impact of Increase in Input
on Fair Value Liability [1] |
| Withdrawal utilization [2] | —% | 100% | 62% | Increase |
| Withdrawal rates [3] | 4% | 8% | 6% | Increase |
| Lapse rates [4] | —% | 48% | 5% | Decrease [8] |
| Reset elections [5] | —% | 99% | 8% | Decrease [8] |
| Equity volatility [6] | 11% | 25% | 21% | Increase |
| Credit standing adjustment [7] | —% | 0.2% | 0.1% | Decrease |
| Significant Unobservable Inputs for Level 3 FIA Embedded Derivative |
| As of December 31, 2022 (Successor Company) |
| Unobservable Inputs (Minimum) | Unobservable Inputs (Maximum) | Weighted Average | Impact of Increase in Input
on Fair Value Liability [1] |
| Withdrawal rates [3] | —% | 15.9% | 1.7% | Decrease |
| Lapse rates [4] | 1.0% | 25.0% | 6.5% | Decrease |
| Option budgets [9] | 0.5% | 3.8% | 1.6% | Increase |
| Credit standing adjustment [7] | —% | 0.2% | 0.1% | Decrease |
| As of December 31, 2021 (Successor Company) |
| Unobservable Inputs (Minimum) | Unobservable Inputs (Maximum) | Weighted Average | Impact of Increase in Input
on Fair Value Liability [1] |
| Withdrawal rates [3] | —% | 16% | 2% | Decrease |
| Lapse rates [4] | 1% | 34% | 6% | Decrease |
| Option budgets [9] | 1% | 4% | 2% | Increase |
| Credit standing adjustment [7] | —% | 0.1% | 0.1% | Decrease |
[1] Conversely, the impact of a decrease in input would have the opposite impact to the fair value as that presented in the table.
[2] Range represents assumed percentages of policyholders taking withdrawals.
[3] Range represents assumed annual percentage of allowable amount withdrawn.
[4] Range represents assumed annual percentages of policyholders electing a full surrender.
[5] Range represents assumed annual percentages of eligible policyholders electing to reset their guaranteed benefit base.
[6] Range represents implied market volatilities for equity indices based on multiple pricing sources.
[7] Range represents Company credit spreads, adjusted for market recoverability.
[8] The impact may be an increase for some contracts, particularly those with out of the money guarantees.
[9] Range represents assumed annual budget for index options.
TALCOTT RESOLUTION LIFE INSURANCE COMPANY AND SUBSIDIARIES
NOTES TO CONSOLIDATED FINANCIAL STATEMENTS (continued)
2. Fair Value Measurements (continued)
Separate Account Assets
Separate account assets are primarily invested in mutual funds. Other separate account assets include fixed maturities, limited partnerships, equity securities, short-term investments and derivatives that are valued in the same manner, and using the same pricing sources and inputs, as those investments held by the Company. For limited partnerships in which fair value represents the separate account’s share of the NAV, 53% and 40% were subject to significant liquidation restrictions as of December 31, 2022 and 2021 (Successor Company), respectively. Total limited partnerships that do not allow any form of redemption were 0% as of December 31, 2022 (Successor Company) and 2021 (Successor Company), respectively. Separate account assets classified as Level 3 primarily include long-dated bank loans, subprime RMBS and commercial mortgage loans.
Level 3 Assets and Liabilities Measured at Fair Value on a Recurring Basis Using Significant Unobservable Inputs
The Company uses derivative instruments to manage the risk associated with certain assets and liabilities. However, the derivative instrument may not be classified within the same fair value hierarchy level as the associated asset or liability. Therefore, the realized and unrealized gains and losses on derivatives reported in the Level 3 rollforwards may be offset by realized and unrealized gains and losses of the associated assets and liabilities in other line items of the financial statements.
TALCOTT RESOLUTION LIFE INSURANCE COMPANY AND SUBSIDIARIES
NOTES TO CONSOLIDATED FINANCIAL STATEMENTS (continued)
2. Fair Value Measurements (continued)
The following tables present a reconciliation of the beginning and ending balances for fair value measurements for the year ended December 31, 2022 (Successor Company), for which the Company used significant unobservable inputs (Level 3):
| | | | | | | | | | | | | | | | | | | | | | | | | | | | | |
| Fair Value Rollforwards for Financial Instruments Classified as Level 3 |
| | Total Realized/Unrealized Gains (Losses) | | | | | | |
| Fair Value as of December 31, 2021 | Included in Net Income [1] [2] [6] | Included in OCI [3] | Purchases | Settlements | Sales | Transfers into
Level 3 [4] | Transfers out of Level 3 [4] | Fair Value as of December 31, 2022 |
| Assets | | | | | | | | | |
| Fixed maturities, AFS | | | | | | | | | |
| ABS | $ | — | | $ | — | | $ | (2) | | $ | 52 | | $ | (6) | | $ | — | | $ | — | | $ | (3) | | $ | 41 | |
| CLOs | 159 | | — | | (1) | | 80 | | (54) | | — | | — | | (75) | | 109 | |
| CMBS | 276 | | — | | (26) | | 68 | | (34) | | — | | — | | (7) | | 277 | |
| Corporate | 665 | | (2) | | (43) | | 132 | | (137) | | (10) | | 20 | | (6) | | 619 | |
| Foreign govt./govt. agencies | — | | — | | (1) | | 5 | | — | | — | | — | | — | | 4 | |
| Municipal | 1 | | — | | — | | — | | — | | — | | — | | — | | 1 | |
| RMBS | 74 | | — | | (1) | | 22 | | (26) | | (19) | | — | | (33) | | 17 | |
| Total fixed maturities, AFS | 1,175 | | (2) | | (74) | | 359 | | (257) | | (29) | | 20 | | (124) | | 1,068 | |
| Fixed Maturities, FVO | — | | (21) | | — | | 327 | | — | | — | | — | | — | | 306 | |
| Equity securities, at fair value | 21 | | 6 | | — | | 8 | | (11) | | — | | — | | — | | 24 | |
| LPs and other alternative investments, FVO | — | | 16 | | — | | 42 | | — | | — | | — | | — | | 58 | |
| Freestanding derivatives | | | | | | | | | |
| | | | | | | | | |
| | | | | | | | | |
| | | | | | | | | |
| Interest rate | — | | 22 | | — | | — | | (22) | | — | | — | | — | | — | |
| Macro hedge program | (188) | | 74 | | — | | 351 | | (89) | | — | | — | | — | | 148 | |
| | | | | | | | | |
| Total freestanding derivatives [5] | (188) | | 96 | | — | | 351 | | (111) | | — | | — | | — | | 148 | |
| Short-term investments | 75 | | — | | — | | 192 | | (80) | | — | | — | | (50) | | 137 | |
| Reinsurance recoverable for FIA options | — | | (22) | | — | | 123 | | (52) | | — | | — | | — | | 49 | |
| Reinsurance recoverable for FIA embedded derivative | — | | — | | — | | 288 | | — | | — | | — | | — | | 288 | |
| Reinsurance recoverable for GMWB | (8) | | (14) | | — | | — | | (109) | | — | | — | | — | | (131) | |
| Separate accounts | 79 | | (2) | | — | | 99 | | — | | (23) | | — | | (100) | | 53 | |
| Total assets | $ | 1,154 | | $ | 57 | | $ | (74) | | $ | 1,789 | | $ | (620) | | $ | (52) | | $ | 20 | | $ | (274) | | $ | 2,000 | |
| (Liabilities) | | | | | | | | | |
| | | | | | | | | |
| | | | | | | | | |
| | | | | | | | | |
| | | | | | | | | |
| Other policyholder funds and benefits payable | | | | | | | | | |
| FIA embedded derivative | $ | (655) | | $ | 256 | | $ | — | | $ | (13) | | $ | 27 | | $ | — | | $ | — | | $ | — | | $ | (385) | |
| GMWB embedded derivative | 80 | | 88 | | — | | — | | (37) | | — | | — | | — | | 131 | |
| Total other policyholder funds and benefits payable | (575) | | 344 | | — | | (13) | | (10) | | — | | — | | — | | (254) | |
| Funds withheld on modified coinsurance reinsurance contracts | — | | — | | — | | (37) | | — | | — | | — | | — | | (37) | |
| Total liabilities | $ | (575) | | $ | 344 | | $ | — | | $ | (50) | | $ | (10) | | $ | — | | $ | — | | $ | — | | $ | (291) | |
TALCOTT RESOLUTION LIFE INSURANCE COMPANY AND SUBSIDIARIES
NOTES TO CONSOLIDATED FINANCIAL STATEMENTS (continued)
2. Fair Value Measurements (continued)
The following table presents a reconciliation of the beginning and ending balances for fair value measurements for the period of July 1, 2021 to December 31, 2021 (Successor Company), for which the Company used significant unobservable inputs (Level 3): | | | | | | | | | | | | | | | | | | | | | | | | | | | | | |
| Fair Value Rollforwards for Financial Instruments Classified as Level 3 |
| | Total Realized/Unrealized Gains (Losses) | | | | | | |
| Fair Value as of July 1, 2021 | Included in Net Income [1] [2] [6] | Included in OCI [3] | Purchases | Settlements | Sales | Transfers into
Level 3 [4] | Transfers out of Level 3 [4] | Fair Value as of December 31, 2021 |
| Assets | | | | | | | | | |
| Fixed maturities, AFS | | | | | | | | | |
| ABS | $ | 8 | | $ | — | | $ | — | | $ | — | | $ | — | | $ | — | | $ | — | | $ | (8) | | $ | — | |
| CLOs | 248 | | — | | — | | 34 | | (64) | | — | | — | | (59) | | 159 | |
| CMBS | 143 | | — | | (2) | | 136 | | (1) | | — | | — | | — | | 276 | |
| Corporate | 460 | | 3 | | (2) | | 245 | | (30) | | (11) | | — | | — | | 665 | |
| | | | | | | | | |
| Municipal | — | | — | | — | | — | | — | | — | | 1 | | — | | 1 | |
| RMBS | 108 | | — | | — | | 29 | | (29) | | (19) | | — | | (15) | | 74 | |
| Total fixed maturities, AFS | 967 | | 3 | | (4) | | 444 | | (124) | | (30) | | 1 | | (82) | | 1,175 | |
| | | | | | | | | |
| Equity securities, at fair value | 33 | | 20 | | — | | — | | (32) | | — | | — | | — | | 21 | |
| Freestanding derivatives | | | | | | | | | |
| | | | | | | | | |
| | | | | | | | | |
| | | | | | | | | |
| Interest rate | 2 | | 2 | | — | | (4) | | — | | — | | — | | — | | — | |
| | | | | | | | | |
| | | | | | | | | |
| Total freestanding derivatives [5] | 2 | | 2 | | — | | (4) | | — | | — | | — | | — | | — | |
| | | | | | | | | |
| Reinsurance recoverable for GMWB | (6) | | (8) | | — | | — | | 6 | | — | | — | | — | | (8) | |
| Short-term investments | 14 | | — | | — | | 88 | | (27) | | — | | — | | — | | 75 | |
| Separate accounts | 15 | | — | | — | | 71 | | — | | (5) | | 4 | | (6) | | 79 | |
| Total assets | $ | 1,025 | | $ | 17 | | $ | (4) | | $ | 599 | | $ | (177) | | $ | (35) | | $ | 5 | | $ | (88) | | $ | 1,342 | |
| Liabilities | | | | | | | | | |
| Freestanding derivatives | | | | | | | | | |
| | | | | | | | | |
| Macro hedge program | $ | (237) | | $ | 153 | | $ | — | | $ | (1) | | $ | (103) | | $ | — | | $ | — | | $ | — | | $ | (188) | |
| Total freestanding derivatives [5] | (237) | | 153 | | — | | (1) | | (103) | | — | | — | | — | | (188) | |
| Other policyholder funds and benefits payable | | | | | | | | | |
| FIA embedded derivative | — | | — | | — | | (655) | | — | | — | | — | | — | | (655) | |
| Guaranteed withdrawal benefits | 77 | | 29 | | — | | — | | (26) | | — | | — | | — | | 80 | |
| Total other policyholder funds and benefits payable | 77 | | 29 | | — | | (655) | | (26) | | — | | — | | — | | (575) | |
| Total liabilities | $ | (160) | | $ | 182 | | $ | — | | $ | (656) | | $ | (129) | | $ | — | | $ | — | | $ | — | | $ | (763) | |
TALCOTT RESOLUTION LIFE INSURANCE COMPANY AND SUBSIDIARIES
NOTES TO CONSOLIDATED FINANCIAL STATEMENTS (continued)
2. Fair Value Measurements (continued)
The following table presents a reconciliation of the beginning and ending balances for fair value measurements for the six months ended June 30, 2021 (Predecessor Company), for which the Company used significant unobservable inputs (Level 3): | | | | | | | | | | | | | | | | | | | | | | | | | | | | | |
| Fair Value Rollforwards for Financial Instruments Classified as Level 3 |
| | Total Realized/Unrealized Gains (Losses) | | | | | | |
| Fair Value as of December 31, 2020 | Included in Net Income [1] [2] [6] | Included in OCI [3] | Purchases | Settlements | Sales | Transfers into
Level 3 [4] | Transfers out of Level 3 [4] | Fair Value as of June 30, 2021 |
| Assets | | | | | | | | | |
| Fixed maturities, AFS | | | | | | | | | |
| ABS | $ | — | | $ | — | | $ | — | | $ | 10 | | $ | — | | $ | — | | $ | — | | $ | (2) | | $ | 8 | |
| CLOs | 259 | | — | | — | | 50 | | (36) | | — | | — | | (25) | | 248 | |
| CMBS | 54 | | — | | 2 | | 90 | | — | | — | | 2 | | (5) | | 143 | |
| Corporate | 328 | | — | | (6) | | 132 | | (23) | | (9) | | 53 | | (15) | | 460 | |
| RMBS | 154 | | — | | 1 | | 5 | | (34) | | (15) | | — | | (3) | | 108 | |
| Total fixed maturities, AFS | 795 | | — | | (3) | | 287 | | (93) | | (24) | | 55 | | (50) | | 967 | |
| | | | | | | | | |
| Equity securities, at fair value | 32 | | — | | — | | 1 | | — | | — | | — | | — | | 33 | |
| Freestanding derivatives | | | | | | | | | |
| | | | | | | | | |
| | | | | | | | | |
| | | | | | | | | |
| Interest rate | 2 | | — | | — | | — | | — | | — | | — | | — | | 2 | |
| | | | | | | | | |
| | | | | | | | | |
| | | | | | | | | |
| Total freestanding derivatives [5] | 2 | | — | | — | | — | | — | | — | | — | | — | | 2 | |
| Reinsurance recoverable for GMWB | 7 | | (19) | | — | | — | | 6 | | — | | — | | — | | (6) | |
| Short-term investments | 22 | | — | | — | | 2 | | (10) | | — | | — | | — | | 14 | |
| Separate accounts | 20 | | — | | — | | 2 | | — | | (4) | | 2 | | (5) | | 15 | |
| Total assets | $ | 878 | | $ | (19) | | $ | (3) | | $ | 292 | | $ | (97) | | $ | (28) | | $ | 57 | | $ | (55) | | $ | 1,025 | |
| Liabilities | | | | | | | | | |
| Freestanding derivatives | | | | | | | | | |
| Macro hedge program | $ | (441) | | $ | 385 | | $ | — | | $ | 12 | | $ | (193) | | $ | — | | $ | — | | $ | — | | $ | (237) | |
| Total freestanding derivatives [5] | (441) | | 385 | | — | | 12 | | (193) | | — | | — | | — | | (237) | |
| Other policyholder funds and benefits payable | | | | | | | | | |
| Guaranteed withdrawal benefits | 21 | | 82 | | — | | — | | (26) | | — | | — | | — | | 77 | |
| Total other policyholder funds and benefits payable | 21 | | 82 | | — | | — | | (26) | | — | | — | | — | | 77 | |
| Total liabilities | $ | (420) | | $ | 467 | | $ | — | | $ | 12 | | $ | (219) | | $ | — | | $ | — | | $ | — | | $ | (160) | |
[1] The Company classifies realized and unrealized gains (losses) on FIA and GMWB reinsurance derivatives and GMWB embedded derivatives as unrealized gains (losses) for purposes of disclosure in this table because it is impracticable to track on a contract-by-contract basis the realized gains (losses) for these derivatives and embedded derivatives.
[2] Amounts in these columns are generally reported in net realized capital gains (losses). The realized/unrealized gains (losses) included in net income for separate account assets are offset by an equal amount for separate account liabilities, which results in a net zero impact on net income for the Company. All amounts are before income taxes and amortization.
[3] All amounts are before income taxes and amortization.
[4] Transfers in and/or (out) of Level 3 are primarily attributable to the availability of market observable information and the re-evaluation of the observability of pricing inputs.
[5] Derivative instruments are reported in this table on a net basis for asset (liability) positions and reported on the Consolidated Balance Sheets in other investments and other liabilities.
[6] Includes both market and non-market impacts in deriving realized and unrealized gains (losses).
TALCOTT RESOLUTION LIFE INSURANCE COMPANY AND SUBSIDIARIES
NOTES TO CONSOLIDATED FINANCIAL STATEMENTS (continued)
2. Fair Value Measurements (continued)
| | | | | | | | | | | |
| Changes in Unrealized Gains (Losses) Included in Net Income for Financial Instruments Classified as Level 3 Still Held at End of Period [1] [2] |
| Successor Company | Predecessor Company |
| For the Year Ended December 31, 2022 | For the Period of July 1, 2021 to December 31, 2021 | For the Six Months Ended June 30, 2021 |
| Assets | | | |
| Fixed maturities, AFS | | | |
| | | |
| | | |
| | | |
| Corporate | $ | (2) | | $ | — | | $ | — | |
| | | |
| | | |
| | | |
| Total fixed maturities, AFS | (2) | | — | | — | |
| Fixed maturities, FVO | (21) | | — | | — | |
| Equity securities, at fair value | — | | — | | — | |
| Limited partnerships and other alternative investments, FVO | 16 | | — | | — | |
| Freestanding derivatives | | | |
| | | |
| | | |
| | | |
| Interest rate | (3) | | 2 | | (40) | |
| | | |
| Macro hedge program | 42 | | — | | — | |
| Total freestanding derivatives | 39 | | 2 | | (40) | |
| Reinsurance recoverable for FIA options | (22) | | — | | — | |
| Reinsurance recoverable for GMWB | (14) | | (8) | | (19) | |
| Separate accounts | (2) | | — | | — | |
| Total assets | (6) | | (6) | | (59) | |
| (Liabilities) | | | |
| Freestanding derivatives | | | |
| | | |
| | | |
| Macro hedge program | — | | (63) | | (121) | |
| Total freestanding derivatives | — | | (63) | | (121) | |
| Other policyholder funds and benefits payable | | | |
| FIA embedded derivative | 256 | | — | | — | |
| GMWB embedded derivative | 101 | | 29 | | 82 | |
| Total other policyholder funds and benefits payable | 357 | | 29 | | 82 | |
| Total liabilities | $ | 357 | | $ | (34) | | $ | (39) | |
[1] All amounts presented are reported in net realized capital gains (losses). The realized/unrealized gains (losses) included in net income for separate account assets are offset by an equal amount for separate account liabilities, which results in a net zero impact on net income for the Company. All amounts are before income taxes and amortization.
[2] Amounts presented are for Level 3 only and therefore may not agree to other disclosures included herein.
TALCOTT RESOLUTION LIFE INSURANCE COMPANY AND SUBSIDIARIES
NOTES TO CONSOLIDATED FINANCIAL STATEMENTS (continued)
2. Fair Value Measurements (continued)
| | | | | | | | | | | |
| Changes in Unrealized Gains (Losses) Included in OCI for Financial Instruments Classified as Level 3 Still Held at End of Period [1] |
| Successor Company | Predecessor Company |
| For the Year Ended December 31, 2022 | For the Period of July 1, 2021 to December 31, 2021 | For the Six Months Ended June 30, 2021 |
| Assets | | | |
| Fixed maturities, AFS | | | |
| ABS | $ | (2) | | $ | — | | $ | — | |
| CLOs | (1) | | — | | — | |
| CMBS | (26) | | (2) | | 3 | |
| Corporate | (43) | | (2) | | (4) | |
| | | |
| | | |
| RMBS | (2) | | — | | 1 | |
| Total fixed maturities, AFS | (74) | | (4) | | — | |
| | | |
| | | |
| | | |
| | | |
| | | |
| | | |
| | | |
| | | |
| | | |
| | | |
| | | |
| Total assets | $ | (74) | | $ | (4) | | $ | — | |
[1] Changes in unrealized gains (losses) on fixed maturities, AFS are reported in changes in net unrealized gain on fixed maturities, AFS on the Consolidated Statements of Comprehensive Income (Loss).
| | | | | | | | | | | | | | | | | |
| Financial Assets and Liabilities Not Carried at Fair Value |
| Fair Value
Hierarchy
Level | Successor Company |
| As Restated | | |
| Carrying Amount [1] | Fair
Value | Carrying Amount [1] | Fair
Value |
| December 31, 2022 | December 31, 2021 |
| Assets | | | | | |
| Policy loans | Level 3 | $ | 1,495 | | $ | 1,495 | | $ | 1,484 | | $ | 1,484 | |
| Mortgage loans [1] | Level 3 | $ | 2,520 | | $ | 2,232 | | $ | 2,131 | | $ | 2,138 | |
| Liabilities | | | | | |
| Other policyholder funds and benefits payable [2] | Level 3 | $ | 4,834 | | $ | 4,271 | | $ | 5,137 | | $ | 4,792 | |
| Funds withheld liability | Level 3 | $ | 11,045 | | $ | 11,045 | | $ | 6,379 | | $ | 6,379 | |
[1] As of December 31, 2022 (Successor Company) and 2021 (Successor Company), the carrying amount of mortgage loans was net of ACL of $15 and $12, respectively.
[2] Excludes group accident and health and universal life insurance contracts, including Corporate Owned Life Insurance ("COLI").
TALCOTT RESOLUTION LIFE INSURANCE COMPANY AND SUBSIDIARIES
NOTES TO CONSOLIDATED FINANCIAL STATEMENTS (continued)
3. Investments
| | | | | | | | | | | | | | |
| Net Investment Income |
| Successor Company | Predecessor Company |
| For the Year Ended December 31, 2022 | For the Period of July 1, 2021 to December 31, 2021 | For the Six Months Ended June 30, 2021 | For the Year Ended December 31, 2020 |
| (Before tax) |
| Fixed maturities [1] | $ | 620 | | $ | 174 | | $ | 243 | | $ | 518 | |
| Equity securities | 10 | | 10 | | 2 | | 7 | |
| Mortgage loans | 74 | | 32 | | 45 | | 92 | |
| Policy loans | 82 | | 36 | | 40 | | 82 | |
| Limited partnerships and other alternative investments | 168 | | 259 | | 216 | | 130 | |
| Other [2] | (146) | | 1 | | 1 | | 13 | |
| Investment expense | (30) | | (14) | | (13) | | (26) | |
| Total net investment income | $ | 778 | | $ | 498 | | $ | 534 | | $ | 816 | |
[1] Includes net investment income on short-term investments and excludes amounts related to fixed maturities where the FVO was elected.
[2] Includes income from derivatives that qualify for hedge accounting and hedge fixed maturities along with income on assets from the COLI block of business. Includes a portion of the change in funds withheld liability, due to the risk-free rate on the host contract on modified coinsurance.
| | | | | | | | | | | | | | |
| Net Realized Capital Gains (Losses) |
| Successor Company | Predecessor Company |
| As Restated | | | |
| For the Year Ended December 31, 2022 | For the Period of July 1, 2021 to December 31, 2021 | For the Six Months Ended June 30, 2021 | For the Year Ended December 31, 2020 |
| (Before tax) |
| Gross gains on sales | $ | 2 | | $ | 14 | | $ | 55 | | $ | 166 | |
| Gross losses on sales | (532) | | (20) | | (8) | | (32) | |
| Net realized gains (losses) on sales of equity securities | 5 | | 19 | | — | | — | |
| Change in net unrealized gains (losses) on equity securities [1] | (24) | | (2) | | — | | 1 | |
| Net credit losses on fixed maturities, AFS | (1) | | — | | — | | (1) | |
| Change in ACL on mortgage loans | (3) | | — | | 6 | | (8) | |
| Intent-to-sell impairments | — | | — | | — | | (6) | |
| | | | |
| Change in fair value of fixed maturities, FVO | (21) | | | | |
| Change in fair value of LPs and other alternative investments, FVO | 16 | | | | |
| FIA embedded derivative | 270 | | | | |
| FIA hedging program | (247) | | | | |
| GMWB derivatives, net | | | | 82 | |
| Variable annuity macro hedge program | (1) | | (67) | | (243) | | (414) | |
| Transactional foreign currency revaluation | — | | — | | — | | 3 | |
| Non-qualifying foreign currency derivatives | 7 | | 5 | | (2) | | (7) | |
| Modified coinsurance reinsurance derivative contracts | 809 | | 15 | | 22 | | (50) | |
| Other, net [2] | (290) | | 16 | | (72) | | 192 |
| Net realized capital losses | $ | (10) | | $ | (20) | | $ | (242) | | $ | (74) | |
[1] The net unrealized gains (losses) on equity securities included in net realized capital gains (losses) related to equity securities still held as of December 31, 2022, were $(24) for the year ended December 31, 2022 (Successor Company). The net unrealized gains (losses) on equity securities included in net realized capital gains (losses) related to equity securities still held as of December 31, 2021, were $(3) for the period of July 1, 2021 to December 31, 2021 (Successor Company). The net unrealized gains (losses) on equity securities included in net realized capital gains (losses) related to equity securities still held as of June 30, 2021 were $1 for the six months ended June 30, 2021 (Predecessor Company). The net unrealized gains (losses) on equity securities included in net
TALCOTT RESOLUTION LIFE INSURANCE COMPANY AND SUBSIDIARIES
NOTES TO CONSOLIDATED FINANCIAL STATEMENTS (continued)
3. Investments (continued)
realized capital gains (losses) related to equity securities still held as of December 31, 2020 were $4 for year ended December 31, 2020 (Predecessor Company).
[2] Includes gains (losses) on non-qualifying derivatives, excluding foreign currency derivatives, of $(303) for the year ended December 31, 2022 (Successor Company), $22 for the period of July 1, 2021 to December 31, 2021 (Successor Company), $(76) for the six months ended June 30, 2021 (Predecessor Company) and $199 for the year ended December 31, 2020 (Predecessor Company).
| | | | | | | | | | | | | | |
| Sales of AFS Securities |
| Successor Company | Predecessor Company |
| For the Year Ended December 31, 2022 | For the Period of July 1, 2021 to December 31, 2021 | For the Six Months Ended June 30, 2021 | For the Year Ended December 31, 2020 |
|
| Fixed maturities, AFS | | | | |
| Sale proceeds | $ | 5,897 | | $ | 2,372 | | $ | 1,007 | | $ | 1,789 | |
| Gross gains | 2 | | 14 | | 55 | | 165 | |
| Gross losses | (531) | | (16) | | (8) | | (31) | |
| | | | |
| | | | |
| | | | |
| | | | |
Sales of fixed maturities, AFS in 2022 were primarily a result of strategic asset allocations, tactical changes to the portfolio driven by changing market conditions, and duration and liquidity management.
Accrued Interest Receivable on Fixed Maturities, AFS and Mortgage Loans
As of December 31, 2022 (Successor Company) and 2021 (Successor Company), the Company reported accrued interest receivable related to fixed maturities, AFS of $183 and $178, respectively, and accrued interest receivable related to mortgage loans of $8 and $6, respectively. These amounts are recorded in other assets on the Consolidated Balance Sheets and are not included in the carrying value of the fixed maturities or mortgage loans. The Company does not include the current accrued interest receivable balance when estimating the ACL. The Company has a policy to write-off accrued interest receivable balances that are more than 90 days past due. Write-offs of accrued interest receivable are recorded as a credit loss component of realized capital gains and losses.
Interest income on fixed maturities and mortgage loans is accrued unless it is past due over 90 days or management deems the interest uncollectible.
Recognition and Presentation of Intent-to-Sell Impairments and ACL on Fixed Maturities, AFS
The Company will record an "intent-to-sell impairment" as a reduction to the amortized cost of fixed maturities, AFS in an unrealized loss position if the Company intends to sell or it is more likely than not that the Company will be required to sell the fixed maturity before a recovery in value. A corresponding charge is recorded in net realized capital losses equal to the difference between the fair value on the impairment date and the amortized cost basis of the fixed maturity before recognizing the impairment.
For fixed maturities where a credit loss has been identified and no intent-to-sell impairment has been recorded, the Company will record an ACL for the portion of the unrealized loss related to the credit loss. Any remaining unrealized loss on a fixed maturity after recording an ACL is the non-credit amount and is recorded in OCI. The ACL is the excess of the amortized cost over the greater of the Company's best estimate of the present value of expected future cash flows or the security's fair value. Cash flows are discounted at the effective yield that is used to record interest income. The ACL cannot exceed the unrealized loss and, therefore, it may fluctuate with changes in the fair value of the fixed maturity if the fair value is greater than the Company's best estimate of the present value of expected future cash flows. The initial ACL and any subsequent changes are recorded in net realized capital gains and losses. The ACL is written off against the amortized cost in the period in which all or a portion of the related fixed maturity is determined to be uncollectible.
Developing the Company’s best estimate of expected future cash flows is a quantitative and qualitative process that incorporates information received from third-party sources along with certain internal assumptions regarding the future performance. The Company's considerations include, but are not limited to (a) changes in the financial condition of the issuer and/or the underlying collateral, (b) whether the issuer is current on contractually obligated interest and principal payments, (c) credit ratings, (d) payment structure of the security and (e) the extent to which the fair value has been less than the amortized cost of the security.
For non-structured securities, assumptions include, but are not limited to, economic and industry-specific trends and fundamentals, instrument-specific developments including changes in credit ratings, industry earnings multiples and the issuer’s ability to restructure, access capital markets, and execute asset sales.
TALCOTT RESOLUTION LIFE INSURANCE COMPANY AND SUBSIDIARIES
NOTES TO CONSOLIDATED FINANCIAL STATEMENTS (continued)
3. Investments (continued)
For structured securities, assumptions include, but are not limited to, various performance indicators such as historical and projected default and recovery rates, credit ratings, current and projected delinquency rates, loan-to-value ratios ("LTV"), average cumulative collateral loss rates that vary by vintage year, prepayment speeds, and property value declines. These assumptions require the use of significant management judgment and include the probability of issuer default and estimates regarding timing and amount of expected recoveries which may include estimating the underlying collateral value.
| | | | | | | | | | | | | | | |
| ACL on Fixed Maturities, AFS by Type for the Year Ended December 31, 2022 (Successor Company) |
| (Before tax) | | | | Corporate | | | | | Total |
| Balance, beginning of period | | | | $ | — | | | | | | $ | — | |
| Credit losses on fixed maturities where an allowance was not previously recorded | | | | 1 | | | | | | 1 | |
| | | | | | | | | |
| | | | | | | | | |
| Write-offs charged against the allowance | | | | (1) | | | | | | (1) | |
| Balance, end of period | | | | $ | — | | | | | | $ | — | |
| | | | | | | | | | | | | | | |
| ACL on Fixed Maturities, AFS by Type for the Period of July 1, 2021 to December 31, 2021 (Successor Company) |
| (Before tax) | | | | Corporate | | | | | Total |
| Balance, beginning of period | | | | $ | — | | | | | | $ | — | |
| Credit losses on fixed maturities where an allowance was not previously recorded | | | | — | | | | | | — | |
| | | | | | | | | |
| | | | | | | | | |
| Balance, end of period | | | | $ | — | | | | | | $ | — | |
| | | | | | | | | | | | | | | |
| ACL on Fixed Maturities, AFS by Type for the Six Months Ended June 30, 2021 (Predecessor Company) |
| (Before tax) | | | | Corporate | | | | | Total |
| Balance, beginning of period | | | | $ | 1 | | | | | | $ | 1 | |
| Credit losses on fixed maturities where an allowance was not previously recorded | | | | — | | | | | | — | |
| | | | | | | | | |
| | | | | | | | | |
| Balance, end of period | | | | $ | 1 | | | | | | $ | 1 | |
Fixed Maturities, AFS
| | | | | | | | | | | | | | | | | | | | | | | | | | | | | | | | |
| Fixed Maturities, AFS by Type |
| Successor Company |
| December 31, 2022 | December 31, 2021 |
| Amortized Cost | ACL | Gross Unrealized Gains | Gross Unrealized Losses | Fair Value | Amortized Cost | ACL | Gross Unrealized Gains | Gross Unrealized Losses | Fair Value |
| ABS | $ | 276 | | $ | — | | $ | — | | $ | (22) | | $ | 254 | | $ | 260 | | $ | — | | $ | — | | $ | (2) | | $ | 258 | |
| CLOs | 703 | | — | | — | | (27) | | 676 | | 945 | | — | | — | | (1) | | 944 | |
| CMBS | 1,724 | | — | | 1 | | (211) | | 1,514 | | 2,345 | | — | | 4 | | (14) | | 2,335 | |
| Corporate | 12,565 | | — | | 2 | | (2,326) | | 10,241 | | 13,380 | | — | | 50 | | (73) | | 13,357 | |
| Foreign government/government agencies | 377 | | — | | — | | (62) | | 315 | | 365 | | — | | 1 | | (4) | | 362 | |
| Municipal bonds | 1,309 | | — | | — | | (269) | | 1,040 | | 1,452 | | — | | 10 | | (6) | | 1,456 | |
| RMBS | 503 | | — | | — | | (86) | | 417 | | 818 | | — | | — | | (7) | | 811 | |
| U.S. Treasuries | 1,232 | | — | | — | | (306) | | 926 | | 1,421 | | — | | 28 | | (1) | | 1,448 | |
| Total fixed maturities, AFS | $ | 18,689 | | $ | — | | $ | 3 | | $ | (3,309) | | $ | 15,383 | | $ | 20,986 | | $ | — | | $ | 93 | | $ | (108) | | $ | 20,971 | |
| | | | | | | | | | |
| | | | | | | | | | |
TALCOTT RESOLUTION LIFE INSURANCE COMPANY AND SUBSIDIARIES
NOTES TO CONSOLIDATED FINANCIAL STATEMENTS (continued)
3. Investments (continued)
| | | | | | | | | | | | | | |
| Fixed Maturities, AFS by Contractual Maturity Year |
| Successor Company |
| December 31, 2022 | December 31, 2021 |
| Contractual Maturity | Amortized
Cost | Fair
Value | Amortized
Cost | Fair
Value |
| One year or less | $ | 445 | | $ | 437 | | $ | 341 | | $ | 341 | |
| Over one year through five years | 2,392 | | 2,214 | | 2,904 | | 2,890 | |
| Over five years through ten years | 4,438 | | 3,732 | | 5,248 | | 5,241 | |
| Over ten years | 8,209 | | 6,140 | | 8,125 | | 8,151 | |
| Subtotal | 15,484 | | 12,523 | | 16,618 | | 16,623 | |
| Mortgage-backed, CLOs and ABS | 3,205 | | 2,860 | | 4,368 | | 4,348 | |
| Total fixed maturities, AFS | $ | 18,689 | | $ | 15,383 | | $ | 20,986 | | $ | 20,971 | |
Estimated maturities may differ from contractual maturities due to call or prepayment provisions. Due to the potential for variability in payment speeds (i.e. prepayments or extensions), mortgage-backed and asset-backed securities are not categorized by contractual maturity.
Concentration of Credit Risk
The Company aims to maintain a diversified investment portfolio including issuer, sector and geographic stratification, where applicable, and has established certain exposure limits, diversification standards and review procedures to mitigate credit risk. The Company evaluated its investment exposure to any credit concentration risk of a single issuer greater than 10% of the Company's stockholder's equity. As of December 31, 2022 (Successor Company), we are providing the top 25 investment concentrations, other than the U.S. government and certain U.S. government agencies and commercial mortgage loans, due to the size of our investment portfolio in comparison to our stockholder's equity as of December 31, 2022. As of December 31, 2021 (Successor Company), the Company did not have any credit concentration risk of a single issuer greater than 10% of the Company's stockholder's equity.
TALCOTT RESOLUTION LIFE INSURANCE COMPANY AND SUBSIDIARIES
NOTES TO CONSOLIDATED FINANCIAL STATEMENTS (continued)
3. Investments (continued)
| | | | | |
| Top 25 Investment Holdings by Issuer | Market Value |
| Pacific Investment Management LLC | $ | 347 | |
| Madison Capital Funding | 195 |
| Harbourvest | 131 |
| Bank of America | 121 |
| Twin Brook Capital Partners | 104 |
| Oracle Corporation | 95 |
| Whitehorse Liquidity Partners | 91 |
| Mitsubishi UFJ Financial Group | 90 |
| Citigroup | 88 |
| Mizuho Financial Group | 87 |
| J.P. Morgan & Co. | 85 |
| International Business Machines Corporation | 84 |
| Boeing Company | 82 |
| Goldman Sachs Group, Inc. | 75 |
| Wells Fargo & Company | 74 |
| Sumitomo Mitsui Financial Group | 73 |
| UnitedHealth Group Inc. | 70 |
| Walt Disney Company | 70 |
| Strategic Partners VIII L.P. | 69 |
| T-Mobile US, Inc | 69 |
| Deutsche Telekom International Finance B.V. | 66 |
| Amgen Inc. | 65 |
| Gridiron Capital Fund III LP | 65 |
| ING Group | 63 |
| Strategic Partners Touchdown Holdings L.P. | $ | 62 | |
Unrealized Losses on Fixed Maturities, AFS
| | | | | | | | | | | | | | | | | | | | | | | | | | |
| Unrealized Loss Aging for Fixed Maturities, AFS by Type and Length of Time as of December 31, 2022 |
| Successor Company |
| Less Than 12 Months | | 12 Months or More | | Total |
| Fair
Value | Unrealized
Losses | | Fair
Value | Unrealized
Losses | | Fair
Value | Unrealized
Losses |
| ABS | $ | 96 | | $ | (5) | | | $ | 162 | | $ | (17) | | | $ | 258 | | $ | (22) | |
| CLOs | 644 | | (27) | | | 11 | | — | | | 655 | | (27) | |
| CMBS | 819 | | (102) | | | 682 | | (109) | | | 1,501 | | (211) | |
| Corporate | 6,659 | | (1,544) | | | 3,412 | | (782) | | | 10,071 | | (2,326) | |
| Foreign government/government agencies | 185 | | (41) | | | 128 | | (21) | | | 313 | | (62) | |
| Municipal | 859 | | (219) | | | 180 | | (50) | | | 1,039 | | (269) | |
| RMBS | 123 | | (20) | | | 293 | | (66) | | | 416 | | (86) | |
| U.S. Treasuries | 864 | | (293) | | | 63 | | (13) | | | 927 | | (306) | |
| Total fixed maturities, AFS in an unrealized loss position | $ | 10,249 | | $ | (2,251) | | | $ | 4,931 | | $ | (1,058) | | | $ | 15,180 | | $ | (3,309) | |
| | | | | | | | |
| | | | | | | | |
TALCOTT RESOLUTION LIFE INSURANCE COMPANY AND SUBSIDIARIES
NOTES TO CONSOLIDATED FINANCIAL STATEMENTS (continued)
3. Investments (continued)
| | | | | | | | | | | | | | | | | | | | | | | | | | | | | |
| Unrealized Loss Aging for Fixed Maturities, AFS by Type and Length of Time as of December 31, 2021 |
| Successor Company |
| | Less Than 12 Months | | | 12 Months or More | | | Total |
| | Fair
Value | Unrealized
Losses | | | Fair
Value | Unrealized
Losses | | | Fair
Value | Unrealized
Losses |
| ABS | | $ | 252 | | $ | (2) | | | | $ | — | | $ | — | | | | $ | 252 | | $ | (2) | |
| CLOs | | 751 | | (1) | | | | — | | — | | | | 751 | | (1) | |
| CMBS | | 961 | | (14) | | | | — | | — | | | | 961 | | (14) | |
| Corporate | | 5,788 | | (73) | | | | — | | — | | | | 5,788 | | (73) | |
| Foreign government/government agencies | | 173 | | (4) | | | | — | | — | | | | 173 | | (4) | |
| Municipal | | 337 | | (6) | | | | — | | — | | | | 337 | | (6) | |
| RMBS | | 537 | | (7) | | | | — | | — | | | | 537 | | (7) | |
| U.S. Treasuries | | 217 | | (1) | | | | — | | — | | | | 217 | | (1) | |
| Total fixed maturities, AFS in an unrealized loss position | | $ | 9,016 | | $ | (108) | | | | $ | — | | $ | — | | | | $ | 9,016 | | $ | (108) | |
| | | | | | | | | | | |
| | | | | | | | | | | |
As of December 31, 2022 (Successor Company), fixed maturities, AFS in an unrealized loss position consisted of 4,426 instruments, and were primarily depressed due to higher interest rates and/or wider credit spreads since the purchase and/or application of pushdown accounting dates. As of December 31, 2022 (Successor Company), 57% of these fixed maturities were depressed less than 20% of cost or amortized cost. The increase in unrealized losses during 2022, was primarily attributable to higher interest rates and wider credit spreads.
Most of the fixed maturities depressed for twelve months or more relate to the corporate sector which were primarily depressed because current rates are higher and/or market spreads are wider than at the respective purchase and/or application of pushdown accounting dates. The Company neither has an intention to sell nor does it expect to be required to sell the fixed maturities outlined in the preceding discussion. The decision to record credit losses on fixed maturities, AFS in the form of an ACL requires us to make qualitative and quantitative estimates of expected future cash flows. Actual cash flows could deviate significantly from our expectations resulting in realized losses in future periods.
Mortgage Loans
ACL on Mortgage Loans
The Company reviews mortgage loans on a quarterly basis to estimate the ACL, with changes in the ACL recorded in net realized capital gains (losses). Apart from an ACL recorded on individual mortgage loans where the borrower is experiencing financial difficulties, the Company records an ACL on the pool of mortgage loans based on lifetime expected credit losses. The Company utilizes a third-party forecasting model to estimate lifetime expected credit losses at a loan level under multiple economic scenarios. The scenarios use macroeconomic data provided by an internationally recognized economics firm that generates forecasts of varying economic factors such as GDP growth, unemployment and interest rates. The economic scenarios are projected over 10 years. The first two years to four years of the 10-year period assume a specific modeled economic scenario (including moderate upside, moderate recession and severe recession scenarios) and then revert to historical long-term assumptions over the remaining period. Using these economic scenarios, the forecasting model projects property-specific operating income and capitalization rates used to estimate the value of a future operating income stream. The operating income and the property valuations derived from capitalization rates are compared to loan payment and principal amounts to create debt-service coverage ratios ("DSCRs") and LTVs over the forecast period. The Company's process also considers qualitative factors. The model overlays historical data about mortgage loan performance based on DSCRs and LTVs and projects the probability of default, amount of loss given a default and resulting expected loss through maturity for each loan under each economic scenario. Economic scenarios are probability-weighted based on a statistical analysis of the forecasted economic factors and qualitative analysis. The Company records the change in the ACL on mortgage loans based on the weighted-average expected credit losses across the selected economic scenarios.
When a borrower is experiencing financial difficulty, including when foreclosure is probable, the Company measures an ACL on individual mortgage loans. The ACL is established for any shortfall between the amortized cost of the loan and the fair value of the collateral less costs to sell. Estimates of collectibility from an individual borrower require the use of significant management judgment and include the probability and timing of borrower default and loss severity estimates. In addition, cash flow projections may change based upon new information about the borrower's ability to pay and/or the value of underlying collateral such as changes in projected property value estimates. As of December 31, 2022 (Successor Company) and December 31, 2021 (Successor Company), the Company did not have any mortgage loans for which an ACL
TALCOTT RESOLUTION LIFE INSURANCE COMPANY AND SUBSIDIARIES
NOTES TO CONSOLIDATED FINANCIAL STATEMENTS (continued)
3. Investments (continued)
was established on an individual basis.
There were no mortgage loans held-for-sale as of December 31, 2022 (Successor Company) or 2021 (Successor Company). In addition, as of December 31, 2022 (Successor Company) and 2021 (Successor Company), the Company had no mortgage loans that have had extensions or restructurings other than what is allowable under the original terms of the contract.
| | | | | | | | | | | | | | |
| ACL on Mortgage Loans |
| Successor Company | Predecessor Company |
| For the Year Ended December 31, 2022 | For the Period of July 1, 2021 to December 31, 2021 | For the Six Months Ended June 30, 2021 | For the Year Ended December 31, 2020 |
|
| Beginning balance | $ | 12 | | $ | — | | $ | 17 | | $ | — | |
| Cumulative effect of accounting changes [1] | | | | 9 | |
| Cumulative effect of pushdown accounting | | 12 | | | |
| Adjusted beginning balance ACL | 12 | | 12 | | 17 | | 9 | |
| Current period provision (release) | 3 | | — | | (6) | | 8 | |
| Ending balance | $ | 15 | | $ | 12 | | $ | 11 | | $ | 17 | |
[1] Represents the establishment of an ACL due to the adoption of expected credit loss accounting guidance. Refer to Note 1 - Basis of Presentation and Significant Accounting Policies for additional information.
The increase in the allowance for the year ended December 31, 2022 (Successor Company) was primarily attributable to the deteriorating economic conditions and the potential impact on real estate property valuations and, to a lesser extent, net additions of new loans. The increase in the allowance for the period of July 1, 2021 to December 31, 2021 (Successor Company) was the result of pushdown accounting. The decrease in the allowance for the six months ended June 30, 2021 (Predecessor Company), is the result of improved economic scenarios, including improved GDP growth and unemployment, and higher property valuations as compared to the prior periods. During 2020 (Predecessor Company), the Company increased the estimate of the ACL in response to significant economic stress experienced as a result of the COVID-19 pandemic.
The weighted-average LTV ratio of the Company’s mortgage loan portfolio was 62% as of December 31, 2022 (Successor Company), while the weighted-average LTV ratio at origination of these loans was 53%. LTV ratios compare the loan amount to the value of the underlying property collateralizing the loan with property values based on appraisals updated no less than annually. Factors considered in estimating property values include, among other things, actual and expected property cash flows, geographic market data and the ratio of the property's net operating income to its value. DSCR compares a property’s net operating income to the borrower’s principal and interest payments and are updated no less than annually through reviews of underlying properties.
| | | | | | | | | | | | | | | | | | | | | | | | | | | | | | | | | | | | | | | | | | | | |
| Mortgage Loans LTV & DSCR by Origination Year as of December 31, 2022 (Successor Company) |
| 2022 | 2021 | 2020 | 2019 | 2018 | 2017 & Prior | Total |
| Loan-to-Value | Amortized Cost | Avg. DSCR [2] | Amortized Cost | Avg. DSCR | Amortized Cost | Avg. DSCR | Amortized Cost | Avg. DSCR | Amortized Cost | Avg. DSCR | Amortized Cost | Avg. DSCR | Amortized Cost [1] | Avg. DSCR [2] |
| Greater than 80% | $ | 54 | | —x | $ | — | | —x | $ | — | | —x | $ | — | | —x | $ | — | | —x | $ | 41 | | 2.09x | $ | 95 | | 2.09x |
| 65% - 80% | 10 | | 2.02x | 21 | | 2.51x | 14 | | 2.79x | 27 | | 2.08x | 116 | | 1.28x | 60 | | 1.77x | 248 | | 1.71x |
| Less than 65% | 461 | | 2.47x | 379 | | 2.76x | 166 | | 2.65x | 220 | | 2.92x | 181 | | 2.14x | 785 | | 2.74x | 2,192 | | 2.67x |
| Total mortgage loans | $ | 525 | | 2.45x | $ | 400 | | 2.74x | $ | 180 | | 2.66x | $ | 247 | | 2.83x | $ | 297 | | 1.80x | $ | 886 | | 2.64x | $ | 2,535 | | 2.55x |
[1] As of December 31, 2022 (Successor Company), the amortized cost of mortgage loans excludes ACL of $15.
[2] Ratios exclude certain single family residential mortgage loans.
TALCOTT RESOLUTION LIFE INSURANCE COMPANY AND SUBSIDIARIES
NOTES TO CONSOLIDATED FINANCIAL STATEMENTS (continued)
3. Investments (continued)
| | | | | | | | | | | | | | | | | | | | | | | | | | | | | | | | | | | | | | | | | | | | |
| Mortgage Loans LTV & DSCR by Origination Year as of December 31, 2021 (Successor Company) |
| 2021 | 2020 | 2019 | 2018 | 2017 | 2016 & Prior | Total |
| Loan-to-Value | Amortized Cost | Avg. DSCR | Amortized Cost | Avg. DSCR | Amortized Cost | Avg. DSCR | Amortized Cost | Avg. DSCR | Amortized Cost | Avg. DSCR | Amortized Cost | Avg. DSCR | Amortized Cost [1] | Avg. DSCR |
| | | | | | | | | | | | | | |
| 65% - 80% | $ | 7 | | 2.37x | $ | 18 | | 2.62x | $ | 25 | | 1.55x | $ | 43 | | 1.00x | $ | 41 | | 1.94x | $ | 37 | | 1.23x | $ | 171 | | 1.60x |
| Less than 65% | 378 | | 2.68x | 160 | | 2.43x | 234 | | 2.89x | 270 | | 2.00x | 235 | | 2.27x | 695 | | 2.54x | 1,972 | | 2.50x |
| Total mortgage loans | $ | 385 | | 2.68x | $ | 178 | | 2.45x | $ | 259 | | 2.76x | $ | 313 | | 1.86x | $ | 276 | | 2.22x | $ | 732 | | 2.47x | $ | 2,143 | | 2.42x |
[1] As of December 31, 2021 (Successor Company), the amortized cost of mortgage loans excludes ACL of $12.
| | | | | | | | | | | | | | |
| Mortgage Loans by Region |
| Successor Company |
| December 31, 2022 | December 31, 2021 |
| Amortized
Cost [1] | Percent of Total | Amortized
Cost [1] | Percent of Total |
| East North Central | $ | 74 | | 2.9 | % | $ | 78 | | 3.6 | % |
| East South Central | 32 | | 1.3 | % | 20 | | 0.9 | % |
| Middle Atlantic | 194 | | 7.7 | % | 152 | | 7.1 | % |
| Mountain | 185 | | 7.3 | % | 142 | | 6.6 | % |
| New England | 82 | | 3.2 | % | 87 | | 4.1 | % |
| Pacific | 535 | | 21.1 | % | 559 | | 26.1 | % |
| South Atlantic | 694 | | 27.4 | % | 627 | | 29.3 | % |
| | | | |
| West South Central | 180 | | 7.1 | % | 184 | | 8.6 | % |
| Other [2] | 559 | | 22.0 | % | 294 | | 13.7 | % |
| Total mortgage loans | $ | 2,535 | | 100 | % | $ | 2,143 | | 100 | % |
[1] As of December 31, 2022 (Successor Company) and 2021 (Successor Company), the amortized cost of mortgage loans excludes ACL of $15 and $12, respectively.
[2] Primarily represents loans collateralized by multiple properties in various regions.
| | | | | | | | | | | | | | |
| Mortgage Loans by Property Type |
| Successor Company |
| December 31, 2022 | December 31, 2021 |
| Amortized
Cost [1] | Percent of Total | Amortized
Cost [1] | Percent of Total |
| Commercial | | | | |
| | | | |
| Industrial | $ | 787 | | 31.0 | % | $ | 711 | | 33.2 | % |
| | | | |
| Multifamily | 669 | | 26.4 | % | 590 | | 27.5 | % |
| Office | 383 | | 15.1 | % | 423 | | 19.7 | % |
| Retail | 443 | | 17.5 | % | 403 | | 18.8 | % |
| Single Family | 253 | | 10.0 | % | 16 | | 0.8 | % |
| | | | |
| Total mortgage loans | $ | 2,535 | | 100 | % | $ | 2,143 | | 100 | % |
[1] As of December 31, 2022 (Successor Company) and 2021 (Successor Company), the amortized cost of mortgage loans excludes ACL of $15 and $12, respectively.
Past-Due Mortgage Loans
Mortgage loans are considered past due if a payment of principal or interest is not received according to the contractual terms of the loan agreement, which typically includes a grace period. As of December 31, 2022 (Successor Company) and 2021 (Successor Company), the Company held no mortgage loans considered past due.
TALCOTT RESOLUTION LIFE INSURANCE COMPANY AND SUBSIDIARIES
NOTES TO CONSOLIDATED FINANCIAL STATEMENTS (continued)
3. Investments (continued)
Purchased Financial Assets with Credit Deterioration
Purchased financial assets with credit deterioration ("PCD") are purchased financial assets with a “more-than-insignificant” amount of credit deterioration since origination. PCD assets are assessed only at initial acquisition date and for any investments identified, the Company records an allowance at acquisition with a corresponding increase to the amortized cost basis. As of December 31, 2022 (Successor Company) and 2021 (Successor Company), the Company held no PCD fixed maturities, AFS or mortgage loans.
Variable Interest Entities
The Company is engaged with various special purpose entities and other entities that are deemed to be variable interest entities ("VIEs") primarily as an investor through normal investment activities.
A VIE is an entity that either has investors that lack certain essential characteristics of a controlling financial interest, such as simple majority kick-out rights, or lacks sufficient funds to finance its own activities without financial support provided by other entities. The Company performs ongoing qualitative assessments of its VIEs to determine whether the Company has a controlling financial interest in the VIE and therefore is the primary beneficiary. The Company is deemed to have a controlling financial interest when it has both the ability to direct the activities that most significantly impact the economic performance of the VIE and the obligation to absorb losses or right to receive benefits from the VIE that could potentially be significant to the VIE. Based on the Company’s assessment, if it determines it is the primary beneficiary, the Company consolidates the VIE on the Company’s Consolidated Financial Statements. As of December 31, 2022 (Successor Company) and 2021 (Successor Company), the Company did not hold any VIEs for which it was the primary beneficiary.
Non-Consolidated VIEs
The Company, through normal investment activities, makes passive investments in limited partnerships and other alternative investments. For these non-consolidated VIEs, the Company has determined it is not the primary beneficiary as it has no ability to direct activities that could significantly affect the economic performance of the investments. The Company’s maximum exposure to loss as of December 31, 2022 (Successor Company) and 2021 (Successor Company) is limited to the total carrying value of $1.3 billion and $1.1 billion, respectively, which are included in limited partnerships and other alternative investments on the Company's Consolidated Balance Sheets. As of December 31, 2022 (Successor Company) and 2021 (Successor Company), the Company had outstanding commitments totaling $410 and $419, respectively, whereby the Company is committed to fund these investments and may be called by the partnership during the commitment period to fund the purchase of new investments and partnership expenses. These investments are generally of a passive nature in that the Company does not take an active role in management.
In addition, the Company makes passive investments in structured securities issued by VIEs for which the Company is not the manager. These investments are included in ABS, CLOs, CMBS, and RMBS and are reported in fixed maturities, AFS on the Company’s Consolidated Balance Sheets. The Company has not provided financial or other support with respect to these investments other than its original investment. For these investments, the Company determined it is not the primary beneficiary due to the relative size of the Company’s investment in comparison to the principal amount of the structured securities issued by the VIEs, the Company’s inability to direct the activities that most significantly impact the economic performance of the VIEs, and, where applicable, the level of credit subordination which reduces the Company’s obligation to absorb losses or right to receive benefits. The Company’s maximum exposure to loss on these investments is limited to the amount of the Company’s investment.
Repurchase Agreements and Other Collateral Transactions
The Company enters into securities financing transactions as a way to earn additional income or manage liquidity, primarily through repurchase agreements.
Repurchase Agreements
From time to time, the Company enters into repurchase agreements to manage liquidity or to earn incremental income. A repurchase agreement is a transaction in which one party (transferor) agrees to sell securities to another party (transferee) in return for cash (or securities), with a simultaneous agreement to repurchase the same securities at a specified price at a later date. The maturity of these transactions is generally of ninety days or less. Repurchase agreements include master netting provisions that provide both parties the right to offset claims and apply securities held by them with respect to their obligations in the event of a default. Although the Company has the contractual right to offset claims, the Company's current positions do not meet the specific conditions for net presentation.
Under repurchase agreements, the Company transfers collateral of U.S. government and government agency securities and receives cash. For repurchase agreements, the Company obtains cash in an amount equal to at least 95% of the fair value of the securities transferred. The agreements require additional collateral to be transferred under specified conditions and provide the counterparty the right to sell or re-pledge the securities transferred. The cash received from the repurchase
TALCOTT RESOLUTION LIFE INSURANCE COMPANY AND SUBSIDIARIES
NOTES TO CONSOLIDATED FINANCIAL STATEMENTS (continued)
3. Investments (continued)
program is typically invested in short-term investments or fixed maturities and is reported as an asset on the Company's Consolidated Balance Sheets. The Company accounts for the repurchase agreements as collateralized borrowings. The securities transferred under repurchase agreements are included in fixed maturities, AFS with the obligation to repurchase those securities recorded in other liabilities on the Company's Consolidated Balance Sheets.
From time to time, the Company enters into reverse repurchase agreements where the Company purchases securities and simultaneously agrees to resell the same or substantially the same securities. The maturity of these transactions is generally within one year. The agreements require additional collateral to be transferred to the Company under specified conditions and the Company has the right to sell or re-pledge the securities received. The Company accounts for reverse repurchase agreements as collateralized financing. The receivable for reverse repurchase agreements is included within short-term investments on the Company's Consolidated Balance Sheets.
| | | | | | | | |
| Repurchase Agreements |
| Successor Company |
| December 31, 2022 | December 31, 2021 |
| Fair Value | Fair Value |
| | |
| | |
| | |
| | |
| Repurchase agreements: | | |
| Gross amount of recognized liabilities for repurchase agreements | $ | 564 | | $ | 663 | |
| Gross amount of collateral pledged related to repurchase agreements [1] | $ | 577 | | $ | 679 | |
| Gross amount of recognized receivables for reverse repurchase agreements [2] | $ | 7 | | $ | 44 | |
| | |
[1] Collateral pledged is included within fixed maturities, AFS and short-term investments on the Company's Consolidated Balance Sheets.
[2] Collateral received is included within short-term investments on the Company's Consolidated Balance Sheets.
Other Collateral Transactions
The Company is required by law to deposit securities with government agencies in certain states in which it conducts business. As of December 31, 2022 (Successor Company) and 2021 (Successor Company), the fair value of securities on deposit was $20 and $26, respectively.
For disclosure of collateral in support of derivative transactions, refer to the Derivative Collateral Arrangements section of Note 4 - Derivatives of Notes to Consolidated Financial Statements.
Equity Method Investments
The majority of the Company's investments in limited partnerships and other alternative investments, including hedge funds, mortgage and real estate funds, and private equity and other funds (collectively, “limited partnerships”), are accounted for under the equity method of accounting. The Company recognized total equity method income of $168 for the year ended December 31, 2022 (Successor Company), $259 for the period of December 31, 2021 (Successor Company), $216 for the six months ended June 30, 2021 (Predecessor Company) and $130 for the year ended December 31, 2020 (Predecessor Company). Equity method income is reported in net investment income. The Company’s maximum exposure to loss as of December 31, 2022 (Successor Company) is limited to the total carrying value of $1.3 billion. In addition, the Company has outstanding commitments totaling approximately $410, to fund limited partnership and other alternative investments as of December 31, 2022 (Successor Company).
The Company’s investments in limited partnerships are generally of a passive nature in that the Company does not take an active role in the management of the limited partnerships. In 2022, aggregate investment income (losses) from limited partnerships and other alternative investments exceeded 10% of the Company’s pre-tax consolidated net income. Accordingly, the Company is disclosing aggregated summarized financial data for the Company’s limited partnership investments, including those investments that would have been accounted for under the equity method if the Company had not chosen to elect the FVO. This aggregated summarized financial data does not represent the Company’s proportionate share of limited partnership assets or earnings. Aggregate total assets of the limited partnerships in which the Company invested totaled $172.7 billion and $171.1 billion as of December 31, 2022 (Successor Company) and 2021 (Successor Company), respectively. Aggregate total liabilities of the limited partnerships in which the Company invested totaled $28.6 billion and $30.8 billion as of December 31, 2022 (Successor Company) and 2021 (Successor Company), respectively. Aggregate net investment income (loss) of the limited partnerships in which the Company invested totaled $1.9 billion, $2.0 billion and $1.0 billion for the years ended December 31, 2022 (Successor Company), December 31, 2021 (Successor Company) and 2020 (Predecessor Company), respectively. Aggregate net income excluding net investment income of the limited partnerships in which the Company invested totaled $4.7 billion (Successor Company), $31.4 billion, and $5.9 billion for the years ended December 31, 2022 (Successor Company), 2021 (Successor Company) and 2020 (Predecessor
TALCOTT RESOLUTION LIFE INSURANCE COMPANY AND SUBSIDIARIES
NOTES TO CONSOLIDATED FINANCIAL STATEMENTS (continued)
3. Investments (continued)
Company), respectively. As of, and for the year ended, December 31, 2022 (Successor Company), the aggregated summarized financial data reflects the latest available financial information.
TALCOTT RESOLUTION LIFE INSURANCE COMPANY AND SUBSIDIARIES
NOTES TO CONSOLIDATED FINANCIAL STATEMENTS (continued)
4. Derivatives
Derivative Instruments
The Company utilizes a variety of OTC, OTC-cleared and exchange traded derivative instruments as a part of its overall risk management strategy as well as to enter into replication transactions. Derivative instruments are used to manage risk associated with interest rate, equity market, credit spread, issuer default, price, and currency exchange rate risk or volatility. Replication transactions are used as an economical means to synthetically replicate the characteristics and performance of assets that are permissible investments under the Company’s investment policies. The Company also may enter into and has previously issued financial instruments and products that either are accounted for as freestanding derivatives, such as certain reinsurance contracts, or as embedded derivative instruments, such as certain GMWB riders included with certain variable annuity products.
Strategies that Qualify for Hedge Accounting
Some of the Company's derivatives satisfy hedge accounting requirements as outlined in Note 1 - Basis of Presentation and Significant Accounting Policies of these financial statements. Typically, these hedging instruments include interest rate swaps and, to a lesser extent, foreign currency swaps where the terms or expected cash flows of the hedged item closely match the terms of the swap. The interest rate swaps are typically used to manage interest rate duration of certain fixed maturity securities or liability contracts. As a result of pushdown accounting, derivative instruments that previously qualified for hedge accounting were de-designated and recorded at fair value through adjustments to additional paid-in capital at the acquisition date. The hedge strategies by hedge accounting designation include:
Cash Flow Hedges
Interest rate swaps are predominantly used to manage portfolio duration and better match cash receipts from assets with cash disbursements required to fund liabilities. These derivatives primarily convert interest receipts on floating-rate fixed maturity securities to fixed rates. Foreign currency swaps are used to convert foreign currency-denominated cash flows related to certain investment receipts and liability payments to U.S. dollars in order to reduce cash flow fluctuations due to changes in currency rates.
Non-Qualifying Strategies
Derivative relationships that do not qualify for hedge accounting (“non-qualifying strategies”) primarily include the hedge program for the Company's variable annuity products as well as the hedging and replication strategies that utilize credit default swaps. In addition, hedges of interest rate, foreign currency and equity risk of certain fixed maturities, equities and liabilities do not qualify for hedge accounting.
The non-qualifying strategies include:
Interest Rate Swaps, Swaptions and Futures
The Company uses interest rate swaps, swaptions and futures to manage interest rate duration between assets and liabilities in certain investment portfolios. In addition, the Company enters into interest rate swaps to terminate existing swaps, thereby offsetting the changes in value of the original swap. As of December 31, 2022 (Successor Company) and 2021 (Successor Company), the notional amount of interest rate swaps in offsetting relationships was $276 and $506, respectively.
Foreign Currency Swaps and Forwards
The Company enters into foreign currency swaps to convert the foreign currency exposures of certain foreign currency-denominated fixed maturity investments to U.S. dollars. The Company also enters into foreign currency forwards to hedge non-U.S. dollar denominated cash.
Credit Contracts
Credit default swaps are used to purchase credit protection on an individual entity or referenced index to economically hedge against default risk and credit-related changes in the value of fixed maturity securities. Credit default swaps are also used to assume credit risk related to an individual entity or referenced index as a part of replication transactions. These contracts require the Company to pay or receive a periodic fee in exchange for compensation from the counterparty or the Company should the referenced security issuers experience a credit event, as defined in the contract. In addition, the Company enters into credit default swaps to terminate existing credit default swaps, thereby offsetting the changes in value of the original swap going forward.
Equity Index Swaps and Options
The Company enters into equity index options to hedge the impact of a decline in the equity markets on the investment portfolio.
TALCOTT RESOLUTION LIFE INSURANCE COMPANY AND SUBSIDIARIES
NOTES TO CONSOLIDATED FINANCIAL STATEMENTS (continued)
4. Derivatives (continued)
Macro Hedge Program
The Company utilizes equity swaps, options and futures as well as interest rate swaps to provide protection against the statutory tail scenario risk to the Company's statutory surplus arising from higher GMDB claims, as well as lower variable annuity fee revenue.
GMWB Derivatives, net
The Company formerly offered certain variable annuity products with GMWB riders. The GMWB product is a bifurcated embedded derivative (“GMWB product derivatives”) that has a notional value equal to the GRB. The Company uses reinsurance contracts to transfer a portion of its risk of loss due to GMWB. The reinsurance contracts covering GMWB (“GMWB reinsurance contracts”) are accounted for as freestanding derivatives with a notional amount equal to the GRB reinsured.
FIA Embedded Derivative
The Company has assumed through reinsurance, certain FIA products with index-based crediting that constitutes an embedded derivative. The cedant hedges this risk and provides the benefits of this hedging as part of the reinsurance settlements.
Ceded Modified Coinsurance Reinsurance Contracts
As of December 31, 2022 (Successor Company) and 2021 (Successor Company), the Company had approximately $645 and $775, respectively, of invested assets supporting other policyholder funds and benefits payable reinsured under a modified coinsurance arrangement in connection with the sale of the Individual Life business, which was structured as a reinsurance transaction. The assets are primarily held in trust accounts established by the Company. The Company pays or receives cash quarterly to settle the operating results of the reinsured business, including the investment results. As a result of this modified coinsurance arrangement, the Company has an embedded derivative that transfers to the reinsurer certain unrealized changes in fair value of investments subject to interest rate and credit risk. The notional amount of the embedded derivative reinsurance contracts are the invested assets which are carried at fair value and support the reinsured reserves. A funds withheld liability is recorded for funds contractually withheld by the Company under funds withheld modified coinsurance arrangements in which the Company is the cedant.
Derivative Balance Sheet Classification
For reporting purposes, the Company has elected to offset within assets or liabilities based upon the net of the fair value amounts, income accruals, and related cash collateral receivables and payables of OTC derivative instruments executed in a legal entity and with the same counterparty under a master netting agreement, which provides the Company with the legal right of offset. The following fair value amounts do not include income accruals or related cash collateral receivables and payables, which are netted with derivative fair value amounts to determine balance sheet presentation. Derivatives in the Company’s separate accounts, where the associated gains and losses accrue directly to policyholders are not included in the table below. The Company’s derivative instruments are held for risk management purposes, unless otherwise noted in the following table. The notional amount of derivative contracts represents the basis upon which pay or receive amounts are calculated and is presented in the table to quantify the volume of the Company’s derivative activity. Notional amounts are not necessarily reflective of credit risk. The following tables exclude investments that contain an embedded credit derivative for which the Company has elected the FVO.
TALCOTT RESOLUTION LIFE INSURANCE COMPANY AND SUBSIDIARIES
NOTES TO CONSOLIDATED FINANCIAL STATEMENTS (continued)
4. Derivatives (continued)
| | | | | | | | | | | | | | | | | | | | | | | | | | | | | | | | | | | |
| Net
Derivatives | | Asset
Derivatives | | Liability Derivatives |
| Notional
Amount | | Fair
Value | | Fair
Value | | Fair
Value |
| Successor Company | | Successor Company | | Successor Company | | Successor Company |
| | | | As Restated | | | As Restated | | | As Restated | |
| Hedge Designation/Derivative Type | Dec 31, 2022 | Dec 31, 2021 | | Dec 31, 2022 | Dec 31, 2021 | | Dec 31, 2022 | Dec 31, 2021 | | Dec 31, 2022 | Dec 31, 2021 |
| Cash flow hedges | | | | | | | | | | | |
| Interest rate swaps | $ | 250 | | $ | 100 | | | $ | — | | $ | — | | | $ | — | | $ | — | | | $ | — | | $ | — | |
| | | | | | | | | | | |
| Total cash flow hedges | 250 | | 100 | | | — | | — | | | — | | — | | | — | | — | |
| | | | | | | | | | | |
| | | | | | | | | | | |
| | | | | | | | | | | |
| Non-qualifying strategies | | | | | | | | | | | |
| Interest rate contracts | | | | | | | | | | | |
| Interest rate swaps and futures | 1,363 | | 3,074 | | | (1) | | (7) | | | 3 | | 19 | | | (4) | | (26) | |
| Foreign exchange contracts | | | | | | | | | | | |
| Foreign currency swaps and forwards | 161 | | 161 | | | 15 | | 9 | | | 16 | | 10 | | | (1) | | (1) | |
| | | | | | | | | | | |
| Credit contracts | | | | | | | | | | | |
| | | | | | | | | | | |
| Credit derivatives that assume credit risk | 500 | | 100 | | | 4 | | 2 | | | 4 | | 2 | | | — | | — | |
| | | | | | | | | | | |
| | | | | | | | | | | |
| | | | | | | | | | | |
| Variable annuity hedge program | | | | | | | | | | | |
| GMWB product derivatives [1] | 6,308 | | 7,086 | | | 131 | | 80 | | | 131 | | 100 | | | — | | (20) | |
| GMWB reinsurance contracts | 1,397 | | 1,555 | | | (131) | | (8) | | | — | | — | | | (131) | | (8) | |
| | | | | | | | | | | |
| Macro hedge program | 22,823 | | 22,991 | | | 211 | | (213) | | | 506 | | 145 | | | (295) | | (358) | |
| Fixed indexed annuities | | | | | | | | | | | |
| FIA product derivative [1] [2] | — | | — | | | (385) | | (655) | | | — | | — | | | (385) | | (655) | |
| FIA reinsurance contracts [2] | — | | — | | | 288 | | — | | | 288 | | — | | | — | | — | |
| Other | | | | | | | | | | | |
| Modified coinsurance reinsurance contracts [2] | — | | — | | | 726 | | 15 | | | 129 | | 15 | | | 597 | | — | |
| Total non-qualifying strategies | 32,552 | | 34,967 | | | 858 | | (777) | | | 1,077 | | 291 | | | (219) | | (1,068) | |
| Total cash flow hedges and non-qualifying strategies | $ | 32,802 | | $ | 35,067 | | | $ | 858 | | $ | (777) | | | $ | 1,077 | | $ | 291 | | | $ | (219) | | $ | (1,068) | |
| Balance Sheet Location | | | | | | | | | | | |
| Fixed maturities, AFS | $ | 56 | | $ | 56 | | | $ | — | | $ | — | | | $ | — | | $ | — | | | $ | — | | $ | — | |
| Other investments | 11,998 | | 8,163 | | | 195 | | 43 | | | 237 | | 91 | | | (42) | | (48) | |
| Other liabilities | 13,043 | | 18,206 | | | 34 | | (252) | | | 292 | | 85 | | | (258) | | (337) | |
| Reinsurance recoverables | 1,397 | | 1,556 | | | 286 | | 7 | | | 417 | | 15 | | | (131) | | (8) | |
| Funds withheld liability | — | | — | | | 597 | | — | | | — | | — | | | 597 | | — | |
| Other policyholder funds and benefits payable | 6,308 | | 7,086 | | | (254) | | (575) | | | 131 | | 100 | | | (385) | | (675) | |
| Total derivatives | $ | 32,802 | | $ | 35,067 | | | $ | 858 | | $ | (777) | | | $ | 1,077 | | $ | 291 | | | $ | (219) | | $ | (1,068) | |
[1] These derivatives are embedded within liabilities and are not held for risk management purposes.
[2] For certain assumed and ceded reinsurance agreements the notional value is not indicative of the volume of activity. Refer to Note 5 - Reinsurance for additional information regarding the activity which generated the value of the embedded derivative.
Offsetting of Derivative Assets/Liabilities
The following tables present the gross fair value amounts, the amounts offset, and net position of derivative instruments eligible for offset on the Company's Consolidated Balance Sheets. Amounts offset include fair value amounts, income accruals and related cash collateral receivables and payables associated with derivative instruments that are traded under a common master netting agreement, as described in the preceding discussion. Also included in the tables are financial collateral receivables and payables, which are contractually permitted to be offset upon an event of default, although are disallowed for offsetting under U.S. GAAP.
TALCOTT RESOLUTION LIFE INSURANCE COMPANY AND SUBSIDIARIES
NOTES TO CONSOLIDATED FINANCIAL STATEMENTS (continued)
4. Derivatives (continued)
| | | | | | | | | | | | | | | | | | | | |
| Offsetting Derivative Assets and Liabilities |
| (i) | (ii) | (iii) = (i) - (ii) | (iv) | (v) = (iii) - (iv) |
| | | Net Amounts Presented on the Statement of Financial Position | Collateral Disallowed for Offset on the Statement of Financial Position | |
| Gross Amounts of Recognized Assets (Liabilities) | Gross Amounts Offset on the Statement of Financial Position | Derivative Assets [1] (Liabilities) [2] | Accrued Interest and Cash Collateral (Received) [3] Pledged [2] | Financial Collateral (Received) Pledged [4] | Net Amount |
| As of December 31, 2022 (Successor Company) | | | |
| Other investments | $ | 529 | | $ | 446 | | $ | 195 | | $ | (112) | | $ | 68 | | $ | 15 | |
| Other liabilities | (300) | | (195) | | 34 | | (139) | | (103) | | (2) | |
| As of December 31, 2021 (Successor Company) | | | | |
| Other investments | $ | 176 | | $ | 162 | | $ | 43 | | $ | (29) | | $ | 5 | | $ | 9 | |
| Other liabilities | (385) | | (134) | | (252) | | 1 | | (251) | | — | |
[1] Included in other invested assets on the Company's Consolidated Balance Sheets.
[2] Included in other liabilities on the Company's Consolidated Balance Sheets and is limited to the net derivative payable associated with each counterparty.
[3] Included in other investments on the Company's Consolidated Balance Sheets and is limited to the net derivative receivable associated with each counterparty.
[4] Excludes collateral associated with exchange-traded derivative instruments.
Cash Flow Hedges
For derivative instruments that are designated and qualify as cash flow hedges, the gain or loss on the derivative is reported as a component of OCI and reclassified into earnings in the same period or periods during which the hedged transaction affects earnings. All components of each derivative’s gain or loss were included in the assessment of hedge effectiveness.
| | | | | | | | | | | | | | |
| Derivatives in Cash Flow Hedging Relationships |
| Pre-Tax Gain (Loss) Recognized in OCI |
| Successor Company | Predecessor Company |
| For the Year Ended December 31, 2022 | For the Period of July 1, 2021 to December 31, 2021 | For the Six Months Ended June 30, 2021 | For the Year Ended December 31, 2020 |
|
| Interest rate swaps | $ | (35) | | $ | — | | $ | — | | $ | — | |
| Foreign currency swaps | — | | — | | — | | (2) | |
| Total | $ | (35) | | $ | — | | $ | — | | $ | (2) | |
| | | | | | | | | | | | | | |
| Derivatives in Cash Flow Hedging Relationships (Successor Company) |
| Gain (Loss) Reclassified from AOCI into Income |
| As Restated | | | |
| For the Year Ended December 31, 2022 | For the Period of July 1, 2021 to December 31, 2021 |
| Net Realized Capital
Losses | Net
Investment Income | Net Realized Capital
Losses | Net
Investment Income |
| Interest rate swaps | $ | — | | $ | (1) | | $ | — | | $ | — | |
| Foreign currency swaps | — | | — | | — | | — | |
| Total | $ | — | | $ | (1) | | $ | — | | $ | — | |
| Total amounts presented in the Consolidated Statements of Operations | $ | (10) | | $ | 778 | | $ | (20) | | $ | 498 | |
TALCOTT RESOLUTION LIFE INSURANCE COMPANY AND SUBSIDIARIES
NOTES TO CONSOLIDATED FINANCIAL STATEMENTS (continued)
4. Derivatives (continued)
| | | | | | | | | | | | | | | | |
| Derivatives in Cash Flow Hedging Relationships (Predecessor Company) |
| Gain or (Loss) Reclassified from AOCI into Income |
| For the Six Months Ended June 30, 2021 | For the Years Ended December 31, 2020 |
| Net Realized Capital
Losses | Net Investment Income | Net Realized Capital
Losses | Net Investment Income | | |
| Interest rate swaps | $ | — | | $ | — | | $ | — | | $ | — | | | |
| Foreign currency swaps | (1) | | — | | — | | — | | | |
| Total | (1) | | — | | — | | — | | | |
| Total amounts presented in the Consolidated Statements of Operations | $ | (242) | | $ | 534 | | $ | (74) | | $ | 816 | | | |
As of December 31, 2022 (Successor Company), the before tax deferred net losses on derivative instruments recorded in AOCI that are expected to be reclassified to earnings during the next twelve months were $8. This expectation is based on the anticipated interest payments on hedged investments in fixed maturity securities that will occur over the next twelve months, at which time the Company will recognize the deferred net gains (losses) as an adjustment to net investment income over the term of the investment cash flows.
For all periods presented, the Company had no net reclassifications from AOCI to earnings resulting from the discontinuance of cash-flow hedges due to forecasted transactions that were no longer probable of occurring.
Non-qualifying Strategies
For non-qualifying strategies, including embedded derivatives that are required to be bifurcated from their host contracts and accounted for as derivatives, the gain or loss on the derivative is recognized currently in earnings within net realized capital gains (losses).
TALCOTT RESOLUTION LIFE INSURANCE COMPANY AND SUBSIDIARIES
NOTES TO CONSOLIDATED FINANCIAL STATEMENTS (continued)
4. Derivatives (continued)
| | | | | | | | | | | | | | |
Non-qualifying Strategies
Gain (Loss) Recognized within Net Realized Capital Gains (Losses) |
| | Successor Company | Predecessor Company |
| As Restated | | | |
| For the Year Ended December 31, 2022 | For the Period of July 1, 2021 to December 31, 2021 | For the Six Months Ended June 30, 2021 | For the Year Ended December 31, 2020 |
|
| Variable annuity hedge program | | | | |
| GMWB product derivatives | $ | 88 | | $ | 29 | | $ | 82 | | $ | 67 | |
| GMWB reinsurance contracts | (88) | | 4 | | (24) | | (27) | |
| GMWB hedging instruments | | | | 42 | |
| Variable annuity macro hedge program | (1) | | (100) | | (301) | | (414) | |
| Total variable annuity hedge program | (1) | | (67) | | (243) | | (332) | |
| Fixed Index Annuity | | | | |
| FIA product derivatives | 270 | | — | | — | | — | |
| | | | |
| | | | |
| | | | |
| Foreign exchange contracts | | | | |
| Foreign currency swaps and forwards | 7 | | 5 | | (2) | | (4) | |
| | | | |
| | | | |
| Other non-qualifying derivatives | | | | |
| Interest rate contracts | | | | |
| Interest rate swaps, swaptions, and futures | (306) | | 21 | | (76) | | 180 | |
| Credit contracts | | | | |
| Credit derivatives that purchase credit protection | — | | — | | — | | 19 | |
| Credit derivatives that assume credit risk | 3 | | 1 | | — | | — | |
| | | | |
| | | | |
| | | | |
| | | | |
| Other | | | | |
| | | | |
| Modified coinsurance reinsurance contracts | 809 | | 15 | | 22 | | (50) | |
| Total other non-qualifying derivatives | 506 | | 37 | | (54) | | 149 | |
| Total [1] | $ | 782 | | $ | (25) | | $ | (299) | | $ | (187) | |
[1] Excludes investments that contain an embedded credit derivative for which the Company has elected the FVO.
Credit Risk Assumed through Credit Derivatives
The Company enters into credit default swaps that assume credit risk of a single entity or referenced index in order to synthetically replicate investment transactions that are permissible under the Company's investment policies. The Company will receive periodic payments based on an agreed upon rate and notional amount and will only make a payment if there is a credit event. A credit event payment will typically be equal to the notional value of the swap contract less the value of the referenced security issuer’s debt obligation after the occurrence of the credit event. A credit event is generally defined as a default on contractually obligated interest or principal payments or bankruptcy of the referenced entity. The credit default swaps in which the Company assumes credit risk primarily reference investment grade single corporate issuers and baskets, which include standard diversified portfolios of corporate and CMBS issuers. The diversified portfolios of corporate issuers are established within sector concentration limits and may be divided into tranches that possess different credit ratings.
TALCOTT RESOLUTION LIFE INSURANCE COMPANY AND SUBSIDIARIES
NOTES TO CONSOLIDATED FINANCIAL STATEMENTS (continued)
4. Derivatives (continued)
| | | | | | | | | | | | | | | | | | | | | | | |
| As of December 31, 2022 (Successor Company) |
| | | | Underlying Referenced Credit Obligation(s) [1] | | |
| Credit Derivative Type by Derivative Risk Exposure | Notional
Amount [2] | Fair
Value | Weighted
Average
Years to
Maturity | Type | Average
Credit
Rating | Offsetting
Notional
Amount | Offsetting
Fair
Value |
| | | | | | | |
| | | | | | | |
| | | | | | | |
| Basket credit default swaps [3] | | | | | | | |
| Investment grade risk exposure | $ | 500 | | $ | 4 | | 5 years | Corporate Credit | BBB+ | $ | — | | $ | — | |
| | | | | | | |
| | | | | | | |
| | | | | | | |
| | | | | | | |
| | | | | | | |
| Total | $ | 500 | | $ | 4 | | | | | $ | — | | $ | — | |
| As of December 31, 2021 (Successor Company) |
| | | | Underlying Referenced Credit Obligation(s) [1] | | |
| Credit Derivative Type by Derivative Risk Exposure | Notional
Amount [2] | Fair
Value | Weighted
Average
Years to
Maturity | Type | Average
Credit
Rating | Offsetting
Notional
Amount | Offsetting
Fair
Value |
| | | | | | | |
| | | | | | | |
| | | | | | | |
| Basket credit default swaps [3] | | | | | | | |
| Investment grade risk exposure | $ | 100 | | $ | 2 | | 5 years | Corporate Credit | BBB+ | $ | — | | $ | — | |
| | | | | | | |
| | | | | | | |
| | | | | | | |
| | | | | | | |
| | | | | | | |
| Total | $ | 100 | | $ | 2 | | | | | $ | — | | $ | — | |
[1] The average credit ratings are based on availability and are generally the midpoint of the available ratings among Moody’s, S&P, and Fitch. If no rating is available from a rating agency, then an internally developed rating is used.
[2] Notional amount is equal to the maximum potential future loss amount. These derivatives are governed by agreements and applicable law which include collateral posting requirements. There is no additional specific collateral related to these contracts or recourse provisions included in the contracts to offset losses.
[3] Comprised of swaps of standard market indices of diversified portfolios of corporate and CMBS issuers referenced through credit default swaps. These swaps are subsequently valued based upon the observable standard market index.
Derivative Collateral Arrangements
The Company enters into various collateral arrangements in connection with its derivative instruments, which require both the pledging and accepting of collateral. As of December 31, 2022 (Successor Company) and 2021 (Successor Company), the Company pledged cash collateral with a fair value of $5 and $2, respectively, associated with derivative instruments. The collateral receivable has been recorded in other assets or other liabilities on the Company's Consolidated Balance Sheets, as determined by the Company's election to offset on the balance sheet. As of December 31, 2022 (Successor Company) and 2021 (Successor Company), the Company also pledged securities collateral associated with derivative instruments with a fair value of $106 and $270, respectively, which have been included in fixed maturities, AFS on the Consolidated Balance Sheets. The counterparties have the right to sell or re-pledge these securities. In addition, as of December 31, 2022 (Successor Company) and 2021 (Successor Company), the Company has pledged initial margin of cash related to OTC-cleared and exchange traded derivatives with a fair value of $15 and $4, respectively, which is recorded in other investments or other assets on the Company's Consolidated Balance Sheets. As of December 31, 2022 (Successor Company) and 2021 (Successor Company), the Company has pledged initial margin of securities related to OTC-cleared and exchange traded derivatives with a fair value of $187 and $172, respectively, which are included within fixed maturities, AFS on the Company's Consolidated Balance Sheets.
As of December 31, 2022 (Successor Company) and 2021 (Successor Company), the Company accepted cash collateral associated with derivative instruments of $262 and $30, respectively, which was invested and recorded on the Consolidated Balance Sheets in fixed maturities, AFS and short-term investments with corresponding amounts recorded in other investments or other liabilities as determined by the Company's election to offset on the balance sheet. The Company also accepted securities collateral as of December 31, 2022 (Successor Company) and 2021 (Successor Company) with a fair value of $79 and $5, respectively, which the Company has the right to sell or repledge. As of December 31, 2022 (Successor Company), the Company had not repledged securities and did not sell any securities. The non-cash collateral accepted was held in separate custodial accounts and was not included on the Company's Consolidated Balance Sheets.
TALCOTT RESOLUTION LIFE INSURANCE COMPANY AND SUBSIDIARIES
NOTES TO CONSOLIDATED FINANCIAL STATEMENTS (continued)
5. Reinsurance
The Company cedes to affiliated and unaffiliated insurers to enable the Company to manage capital and risk exposure. The Company also assumes from unaffiliated insurers to provide our counterparties with risk management solutions. The Company's historical reinsurance cessions provided a level of risk mitigation desired by prior ownership. The Company's current reinsurance assumptions and internal retrocessions provide strategic business growth opportunities. Such arrangements do not relieve the Company of its primary liability to policyholders. Failure of reinsurers to honor their obligations could result in losses to the Company. The Company regularly monitors the financial condition and ratings of its reinsurers and structures agreements to provide collateral funds where necessary.
Assumed Reinsurance
Guardian
As disclosed in Note 1 - Basis of Presentation and Significant Accounting Policies of Notes to Consolidated Financial Statements, on November 1, 2022 (Successor Company), the Company entered into a reinsurance agreement with GIAC to assume certain blocks of variable annuities. Although the separate account assets and liabilities are reported net on the Company's Consolidated Balance Sheets, the Company earns income on the assumed separate account assets.
The following table summarizes the impacts of the transaction:
| | | | | |
| Assets | |
| Investments | $ | 405 | |
| Cash | 121 | |
| Other assets | 3 | |
| Total assets | 529 | |
| Liabilities | |
| Reserve for future policy benefits | 3 | |
| Other policyholder funds and benefits payable | 436 | |
| Other liabilities [1] | 90 | |
| Total liabilities | $ | 529 | |
[1] Other liabilities represents a deferred gain of $90.
Allianz
As disclosed in Note 1 - Basis of Presentation and Significant Accounting Policies of Notes to Consolidated Financial Statements, on December 30, 2021 (Successor Company), the Company entered into a reinsurance agreement with Allianz, whereby the Company assumed certain blocks of FIA on a coinsurance basis.
The following table summarizes the impacts of the transaction:
| | | | | |
| Assets | |
| Investments | $ | 8,357 | |
| Cash | (693) | |
| Other assets | 75 | |
| Reinsurance recoverables | 244 | |
| Total assets | 7,983 | |
| Liabilities | |
| Reserve for future policy benefits | 616 | |
| Other policyholder funds and benefits payable | 7,340 | |
| Other liabilities [1] | 27 | |
| Total liabilities | $ | 7,983 | |
[1] Other liabilities includes a deferred gain of $25.For the period of July 1, 2021 through December 31, 2021 (Successor Company), there was not a material impact on the Consolidated Statements of Operations from the Company's reinsurance arrangement with Allianz.
TALCOTT RESOLUTION LIFE INSURANCE COMPANY AND SUBSIDIARIES
NOTES TO CONSOLIDATED FINANCIAL STATEMENTS (continued)
5. Reinsurance (continued)
Ceded Reinsurance
Reinsurance recoverables include balances due from reinsurance companies and are presented net of ACL. The ACL represents an estimate of expected credit losses over the lifetime of the contracts that reflect management’s best estimate of reinsurance cessions that may be uncollectible in the future due to reinsurers’ inability to pay. Reinsurance recoverables include an estimate of the amount of policyholder benefits that may be ceded under the terms of the reinsurance agreements. Amounts recoverable from reinsurers are estimated in a manner consistent with assumptions used for the underlying policy benefits. Accordingly, the Company’s estimate of reinsurance recoverables is subject to similar risks and uncertainties as the estimate of the gross reserve for future policy benefits.
| | | | | | | | |
| Reinsurance Recoverables, net |
| Successor Company |
| As Restated | |
| As of December 31, |
| 2022 | 2021 |
| | |
| Reserve for future policy benefits and other policyholder funds and benefits payable | | |
| Sold businesses (MassMutual and Prudential) | $ | 20,174 | | $ | 19,850 | |
| Commonwealth Annuity and Life Insurance Company ("Commonwealth") | 8,001 | | 8,718 | |
| TR Re | 11,223 | | 6,130 | |
| Other reinsurers | 1,029 | | 1,187 | |
| Gross reinsurance recoverables | 40,427 | | 35,885 | |
| Less: ACL | 27 | | 37 | |
| Reinsurance recoverables, net | $ | 40,400 | | $ | 35,848 | |
As of December 31, 2022 (Successor Company) (as restated), the Company had reinsurance recoverables from Commonwealth, Massachusetts Mutual Life Insurance Company ("MassMutual"), Prudential Financial, Inc. ("Prudential") and TR Re of approximately $8.0 billion, $6.7 billion, $13.5 billion and $11.2 billion, respectively. As of December 31, 2021 (Successor Company), the Company had reinsurance recoverables from Commonwealth, MassMutual, Prudential and TR Re of $8.7 billion, $6.8 billion, $13.1 billion and $6.1 billion, respectively. The Company's obligations to its direct policyholders that have been reinsured to Commonwealth, MassMutual and Prudential are primarily secured by invested assets held in trust. The Company's obligations to its direct policyholders reinsured to TR Re are secured by invested assets held by the Company in segregated portfolios.
Affiliated
As disclosed in Note 1 - Basis of Presentation and Significant Accounting Policies, on December 31, 2022 (Successor Company) and December 31, 2021 (Successor Company), the Company entered into several affiliated reinsurance agreements with TR Re, primarily on a modified coinsurance basis.
The following table summarizes the impacts of these transactions:
| | | | | |
| December 31, 2022 (Successor Company) |
| Assets | |
| Reinsurance recoverables | $ | 5,192 | |
| VOBA and DAC | (11) | |
| Total assets | 5,181 | |
| Liabilities | |
| Funds withheld liability | 5,045 | |
| Other liabilities [1] | 136 | |
| Total liabilities | $ | 5,181 | |
[1] Other liabilities includes a deferred gain of $137.
For the year ended December 31, 2022 (Successor Company), there was no impact in the Consolidated Statements of Operations from the Company's affiliated reinsurance arrangement entered into in 2022.
TALCOTT RESOLUTION LIFE INSURANCE COMPANY AND SUBSIDIARIES
NOTES TO CONSOLIDATED FINANCIAL STATEMENTS (continued)
5. Reinsurance (continued)
| | | | | |
| December 31, 2021 (Successor Company) |
| Assets | |
| Cash | $ | (184) | |
| Reinsurance recoverables | 6,130 | |
| Total assets | 5,946 | |
| Liabilities | |
| Funds withheld liability | 5,128 | |
| Other liabilities [1] | 818 | |
| Total liabilities | $ | 5,946 | |
[1] Other liabilities includes a deferred gain of $805.
For the year ended December 31, 2022 (Successor Company), the impacts in the Consolidated Statements of Operations from the Company's affiliated reinsurance arrangement entered into in 2021, was as follows:
| | | | | |
| Affiliated Reinsurance Impacts |
| Successor Company |
| As Restated |
| As of December 31, 2022 |
| Revenues | |
| Policy charges and fee income | $ | (279) | |
| Premiums | (27) | |
| Net investment income | (136) | |
| Net realized capital gains | 663 | |
| Amortization of deferred gains | 27 | |
| Total revenues | 248 | |
| Benefits, losses and expenses | |
| Benefits and losses | (184) | |
| |
| Insurance operating costs and other expenses | (119) | |
| |
| Total benefits, losses and expenses | (303) | |
| Income before income taxes | 551 | |
| Income tax expense | 115 |
| Net income | $ | 436 | |
For the period of July 1, 2021 through December 31, 2021 (Successor Company), there was not a material impact on the Consolidated Statements of Operations from the Company's affiliated reinsurance arrangement entered into in 2021.
TALCOTT RESOLUTION LIFE INSURANCE COMPANY AND SUBSIDIARIES
NOTES TO CONSOLIDATED FINANCIAL STATEMENTS (continued)
5. Reinsurance (continued)
Allowance for Credit Losses
For the year ended December 31, 2022, the ACL decreased by $10 to $27. The Company closely monitors the financial condition, ratings and current market information of all its counterparty reinsurers and records an ACL considering the credit quality of the reinsurer, the invested assets in trust, and the period over which the recoverable balances are expected to be collected. Counterparty risk is assessed on a pooled basis in cases of shared risk characteristics, and separately for individual reinsurers when it is more relevant. The Company evaluates historical events, current conditions, and reasonable and supportable forecasts in developing its ACL estimate. Where its contracts permit, the Company secures future claim obligations with various forms of collateral, including irrevocable letters of credit, secured trusts and funds held accounts. The ACL is estimated using a probability of default and loss given default model applied to the amount of reinsurance recoverables, net of collateral, exposed to loss. The probability of default factor is assigned based on each reinsurer's credit rating. The Company reassesses and updates credit ratings on a quarterly basis. The probability of default factors encompass historical industry defaults for liabilities with similar durations to the reinsured liabilities as estimated through multiple economic cycles. The loss given default factors are based on a study of historical recovery rates for general creditors of corporations through multiple economic cycles.
Insurance Revenues
| | | | | | | | | | | | | | |
| Insurance Revenues |
| | Successor Company | Predecessor Company |
| For the Year Ended December 31, 2022 | For the Period of July 1, 2021 to December 31, 2021 | For the Six Months Ended June 30, 2021 | For the Year Ended December 31, 2020 |
|
| Gross premiums, policy charges and fee income | $ | 2,240 | | $ | 1,173 | | $ | 1,210 | | $ | 2,221 | |
| Reinsurance assumed | 210 | | 69 | | 64 | | 125 | |
| Reinsurance ceded | (1,835) | | (801) | | (812) | | (1,570) | |
| Net premiums, policy charges and fee income | $ | 615 | | $ | 441 | | $ | 462 | | $ | 776 | |
Insurance recoveries on ceded reinsurance agreements, which reduce death and other benefits, were $1,648 for the year ended December 31, 2022 (Successor Company), $782 for the period of July 1, 2021 to December 31, 2021 (Successor Company), $958 the period of January 1, 2021 to June 30, 2021 (Predecessor Company), and $1.5 billion for the year ended December 31, 2020 (Predecessor Company). In addition, the Company has reinsured a portion of the risk associated with U.S. variable annuities and the associated GMDB and GMWB risks.
TALCOTT RESOLUTION LIFE INSURANCE COMPANY AND SUBSIDIARIES
NOTES TO CONSOLIDATED FINANCIAL STATEMENTS (continued)
6. Value of Business Acquired and Deferred Acquisition Costs
| | | | | | | | | | | | | | |
| Changes in the VOBA Balance |
| Successor Company | Predecessor Company |
| For the Year Ended December 31, 2022 | For the Period of July 1, 2021 to December 31, 2021 | For the Six Months Ended June 30, 2021 | For the Year Ended December 31, 2020 |
|
| Balance, beginning of period [1] | $ | 479 | | $ | 565 | | $ | 586 | | $ | 696 | |
| Amortization - VOBA | (45) | | (17) | | 29 | | 14 | |
| Amortization - unlock benefit (charge), pre-tax | (34) | | (73) | | 14 | | (64) | |
| Adjustments to unrealized gains on fixed maturities, AFS and other | 108 | | 4 | | 26 | | (60) | |
| Balance, end of period | $ | 508 | | $ | 479 | | $ | 655 | | $ | 586 | |
[1] The beginning balance as of July 1, 2021 differs from the ending balance as of June 30, 2021, due to the application of pushdown accounting related to the Sixth Street Acquisition. For more information, see Note 1 - Basis of Presentation and Significant Accounting Policies of Notes to Consolidated Financial Statements.
| | | | | | | |
| Expected Remaining VOBA Amortization (Successor Company) | | |
| 2023 | $ | 13 | | | |
| 2024 | $ | 10 | | | |
| 2025 | $ | 16 | | | |
| 2026 | $ | 25 | | | |
| 2027 | $ | 25 | | | |
| | | | | |
| Changes in the DAC Asset (Successor Company) |
| For the Year Ended December 31, 2022 |
| Balance, beginning of period | $ | — | |
| Additions | 22 | |
| Amortization - DAC | — | |
| Amortization - unlock benefit (charge), pre-tax | — | |
| Reinsurance impact | (11) | |
| |
| Balance, end of period | $ | 11 | |
TALCOTT RESOLUTION LIFE INSURANCE COMPANY AND SUBSIDIARIES
NOTES TO CONSOLIDATED FINANCIAL STATEMENTS (continued)
7. Goodwill and Other Intangible Assets
| | | | | | | | |
| Goodwill |
| Carrying Value |
| As of December 31, 2022 | As of December 31, 2021 |
| Balance, beginning of period | $ | 97 | | $ | — | |
| Acquisitions [1] | — | | 97 | |
| | |
| Balance, end of period | $ | 97 | | $ | 97 | |
[1] Related to the pushdown of purchase accounting related to the Sixth Street Acquisition. For more information, see Note 1 - Basis of Presentation and Significant Accounting Policies of Notes to Consolidated Financial Statements.
| | | | | | | | | | | | | | | | | | | | | | | |
| Other Intangible Assets |
| As of December 31, 2022 | | As of December 31, 2021 |
| Gross Carrying Amount | Accumulated Amortization | Net Carrying Value | | Gross Carrying Amount | Accumulated Amortization | Net Carrying Value |
| Amortizing internally developed software | $ | 41 | | $ | (9) | | $ | 32 | | | $ | 41 | | $ | (3) | | $ | 38 | |
| Indefinite-lived state insurance licenses | 26 | | — | | 26 | | | 26 | | — | | 26 | |
| Total other intangible assets | $ | 67 | | $ | (9) | | $ | 58 | | | $ | 67 | | $ | (3) | | $ | 64 | |
| | | | | |
| Expected Pre-tax Amortization Expense as of December 31, 2022 (Successor Company) |
| 2023 | $ | 6 | |
| 2024 | $ | 6 | |
| 2025 | $ | 6 | |
| 2026 | $ | 6 | |
| 2027 | $ | 6 | |
TALCOTT RESOLUTION LIFE INSURANCE COMPANY AND SUBSIDIARIES
NOTES TO CONSOLIDATED FINANCIAL STATEMENTS (continued)
8. Reserves for Future Policy Benefits and Separate Account Liabilities
| | | | | | | | | | | | | | | | | |
| Changes in Reserves for Future Policy Benefits |
| Successor Company |
| Universal Life-Type Contracts | | |
| VA GMDB/GMWB [1] | FIA Guarantees and Other [2] | Universal Life Secondary
Guarantees | Traditional Annuity and Other Contracts [3] | Total Future Policy Benefits |
| Liability Balance, as of December 31, 2021 | $ | 340 | | $ | 604 | | $ | 4,605 | | $ | 16,149 | | $ | 21,698 | |
| Incurred | 136 | | (25) | | 835 | | 340 | | 1,286 | |
| Paid | (106) | | (84) | | (66) | | (801) | | (1,057) | |
| Change in unrealized investment gains and losses | — | | (495) | | — | | — | | (495) | |
| Liability balance, as of December 31, 2022 | $ | 370 | | $ | — | | $ | 5,374 | | $ | 15,688 | | $ | 21,432 | |
| Reinsurance recoverable asset, as of December 31, 2021 | $ | 299 | | $ | — | | $ | 4,605 | | $ | 10,135 | | $ | 15,039 | |
| Incurred | 92 | | — | | 835 | | 154 | | 1,081 | |
| Paid | (77) | | — | | (66) | | (446) | | (589) | |
| Reinsurance recoverable asset, as of December 31, 2022 | $ | 314 | | $ | — | | $ | 5,374 | | $ | 9,843 | | $ | 15,531 | |
| | | | | | | | | | | | | | | | | |
| Successor Company |
| Universal Life-Type Contracts | | |
| VA GMDB/GMWB [1] | FIA Guarantees and Other [2] | Universal Life Secondary
Guarantees | Traditional Annuity and Other Contracts [3] | Total Future Policy Benefits |
| Liability balance, as of July 1, 2021 | $ | 346 | | $ | — | | $ | 4,394 | | $ | 16,382 | | $ | 21,122 | |
| Incurred [4] | 38 | | 604 | | 240 | | 253 | | 1,135 | |
| Paid | (44) | | — | | (29) | | (486) | | (559) | |
| | | | | |
| Liability balance, as of December 31, 2021 | $ | 340 | | $ | 604 | | $ | 4,605 | | $ | 16,149 | | $ | 21,698 | |
| Reinsurance recoverable asset, as of July 1, 2021 | $ | 184 | | $ | — | | $ | 4,394 | | $ | 5,422 | | $ | 10,000 | |
| Incurred | 152 | | — | | 240 | | 4,845 | | 5,237 | |
| Paid | (37) | | — | | (29) | | (132) | | (198) | |
| Reinsurance recoverable asset, as of December 31, 2021 | $ | 299 | | $ | — | | $ | 4,605 | | $ | 10,135 | | $ | 15,039 | |
| | | | | | | | | | | | | | | |
| Predecessor Company |
| Universal Life-Type Contracts | | |
| VA GMDB/
GMWB [1] | | Universal Life Secondary
Guarantees | Traditional Annuity and Other Contracts [3] | Total Future Policy Benefits |
| Liability balance, as of December 31, 2020 | $ | 460 | | | $ | 4,195 | | $ | 13,970 | | $ | 18,625 | |
| Incurred [4] | 54 | | | 217 | | 179 | | 450 | |
| Paid | (50) | | | (18) | | (319) | | (387) | |
| | | | | |
| Liability balance, as of June 30, 2021 | $ | 464 | | | $ | 4,394 | | $ | 13,830 | | $ | 18,688 | |
| Reinsurance recoverable asset, as of December 31, 2020 | $ | 254 | | | $ | 4,195 | | $ | 4,690 | | $ | 9,139 | |
| Incurred [4] | 35 | | | 217 | | 78 | | 330 | |
| Paid | (41) | | | (18) | | (137) | | (196) | |
| Reinsurance recoverable asset, as of June 30, 2021 | $ | 248 | | | $ | 4,394 | | $ | 4,631 | | $ | 9,273 | |
[1] These liability balances include all GMDB benefits, plus the life-contingent portion of GMWB benefits in excess of the return of the GRB. GMWB benefits up to the GRB are embedded derivatives held at fair value and are excluded from these balances.
[2] These liability balances include additional liabilities for expected annuitizations on two-tiered FIA's and GLWB's, as part of the Allianz reinsurance agreement entered into on December 30, 2021.
TALCOTT RESOLUTION LIFE INSURANCE COMPANY AND SUBSIDIARIES
NOTES TO CONSOLIDATED FINANCIAL STATEMENTS (continued)
8. Reserves for Future Policy Benefits and Separate Account Liabilities (continued)
[3] Represents life-contingent reserves for which the company is subject to insurance and investment risk.
[4] Includes the portion of assessments established as additions to reserves, changes in estimates affecting the reserves and the amounts recoverable under modified coinsurance reinsurance agreements.
| | | | | | | | | | | | | | |
| Account Value by GMDB/GMWB Type as of December 31, 2022 (Successor Company) |
| Account
Value
(“AV”) [9] | Net amount
at Risk
(“NAR”) [10] | Retained Net
Amount
at Risk
(“RNAR”) [10] | Weighted
Average
Attained Age
of Annuitant |
| MAV [1] | | | | |
| MAV only | $ | 9,984 | | $ | 2,257 | | $ | 302 | | 74 |
| With 5% rollup [2] | 1,478 | | 295 | | 196 | | 73 |
| With earnings protection benefit rider (“EPB”) [3] | 2,414 | | 513 | | 55 | | 75 |
| With 5% rollup & EPB | 336 | | 83 | | 21 | | 76 |
| Total MAV | 14,212 | | 3,148 | | 574 | | |
| Asset protection benefit (“APB”) [4] | 6,165 | | 851 | | 282 | | 73 |
| Lifetime income benefit (“LIB”) – death benefit [5] | 258 | | 4 | | 2 | | 76 |
| Reset (5-7 years) [6] | 2,122 | | 96 | | 56 | | 72 |
| Return of premium (“ROP”) /other [7] | 10,097 | | 105 | | 62 | | 71 |
| Variable annuity without GMDB [8] | 2,611 | | — | | — | | 73 |
| Subtotal variable annuity [11] | $ | 35,465 | | $ | 4,204 | | $ | 976 | | 73 |
| Less: general account value | 2,983 | | | | |
| Subtotal separate account liabilities with GMDB | 32,482 | | | | |
| Separate account liabilities - other | 62,393 | | | | |
| Less: | | | | |
| Separate account assets assumed under modified coinsurance [12] | 6,613 | | | | |
| Separate account base contract assets not reinsured [12] | 1,007 | | | | |
| Total separate account liabilities | $ | 87,255 | | | | |
[1] MAV GMDB is the greatest of current AV, net premiums paid and the highest AV on any anniversary before age 80 years (adjusted for withdrawals).
[2] Rollup GMDB is the greatest of the MAV, current AV, net premium paid and premiums (adjusted for withdrawals) accumulated at generally 5% simple interest up to the earlier of age 80 years or 100% of adjusted premiums.
[3] EPB GMDB is the greatest of the MAV, current AV, or contract value plus a percentage of the contract’s growth. The contract’s growth is AV less premiums net of withdrawals, subject to a cap of 200% of premiums net withdrawals.
[4] APB GMDB is the greater of current AV or MAV, not to exceed current AV plus 25% times the greater of net premiums and MAV (each adjusted for premiums in the past 12 months).
[5] LIB GMDB is the greatest of current AV; net premiums paid; or, for certain contracts, a benefit amount generally based on market performance that ratchets over time.
[6] Reset GMDB is the greatest of current AV, net premiums paid and the most recent five to seven year anniversary AV before age 80 years (adjusted for withdrawals).
[7] ROP GMDB is the greater of current AV and net premiums paid.
[8] Includes account value for contracts that had a GMDB at issue but no longer have a GMDB due to certain elections made by policyholders or their beneficiaries.
[9] AV includes the contract holder’s investment in the separate account and the general account.
[10] NAR is defined as the guaranteed minimum death benefit in excess of the current AV. RNAR represents NAR reduced for reinsurance. NAR and RNAR are highly sensitive to equity market movements and increase when equity markets decline.
[11] Some variable annuity contracts with GMDB also have a life-contingent GMWB that may provide for benefits in excess of the return of the GRB. Such contracts included in this amount have $8.6 billion of total account value and weighted average attained age of 72 years. There is no NAR or retained NAR related to these contracts.
[12] Adjustment to remove AV for separate accounts that are not reflected on the Consolidated Balance Sheets, as they were assumed on a modified coinsurance basis and/or the Company has only reinsured certain associated GMDB and GMWB riders on a coinsurance basis.
TALCOTT RESOLUTION LIFE INSURANCE COMPANY AND SUBSIDIARIES
NOTES TO CONSOLIDATED FINANCIAL STATEMENTS (continued)
8. Reserves for Future Policy Benefits and Separate Account Liabilities (continued)
| | | | | | | | |
| Account Balance Breakdown of Variable Separate Account Investments for Contracts with Guarantees |
| Successor Company |
| Asset Type | December 31, 2022 | December 31, 2021 |
| Equity securities (including mutual funds) | $ | 24,548 | | $ | 33,240 | |
| Cash and cash equivalents [1] | 1,321 | | 1,362 | |
| Total [2] | $ | 25,869 | | $ | 34,602 | |
[1] Represents an allocation of the portfolio holdings.
[2] Includes $2.6 billion and $3.0 billion of account value as of December 31, 2022 (Successor Company) and 2021 (Successor Company), respectively, for contracts that had a GMDB at issue but no longer have a GMDB due to certain elections made by policyholders or their beneficiaries.
As of December 31, 2022 (Successor Company) and 2021 (Successor Company), approximately 18% and 17%, respectively, of the equity securities (including mutual funds), in the preceding table were funds invested in fixed income securities and approximately 82% and 83%, respectively, were funds invested in equity securities.
For further information on guaranteed living benefits that are accounted for at fair value, such as GMWB, see Note 2 - Fair Value Measurements of Notes to Consolidated Financial Statements.
TALCOTT RESOLUTION LIFE INSURANCE COMPANY AND SUBSIDIARIES
NOTES TO CONSOLIDATED FINANCIAL STATEMENTS (continued)
9. Debt
Collateralized Advances
The Company is a member of the Federal Home Loan Bank of Boston (“FHLBB”). Membership allows the Company access to collateralized advances, which may be used to support various spread-based business and enhance liquidity management. FHLBB membership requires the Company to own member stock and advances require the purchase of activity stock. The amount of advances that can be taken are dependent on the asset types pledged to secure the advances. The CTDOI will permit the Company to pledge up to approximately $922 in qualifying assets to secure FHLBB advances for 2023. The pledge limit is recalculated annually based on statutory admitted assets and capital and surplus. The Company would need to seek the prior approval of the CTDOI in order to exceed these limits. As of December 31, 2022, the Company had no advances outstanding under the FHLBB facility.
TALCOTT RESOLUTION LIFE INSURANCE COMPANY AND SUBSIDIARIES
NOTES TO CONSOLIDATED FINANCIAL STATEMENTS (continued)
10. Income Taxes
| | | | | | | | | | | | | | |
| Provision for Income Taxes |
| | Successor Company | Predecessor Company |
| As Restated | | | |
| For the Year Ended December 31, 2022 | For the Period of July 1, 2021 to December 31, 2021 | For the Six Months Ended June 30, 2021 | For the Year Ended December 31, 2020 |
| Income Tax Expense (Benefit) |
| Current - U.S. Federal | $ | (18) | | (86) | | $ | — | | $ | 10 | |
| Deferred - U.S. Federal | 56 | | 137 | | 30 | | 56 | |
| Total income tax expense | $ | 38 | | $ | 51 | | $ | 30 | | $ | 66 | |
Deferred tax assets and liabilities on the Consolidated Balance Sheets represent the tax consequences of differences between the financial reporting and tax basis of assets and liabilities.
| | | | | | | | |
| Components of Deferred Tax Assets (Liabilities) |
| Successor Company |
| As Restated | |
| December 31, 2022 | December 31, 2021 |
| Deferred Tax Assets | | |
| Tax basis deferred policy acquisition costs | $ | 129 | | $ | 110 | |
| | |
| VOBA and reserves | 415 | | 716 | |
| | |
| | |
| Net operating loss carryover | 1 | | 25 | |
| Employee benefits | 4 | | 7 | |
| Foreign tax credit carryover | 16 | | 16 | |
| Net unrealized loss on investments | 703 | | 4 | |
| Deferred reinsurance gain | 231 | | 187 | |
| | |
| Total deferred tax assets | 1,499 | | 1,065 | |
| | |
| | |
| Deferred Tax Liabilities | | |
| Investment related items | (366) | | (449) | |
| | |
| | |
| | |
| Other | (13) | | (13) | |
| Total deferred tax liabilities | (379) | | (462) | |
| Net deferred tax asset | $ | 1,120 | | $ | 603 | |
The statute of limitations is closed through the 2018 tax year with the exception of net operating loss ("NOL") carryforwards utilized in open tax years. Management believes that an adequate provision has been made on the consolidated financial statements for any potential adjustments that may result from tax examinations and other tax-related matters for all open tax years. As of December 31, 2022 and 2021(Successor Company), the Company had no reserves for uncertain tax positions. As of December 31, 2022 and 2021(Successor Company), there were no unrecognized tax benefits that if recognized would affect the effective tax rate and that had a reasonable possibility of significantly increasing or decreasing within the next 12 months.
The Company classifies interest and penalties (if applicable) as income tax expense on the consolidated financial statements. The Company recognized no interest expense for the year ended December 31, 2022 (Successor Company), the period of July 1, 2021 to December 31, 2021 (Successor Company), the six months ended June 30, 2021 (Predecessor Company) and the year ended December 31, 2020 (Predecessor Company). The Company had no interest payable as of December 31, 2022 and 2021(Successor Company). The Company does not believe it would be subject to any penalties in any open tax years and, therefore, has not recorded any accrual for penalties.
TALCOTT RESOLUTION LIFE INSURANCE COMPANY AND SUBSIDIARIES
NOTES TO CONSOLIDATED FINANCIAL STATEMENTS (continued)
10. Income Taxes (continued)
The Company believes it is more likely than not that all deferred tax assets will be fully realized. In assessing the need for a valuation allowance, management considered future taxable temporary difference reversals, future taxable income exclusive of reversing temporary differences and carryovers, taxable income in open carry back years and other tax planning strategies. From time to time, tax planning strategies could include holding a portion of debt securities with market value losses until recovery, making investments which have specific tax characteristics and business considerations such as asset-liability matching.
Net deferred income taxes include the future tax benefits associated with the net operating loss carryover and foreign tax credit carryover as follows:
Net Operating Loss Carryover
As of December 31, 2022 and 2021(Successor Company), the net deferred tax asset included the expected tax benefit attributable to net operating losses of $3 and $117, respectively. These U.S. losses that were generated in 2018 were primarily due to the Commonwealth annuity reinsurance agreement. These losses do not expire, but their utilization in any carryforward year is limited to 80% of taxable income in that year. The loss carryforwards are also subject to Internal Revenue Code Section 382, which may limit the amount that can be utilized in any carryforward year.
Given the Company's expected future earnings, the Company believes sufficient taxable income will be generated in the future to utilize its net operating loss carryover. Although the Company believes there will be sufficient future taxable income to fully recover the remainder of the loss carryover, the Company's estimate of the likely realization may change over time.
Foreign Tax Credit Carryover
As of December 31, 2022 and 2021 (Successor Company), the net deferred tax asset included the expected tax benefit attributable to foreign tax credit carryovers of $16 and $16, respectively.
A reconciliation of the tax provision at the U.S. Federal statutory rate to the provision (benefit) for income taxes is as follows.
| | | | | | | | | | | | | | |
| Income Tax Rate Reconciliation |
| | Successor Company | Predecessor Company |
| As Restated | | | |
| For the Year Ended December 31, 2022 | For the Period of July 1, 2021 to December 31, 2021 | For the Six Months Ended June 30, 2021 | For the Year Ended December 31, 2020 |
| |
| Tax provision at U.S. Federal statutory rate | $ | 83 | | $ | 70 | | $ | 45 | | $ | 98 | |
| Dividends received deduction ("DRD") | (38) | | (16) | | (14) | | (28) | |
| Foreign related investments | (7) | | (2) | | (1) | | (4) | |
| | | | |
| | | | |
| | | | |
| Other | — | | (1) | | — | | — | |
| Provision for income taxes | $ | 38 | | $ | 51 | | $ | 30 | | $ | 66 | |
The separate account DRD is estimated for the current year using information from the most recent return, adjusted for current year equity market performance and other appropriate factors, including estimated levels of corporate dividend payments and level of policy owner equity account balances. The actual current year DRD can vary from estimates based on, but not limited to, changes in eligible dividends received in the mutual funds, amounts of distributions from these mutual funds and the Company’s taxable income before the DRD. The Company evaluates its DRD computations on a quarterly basis.
Corporate Alternative Minimum Tax ("CAMT")
The Inflation Reduction Act of 2022 introduced a 15% CAMT effective in 2023. Generally, the CAMT imposes a minimum tax on the adjusted financial statement income ("AFSI") of certain corporations with average annual AFSI over a three-year period in excess of $1 billion. While the Company does not anticipate being subject to the CAMT in 2023, it could be subject to the CAMT in future years.
TALCOTT RESOLUTION LIFE INSURANCE COMPANY AND SUBSIDIARIES
NOTES TO CONSOLIDATED FINANCIAL STATEMENTS (continued)
11. Commitments and Contingencies
Contingencies Relating to Corporate Litigation and Regulatory Matters
Management evaluates each contingent matter separately. A loss is recorded if probable and reasonably estimable. Management establishes reserves for these contingencies at its “best estimate,” or, if no one number within the range of possible losses is more probable than any other, the Company records an estimated liability at the low end of the range of losses.
Litigation
The Company is involved in claims litigation arising in the ordinary course of business with respect to life and annuity contracts. The Company accounts for such activity through the establishment of reserves for future policy benefits. Management expects that the ultimate liability, if any, with respect to such ordinary-course claims litigation, after consideration of provisions made for potential losses and costs of defense, will not be material to the consolidated financial condition, results of operations or cash flows of the Company.
The Company is also involved in other kinds of legal actions, some of which assert claims for substantial amounts. Such actions have alleged, for example, bad faith in the handling of insurance claims and improper sales practices in connection with the sale of insurance and investment products. Some of these actions also seek punitive damages. Management expects that the ultimate liability, if any, with respect to such lawsuits, after consideration of provisions made for estimated losses, will not be material to the consolidated financial condition of the Company. Nonetheless, given the large or indeterminate amounts sought in certain of these actions, and the inherent unpredictability of litigation, it is possible that an adverse outcome in certain matters could, from time to time, have a material adverse effect on the Company’s consolidated financial condition, results of operations or cash flows in particular quarterly or annual periods.
Unfunded Commitments
As of December 31, 2022 (Successor Company), the Company had outstanding commitments totaling $974, of which $410 was committed to fund limited partnerships and other alternative investments, which may be called by the partnership during the commitment period to fund the purchase of new investments and partnership expenses. Additionally, $323 of the outstanding commitments are primarily related to various funding obligations associated with private debt. The remaining outstanding commitments of $241 are related to mortgage loans. Of the $974 in total outstanding commitments, $29 are related to mortgage loan commitments, which the Company can cancel unconditionally.
Guaranty Fund and Other Insurance-Related Assessments
In all states, insurers licensed to transact certain classes of insurance are required to become members of a guaranty fund. In most states, in the event of the insolvency of an insurer writing any such class of insurance in the state, members of the funds are assessed to pay certain claims of the insolvent insurer. A particular state’s fund assesses its members based on their respective written premiums in the state for the classes of insurance in which the insolvent insurer was engaged. Assessments are generally limited for any year to one or two percent of premiums written per year depending on the state.
Liabilities for guaranty funds and other insurance-related assessments are accrued when an assessment is probable, when it can be reasonably estimated, and when the event obligating the Company to pay an imposed or probable assessment has occurred. Liabilities for guaranty funds and other insurance-related assessments are not discounted and are included as part of other liabilities on the Consolidated Balance Sheets. As of December 31, 2022 (Successor Company) and 2021 (Successor Company), the liability balance was $4 and $4, respectively. As of December 31, 2022 (Successor Company) and 2021 (Successor Company) amounts related to premium tax offsets of $1 and $1, respectively, were included in other assets on the Consolidated Balance Sheets.
Derivative Commitments
Certain of the Company’s derivative agreements contain provisions that are tied to the financial strength ratings, as set by nationally recognized statistical agencies or risked-based capital ("RBC") tests, of the individual legal entity that entered into the derivative agreement. If the legal entity’s financial strength were to fall below certain ratings, the counterparties to the derivative agreements could demand immediate and ongoing full collateralization and in certain instances enable the counterparties to terminate the agreements and demand immediate settlement of all outstanding derivative positions traded under each impacted bilateral agreement. The settlement amount is determined by netting the derivative positions transacted under each agreement. If the termination rights were to be exercised by the counterparties, it could impact the legal entity’s ability to conduct hedging activities by increasing the associated costs and decreasing the willingness of counterparties to transact with the legal entity. The aggregate fair value of all derivative instruments with credit-risk-related contingent features that were in a net liability position as of December 31, 2022 (Successor Company) was $110. Of this $110, the legal entities have posted collateral of $111 in the normal course of business. In addition, the Company did not post any collateral associated with a customized GMWB derivative. This could change as derivative market values change, as a result of changes in our hedging activities or to the extent changes in contractual terms are negotiated. The nature of
TALCOTT RESOLUTION LIFE INSURANCE COMPANY AND SUBSIDIARIES
NOTES TO CONSOLIDATED FINANCIAL STATEMENTS (continued)
11. Commitments and Contingencies (continued)
the collateral that is posted, when required, would be primarily in the form of U.S. Treasury bills, U.S. Treasury notes and government agency securities.
TALCOTT RESOLUTION LIFE INSURANCE COMPANY AND SUBSIDIARIES
NOTES TO CONSOLIDATED FINANCIAL STATEMENTS (continued)
12. Transactions with Affiliates
Intercompany Liquidity Agreements
In 2022, the Company entered into several short-term affiliated intercompany liquidity agreements, permitting TL to borrow a maximum of $1.5 billion and lend a maximum of $500 and the Company's subsidiary to borrow a maximum of $600 and lend a maximum of $200. On October 13, 2022 (Successor Company), an affiliate borrowed $100, with a maturity date of October 13, 2023, and an accrued interest rate of 3.40% per annum. As of December 31, 2022, the Company recorded such affiliated borrowing of $100 in short-term investments on the Consolidated Balance Sheets. As of December 31, 2022, the Company did not borrow any amounts under the intercompany liquidity agreements.
Parent Company Transactions
As of December 31, 2022 (Successor Company) and 2021 (Successor Company), the Company had no direct employees as it is managed by TLI, the Company's indirect parent, pursuant to an Intercompany Services and Cost Allocation Agreement ("reimbursement agreement") between the Company, TLI and other Company affiliates. Effective July 1, 2021, the reimbursement agreement was modified to reflect a cost-plus reimbursement model. The impact of this revision was not material to the Company.
TLI's wholly-owned subsidiary Talcott Administration Services Company, LLC ("TASC") provides insurance administration services and support for the Company and became a related party on October 21, 2021. For the year ended December 31, 2022 (Successor Company) and the period from October 1, 2021 to December 31, 2021 (Successor Company), fees incurred for these services were $53 and $14.
For information related to affiliated reinsurance arrangements with the Company's parent company TR Re, see Note 1 - Basis of Presentation and Significant Accounting Policies and Note 5 - Reinsurance of Notes to Consolidated Financial Statements.
For information related to capital contributions to the parent company, see the Dividends section of Note 13 - Statutory Results of Notes to Consolidated Financial Statements.
Sixth Street Transactions
As a result of the Sixth Street Acquisition described in Note 1 - Basis of Presentation and Significant Accounting Policies, the Company considers entities affiliated with Sixth Street as related parties. As described below, since the date of the Sixth Street Acquisition, the Company has entered into certain agreements with and made certain investments in Sixth Street affiliates.
The Company has investment management service agreements with a Sixth Street affiliate, in order to diversify the Company’s investment management capabilities and to leverage the specialty knowledge of Sixth Street with respect to certain asset classes. For the year ended December 31, 2022 (Successor Company) and the period of July 1, 2021 to December 31, 2021 (Successor Company), the Company recorded expenses related to these agreements of $1 and $0, respectively. As of December 31, 2022 and 2021 (Successor Company), amounts payable under the agreements were $0 and $0, respectively.
For the year ended December 31, 2022, the Company made certain investments totaling $12 that are issued and controlled by Sixth Street affiliates. The Company was not determined to be the primary beneficiary for these investments. As of December 31, 2022 (Successor Company) outstanding commitments for these investments were $49. There were no affiliated investments on the Company's Consolidated Balance Sheets as of December 31, 2021.
TALCOTT RESOLUTION LIFE INSURANCE COMPANY AND SUBSIDIARIES
NOTES TO CONSOLIDATED FINANCIAL STATEMENTS (continued)
13. Statutory Results
The Company and its domestic insurance subsidiaries prepare their statutory financial statements in conformity with statutory accounting practices prescribed or permitted by the applicable state insurance department which vary materially from U.S. GAAP. Prescribed statutory accounting practices include publications of the National Association of Insurance Commissioners (“NAIC”), as well as state laws, regulations and general administrative rules. The differences between statutory financial statements and financial statements prepared in accordance with U.S. GAAP vary between domestic and foreign jurisdictions. The principal differences are that statutory financial statements do not reflect deferred policy acquisition and value of business acquired costs and limit deferred income taxes, predominately use interest rate and mortality assumptions prescribed by the NAIC for life benefit reserves, generally carry bonds at amortized cost and present reinsurance assets and liabilities net of reinsurance. For reporting purposes, statutory capital and surplus is referred to collectively as "statutory capital". | | | | | | | | | | | | | | |
| Statutory Net Income (Loss) |
| Successor Company | Predecessor Company |
| For the Year Ended December 31, 2022 | For the Period of July 1, 2021 to December 31, 2021 | For the Six Months Ended June 30, 2021 | For the Year Ended December 31, 2020 |
|
| Combined statutory net income (loss) | $ | 441 | | $ | (426) | | $ | (2) | | $ | 245 | |
| | | | | | | | |
| Statutory Capital |
| Successor Company |
| December 31, 2022 | December 31, 2021 |
| Statutory capital [1] | $ | 2,738 | | $ | 2,153 | |
[1] The Company relies upon a prescribed practice allowed by Connecticut state laws that allow the Company to receive a reinsurance reserve credit for reinsurance treaties that provide for a limited right of unilateral cancellation by the reinsurer. The benefit from this prescribed practice was approximately $40 and $29 as of December 31, 2022 (Successor Company) and 2021 (Successor Company), respectively.
Statutory accounting practices do not consolidate the net income (loss) of subsidiaries that report under U.S. GAAP. The combined statutory net income (loss) above represents the total statutory net income (loss) of the Company and its other insurance subsidiaries. Statutory accounting principles require that ceding commissions paid on reinsurance transactions be expensed in the period incurred, affecting statutory net loss, where U.S. GAAP allows for the deferral of these amounts. In addition, as described in Note 1 - Basis of Presentation and Significant Accounting Policies, in 2021 the Company paid a $500 dividend associated with the Sixth Street Acquisition. Both items affected statutory capital.
Regulatory Capital Requirements
The Company's U.S. insurance companies' states of domicile impose RBC requirements. The requirements provide a means of measuring the minimum amount of statutory capital appropriate for an insurance company to support its overall business operations based on its size and risk profile. Regulatory compliance is determined by a ratio of a company's total adjusted capital (“TAC”) to its authorized control level RBC (“ACL RBC”). Companies below specific trigger points or ratios are classified within certain levels, each of which requires specified corrective action. The minimum level of TAC before corrective action commences (“Company Action Level”) is two times the ACL RBC. The adequacy of a company's capital is determined by the ratio of a company's TAC to its Company Action Level, known as the "RBC ratio." The Company and all of its operating insurance subsidiaries had RBC ratios in excess of the minimum levels required by the applicable insurance regulations. The RBC ratios for the Company and its principal life insurance operating subsidiaries were all in excess of 300% of their Company Action Levels as of December 31, 2022 (Successor Company) and 2021 (Successor Company) .The reporting of RBC ratios is not intended for the purpose of ranking any insurance company, or for use in connection with any marketing, advertising or promotional activities.
TALCOTT RESOLUTION LIFE INSURANCE COMPANY AND SUBSIDIARIES
NOTES TO CONSOLIDATED FINANCIAL STATEMENTS (continued)
13. Statutory Results (continued)
Dividends
As a condition to the Sixth Street Acquisition, the CTDOI requires any dividends from the Company, for a two-year period following the acquisition, be approved by the state insurance commissioner. Subsequent to this approval condition, dividends to the Company from its insurance subsidiaries and dividends from the Company to its parent are restricted by insurance regulation. The payment of dividends by Connecticut-domiciled insurers is limited under the insurance holding company laws of Connecticut. These laws require notice to and approval by the state insurance commissioner for the declaration or payment of any dividend, which, together with other dividends or distributions made within the preceding twelve months, exceeds the greater of (i) 10% of the insurer’s policyholder surplus as of December 31 of the preceding year or (ii) net income (or net gain from operations, if such company is a life insurance company) for the twelve-month period ending on the thirty-first day of December last preceding, in each case determined under statutory insurance accounting principles. In addition, if any dividend of a domiciled insurer exceeds the insurer’s earned surplus or certain other thresholds as calculated under applicable state insurance law, the dividend requires the prior approval of the domestic regulator. In addition to statutory limitations on paying dividends, the Company also takes other items into consideration when determining dividends from subsidiaries. These considerations include, but are not limited to, expected earnings and capitalization of the subsidiary, regulatory capital requirements and liquidity requirements of the individual operating company.
Absent the restrictions noted above, the Company would be permitted to pay up to a maximum of $578 in dividends and the Company's subsidiaries are permitted to pay up to a maximum of $96 in dividends as determined by the above mentioned insurance regulations.
On June 28, 2021 (Predecessor Company), TL paid a $500 dividend to its then parent, TLI.
On September 18, 2020 (Predecessor Company), TL received a $400 dividend from its subsidiary, Talcott Resolution Life and Annuity Insurance Company ("TLA"). On the same date, TL subsequently declared and paid a $319 dividend to its parent TLI.
TALCOTT RESOLUTION LIFE INSURANCE COMPANY AND SUBSIDIARIES
NOTES TO CONSOLIDATED FINANCIAL STATEMENTS (continued)
14. Changes in and Reclassifications From Accumulated Other Comprehensive Income
| | | | | | | | | | | | | |
| Changes in AOCI, Net of Tax for the Year Ended December 31, 2022 (Successor Company) |
| Changes in |
| Net Unrealized Gain on Fixed Maturities, AFS | | Net Gain on Cash Flow Hedging Instruments | | AOCI |
| Beginning balance | $ | (10) | | | $ | — | | | $ | (10) | |
| OCI before reclassifications | (3,107) | | | (34) | | | (3,141) | |
| Amounts reclassified from AOCI | 412 | | | — | | | 412 | |
| OCI, before tax | (2,695) | | | (34) | | | (2,729) | |
| Income tax benefit (expense) | 566 | | | 7 | | | 573 | |
| OCI, net of tax | (2,129) | | | (27) | | | (2,156) | |
| Ending balance | $ | (2,139) | | | $ | (27) | | | $ | (2,166) | |
| | | | | | | | | | | | | |
| Changes in AOCI, Net of Tax for the Period of July 1, 2021 to December 31, 2021 (Successor Company) |
| Changes in |
| Net Unrealized Gain on Fixed Maturities, AFS | | Net Gain on Cash Flow Hedging Instruments | | AOCI |
| Beginning balance | $ | — | | | $ | — | | | $ | — | |
| OCI before reclassifications | (14) | | | — | | | (14) | |
| Amounts reclassified from AOCI | 2 | | | — | | | 2 | |
| OCI, before tax | (12) | | | — | | | (12) | |
| Income tax benefit (expense) | 2 | | | — | | | 2 | |
| OCI, net of tax | (10) | | | — | | | (10) | |
| Ending balance | $ | (10) | | | $ | — | | | $ | (10) | |
| | | | | | | | | | | | | |
| Changes in AOCI, Net of Tax for the Six Months Ended June 30, 2021 (Predecessor Company) |
| Changes in |
| Net Unrealized Gain on Fixed Maturities, AFS | | Net Gain on Cash Flow Hedging Instruments | | AOCI |
| Beginning balance | $ | 1,282 | | | $ | (1) | | | $ | 1,281 | |
| OCI before reclassifications | (301) | | | — | | | (301) | |
| Amounts reclassified from AOCI | (47) | | | 1 | | | (46) | |
| OCI, before tax | (348) | | | 1 | | | (347) | |
| Income tax benefit (expense) | 73 | | | — | | | 73 | |
| OCI, net of tax | (275) | | | 1 | | | (274) | |
| Ending balance | $ | 1,007 | | | $ | — | | | $ | 1,007 | |
TALCOTT RESOLUTION LIFE INSURANCE COMPANY AND SUBSIDIARIES
NOTES TO CONSOLIDATED FINANCIAL STATEMENTS (continued)
14. Changes in and Reclassifications From Accumulated Other Comprehensive Income (continued)
| | | | | | | | | | | | | | | |
| Changes in AOCI, Net of Tax for the Year Ended December 31, 2020 (Predecessor Company) |
| Changes in |
| Net Unrealized Gain on Fixed Maturities, AFS | Unrealized Losses on Fixed Maturities, AFS for Which an ACL Has Been Recorded | Net Gain on Cash Flow Hedging Instruments | | AOCI |
| Beginning balance | $ | 717 | | $ | — | | $ | — | | | $ | 717 | |
| OCI before reclassifications | 842 | | (1) | | (1) | | | 840 | |
| Amounts reclassified from AOCI | (127) | | 1 | | — | | | (126) | |
| OCI, before tax | 715 | | — | | (1) | | | 714 | |
| Income tax benefit (expense) | (150) | | — | | — | | | (150) | |
| OCI, net of tax | 565 | | — | | (1) | | | 564 | |
| Ending balance | $ | 1,282 | | $ | — | | $ | (1) | | | $ | 1,281 | |
| | | | | | | | | | | | | | | | | |
| Reclassification from AOCI |
| Successor Company | Predecessor Company | |
| For the Year Ended December 31, 2022 | For the Period of July 1, 2021 to December 31, 2021 | For the Six Months Ended June 30, 2021 | For the Year Ended December 31, 2020 | Affected Line Item on the Consolidated Statements
of Operations |
|
| Net Unrealized Gain on Fixed Maturities | | | | | |
| Available-for-sale securities | $ | (412) | | $ | (2) | | $ | 47 | | $ | 127 | | Net realized capital losses |
| (412) | | (2) | | 47 | | 127 | | Income before income taxes |
| (87) | | — | | 10 | | 27 | | Income tax expense |
| $ | (325) | | $ | (2) | | $ | 37 | | $ | 100 | | Net income |
| Unrealized Losses on Fixed Maturities for Which an ACL Has Been Recorded | | | | | |
| Fixed maturities, AFS | $ | — | | $ | — | | $ | — | | $ | (1) | | Net realized capital losses |
| — | | — | | — | | (1) | | Income before income taxes |
| — | | — | | — | | — | | Income tax expense |
| $ | — | | $ | — | | $ | — | | $ | (1) | | Net income |
| Net Gains on Cash-Flow Hedging Instruments | | | | | |
| Interest rate swaps | $ | — | | $ | — | | $ | — | | $ | — | | Net realized capital losses |
| Interest rate swaps | — | | — | | — | | — | | Net investment income |
| Foreign currency swaps | — | | — | | (1) | | — | | Net realized capital losses |
| — | | — | | (1) | | — | | Income before income taxes |
| — | | — | | — | | — | | Income tax expense |
| $ | — | | $ | — | | $ | (1) | | $ | — | | Net income |
| Total amounts reclassified from AOCI | $ | (325) | | $ | (2) | | $ | 36 | | $ | 99 | | Net income |
TALCOTT RESOLUTION LIFE INSURANCE COMPANY AND SUBSIDIARIES
NOTES TO CONSOLIDATED FINANCIAL STATEMENTS (continued)
15. Revenue from Contracts with Customers
The Company follows the FASB’s updated guidance for recognizing revenue from contracts with customers which excludes insurance contracts and financial instruments. Revenue subject to the guidance is recognized when, or as, goods or services are transferred to customers in an amount that reflects the consideration that an entity is expected to receive in exchange for those goods or services.
| | | | | | | | | | | | | | |
| Revenues from Contracts with Customers |
| Successor Company | Predecessor Company |
| For the Year Ended December 31, 2022 | For the Period of July 1, 2021 to December 31, 2021 | For the Six Months Ended June 30, 2021 | For the Year Ended December 31, 2020 |
|
| Administration and distribution services fees | $ | 76 | | $ | 45 | | $ | 44 | | $ | 80 | |
The Company earns revenues from these contracts primarily for administrative and distribution services fees from offering certain fund families as investment options in its variable annuity products. Fees are primarily based on the average daily net asset values of the funds and are recorded in the period in which the services are provided and collected monthly. Fluctuations in domestic and international markets and related investment performance, volume and mix of sales and redemptions of the funds, and other changes to the composition of assets under management are all factors that ultimately have a direct effect on fee income earned.
TALCOTT RESOLUTION LIFE INSURANCE COMPANY AND SUBSIDIARIES
NOTES TO CONSOLIDATED FINANCIAL STATEMENTS (continued)
16. Subsequent Event
The Company has evaluated subsequent events through December 21, 2023, the date the restated consolidated financial statements were issued.
On January 27, 2023, pursuant to the Intercompany Liquidity Agreements discussed in Note 12 -Transactions with Affiliates, an affiliate borrowed $60 from the Company. The intercompany loan has a maturity date of January 26, 2024, and accrues at an interest rate of 4.50% per annum.
On July 6, 2023, the Company paid a dividend of $575 to its parent, TR Re.
REPORT OF INDEPENDENT REGISTERED PUBLIC ACCOUNTING FIRM
To the Board of Directors and Stockholder of
Talcott Resolution Life Insurance Company
Opinion on the Financial Statement Schedules
We have audited the consolidated financial statements of Talcott Resolution Life Insurance Company and subsidiaries (the "Company") as of December 31, 2022 and 2021 (Successor Company), the related consolidated statements of operations, comprehensive income (loss), changes in stockholder’s equity, and cash flows, for the year ended December 31, 2022 (Successor Company), the period of July 1, 2021 to December 31, 2021 (Successor Company), the six months ended June 30, 2021 (Predecessor Company) and the year ended December 31, 2020 (Predecessor Company), and have issued our report thereon dated April 27, 2023 (which report expresses an unqualified opinion). Our audits also included the financial statement schedules I, IV, and V. These financial statement schedules are the responsibility of the Company's management. Our responsibility is to express an opinion on the Company’s financial statement schedules based on our audits. In our opinion, such financial statement schedules, when considered in relation to the financial statements taken as a whole, present fairly, in all material respects, the information set forth therein.
/s/ DELOITTE & TOUCHE LLP
Hartford, CT
April 27, 2023
TALCOTT RESOLUTION LIFE INSURANCE COMPANY AND SUBSIDIARIES
SCHEDULE I
SUMMARY OF INVESTMENTS—OTHER THAN INVESTMENTS IN AFFILIATES
($ in millions)
| | | | | | | | | | | |
| Successor Company |
| | As of December 31, 2022 |
| Type of Investment | Cost | Fair
Value | Amount at Which Shown on Balance Sheet |
| Fixed Maturities | | | |
| Bonds and notes: | | | |
| U.S. government and government agencies and authorities (guaranteed and sponsored) | $ | 1,395 | | $ | 1,070 | | $ | 1,070 | |
| States, municipalities and political subdivisions | 1,320 | | 1,040 | | 1,040 | |
| Foreign governments | 379 | | 315 | | 315 | |
| Public utilities | 1,776 | | 1,423 | | 1,423 | |
| All other corporate bonds | 10,769 | | 8,818 | | 8,818 | |
| All other mortgage-backed and asset-backed securities | 3,050 | | 2,717 | | 2,717 | |
| Total fixed maturities, available-for-sale | 18,689 | | 15,383 | | 15,383 | |
| Fixed maturities, at fair value using fair value option | 352 | | 331 | | 331 | |
| Total fixed maturities | 19,041 | | 15,714 | | 15,714 | |
| Equity Securities | | | |
| Common stocks: | | | |
| Industrial, miscellaneous and all other | 14 | | 14 | | 14 | |
| Non-redeemable preferred stocks | 191 | | 165 | | 165 | |
| Total equity securities, at fair value | 205 | | 179 | | 179 | |
| Mortgage loans [1] | 2,535 | | 2,232 | | 2,520 | |
| Policy loans | 1,495 | | 1,495 | | 1,495 | |
| Futures, options and miscellaneous | 384 | | 85 | | 85 | |
| Real estate acquired in satisfaction of debt | 10 | | 10 | | 10 | |
| Short-term investments | 1,489 | | 1,489 | | 1,489 | |
| Investments in partnerships and trusts | 1,300 | | | 1,300 | |
| Total investments | $ | 26,459 | | | $ | 22,792 | |
[1] Cost of mortgage loans excludes the allowance for credit losses ("ACL") of $15. For further information, refer to Schedule V - Valuation and Qualifying Accounts.
TALCOTT RESOLUTION LIFE INSURANCE COMPANY AND SUBSIDIARIES
SCHEDULE IV
REINSURANCE
($ In millions)
| | | | | | | | | | | | | | | | | |
| Gross Amount | Ceded to Other Companies | Assumed From Other Companies | Net
Amount | Percentage of Amount Assumed
to Net |
| For the Year Ended December 31, 2022 (Successor Company) |
| Life insurance in-force | $ | 222,398 | | $ | 158,750 | | $ | 155 | | $ | 63,803 | | — | % |
| Insurance Revenues | | | | | |
| Life insurance and annuities | $ | 2,228 | | $ | 1,823 | | $ | 210 | | $ | 615 | | 34 | % |
| Accident health insurance | 12 | | 12 | | — | | — | | — | % |
| Total insurance revenues | $ | 2,240 | | $ | 1,835 | | $ | 210 | | $ | 615 | | 34 | % |
| For the Period of July 1, 2021 to December 31, 2021 (Successor Company) |
| Life insurance in-force | $ | 232,607 | | $ | 166,822 | | $ | 158 | | $ | 65,943 | | — | % |
| Insurance Revenues | | | | | |
| Life insurance and annuities | $ | 1,170 | | $ | 798 | | $ | 69 | | $ | 441 | | 16 | % |
| Accident health insurance | 3 | | 3 | | — | | — | | — | % |
| Total insurance revenues | $ | 1,173 | | $ | 801 | | $ | 69 | | $ | 441 | | 16 | % |
| For the Six Months Ended June 30. 2021 (Predecessor Company) |
| Life insurance in-force | $ | 236,517 | | $ | 170,776 | | $ | 166 | | $ | 65,907 | | — | % |
| Insurance Revenues | | | | | |
| Life insurance and annuities | $ | 1,202 | | $ | 804 | | $ | 64 | | $ | 462 | | 14 | % |
| Accident health insurance | 8 | | 8 | | — | | — | | — | % |
| Total insurance revenues | $ | 1,210 | | $ | 812 | | $ | 64 | | $ | 462 | | 14 | % |
| For the Year Ended December 31, 2020 (Predecessor Company) |
| Life insurance in-force | $ | 239,801 | | $ | 174,372 | | $ | 173 | | $ | 65,602 | | — | % |
| Insurance Revenues | | | | | |
| Life insurance and annuities | $ | 2,201 | | $ | 1,550 | | $ | 125 | | $ | 776 | | 16 | % |
| Accident health insurance | 20 | | 20 | | — | | — | | — | % |
| Total insurance revenues | $ | 2,221 | | $ | 1,570 | | $ | 125 | | $ | 776 | | 16 | % |
TALCOTT RESOLUTION LIFE INSURANCE COMPANY AND SUBSIDIARIES
SCHEDULE V
VALUATION AND QUALIFYING ACCOUNTS
(In millions)
| | | | | | | | | | | | | | | |
| Successor Company |
| 2022 | Balance January 1, | Charged to Costs and Expenses | | Write-offs/Payments/Other | Balance December 31, |
| Allowance for credit losses ("ACL") on fixed maturities, AFS | $ | — | | $ | 1 | | | $ | (1) | | $ | — | |
| ACL on mortgage loans | 12 | | 3 | | | — | | 15 | |
| ACL on reinsurance recoverables | 37 | | — | | | (10) | | 27 | |
| 2021 | Balance
July 1, | Charged to Costs and Expenses | | Write-offs/Payments/Other | Balance
December 31, |
| ACL on fixed maturities, AFS | — | | — | | | — | | — | |
| ACL on mortgage loans | 12 | | — | | | — | | 12 | |
| ACL on reinsurance recoverables | 34 | | 3 | | | — | | 37 | |
| Predecessor Company |
| 2021 | Balance
January 1, | Charged to Costs and Expenses | | Write-offs/Payments/Other | Balance
June 30, |
| ACL on fixed maturities, AFS | 1 | | — | | | — | | 1 | |
| ACL on mortgage loans | 17 | | (6) | | | — | | 11 | |
| ACL on reinsurance recoverables | 7 | | — | | | — | | 7 | |
| 2020 | Balance January 1, | Charged to Costs and Expenses | | Write-offs/Payments/Other | Balance December 31, |
| ACL on fixed maturities, AFS | — | | 1 | | | — | | 1 | |
| ACL on mortgage loans | 9 | | 8 | | | — | | 17 | |
| ACL on reinsurance recoverables | 5 | | 2 | | | — | | 7 | |