Exhibit 99.2

Third Quarter 2013 Snapshot Revenues, Operating Profit and Earnings Per Share Increasein the Third Quarter 2013 Q3 Net revenues $1.37 billion, up 2% year-over-year International Segment up 11% Emerging markets continue to post strong growth: Up 22% year-over-year Entertainment and Licensing up 13% Games and Girls categories increased revenues year-over-year Difficult comparisons remain in Boys category; Preschool down 2% Franchise Brand revenues up 19% Q3 Operating profit up 4% (absent charges)*Operating profit year-to-date, ex. charges, up 4% year-over-year despite flat revenues in same period Q3 2013 adjusted EPS of $1.31 per diluted share** As reported EPS $0.96 per diluted share *Q3 2013 reported operating profit includes $61.3 million pre-tax restructuring, partial pension settlement charges and arbitration award charges or $0.53 per diluted share**Q3 2013 reported EPS includes above charges and a favorable tax adjustment of $23.6 million, or $0.18 per diluted shareRefer to slides 23-27 for a reconciliation of “As Reported” to “As Adjusted” financials 4

Third Quarter 2013 Major Expense Items (as adjusted*) ($ millions, unaudited) 2013 2012 %Change YOY % of Q3 2013 Revenue Notes Cost of Sales $569 $586 -3.1% 41.5% Product mix; lower manufacturing costs Royalties $87 $89 -2.7% 6.3% Lower revenues from licensed properties Product Development $59 $48 22.5% 4.3% Film Development Write-Off; Addition of Backflip; Magic: The Gathering investments Advertising $136 $135 1.1% 10.0% Amortization of Intangibles $14 $13 12.6% 1.0% Addition of Backflip Program Production Cost Amortization $18 $13 40.6% 1.3% Mix of programming delivered in Q3 Selling, Distribution & Administration* $227 $211 7.6% 16.6% Compensation; Depreciation; Magic: The Gathering investments * Q3 2013 as adjusted financials excludes $61.3 million pre-tax restructuring, partial pension settlement charge and arbitration award charges. Refer to slide 23 for a reconciliation of “As Reported” to “As Adjusted” financials. 9

Third Quarter 2013 Operating Profit -20% +4% Operating profit adversely impacted by arbitration award.Underlying operating profitability improved. Adjusted operating profit margin increased to 19.0% in Q3 2013 compared to 18.6% in Q3 2012 * Q3 2013 excludes $61.3 million pre-tax restructuring, partial pension settlement charge and arbitration award charges. Refer to slide 23 for a reconciliation of “As Reported” to “As Adjusted” financials. 10 ($ Millions, Unaudited)

Adjusted 2013 net earnings of $173M or $1.31 per diluted share Excludes pre-tax arbitration award charges of $75.5M, or $0.50 per diluted share Excludes pre-tax restructuring and partial pension settlement charges of $4.1M, or $0.03 per diluted share Excludes favorable tax adjustment of $23.6 million, or $0.18 per diluted share Non-operating expense essentially flat year-over-year Underlying tax rate of 26.5% Average diluted shares 131.8M 2013 vs. 132.5M 2012 Third Quarter 2013 Net Earnings Attributable to Hasbro, Inc. $0.96per diluted share $1.24per diluted share $1.31per diluted share $1.24 per diluted share 12 ($ millions, except per share, unaudited)
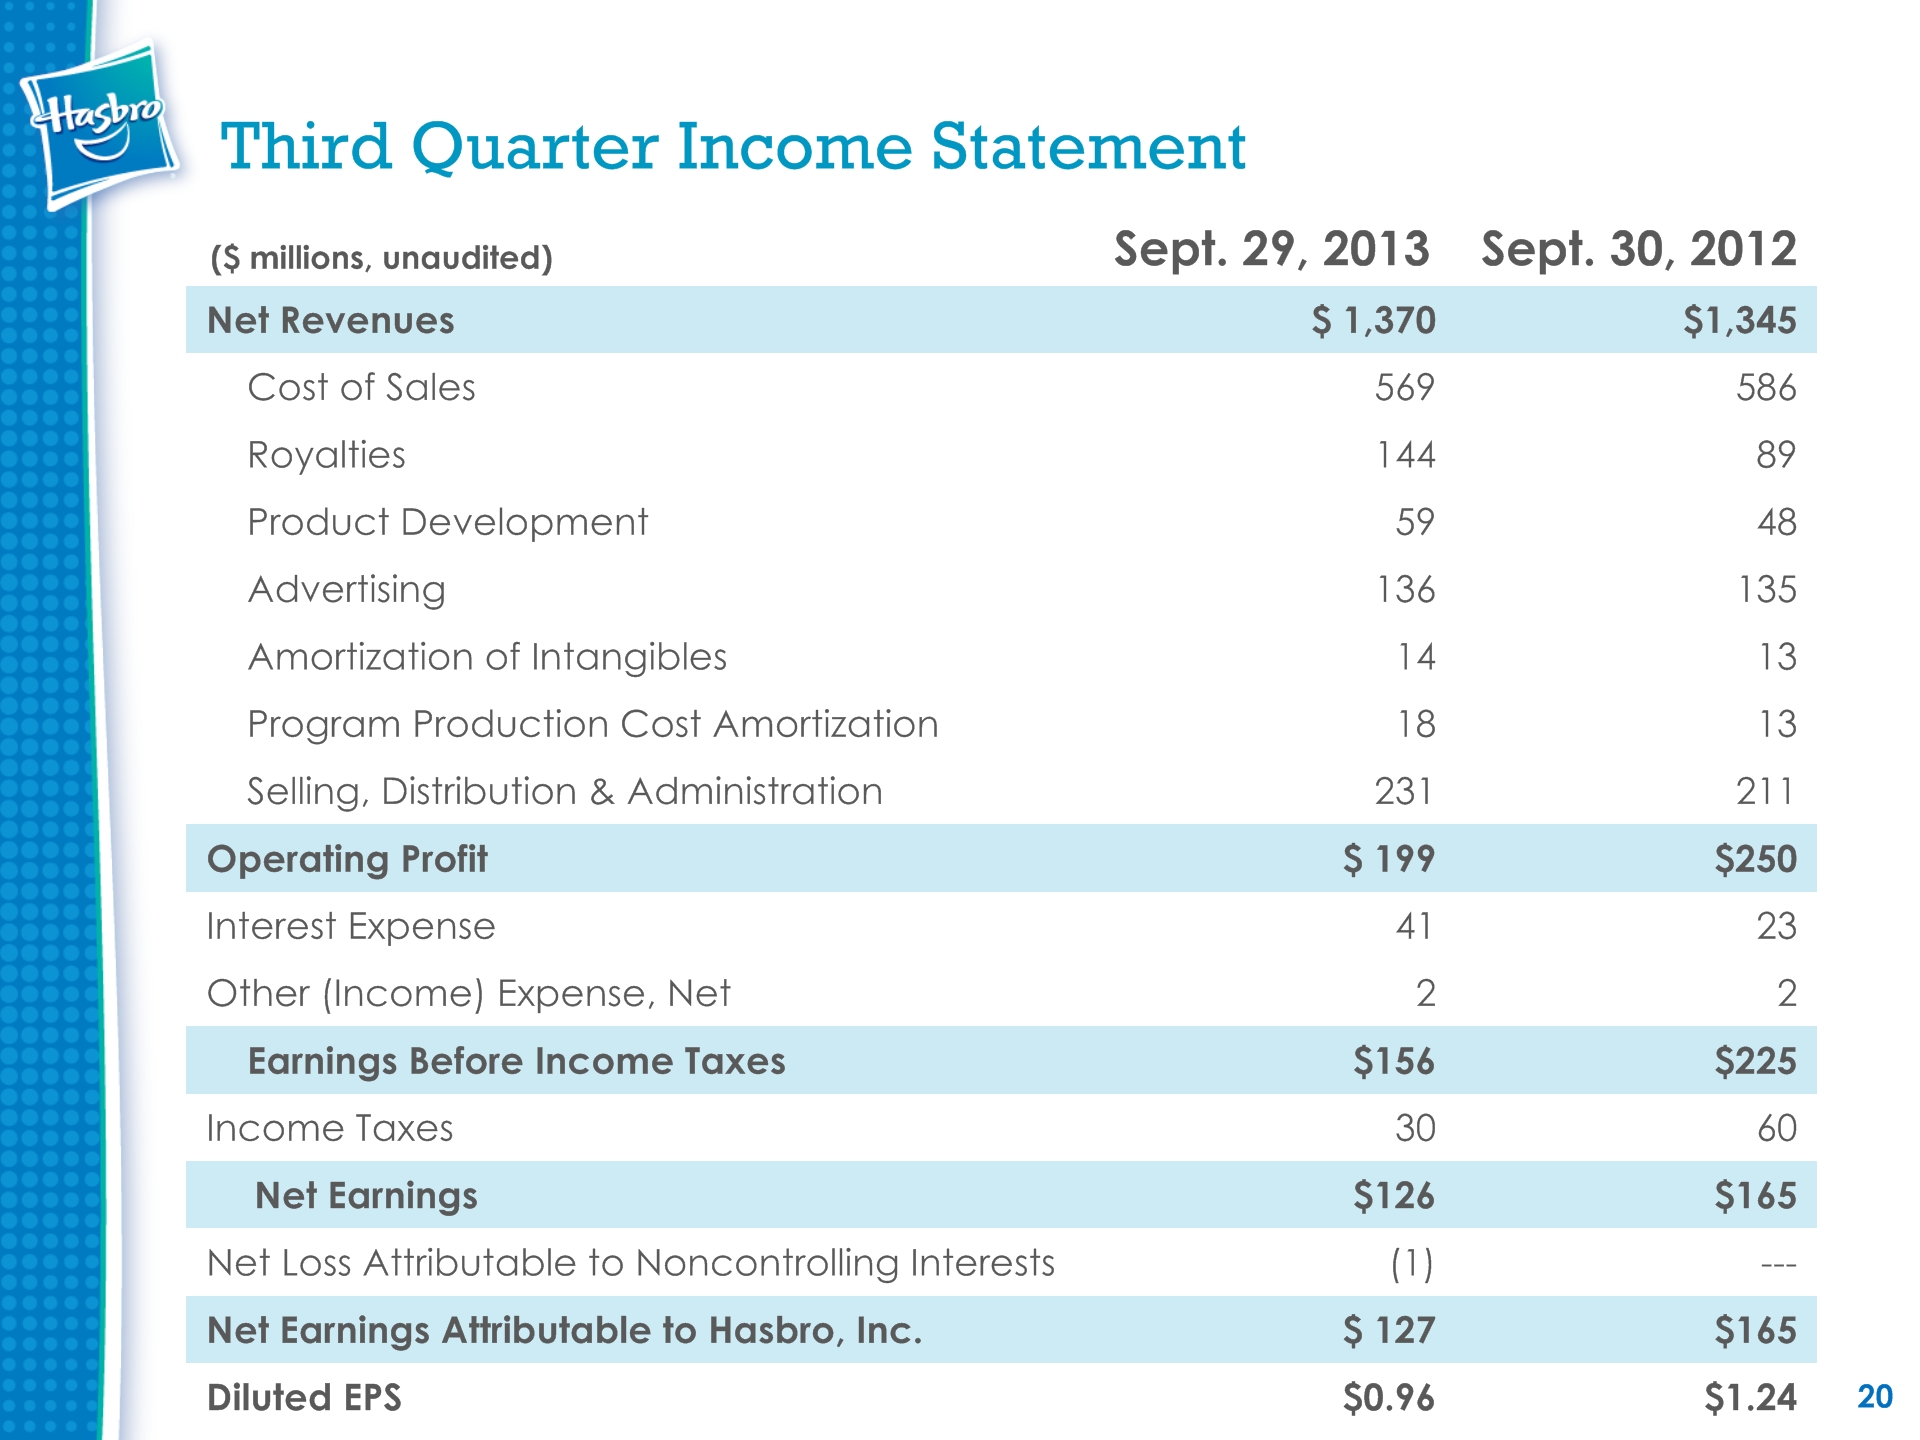
Third Quarter Income Statement ($ millions, unaudited) Sept. 29, 2013 Sept. 30, 2012 Net Revenues $ 1,370 $1,345 Cost of Sales 569 586 Royalties 144 89 Product Development 59 48 Advertising 136 135 Amortization of Intangibles 14 13 Program Production Cost Amortization 18 13 Selling, Distribution & Administration 231 211 Operating Profit $ 199 $250 Interest Expense 41 23 Other (Income) Expense, Net 2 2 Earnings Before Income Taxes $156 $225 Income Taxes 30 60 Net Earnings $126 $165 Net Loss Attributable to Noncontrolling Interests (1) --- Net Earnings Attributable to Hasbro, Inc. $ 127 $165 Diluted EPS $0.96 $1.24 20

September Balance Sheets ($ millions, unaudited) Sept. 29, 2013 Sept. 30, 2012 Cash and Cash Equivalents $ 589 $ 697 Accounts Receivable 1,215 1,196 Inventories 447 463 Other Current Assets 346 263 Total Current Assets $ 2,597 $ 2,619 Property, Plant & Equipment, Net 231 217 Other Assets 1,762 1,610 Total Assets $ 4,590 $ 4,446 Short-term Borrowings 213 264 Current Portion of Long-term Debt 430 --- Payables & Accrued Liabilities 1,006 862 Total Current Liabilities $ 1,649 $ 1,126 Long-term Debt 960 1,399 Other Liabilities 411 394 Total Liabilities $ 3,020 $ 2,919 Redeemable Noncontrolling Interests 47 --- Total Shareholders’ Equity 1,523 1,527 Total Liabilities, Redeemable Noncontrolling Interests & Shareholders’ Equity $ 4,590 $ 4,446 21
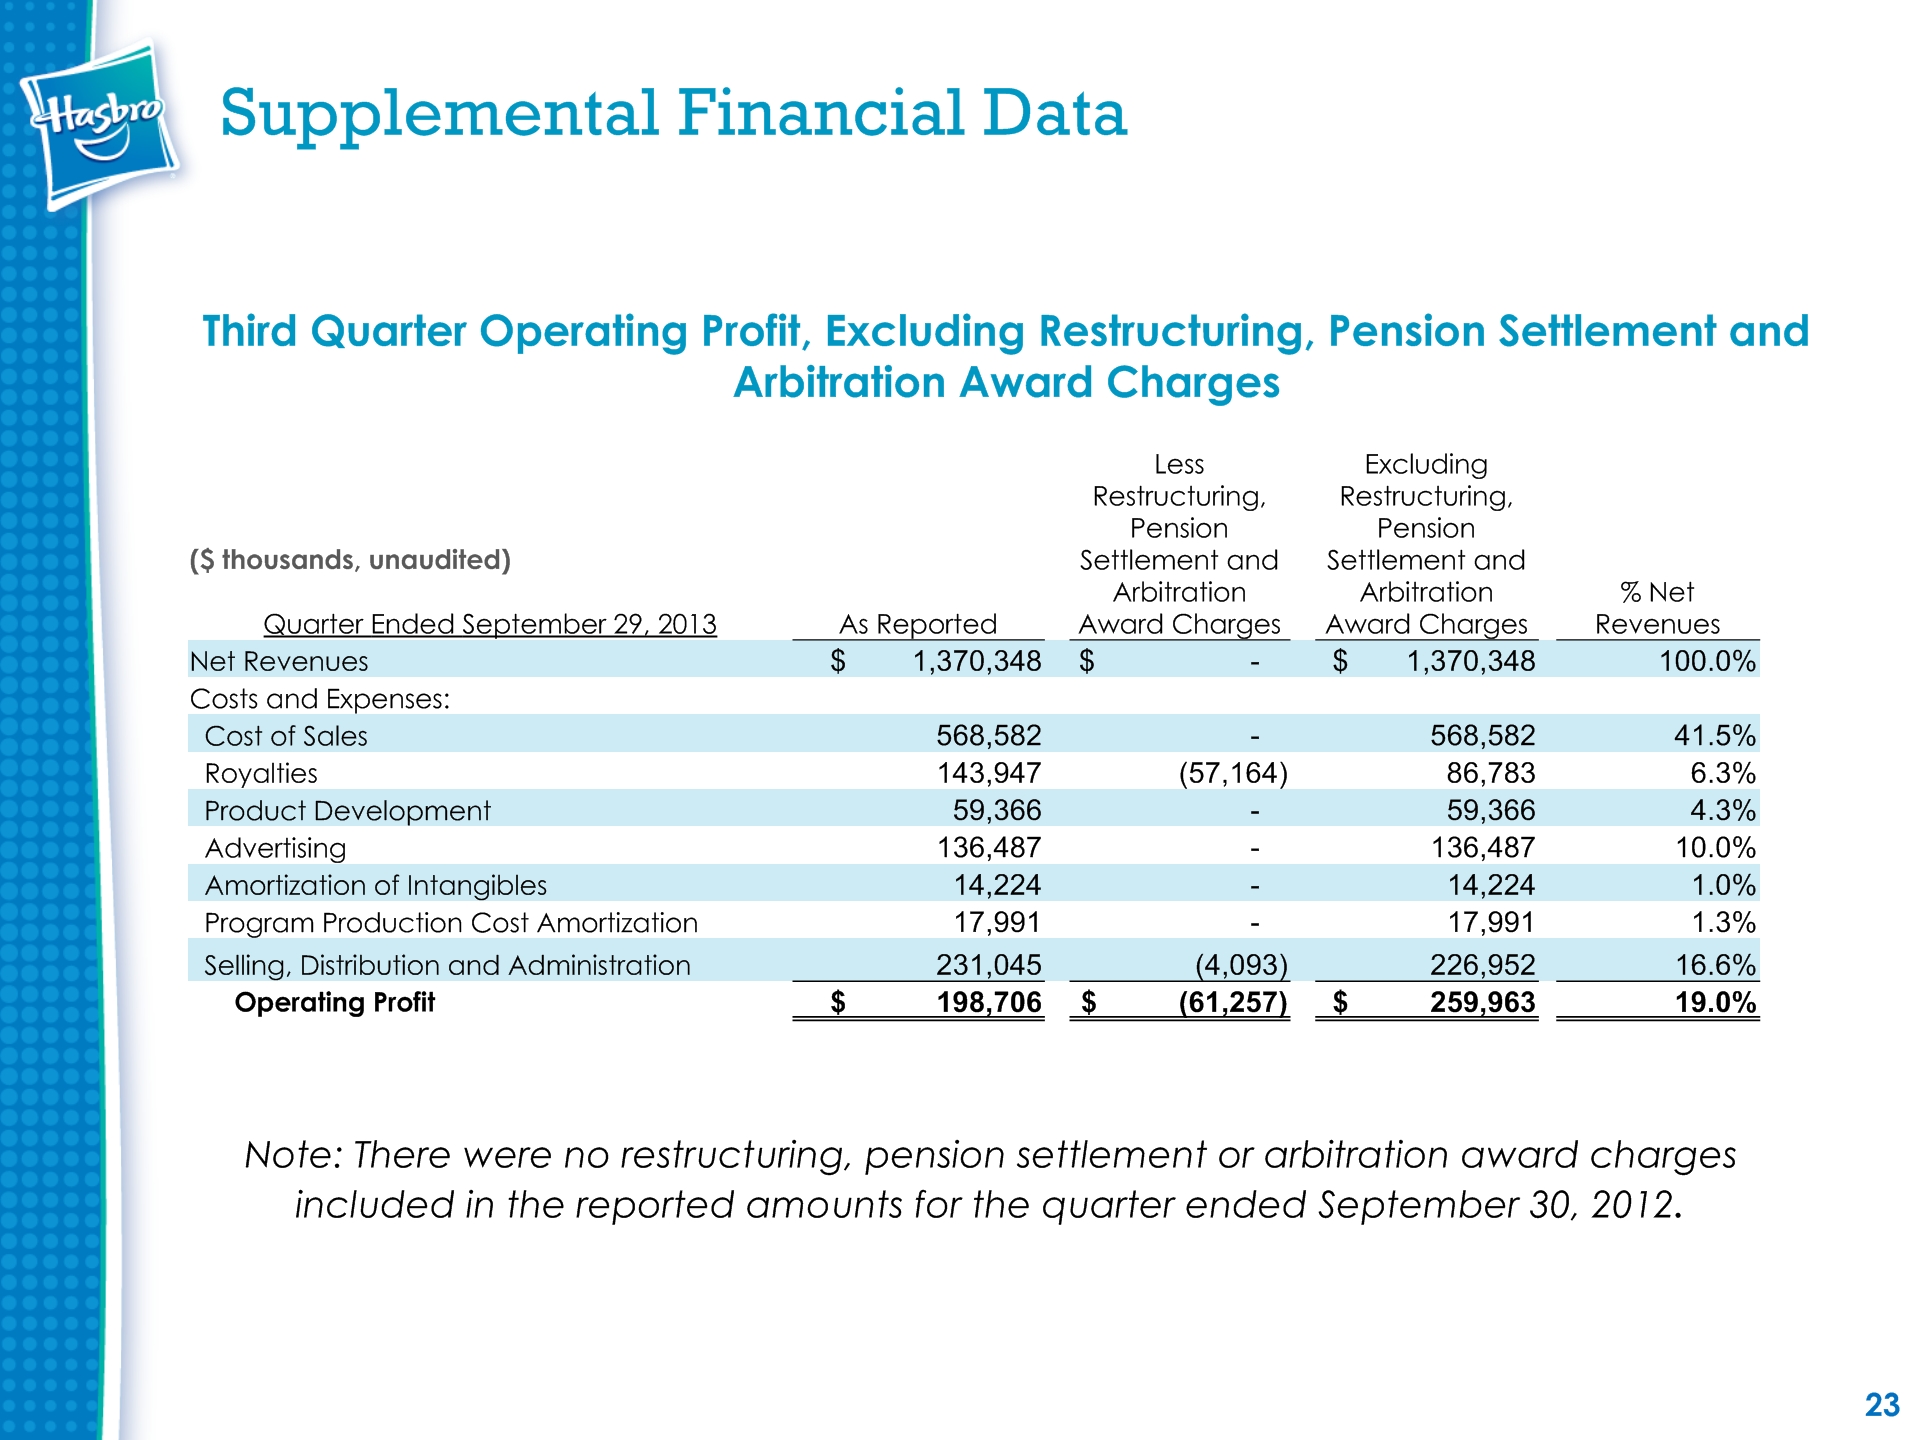
Supplemental Financial Data Third Quarter Operating Profit, Excluding Restructuring, Pension Settlement and Arbitration Award Charges ($ thousands, unaudited)Quarter Ended September 29, 2013 As Reported Less Restructuring, Pension Settlement and Arbitration Award Charges Excluding Restructuring, Pension Settlement and Arbitration Award Charges % Net Revenues Net Revenues $ 1,370,348 $ - $ 1,370,348 100.0% Costs and Expenses: Cost of Sales 568,582 - 568,582 41.5% Royalties 143,947 (57,164) 86,783 6.3% Product Development 59,366 - 59,366 4.3% Advertising 136,487 - 136,487 10.0% Amortization of Intangibles 14,224 - 14,224 1.0% Program Production Cost Amortization 17,991 - 17,991 1.3% Selling, Distribution and Administration 231,045 (4,093) 226,952 16.6% Operating Profit $ 198,706 $ (61,257) $ 259,963 19.0% Note: There were no restructuring, pension settlement or arbitration award charges included in the reported amounts for the quarter ended September 30, 2012. 23

Supplemental Financial Data ($ thousands, unaudited)Nine Months Ended September 29, 2013 As Reported Less Restructuring, Pension Settlement and Arbitration Award Charges Excluding Restructuring, Pension Settlement and Arbitration Award Charges % Net Revenues Net Revenues $ 2,800,384 $ - $ 2,800,384 100.0% Costs and Expenses: Cost of Sales 1,136,724 (8,493) 1,128,231 40.3% Royalties 243,568 (57,164) 186,404 6.7% Product Development 154,455 (3,515) 150,940 5.4% Advertising 277,278 - 277,278 9.9% Amortization of Intangibles 37,677 - 37,677 1.3% Program Production Cost Amortization 34,023 - 34,023 1.2% Selling, Distribution and Administration 633,238 (23,473) 609,765 21.8% Operating Profit $ 283,421 $ (92,645) $ 376,066 13.4% Nine Months Ended September 30, 2012 As Reported Less RestructuringCharges Excluding Restructuring Charges % Net Revenues Net Revenues $ 2,805,454 $ - $ 2,805,454 100.0% Costs and Expenses: Cost of Sales 1,155,536 (2,764) 1,152,772 41.1% Royalties 212,551 - 212,551 7.6% Product Development 143,511 (2,479) 141,032 5.0% Advertising 279,339 - 279,339 10.0% Amortization of Intangibles 34,792 - 34,792 1.2% Program Production Cost Amortization 25,950 - 25,950 0.9% Selling, Distribution and Administration 602,145 (5,887) 596,258 21.3% Operating Profit $ 351,630 $ (11,130) $ 362,760 12.9% 24 Nine Month Operating Profit, Excluding Restructuring, Pension Settlement and Arbitration Award Charges
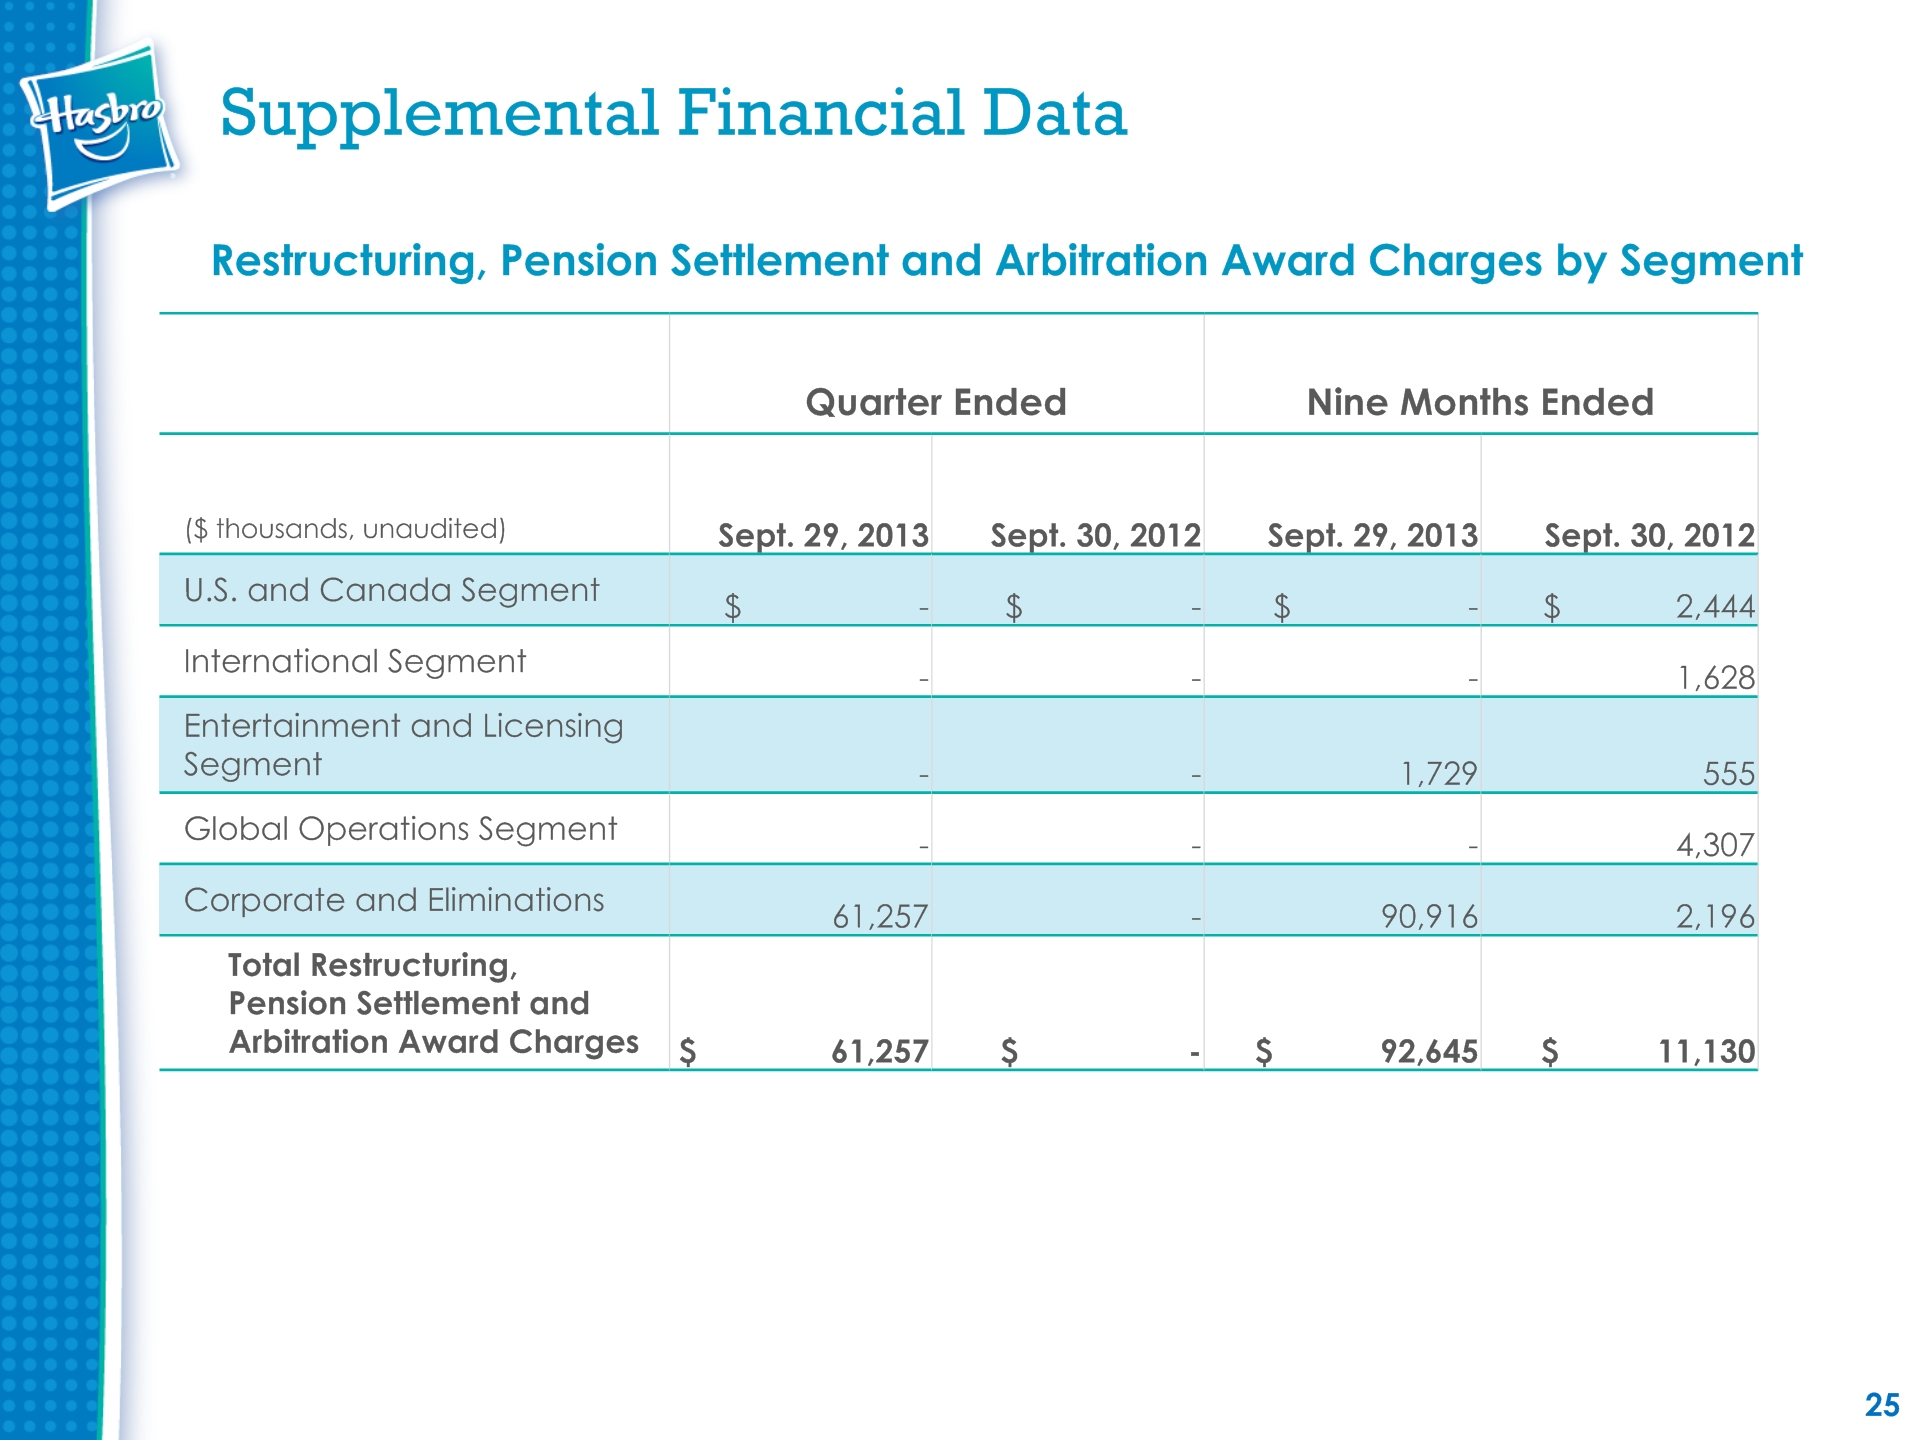
Supplemental Financial Data Quarter Ended Quarter Ended Nine Months Ended Nine Months Ended ($ thousands, unaudited) Sept. 29, 2013 Sept. 30, 2012 Sept. 29, 2013 Sept. 30, 2012 U.S. and Canada Segment $ - $ - $ - $ 2,444 International Segment - - - 1,628 Entertainment and Licensing Segment - - 1,729 555 Global Operations Segment - - - 4,307 Corporate and Eliminations 61,257 - 90,916 2,196 Total Restructuring, Pension Settlement and Arbitration Award Charges $ 61,257 $ - $ 92,645 $ 11,130 Restructuring, Pension Settlement and Arbitration Award Charges by Segment 25

Supplemental Financial Data Net Earnings and EPS Excluding Restructuring Charges, Pension Settlement Charges, Arbitration Award Charges and Benefit from Settlement of Tax Exams Quarter Ended Quarter Ended Quarter Ended Quarter Ended ($ thousands, except per share amounts, unaudited) Sept. 29, 2013 Diluted Per Share Amount Sept. 30, 2012 Diluted Per Share Amount Net Earnings Attributable to Hasbro, Inc., as Reported $ 126,574 $ 0.96 $ 164,852 $ 1.24 Restructuring Charges, Net of Tax 2,447 0.02 - - Pension Settlement Charges, Net of Tax 679 0.01 - - Arbitration Award Charges, Net of Tax 66,447 0.50 - - 2013 Benefit from Tax Exam Settlement (23,637) (0.18) - - Net Earnings Attributable to Hasbro, Inc., as Adjusted $ 172,510 $ 1.31 $ 164,852 $ 1.24 27 Nine Months Ended Nine Months Ended Nine Months Ended Nine Months Ended ($ thousands, except per share amounts, unaudited) Sept. 29, 2013 Diluted Per Share Amount Sept. 30, 2012 Diluted Per Share Amount Net Earnings Attributable to Hasbro, Inc., as Reported $ 156,383 $ 1.19 $ 205,700 $ 1.56 Restructuring Charges, Net of Tax 21,224 0.16 7,675 0.06 Pension Settlement Charges, Net of Tax 2,469 0.02 - - Arbitration Award Charges, Net of Tax 66,447 0.50 - - 2013 Benefit from Tax Exam Settlement (23,637) (0.18) - - Net Earnings Attributable to Hasbro, Inc., as Adjusted $ 222,886 $ 1.69 $ 213,375 $ 1.62