UNITED STATES
SECURITIES AND EXCHANGE COMMISSION
Washington, D.C. 20549
SCHEDULE 14A
Proxy Statement Pursuant to Section 14(a) of
the Securities Exchange Act of 1934
Filed by the Registrant ☒
Filed by a Party other than the Registrant ☐
Check the appropriate box:
| ☐ | Preliminary Proxy Statement |
| ☐ | Confidential, for Use of the Commission Only (as permitted by Rule 14a-6(e)(2)) |
| ☐ | Definitive Proxy Statement |
| ☐ | Definitive Additional Materials |
| ☒ | Soliciting Material under Rule 14a-12 |
| Hasbro, Inc. |
| (Name of Registrant as Specified In Its Charter) |
| (Name of Person(s) Filing Proxy Statement, if other than the Registrant) |
Payment of Filing Fee (Check the appropriate box): |
☒ | No fee required. | |
☐ | Fee computed on table below per Exchange Act Rules 14a-6(i)(1) and 0-11. | |
(1) | Title of each class of securities to which transaction applies: | |
(2) | Aggregate number of securities to which transaction applies: | |
(3) | Per unit price or other underlying value of transaction computed pursuant to Exchange Act Rule 0-11 (set forth the amount on which the filing fee is calculated and state how it was determined): | |
(4) | Proposed maximum aggregate value of transaction: | |
(5) | Total fee paid: | |
☐ | Fee paid previously with preliminary materials. | |
☐ | Check box if any part of the fee is offset as provided by Exchange Act Rule 0-11(a)(2) and identify the filing for which the offsetting fee was paid previously. Identify the previous filing by registration statement number, or the Form or Schedule and the date of its filing. | |
(1) | Amount Previously Paid: | |
(2) | Form, Schedule or Registration Statement No.: | |
(3) | Filing Party: | |
(4) | Date Filed: | |

Q1 April 19, 2022 2022 Earnings
Safe Harbor 2 Certain statements in this presentation contain "forward-looking statements" within the meaning of the Private Securities Litigation Reform Act of 1995. These statements, which may be identified by the use of forward-looking words or phrases, include statements relating to: our future performance and outlook for growth in 2022; expectations relating to products, gaming and entertainment to be developed and delivered throughout the year; our plans relating to our share repurchase program; our ability to achieve our other financial and business goals; and our liquidity. Our actual actions or results may differ materially from those expected or anticipated in the forward-looking statements due to both known and unknown risks and uncertainties. Specific factors that might cause such a difference include, but are not limited to:our ability to design, develop, manufacture, source and ship products on a timely, cost-effective and profitable basis;our ability to implement shipping strategies to lessen the impact of any increased shipping costs due to shipping delays or changes in required methods of shipping, as well as our ability to take any price increases to offset shipping costs, increases in prices of raw materials or other increases in costs of our products;rapidly changing consumer interests in the types of products and entertainment we offer;our ability to develop and distribute engaging storytelling across media to drive brand awareness;our ability to successfully compete in the global play and entertainment industry, including with manufacturers, marketers, and sellers of toys and games, digital gaming products and digital media, as well as with film studios, television production companies and independent distributors and content producers;our ability to successfully evolve and transform our business and capabilities to address a changing global consumer landscape and retail environment, including changes to our supply chain, changing inventory and sales policies and practices of our customers and increased emphasis on ecommerce;our dependence on third party relationships, including with third party manufacturers, licensors of brands, studios, content producers and entertainment distribution channels;risks relating to the concentration of manufacturing for many of our products in the People’s Republic of China and our ability to successfully diversify sourcing of our products to reduce reliance on sources of supply in China;our ability to successfully develop and execute plans to mitigate the negative impact of the coronavirus on our business, including, without limitation, negative impacts to our supply chain and costs that have occurred and could continue to occur in countries where we source significant amounts of product;risks associated with international operations, such as currency conversion, currency fluctuations, the imposition of tariffs, quotas, shipping delays or difficulties, border adjustment taxes or other protectionist measures, and other challenges in the territories in which we operate,the impact of the crisis between Russia and Ukraine on our business, including on receivables;downturns in global and regional economic conditions impacting one or more of the markets in which we sell products, which can negatively impact our retail customers and consumers, result in lower employment levels, consumer disposable income, retailer inventories and spending, including lower spending on purchases of our products;other economic and public health conditions or regulatory changes in the markets in which we and our customers, partners, licensees, suppliers and manufacturers operate, such as inflation, rising interest rates, higher commodity prices, labor costs or transportation costs, or outbreaks of disease, such as the coronavirus, the occurrence of which could create work slowdowns, delays or shortages in production or shipment of products, increases in costs or delays in revenue;the success of our key partner brands, including the ability to secure, maintain and extend agreements with our key partners or the risk of delays, increased costs or difficulties associated with any of our or our partners’ planned digital applications or media initiatives;fluctuations in our business due to seasonality;the concentration of our customers, potentially increasing the negative impact to our business of difficulties experienced by any of our customers or changes in their purchasing or selling patterns;the bankruptcy or other lack of success of one or more of our significant retailers, licensees and other partners;risks related to our recent leadership changes;our ability to attract and retain talented and diverse employees;our ability to realize the benefits of cost-savings and efficiency and/or revenue enhancing initiatives;our ability to protect our assets and intellectual property, including as a result of infringement, theft, misappropriation, cyber-attacks or other acts compromising the integrity of our assets or intellectual property;risks relating to the production of entertainment due to strikes, lockouts or other union actions that could halt or delay productions;risks relating to the impairment and/or write-offs of products and films and television programs we acquire and produce;risks relating to investments, acquisitions and dispositions;the risk of product recalls or product liability suits and costs associated with product safety regulations;changes in tax laws or regulations, or the interpretation and application of such laws and regulations, which may cause us to alter tax reserves or make other changes which significantly impact our reported financial results;the impact of litigation or arbitration decisions or settlement actions; andother risks and uncertainties as may be detailed from time to time in our public announcements and U.S. Securities and Exchange Commission (“SEC”) filings.The statements contained herein are based on our current beliefs and expectations. We undertake no obligation to make any revisions to the forward-looking statements contained in this presentation or to update them to reflect events or circumstances occurring after the date of this presentation.
Supplemental Financial Data 2 Use of Non-GAAP Financial MeasuresThe financial tables accompanying this presentation include non-GAAP financial measures as defined under SEC rules, specifically Adjusted operating profit, Adjusted net earnings and Adjusted net earnings per diluted share, which exclude, where applicable, acquisition and related costs, and acquired intangible amortization. Also included in this press release are the non-GAAP financial measures of EBITDA and Adjusted EBITDA. EBITDA represents net earnings attributable to Hasbro, Inc. excluding interest expense, income tax expense, net earnings (loss) attributable to noncontrolling interests, depreciation and amortization of intangibles. Segment EBITDA represents segment operating profit (loss) plus other income or expense, less depreciation and amortization of intangibles.Adjusted EBITDA also excludes the impact of stock compensation (acquisition-related stock expense), acquisition-related costs. As required by SEC rules, we have provided reconciliations on the attached schedules of these measures to the most directly comparable GAAP measure. Management believes that Adjusted net earnings, Adjusted net earnings per diluted share and Adjusted operating profit provide investors with an understanding of the underlying performance of our business absent unusual events.Management believes that EBITDA and Adjusted EBITDA are appropriate measures for evaluating the operating performance of our business because they reflect the resources available for strategic opportunities including, among others, to invest in the business, strengthen the balance sheet and make strategic acquisitions. These non-GAAP measures should be considered in addition to, not as a substitute for, or superior to, net earnings or other measures of financial performance prepared in accordance with GAAP as more fully discussed in our consolidated financial statements and filings with the SEC. As used herein, “GAAP” refers to accounting principles generally accepted in the United States of America.

Investing to Grow: Hasbro Brand Blueprint 2
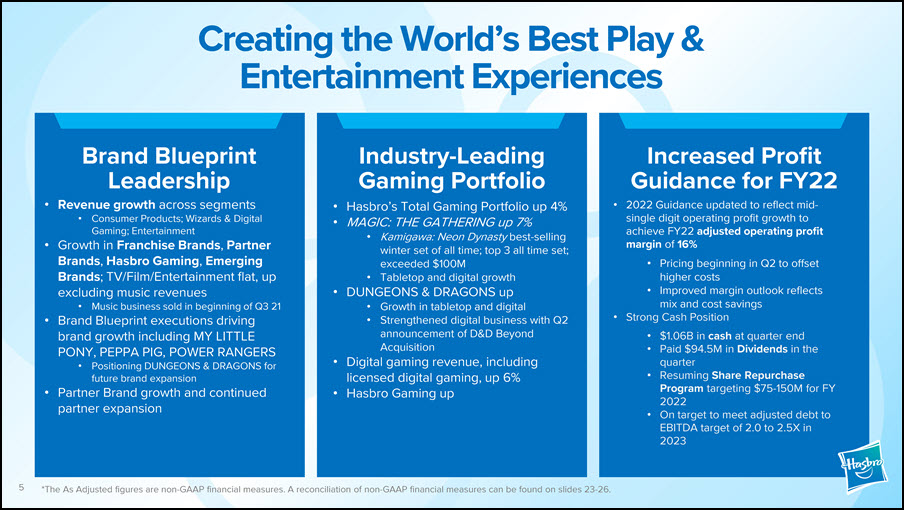
Creating the World’s Best Play & Entertainment Experiences Brand Blueprint LeadershipRevenue growth across segmentsConsumer Products; Wizards & Digital Gaming; EntertainmentGrowth in Franchise Brands, Partner Brands, Hasbro Gaming, Emerging Brands; TV/Film/Entertainment flat, up excluding music revenuesMusic business sold in beginning of Q3 21Brand Blueprint executions driving brand growth including MY LITTLE PONY, PEPPA PIG, POWER RANGERSPositioning DUNGEONS & DRAGONS for future brand expansionPartner Brand growth and continued partner expansion Industry-Leading Gaming PortfolioHasbro’s Total Gaming Portfolio up 4%MAGIC: THE GATHERING up 7%Kamigawa: Neon Dynasty best-selling winter set of all time; top 3 all time set; exceeded $100MTabletop and digital growthDUNGEONS & DRAGONS upGrowth in tabletop and digitalStrengthened digital business with Q2 announcement of D&D Beyond AcquisitionDigital gaming revenue, including licensed digital gaming, up 6%Hasbro Gaming up Increased Profit Guidance for FY222022 Guidance updated to reflect mid- single digit operating profit growth to achieve FY22 adjusted operating profit margin of 16%Pricing beginning in Q2 to offset higher costsImproved margin outlook reflects mix and cost savingsStrong Cash Position$1.06B in cash at quarter endPaid $94.5M in Dividends in the quarterResuming Share Repurchase Program targeting $75-150M for FY2022On target to meet adjusted debt to EBITDA target of 2.0 to 2.5X in 2023 5 *The As Adjusted figures are non-GAAP financial measures. A reconciliation of non-GAAP financial measures can be found on slides 23-26.
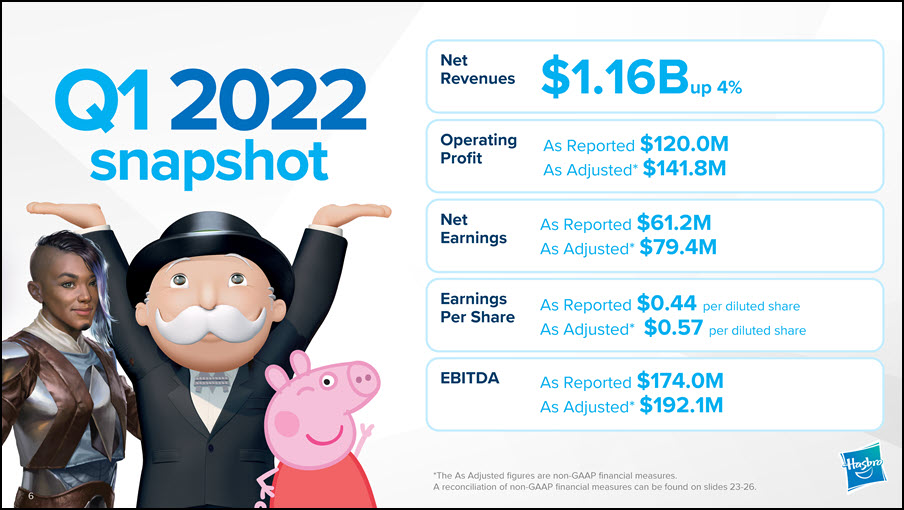
Net Revenues *The As Adjusted figures are non-GAAP financial measures.A reconciliation of non-GAAP financial measures can be found on slides 23-26. snapshot Q1 2022 Operating Profit Net Earnings Earnings Per Share EBITDA $1.16B up 4% As Reported $120.0MAs Adjusted* $141.8M As Reported $61.2MAs Adjusted* $79.4M As Reported $174.0MAs Adjusted* $192.1M As Reported $0.44 per diluted shareAs Adjusted* $0.57 per diluted share 6
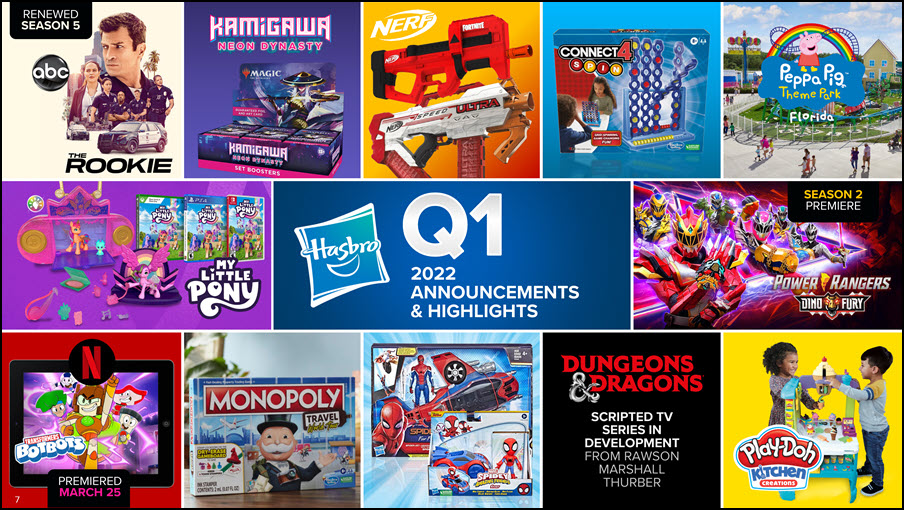
SCRIPTED TV SERIES IN DEVELOPMENT FROM RAWSON MARSHALL THURBER 2022ANNOUNCEMENTS & HIGHLIGHTS SEASON 2PREMIERE RENEWEDSEASON 5 PREMIEREDMARCH 25 7
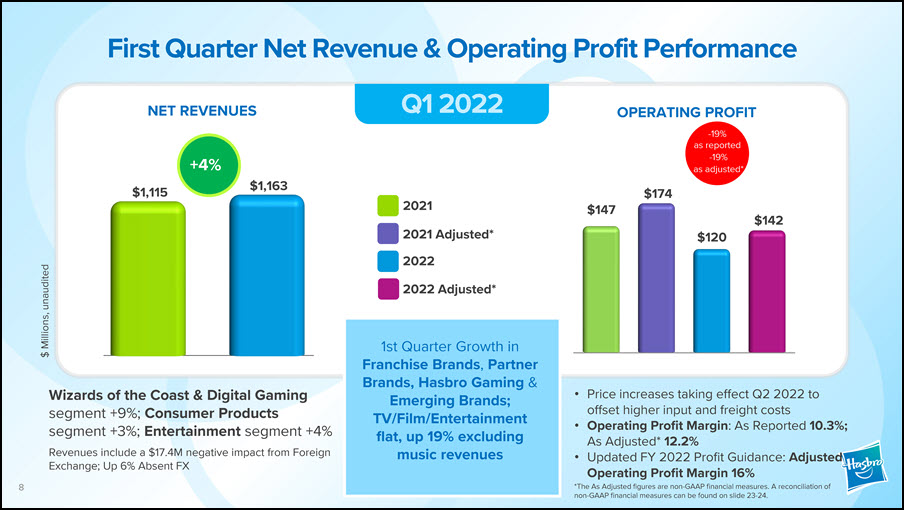
First Quarter Net Revenue & Operating Profit Performance Q1 2022 NET REVENUES $147 $174 $120 $142 20212021 Adjusted*20222022 Adjusted* $1,115 $1,163 1st Quarter Growth in Franchise Brands, Partner Brands, Hasbro Gaming & Emerging Brands; TV/Film/Entertainment flat, up 19% excluding music revenues Wizards of the Coast & Digital Gaming segment +9%; Consumer Products segment +3%; Entertainment segment +4%Revenues include a $17.4M negative impact from Foreign Exchange; Up 6% Absent FX Price increases taking effect Q2 2022 to offset higher input and freight costsOperating Profit Margin: As Reported 10.3%;As Adjusted* 12.2%Updated FY 2022 Profit Guidance: Adjusted Operating Profit Margin 16%*The As Adjusted figures are non-GAAP financial measures. A reconciliation of non-GAAP financial measures can be found on slide 23-24. $ Millions, unaudited +4% OPERATING PROFIT-19%as reported-19%as adjusted* 8
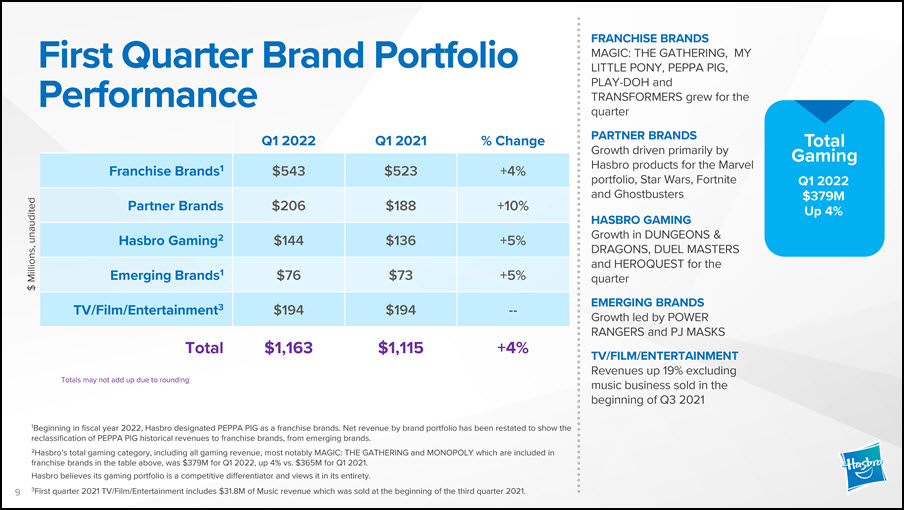
First Quarter Brand Portfolio Performance $ Millions, unaudited Q1 2022 Q1 2021 % Change Franchise Brands1 $543 $523 +4% Partner Brands $206 $188 +10% Hasbro Gaming2 $144 $136 +5% Emerging Brands1 $76 $73 +5% TV/Film/Entertainment3 $194 $194 -- Total $1,163 $1,115 +4% Totals may not add up due to rounding FRANCHISE BRANDS MAGIC: THE GATHERING, MY LITTLE PONY, PEPPA PIG, PLAY-DOH andTRANSFORMERS grew for the quarterPARTNER BRANDSGrowth driven primarily by Hasbro products for the Marvel portfolio, Star Wars, Fortnite and GhostbustersHASBRO GAMINGGrowth in DUNGEONS & DRAGONS, DUEL MASTERSand HEROQUEST for the quarterEMERGING BRANDSGrowth led by POWER RANGERS and PJ MASKSTV/FILM/ENTERTAINMENTRevenues up 19% excluding music business sold in the beginning of Q3 2021 Total GamingQ1 2022$379M Up 4% 1Beginning in fiscal year 2022, Hasbro designated PEPPA PIG as a franchise brands. Net revenue by brand portfolio has been restated to show the reclassification of PEPPA PIG historical revenues to franchise brands, from emerging brands.2Hasbro’s total gaming category, including all gaming revenue, most notably MAGIC: THE GATHERING and MONOPOLY which are included in franchise brands in the table above, was $379M for Q1 2022, up 4% vs. $365M for Q1 2021.Hasbro believes its gaming portfolio is a competitive differentiator and views it in its entirety.3First quarter 2021 TV/Film/Entertainment includes $31.8M of Music revenue which was sold at the beginning of the third quarter 2021. 9
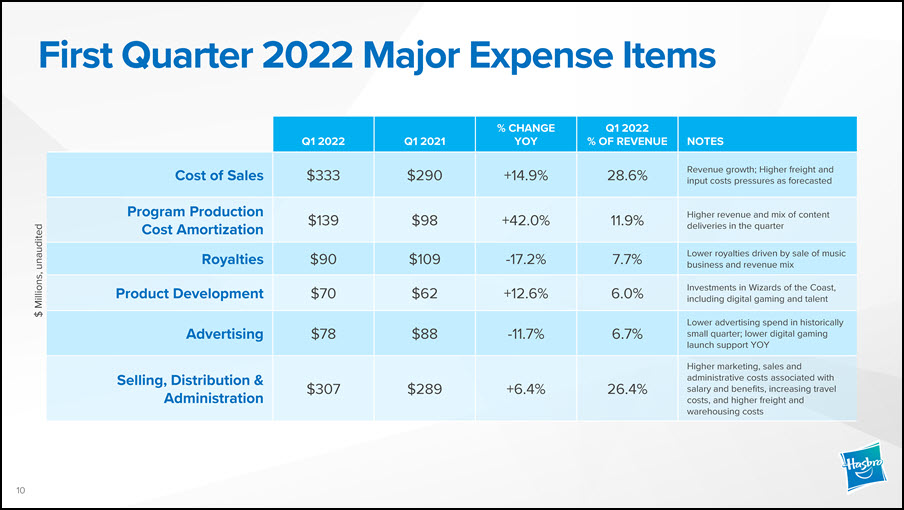
First Quarter 2022 Major Expense Items Q1 2022 Q1 2021 % CHANGE YOY Q1 2022% OF REVENUE NOTES Cost of Sales $333 $290 +14.9% 28.6% Revenue growth; Higher freight and input costs pressures as forecasted Program Production Cost Amortization $139 $98 +42.0% 11.9% Higher revenue and mix of content deliveries in the quarter Royalties $90 $109 -17.2% 7.7% Lower royalties driven by sale of music business and revenue mix Product Development $70 $62 +12.6% 6.0% Investments in Wizards of the Coast, including digital gaming and talent Advertising $78 $88 -11.7% 6.7% Lower advertising spend in historically small quarter; lower digital gaming launch support YOY Selling, Distribution &Administration $307 $289 +6.4% 26.4% Higher marketing, sales and administrative costs associated with salary and benefits, increasing travel costs, and higher freight and warehousing costs $ Millions, unaudited 10
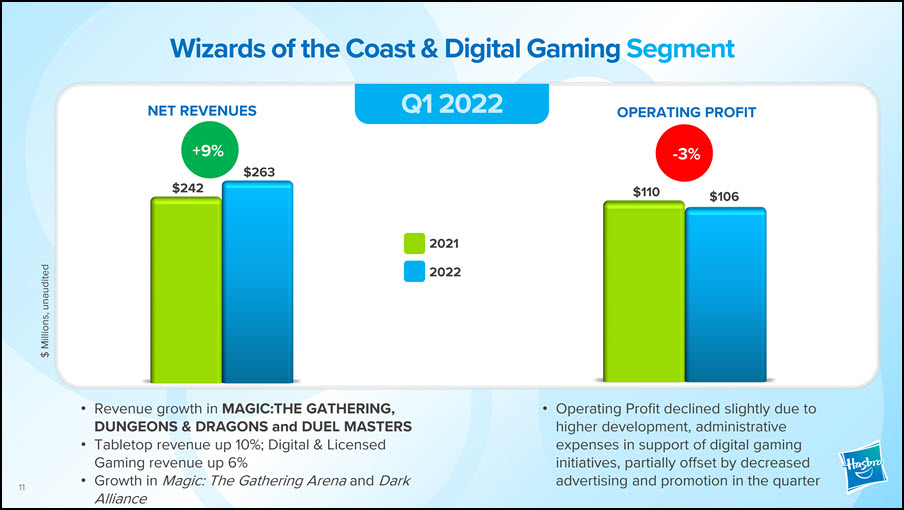
Wizards of the Coast & Digital Gaming Segment Operating Profit declined slightly due to higher development, administrative expenses in support of digital gaming initiatives, partially offset by decreased advertising and promotion in the quarter Revenue growth in MAGIC:THE GATHERING, DUNGEONS & DRAGONS and DUEL MASTERSTabletop revenue up 10%; Digital & Licensed Gaming revenue up 6%Growth in Magic: The Gathering Arena and Dark Alliance $242 $263 $110 $106 20212022 +9% -3% Q1 2022 $ Millions, unaudited NET REVENUES OPERATING PROFIT 11
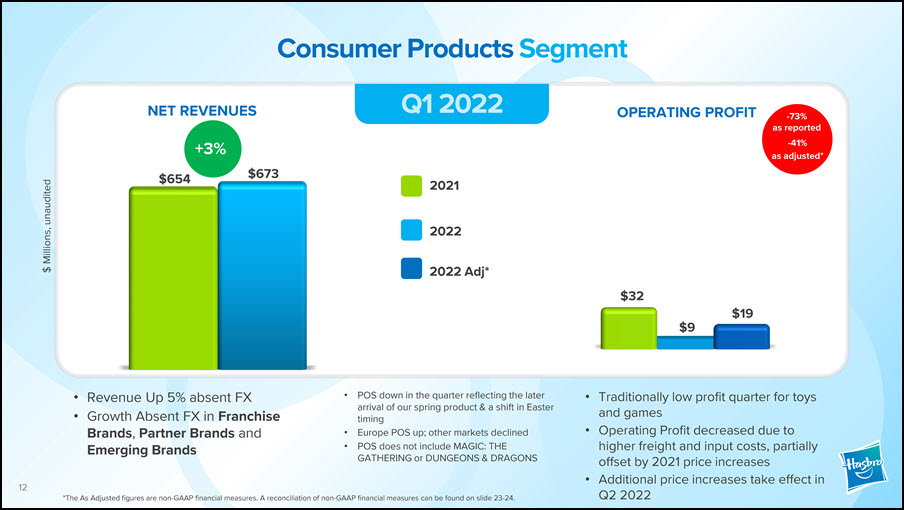
Consumer Products Segment Q1 2022 $654 $673 $32 $19$9 +3% 2021 Traditionally low profit quarter for toys and gamesOperating Profit decreased due to higher freight and input costs, partially offset by 2021 price increasesAdditional price increases take effect in Q2 2022 Revenue Up 5% absent FXGrowth Absent FX in Franchise Brands, Partner Brands and Emerging Brands POS down in the quarter reflecting the later arrival of our spring product & a shift in Easter timingEurope POS up; other markets declinedPOS does not include MAGIC: THE GATHERING or DUNGEONS & DRAGONS $ Millions, unaudited NET REVENUES OPERATING PROFIT -73%as reported-41%as adjusted* 12 *The As Adjusted figures are non-GAAP financial measures. A reconciliation of non-GAAP financial measures can be found on slide 23-24. 20222022 Adj*
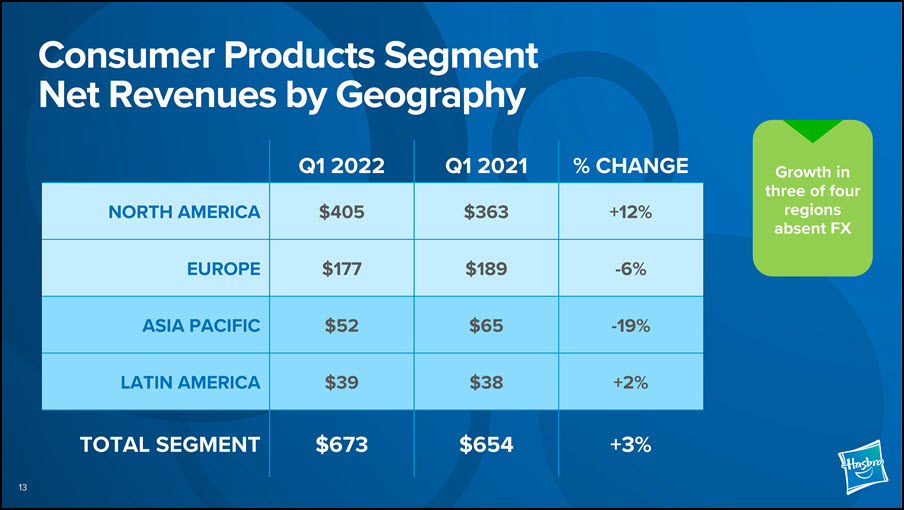
Consumer Products Segment Net Revenues by Geography Q1 2022 Q1 2021 % CHANGE NORTH AMERICA $405 $363 +12% EUROPE $177 $189 -6% ASIA PACIFIC $52 $65 -19% LATIN AMERICA $39 $38 +2% TOTAL SEGMENT $673 $654 +3% Growth in three of four regions absent FX 13
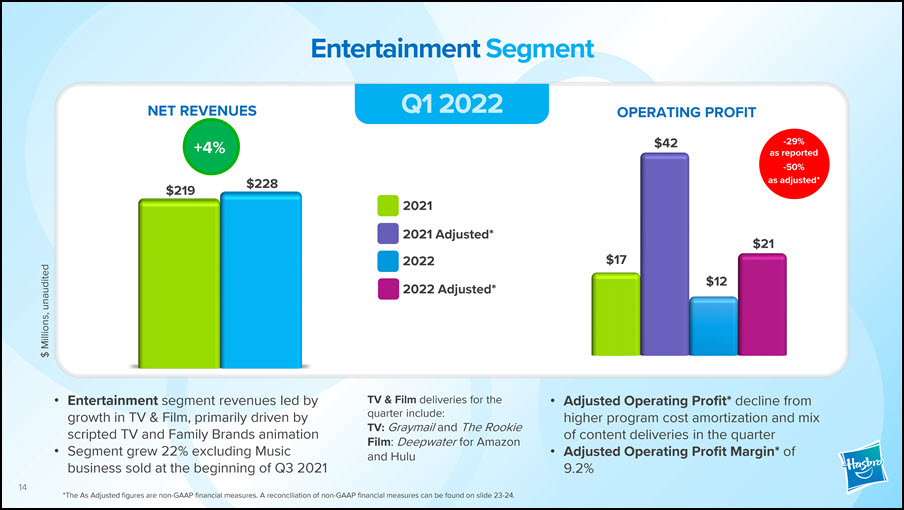
Entertainment Segment Q1 2022 $ Millions, unaudited Entertainment segment revenues led by growth in TV & Film, primarily driven by scripted TV and Family Brands animationSegment grew 22% excluding Music business sold at the beginning of Q3 2021 Adjusted Operating Profit* decline from higher program cost amortization and mix of content deliveries in the quarterAdjusted Operating Profit Margin* of 9.2% TV & Film deliveries for the quarter include:TV: Graymail and The Rookie Film: Deepwater for Amazon and Hulu $219 $228 $17 $12 $21 NET REVENUES OPERATING PROFIT$42 2021 2021 Adjusted*20222022 Adjusted* +4% -29%as reported-50%as adjusted* 14*The As Adjusted figures are non-GAAP financial measures. A reconciliation of non-GAAP financial measures can be found on slide 23-24.
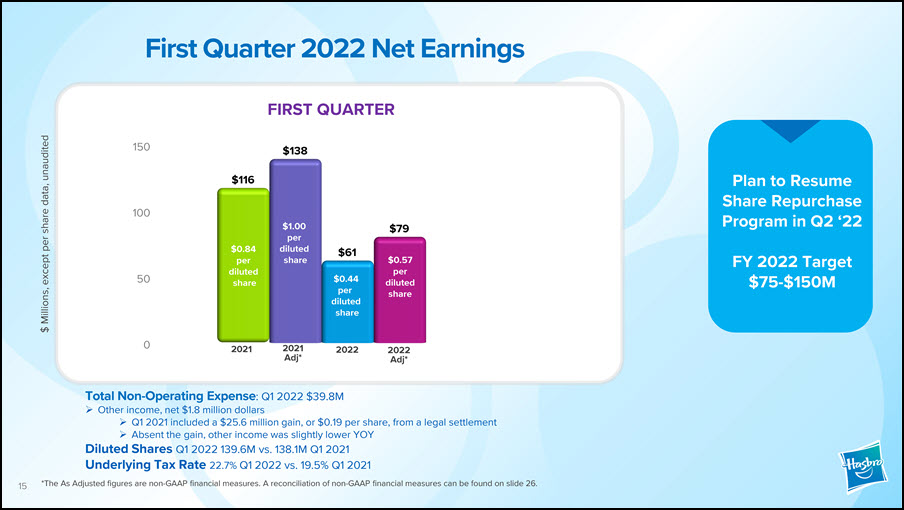
First Quarter 2022 Net Earnings $ Millions, except per share data, unaudited Total Non-Operating Expense: Q1 2022 $39.8MOther income, net $1.8 million dollarsQ1 2021 included a $25.6 million gain, or $0.19 per share, from a legal settlementAbsent the gain, other income was slightly lower YOY Diluted Shares Q1 2022 139.6M vs. 138.1M Q1 2021 Underlying Tax Rate 22.7% Q1 2022 vs. 19.5% Q1 2021*The As Adjusted figures are non-GAAP financial measures. A reconciliation of non-GAAP financial measures can be found on slide 26. FIRST QUARTER 0 50 100 150 $116 $138 $61 $79 2021 2021Adj* 2022 2022Adj* $0.84per diluted share $1.00per diluted share $0.44per diluted share $0.57per diluted share Plan to Resume Share Repurchase Program in Q2 ‘22 FY 2022 Target$75-$150M 15
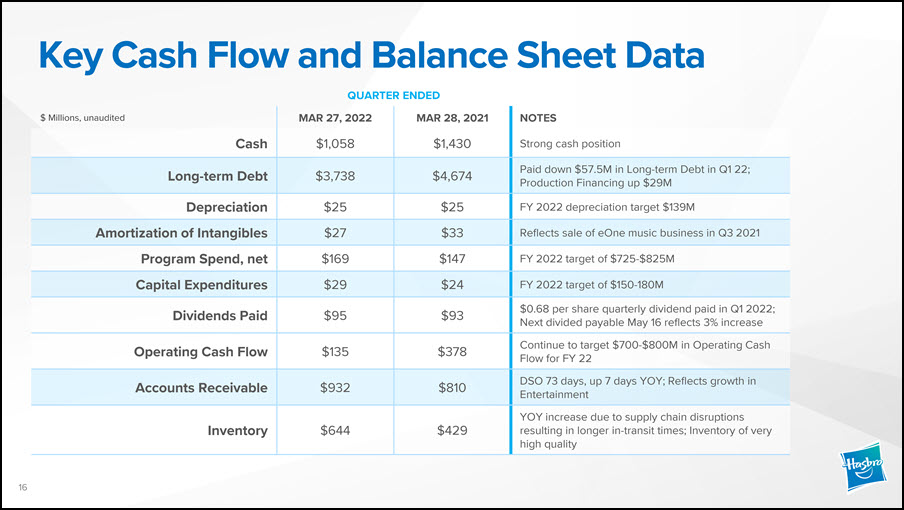
Key Cash Flow and Balance Sheet Data $ Millions, unaudited MAR 27, 2022 MAR 28, 2021 NOTES Cash $1,058 $1,430 Strong cash position Long-term Debt $3,738 $4,674 Paid down $57.5M in Long-term Debt in Q1 22; Production Financing up $29M Depreciation $25 $25 FY 2022 depreciation target $139M Amortization of Intangibles $27 $33 Reflects sale of eOne music business in Q3 2021 Program Spend, net $169 $147 FY 2022 target of $725-$825M Capital Expenditures $29 $24 FY 2022 target of $150-180M Dividends Paid $95 $93 $0.68 per share quarterly dividend paid in Q1 2022; Next divided payable May 16 reflects 3% increase Operating Cash Flow $135 $378 Continue to target $700-$800M in Operating Cash Flow for FY 22 Accounts Receivable $932 $810 DSO 73 days, up 7 days YOY; Reflects growth in Entertainment Inventory $644 $429 YOY increase due to supply chain disruptions resulting in longer in-transit times; Inventory of very high quality 16 QUARTER ENDED
CORPORATE SOCIAL RESPONSIBILITY Product & Content Safety Environmental Responsibility Human Rights & Ethical Sourcing Culture & Human Capital Management Our commitment to Purpose and ESG reflects our desire to help build a safer, more sustainable and inclusive company and world for all. 17
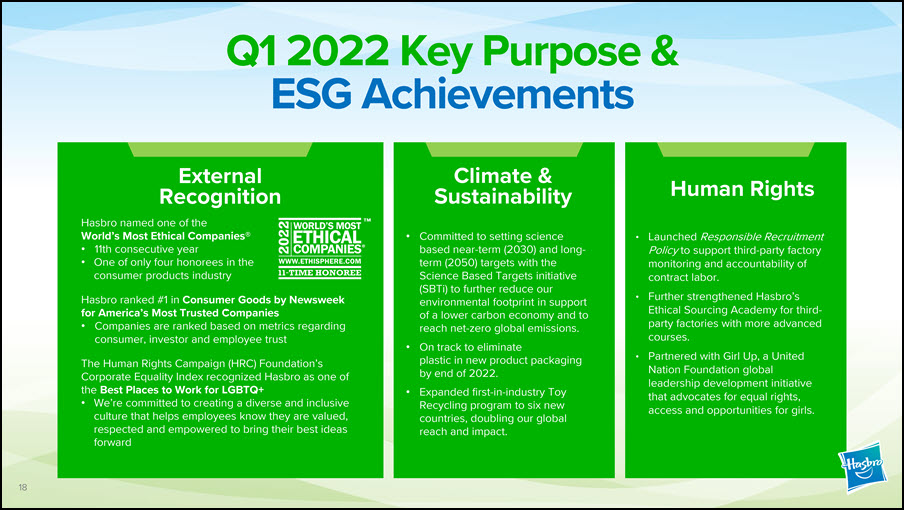
Q1 2022 Key Purpose & ESG Achievements . Human Rights External RecognitionHasbro named one of theWorld’s Most Ethical Companies®11th consecutive yearOne of only four honorees in the consumer products industryHasbro ranked #1 in Consumer Goods by Newsweek for America’s Most Trusted CompaniesCompanies are ranked based on metrics regarding consumer, investor and employee trustThe Human Rights Campaign (HRC) Foundation’s Corporate Equality Index recognized Hasbro as one of the Best Places to Work for LGBTQ+We’re committed to creating a diverse and inclusive culture that helps employees know they are valued,respected and empowered to bring their best ideas forward Climate & SustainabilityCommitted to setting science based near-term (2030) and long- term (2050) targets with the Science Based Targets initiative (SBTi) to further reduce our environmental footprint in support of a lower carbon economy and to reach net-zero global emissions.On track to eliminateplastic in new product packaging by end of 2022.Expanded first-in-industry Toy Recycling program to six new countries, doubling our global reach and impact. Launched Responsible Recruitment Policy to support third-party factory monitoring and accountability of contract labor.Further strengthened Hasbro’s Ethical Sourcing Academy for third- party factories with more advanced courses.Partnered with Girl Up, a United Nation Foundation global leadership development initiative that advocates for equal rights, access and opportunities for girls. 18

Supplemental Financial Information 19
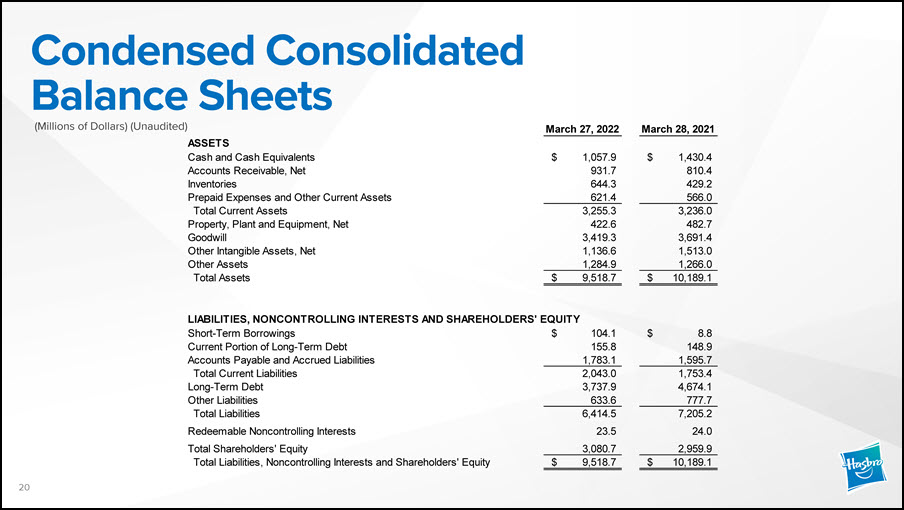
Condensed Consolidated Balance Sheets(Millions of Dollars) (Unaudited) ASSETS March 27, 2022 March 28, 2021 Cash and Cash Equivalents $ 1,057.9 $ 1,430.4 Accounts Receivable, Net 931.7 810.4 Inventories 644.3 429.2 Prepaid Expenses and Other Current Assets 621.4 566.0 Total Current Assets 3,255.3 3,236.0 Property, Plant and Equipment, Net 422.6 482.7 Goodwill 3,419.3 3,691.4 Other Intangible Assets, Net 1,136.6 1,513.0 Other Assets 1,284.9 1,266.0 Total Assets $ 9,518.7 $ 10,189.1 LIABILITIES, NONCONTROLLING INTERESTS AND SHAREHOLDERS' EQUITY Short-Term Borrowings $ 104.1 $ 8.8 Current Portion of Long-Term Debt 155.8 148.9 Accounts Payable and Accrued Liabilities 1,783.1 1,595.7 Total Current Liabilities 2,043.0 1,753.4 Long-Term Debt 3,737.9 4,674.1 Other Liabilities 633.6 777.7 Total Liabilities 6,414.5 7,205.2 Redeemable Noncontrolling Interests 23.5 24.0 Total Shareholders' Equity 3,080.7 2,959.9 Total Liabilities, Noncontrolling Interests and Shareholders' Equity $ 9,518.7 $ 10,189.1 20
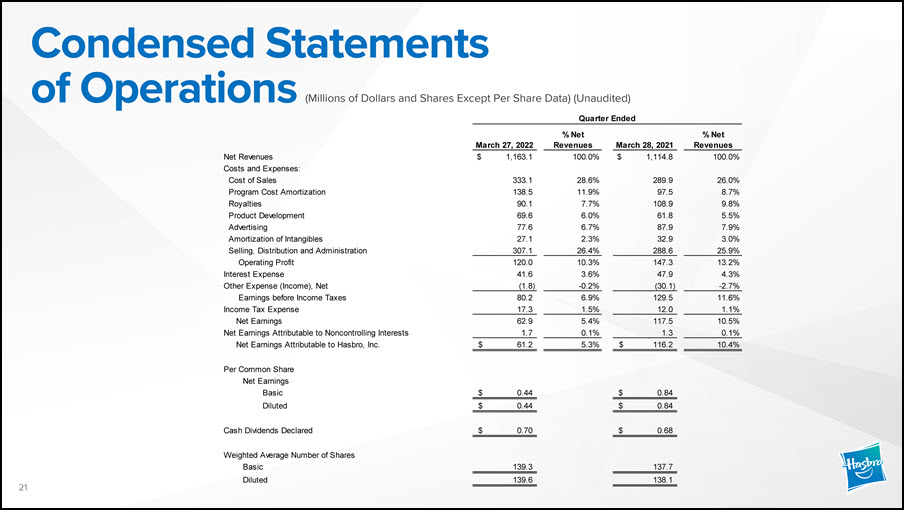
Condensed Statements Per Common Share Net Earnings of Operations (Millions of Dollars and Shares Except Per Share Data) (Unaudited)Quarter Ended Net Revenues March 27, 2022 $ 1,163.1 % Net Revenues 100.0% March 28, 2021 $ 1,114.8 % Net Revenues 100.0% Costs and Expenses: Cost of Sales 333.1 28.6% 289.9 26.0% Program Cost Amortization 138.5 11.9% 97.5 8.7% Royalties 90.1 7.7% 108.9 9.8% Product Development 69.6 6.0% 61.8 5.5% Advertising 77.6 6.7% 87.9 7.9% Amortization of Intangibles 27.1 2.3% 32.9 3.0% Selling, Distribution and Administration 307.1 26.4% 288.6 25.9% Operating Profit 120.0 10.3% 147.3 13.2% Interest Expense 41.6 3.6% 47.9 4.3% Other Expense (Income), Net (1.8) -0.2% (30.1) -2.7% Earnings before Income Taxes 80.2 6.9% 129.5 11.6% Income Tax Expense 17.3 1.5% 12.0 1.1% Net Earnings 62.9 5.4% 117.5 10.5% Net Earnings Attributable to Noncontrolling Interests 1.7 0.1% 1.3 0.1% Net Earnings Attributable to Hasbro, Inc. $ 61.2 5.3% $ 116.2 10.4% Basic $ 0.44 $ 0.84 Diluted $ 0.44 $ 0.84 Cash Dividends Declared $ 0.70 $ 0.68 Weighted Average Number of Shares Basic 139.3 137.7 Diluted 139.6 138.1 21
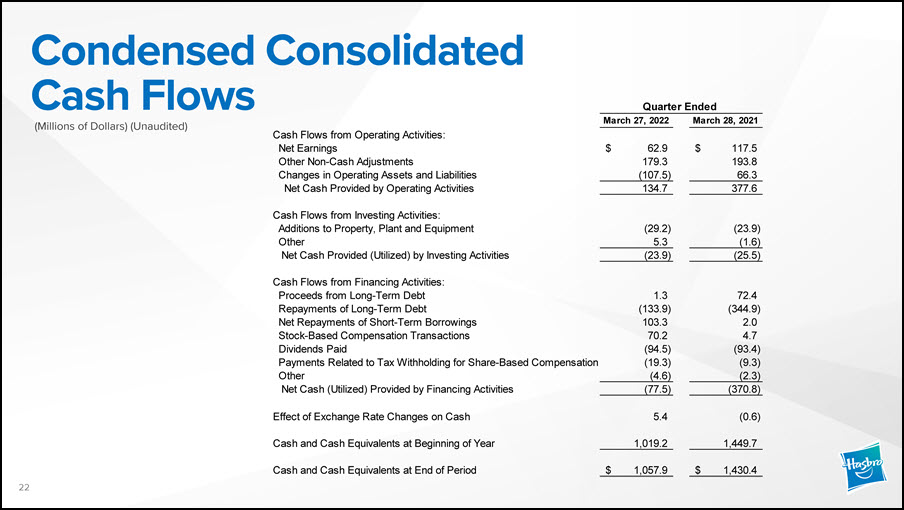
Condensed Consolidated Cash Flows (Millions of Dollars) (Unaudited) Quarter Ended March 27, 2022 March 28, 2021 Cash Flows from Operating Activities: Net Earnings $ 62.9 $ 117.5 Other Non-Cash Adjustments 179.3 193.8 Changes in Operating Assets and Liabilities (107.5) 66.3 Net Cash Provided by Operating Activities 134.7 377.6 Cash Flows from Investing Activities: Additions to Property, Plant and Equipment (29.2) (23.9) Other 5.3 (1.6) Net Cash Provided (Utilized) by Investing Activities (23.9) (25.5) Cash Flows from Financing Activities: Proceeds from Long-Term Debt 1.3 72.4 Repayments of Long-Term Debt (133.9) (344.9) Net Repayments of Short-Term Borrowings 103.3 2.0 Stock-Based Compensation Transactions 70.2 4.7 Dividends Paid (94.5) (93.4) Payments Related to Tax Withholding for Share-Based Compensation (19.3) (9.3) Other (4.6) (2.3) Net Cash (Utilized) Provided by Financing Activities (77.5) (370.8) Effect of Exchange Rate Changes on Cash 5.4 (0.6) Cash and Cash Equivalents at Beginning of Year 1,019.2 Cash and Cash Equivalents at End of Period $ 1,057.9 1,449.7 $ 1,430.4 22
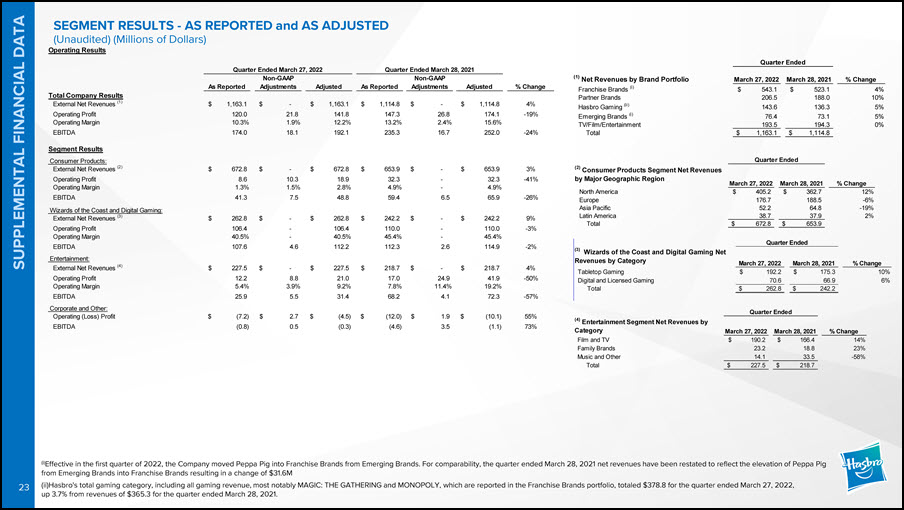
SUPPLEMENTAL FINANCIAL DATA Segment Results Consumer Products: External Net Revenues (2) $ 672.8 $ - $ 672.8 $ 653.9 $ - $ 653.9 3% Operating Profit 8.6 10.3 18.9 32.3 - 32.3 -41% Operating Margin 1.3% 1.5% 2.8% 4.9% - 4.9% EBITDA 41.3 7.5 48.8 59.4 6.5 65.9 -26% Wizards of the Coast and Digital Gaming: External Net Revenues (3) $ 262.8 $ - $ 262.8 $ 242.2 $ - $ 242.2 9% Operating Profit 106.4 - 106.4 110.0 - 110.0 -3% Operating Margin 40.5% - 40.5% 45.4% - 45.4% EBITDA 107.6 4.6 112.2 112.3 2.6 114.9 -2% Entertainment:External Net Revenues (4) $ 227.5 $ - $ 227.5 $ 218.7 $ - $ 218.7 4% Operating Profit 12.2 8.8 21.0 17.0 24.9 41.9 -50% Operating Margin 5.4% 3.9% 9.2% 7.8% 11.4% 19.2% EBITDA 25.9 5.5 31.4 68.2 4.1 72.3 -57% Corporate and Other:Operating (Loss) Profit $ (7.2) $ 2.7 $ (4.5) $ (12.0) $ 1.9 $ (10.1) 55% EBITDA (0.8) 0.5 (0.3) (4.6) 3.5 (1.1) 73% SEGMENT RESULTS - AS REPORTED and AS ADJUSTED(Unaudited) (Millions of Dollars)Operating Results Quarter Ended March 27, 2022 Quarter Ended March 28, 2021 Non-GAAP Non-GAAP (i)Effective in the first quarter of 2022, the Company moved Peppa Pig into Franchise Brands from Emerging Brands. For comparability, the quarter ended March 28, 2021 net revenues have been restated to reflect the elevation of Peppa Pig from Emerging Brands into Franchise Brands resulting in a change of $31.6M(ii)Hasbro's total gaming category, including all gaming revenue, most notably MAGIC: THE GATHERING and MONOPOLY, which are reported in the Franchise Brands portfolio, totaled $378.8 for the quarter ended March 27, 2022, up 3.7% from revenues of $365.3 for the quarter ended March 28, 2021. March 27, 2022 March 28, 2021 % Change Quarter Ended (2) Consumer Products Segment Net Revenues by Major Geographic Region North America $ 405.2 $ 362.7 12% Europe 176.7 188.5 -6% Asia Pacific 52.2 64.8 -19% Latin America 38.7 37.9 2% Total $ 672.8 $ 653.9 March 27, 2022 March 28, 2021 % Change Quarter Ended (4) Entertainment Segment Net Revenues by Category Film and TV $ 190.2 $ 166.4 14% Family Brands 23.2 18.8 23% Music and Other 14.1 33.5 -58% Total $ 227.5 $ 218.7 23 (1) Net Revenues by Brand Portfolio March 27, 2022 March 28, 2021 % Change Quarter Ended Total Company Results As Reported Adjustments Adjusted As Reported Adju stments Adjusted % Change Franchise Brands (i)Partner Brands $ 543.1206.5 $ 523.1188.0 4%10% External Net Revenues (1) $ 1,163.1 $ - $ 1,163.1 $ 1,114.8 $ - $ 1,114.8 4% Hasbro Gaming (ii) 143.6 136.3 5% Operating Profit 120.0 21.8 141.8 147.3 26.8 174.1 -19% Emerging Brands (i) 76.4 73.1 5% Operating Margin 10.3% 1.9% 12.2% 13.2% 2.4% 15.6% TV/Film/Entertainment 193.5 194.3 0% EBITDA 174.0 18.1 192.1 235.3 16.7 252.0 -24% Total $ 1,163.1 $ 1,114.8 March 27, 2022 March 28, 2021 % Change $ 192.2 $ 175.3 70.6 66.9 10%6% $ 262.8 $ 242.2 Quarter Ended (3) Wizards of the Coast and Digital Gaming Net Revenues by CategoryTabletop GamingDigital and Licensed Gaming Total
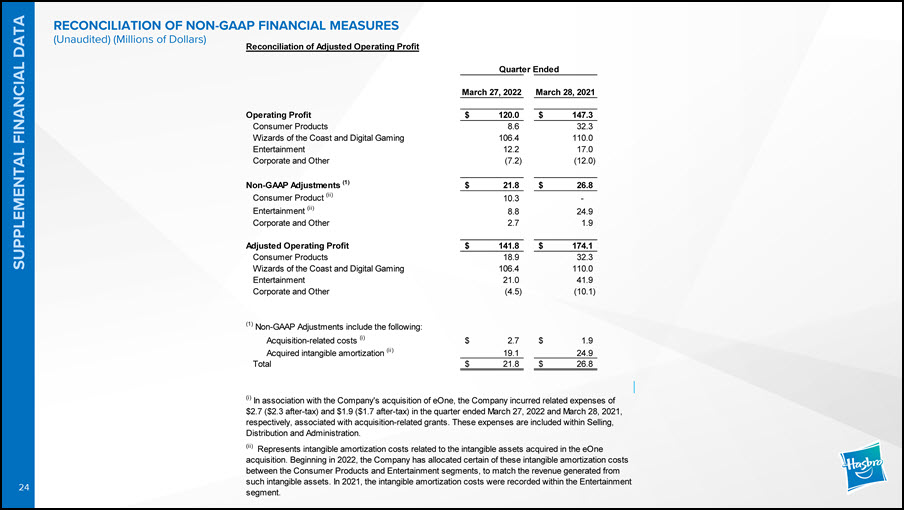
SUPPLEMENTAL FINANCIAL DATA RECONCILIATION OF NON-GAAP FINANCIAL MEASURES(Unaudited) (Millions of Dollars) 24 (1) Non-GAAP Adjustments include the following: Acquisition-related costs (i)Acquired intangible amortization (ii)Total $ 2.7 19.1 $ 21.8 $ 1.9 24.9 $ 26.8 (i) In association with the Company's acquisition of eOne, the Company incurred related expenses of$2.7 ($2.3 after-tax) and $1.9 ($1.7 after-tax) in the quarter ended March 27, 2022 and March 28, 2021, respectively, associated with acquisition-related grants. These expenses are included within Selling, Distribution and Administration.(ii) Represents intangible amortization costs related to the intangible assets acquired in the eOne acquisition. Beginning in 2022, the Company has allocated certain of these intangible amortization costs between the Consumer Products and Entertainment segments, to match the revenue generated from such intangible assets. In 2021, the intangible amortization costs were recorded within the Entertainment segment. Reconciliation of Adjusted Operating Profit Quarter Ended March 27, 2022 March 28, 2021 Operating Profit $ 120.0 $ 147.3 Consumer Products 8.6 32.3 Wizards of the Coast and Digital Gaming 106.4 110.0 Entertainment 12.2 17.0 Corporate and Other (7.2) (12.0) Non-GAAP Adjustments (1) $ 21.8 $ 26.8 Consumer Product (ii) 10.3 - Entertainment (ii) 8.8 24.9 Corporate and Other 2.7 1.9 Adjusted Operating Profit $ 141.8 $ 174.1 Consumer Products 18.9 32.3 Wizards of the Coast and Digital Gaming 106.4 110.0 Entertainment 21.0 41.9 Corporate and Other (4.5) (10.1)
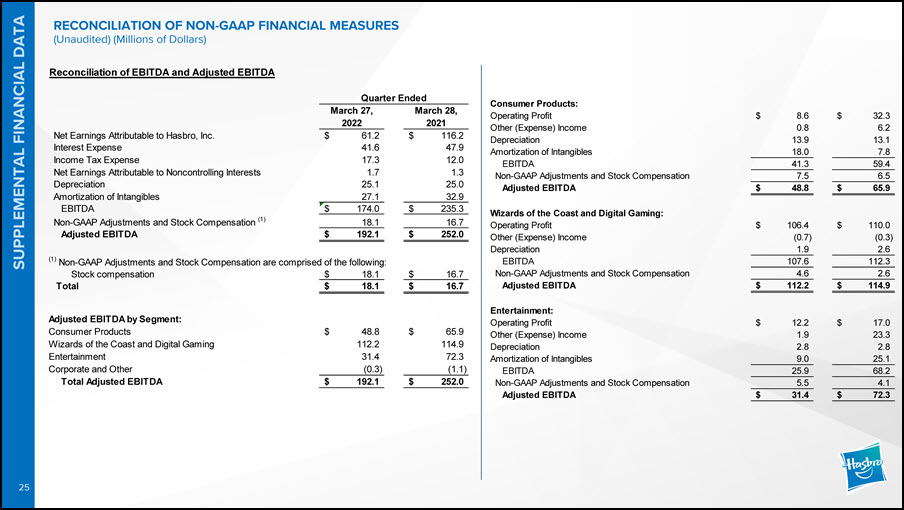
SUPPLEMENTAL FINANCIAL DATA March 27, 2022 March 28, 2021 Net Earnings Attributable to Hasbro, Inc. $ 61.2 $ 116.2 Interest Expense 41.6 47.9 Income Tax Expense 17.3 12.0 Net Earnings Attributable to Noncontrolling Interests 1.7 1.3 Depreciation 25.1 25.0 27.1 Amortization of Intangibles EBITDANon-GAAP Adjustments and Stock Compensation (1)Adjusted EBITDA $ 174.0 18.1 $ 192.1 32.9 $ 235.3 16.7 $ 252.0 (1) Non-GAAP Adjustments and Stock Compensation are comprised of the following: Stock compensationTotal $ 18.1 $ 18.1 $ 16.7 $ 16.7 Adjusted EBITDA by Segment: Consumer Products $ 48.8 $ 65.9 Wizards of the Coast and Digital Gaming 112.2 114.9 Entertainment 31.4 72.3 Corporate and OtherTotal Adjusted EBITDA (0.3) $ 192.1 (1.1)$ 252.0 RECONCILIATION OF NON-GAAP FINANCIAL MEASURES(Unaudited) (Millions of Dollars)Reconciliation of EBITDA and Adjusted EBITDA Quarter Ended Consumer Products: Operating Profit $ 8.6 $ 32.3 Other (Expense) Income 0.8 6.2 Depreciation 13.9 13.1 Amortization of Intangibles 18.0 7.8 EBITDA 41.3 59.4 Non-GAAP Adjustments and Stock Compensation 7.5 6.5 Non-GAAP Adjustments and Stock CompensationAdjusted EBITDA 4.6 $ 112.2 2.6 $ 114.9 Entertainment: Operating Profit $ 12.2 $ 17.0 Other (Expense) Income 1.9 23.3 Depreciation 2.8 2.8 9.0 25.9 5.5 Amortization of Intangibles EBITDANon-GAAP Adjustments and Stock CompensationAdjusted EBITDA $ 31.4 25.1 68.2 4.1$ 72.3 Adjusted EBITDA $ 48.8 $ 65.9 Wizards of the Coast and Digital Gaming:Operating Profit $ 106.4 $ 110.0 Other (Expense) Income (0.7) (0.3) Depreciation 1.9 2.6 EBITDA 107.6 112.3 26
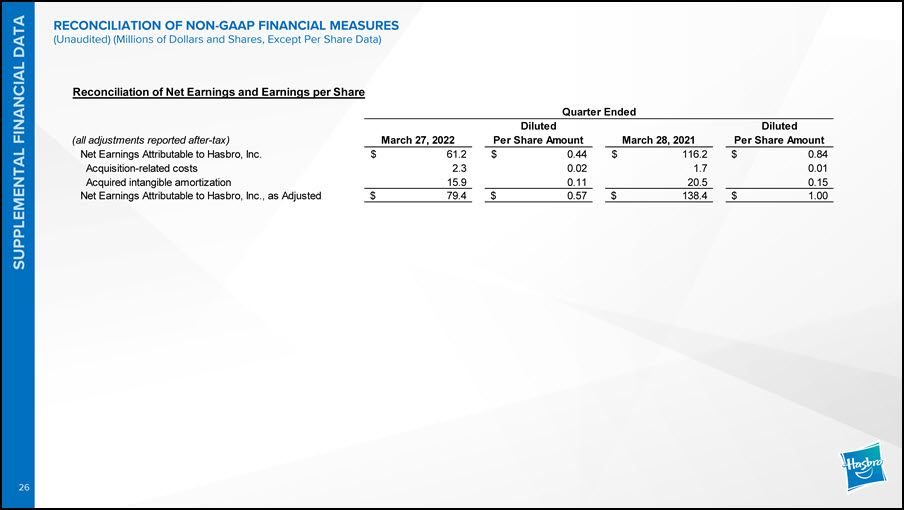
SUPPLEMENTAL FINANCIAL DATA RECONCILIATION OF NON-GAAP FINANCIAL MEASURES(Unaudited) (Millions of Dollars and Shares, Except Per Share Data) (all adjustments reported after-tax) March 27, 2022 Diluted Per Share Amount Quarter EndedDiluted Per Share Amount March 28, 2021 Reconciliation of Net Earnings and Earnings per Share Net Earnings Attributable to Hasbro, Inc. $ 61.2 $ 0.44 $ 116.2 $ 0.84 Acquisition-related costs 2.3 0.02 1.7 0.01 Acquired intangible amortization 15.9 0.11 20.5 0.15 Net Earnings Attributable to Hasbro, Inc., as Adjusted $ 79.4 $ 0.57 $ 138.4 $ 1.00 26
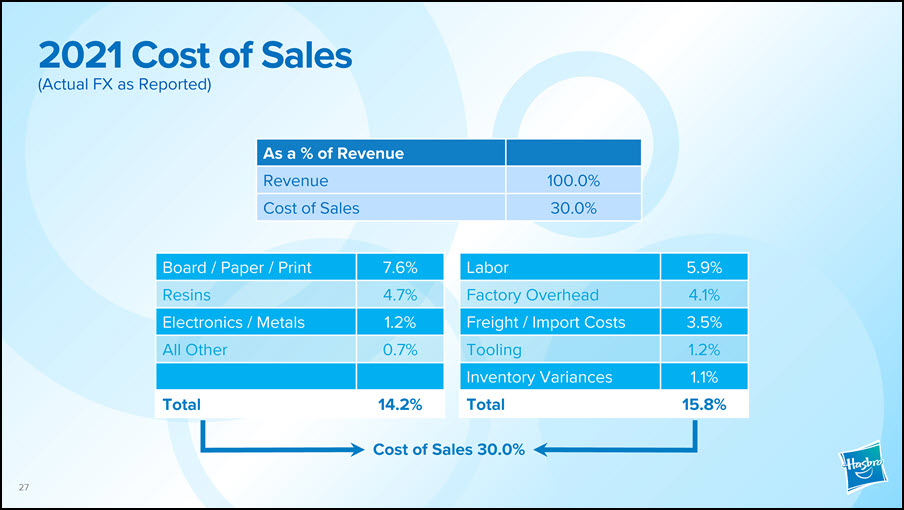
2021 Cost of Sales(Actual FX as Reported) Cost of Sales 30.0% As a % of Revenue Revenue 100.0% Cost of Sales 30.0% Board / Paper / Print 7.6% Resins 4.7% Electronics / Metals 1.2% All Other 0.7% Total 14.2% Labor 5.9% Factory Overhead 4.1% Freight / Import Costs 3.5% Tooling 1.2% Inventory Variances 1.1% Total 15.8% 26
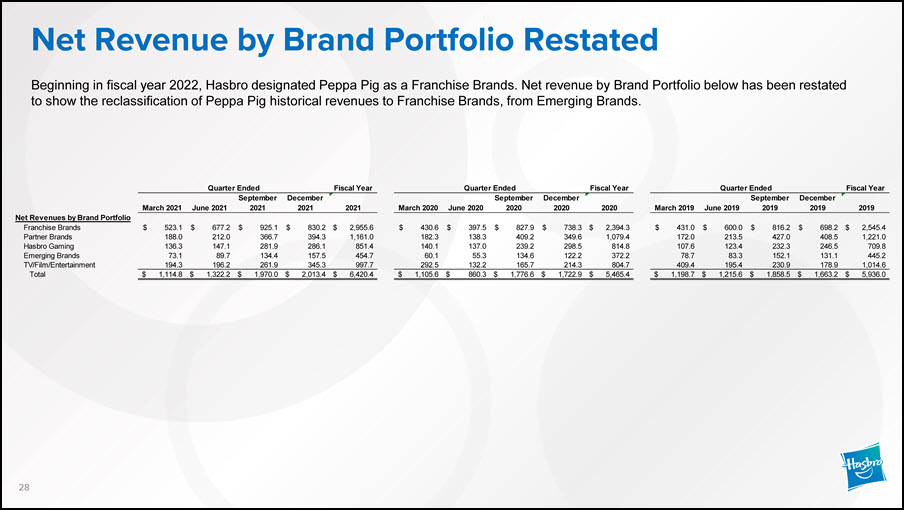
Net Revenue by Brand Portfolio Restated September December March 2021 June 2021 2021 2021 2021 September December March 2020 June 2020 2020 2020 2020 September December March 2019 June 2019 2019 2019 2019 Net Revenues by Brand Portfolio Franchise Brands $ 523.1 $ 677.2 $ 925.1 $ 830.2 $ 2,955.6 $ 430.6 $ 397.5 $ 827.9 $ 738.3 $ 2,394.3 $ 431.0 $ 600.0 $ 816.2 $ 698.2 $ 2,545.4 Partner Brands 188.0 212.0 366.7 394.3 1,161.0 182.3 138.3 409.2 349.6 1,079.4 172.0 213.5 427.0 408.5 1,221.0 Hasbro Gaming 136.3 147.1 281.9 286.1 851.4 140.1 137.0 239.2 298.5 814.8 107.6 123.4 232.3 246.5 709.8 Emerging Brands 73.1 89.7 134.4 157.5 454.7 60.1 55.3 134.6 122.2 372.2 78.7 83.3 152.1 131.1 445.2 TV/Film/Entertainment 194.3 196.2 261.9 345.3 997.7 292.5 132.2 165.7 214.3 804.7 409.4 195.4 230.9 178.9 1,014.6 Total $ 1,114.8 $ 1,322.2 $ 1,970.0 $ 2,013.4 $ 6,420.4 $ 1,105.6 $ 860.3 $ 1,776.6 $ 1,722.9 $ 5,465.4 $ 1,198.7 $ 1,215.6 $ 1,858.5 $ 1,663.2 $ 5,936.0 Quarter Ended Fiscal Year Quarter Ended Fiscal Year Quarter Ended Fiscal Year Beginning in fiscal year 2022, Hasbro designated Peppa Pig as a Franchise Brands. Net revenue by Brand Portfolio below has been restated to show the reclassification of Peppa Pig historical revenues to Franchise Brands, from Emerging Brands. 26
Additional Information and Where to Find It 26 Hasbro has filed with the SEC a preliminary proxy statement on Schedule 14A, containing a form of WHITE proxy card, with respect to its solicitation of proxies for Hasbro’s 2022 Annual Meeting of Shareholders (the “2022 Annual Meeting”). The proxy statement is in preliminary form and Hasbro intends to file and mail a definitive proxy statement to stockholders of Hasbro. This communication is not a substitute for any proxy statement or other document that Hasbro has filed or may file with the SEC in connection with any solicitation by Hasbro. INVESTORS AND SECURITY HOLDERS ARE URGED TO READ THE PROXY STATEMENT (INCLUDING ANY AMENDMENTS OR SUPPLEMENTS THERETO) FILED BY HASBRO AND ANY OTHER RELEVANT DOCUMENTS FILED WITH THE SEC CAREFULLY AND IN THEIR ENTIRETY BECAUSE THEY CONTAIN OR WILL CONTAIN IMPORTANT INFORMATION ABOUT ANYSOLICITATION. Investors and security holders may obtain copies of these documents and otherdocuments filed with the SEC by Hasbro free of charge through the website maintained by the SEC at www.sec.gov. Copies of the documents filed by Hasbro are also available free of charge by accessing Hasbro’s website at www.hasbro.com.
Participants 26 This communication is neither a solicitation of a proxy or consent nor a substitute for any proxy statement or other filings that may be made with the SEC. Nonetheless, Hasbro, its directors and executive officers and other members of management and employees may be deemed to be participants in the solicitation of proxies with respect to a solicitation by Hasbro. Information about Hasbro’s executive officers and directors is available in Hasbro’s preliminary proxy statement for the 2022 Annual Meeting, which was filed with the SEC on April 4, 2022, and will be included in Hasbro’s definitive proxy statement, once available. To the extent holdings of Hasbro securities reported in the proxy statement for the 2022 Annual Meeting have changed, such changes have been or will be reflected on Statements of Change in Ownership on Forms 3, 4 or 5 filed with the SEC. These documents are or will be available free of charge at the SEC’s website at www.sec.gov.