Bank of Hawai‘i Corporation�second quarter 2024 �financial report July 22, 2024 Exhibit 99.2
this presentation, and other statements made by the Company in connection with it, may contain forward-looking statements concerning, among other things, forecasts of our financial results and condition, expectations for our operations and business prospects, and our assumptions used in those forecasts and expectations. we have not committed to update forward-looking statements to reflect later events or circumstances disclosure 2 forward-looking statements
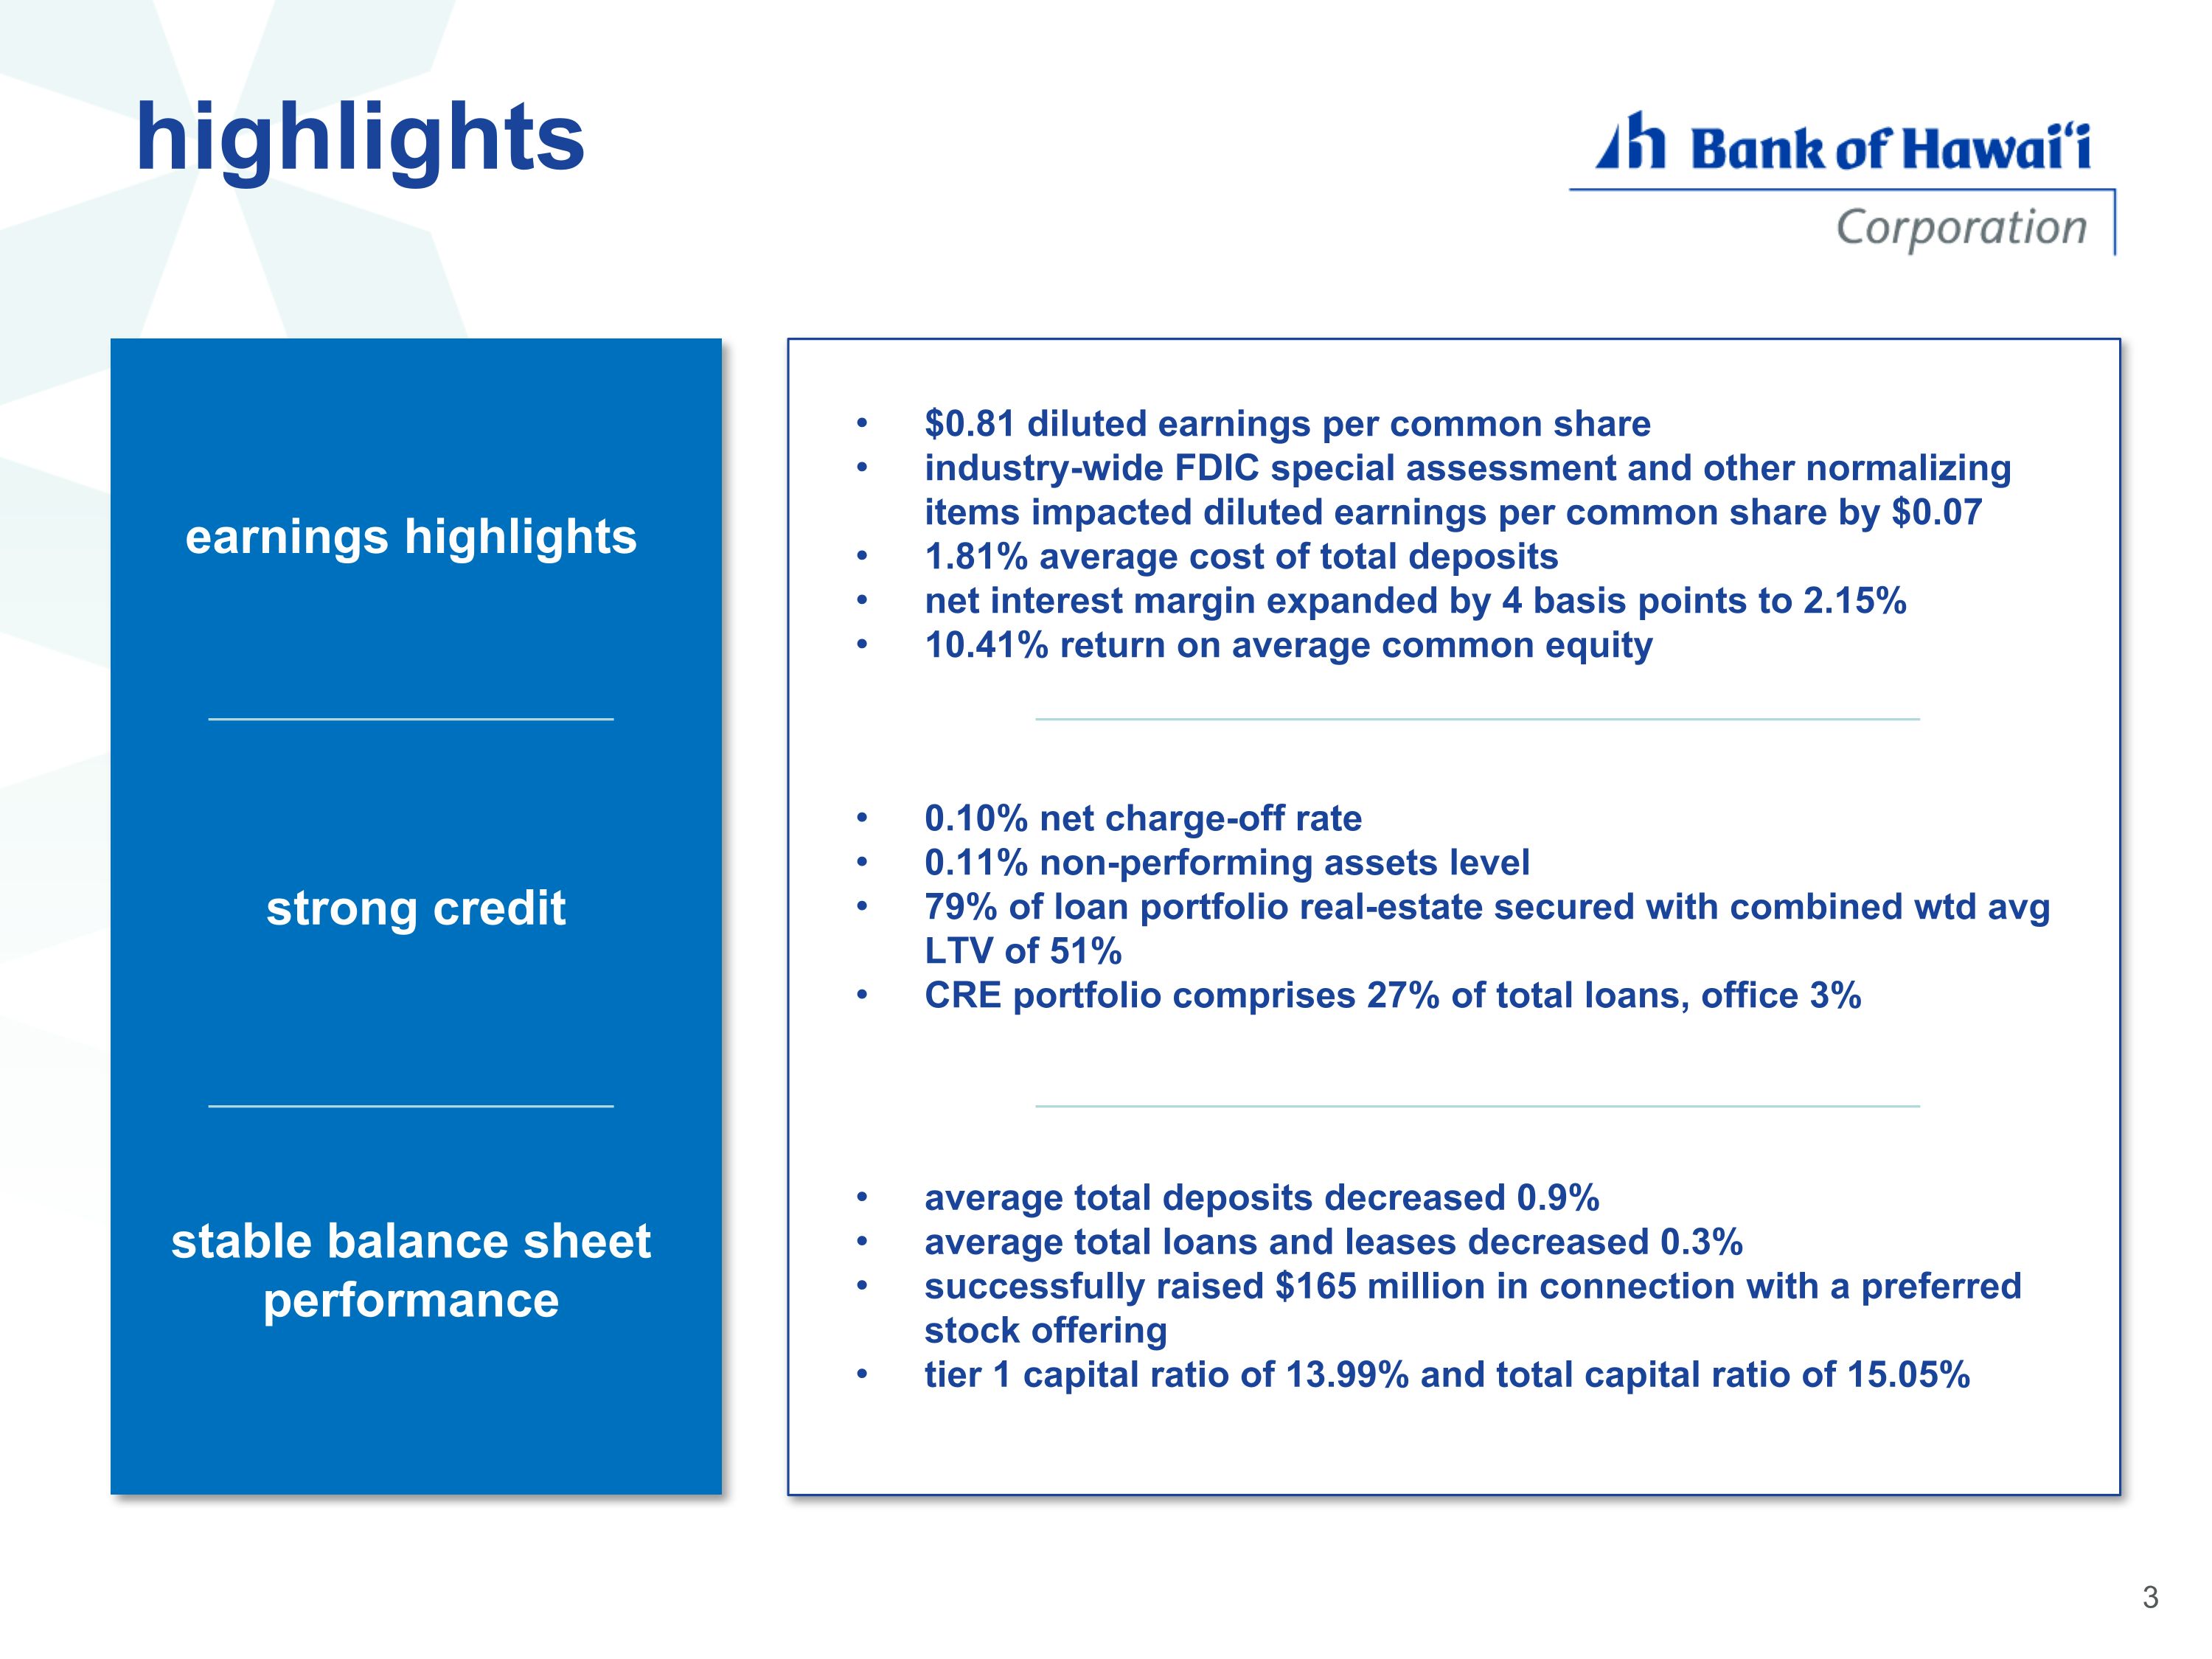
diversified, lower risk loan assets highlights broad & deep market penetration stable balance sheet performance earnings highlights strong credit average total deposits decreased 0.9% average total loans and leases decreased 0.3% successfully raised $165 million in connection with a preferred stock offering tier 1 capital ratio of 13.99% and total capital ratio of 15.05% $0.81 diluted earnings per common share industry-wide FDIC special assessment and other normalizing items impacted diluted earnings per common share by $0.07 1.81% average cost of total deposits net interest margin expanded by 4 basis points to 2.15% 10.41% return on average common equity 0.10% net charge-off rate 0.11% non-performing assets level 79% of loan portfolio real-estate secured with combined wtd avg LTV of 51% CRE portfolio comprises 27% of total loans, office 3%
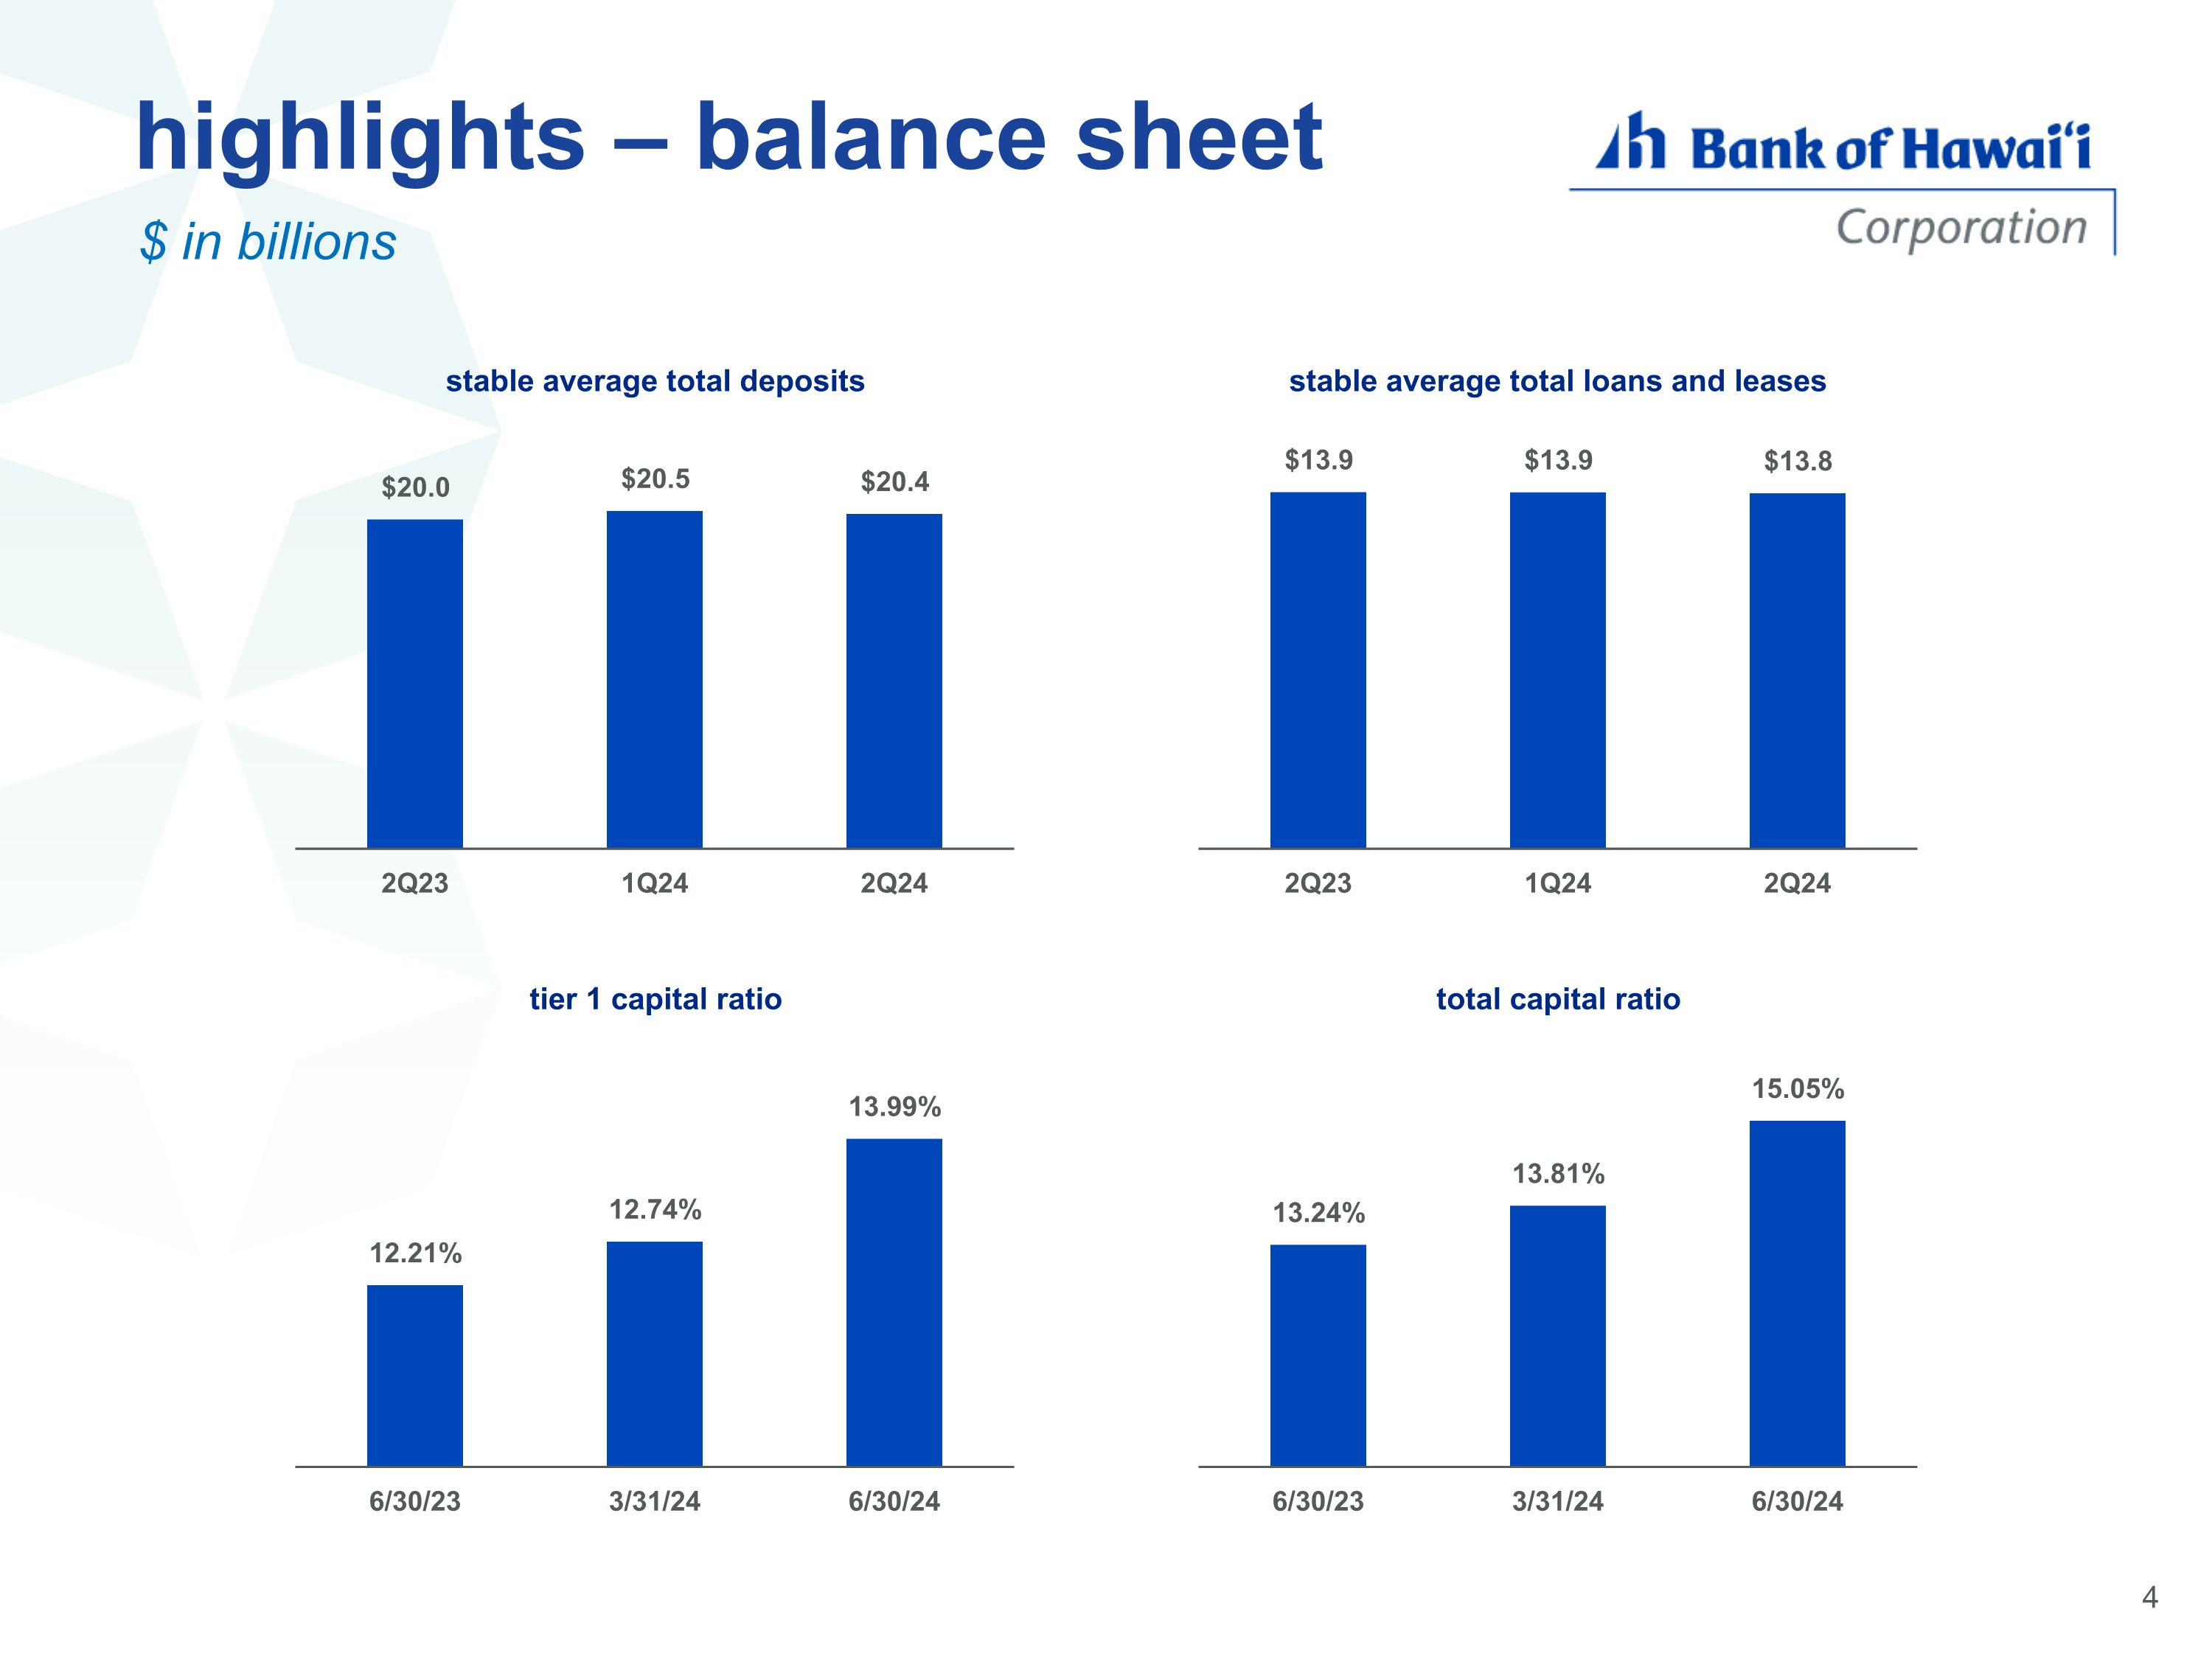
highlights – balance sheet $ in billions
our deposits through our 127 year history in the islands, Bank of Hawai‘i has developed an exceptionally seasoned deposit base, built one relationship at a time, over many years, and in neighborhoods and communities we understand unique marketplace diversified long tenured ✔ ✔ ✔
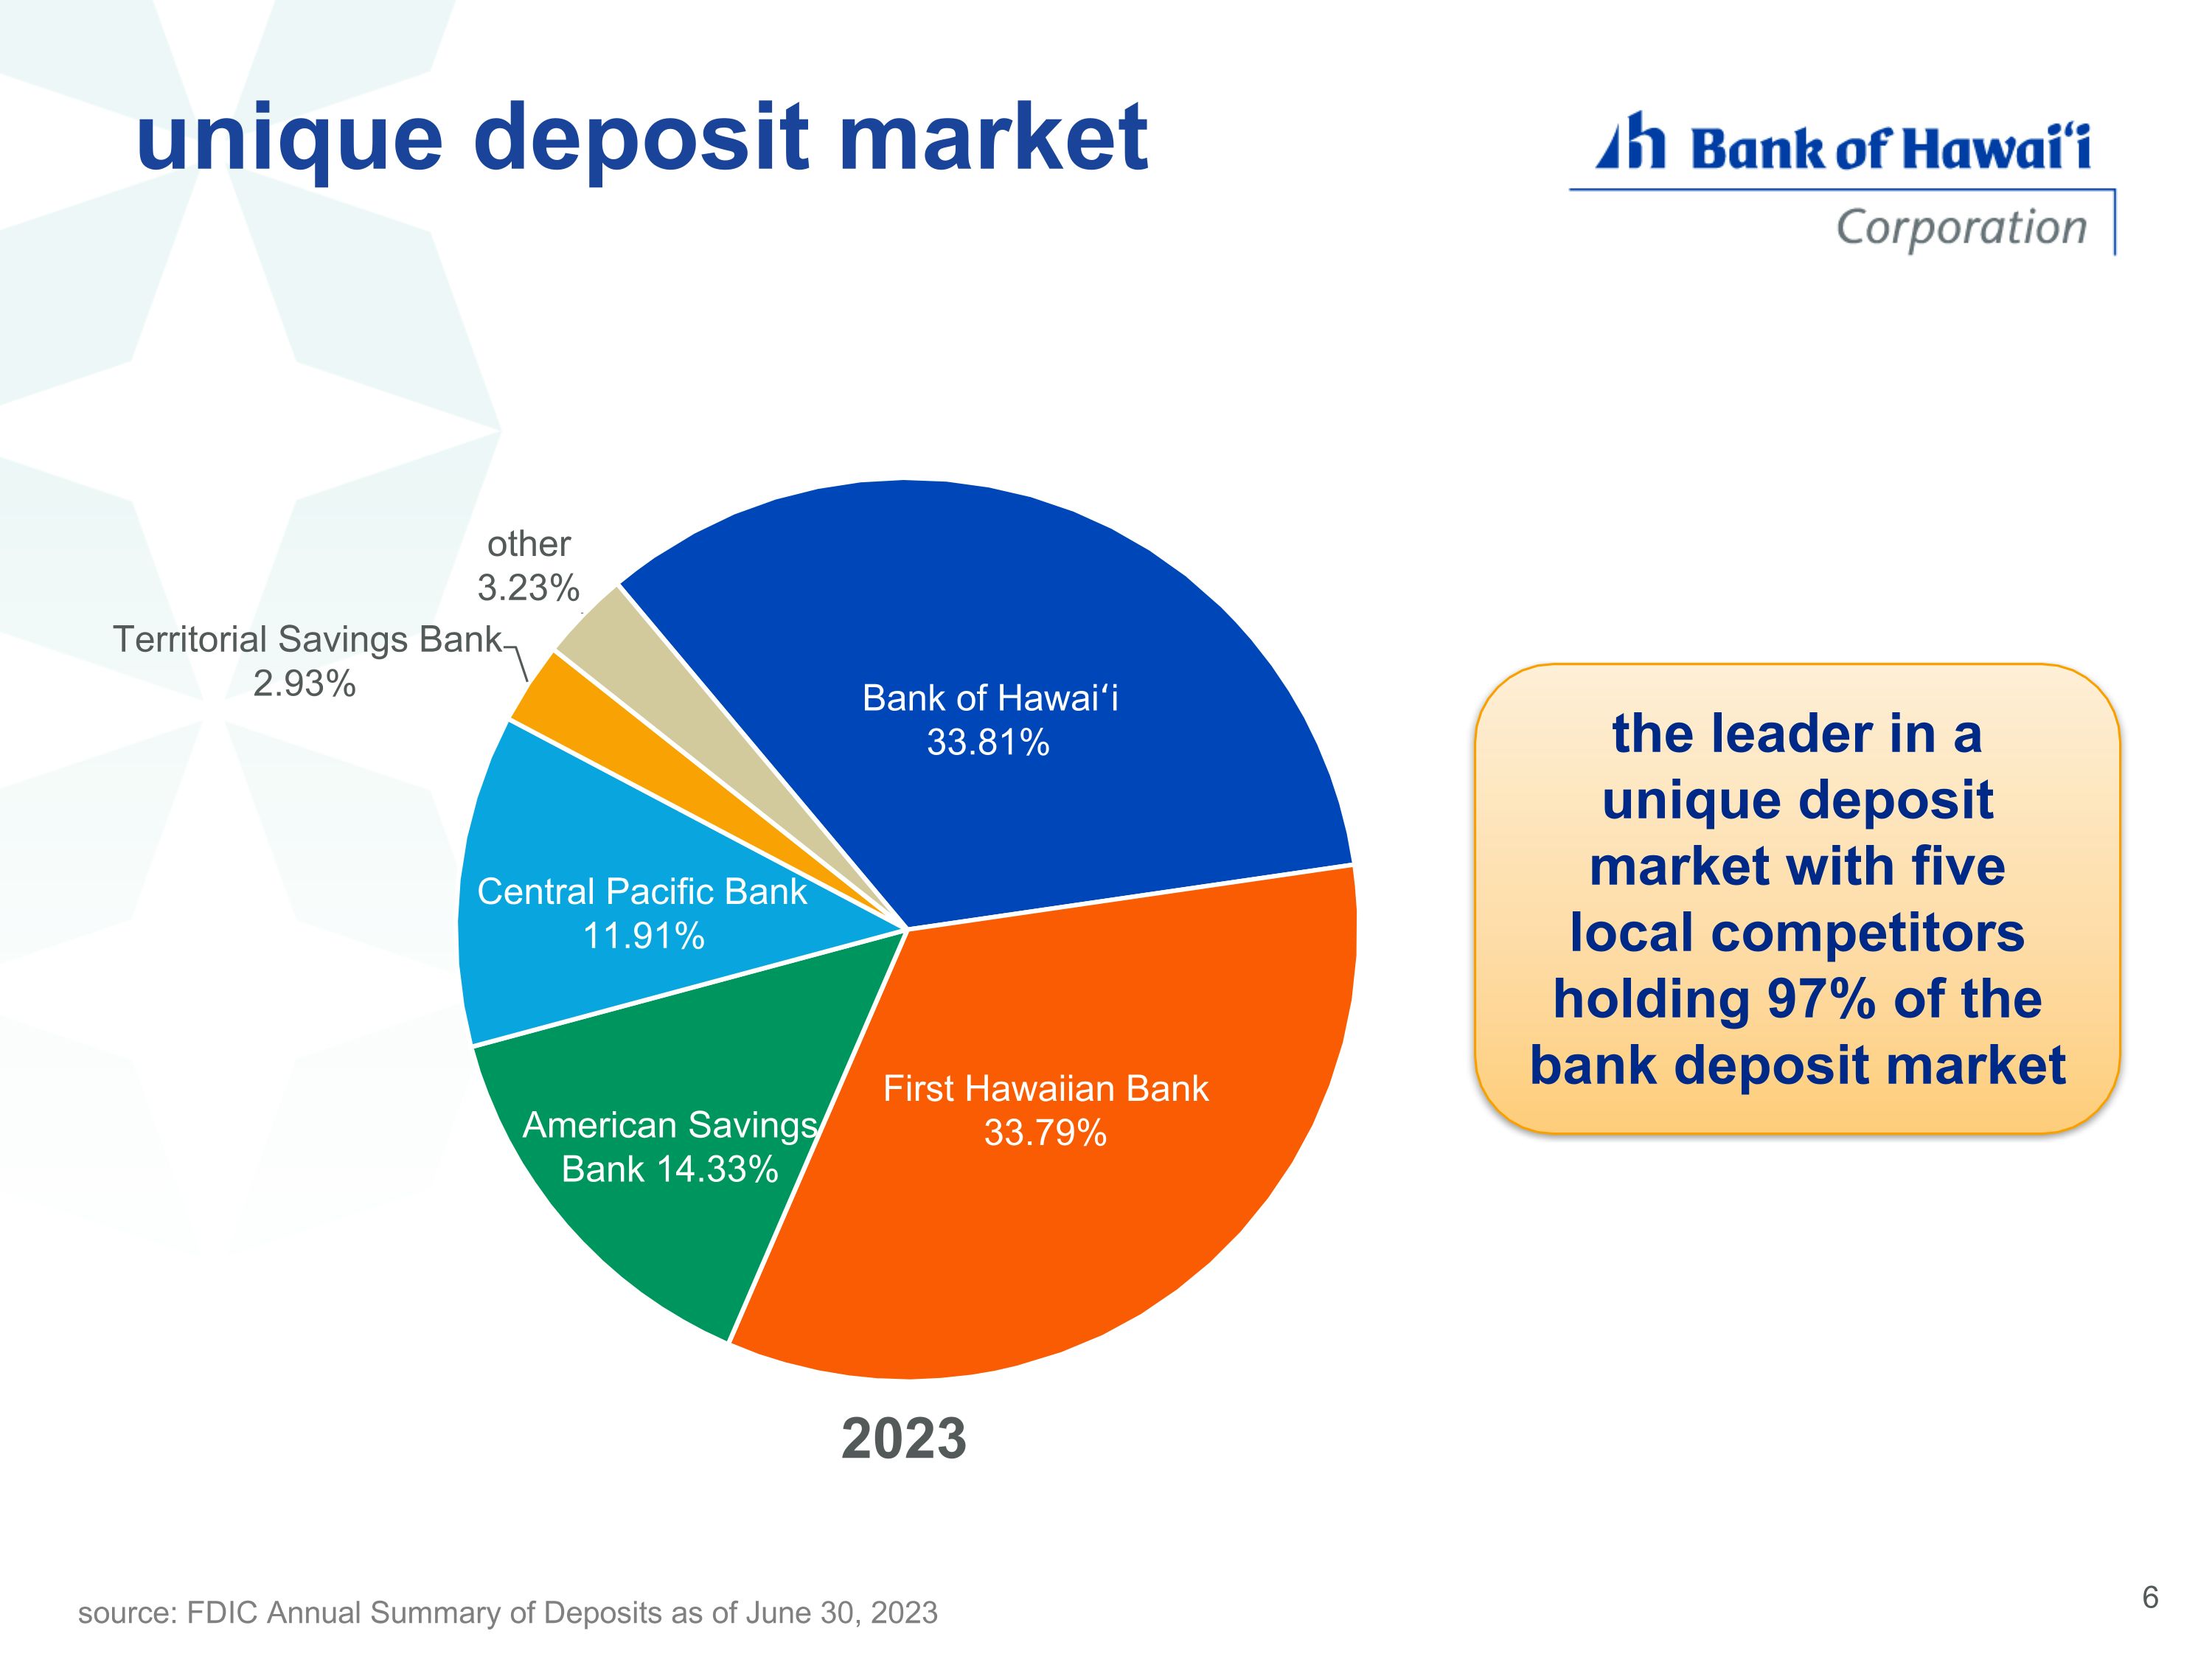
unique deposit market source: FDIC Annual Summary of Deposits as of June 30, 2023 the leader in a unique deposit market with five local competitors holding 97% of the bank deposit market
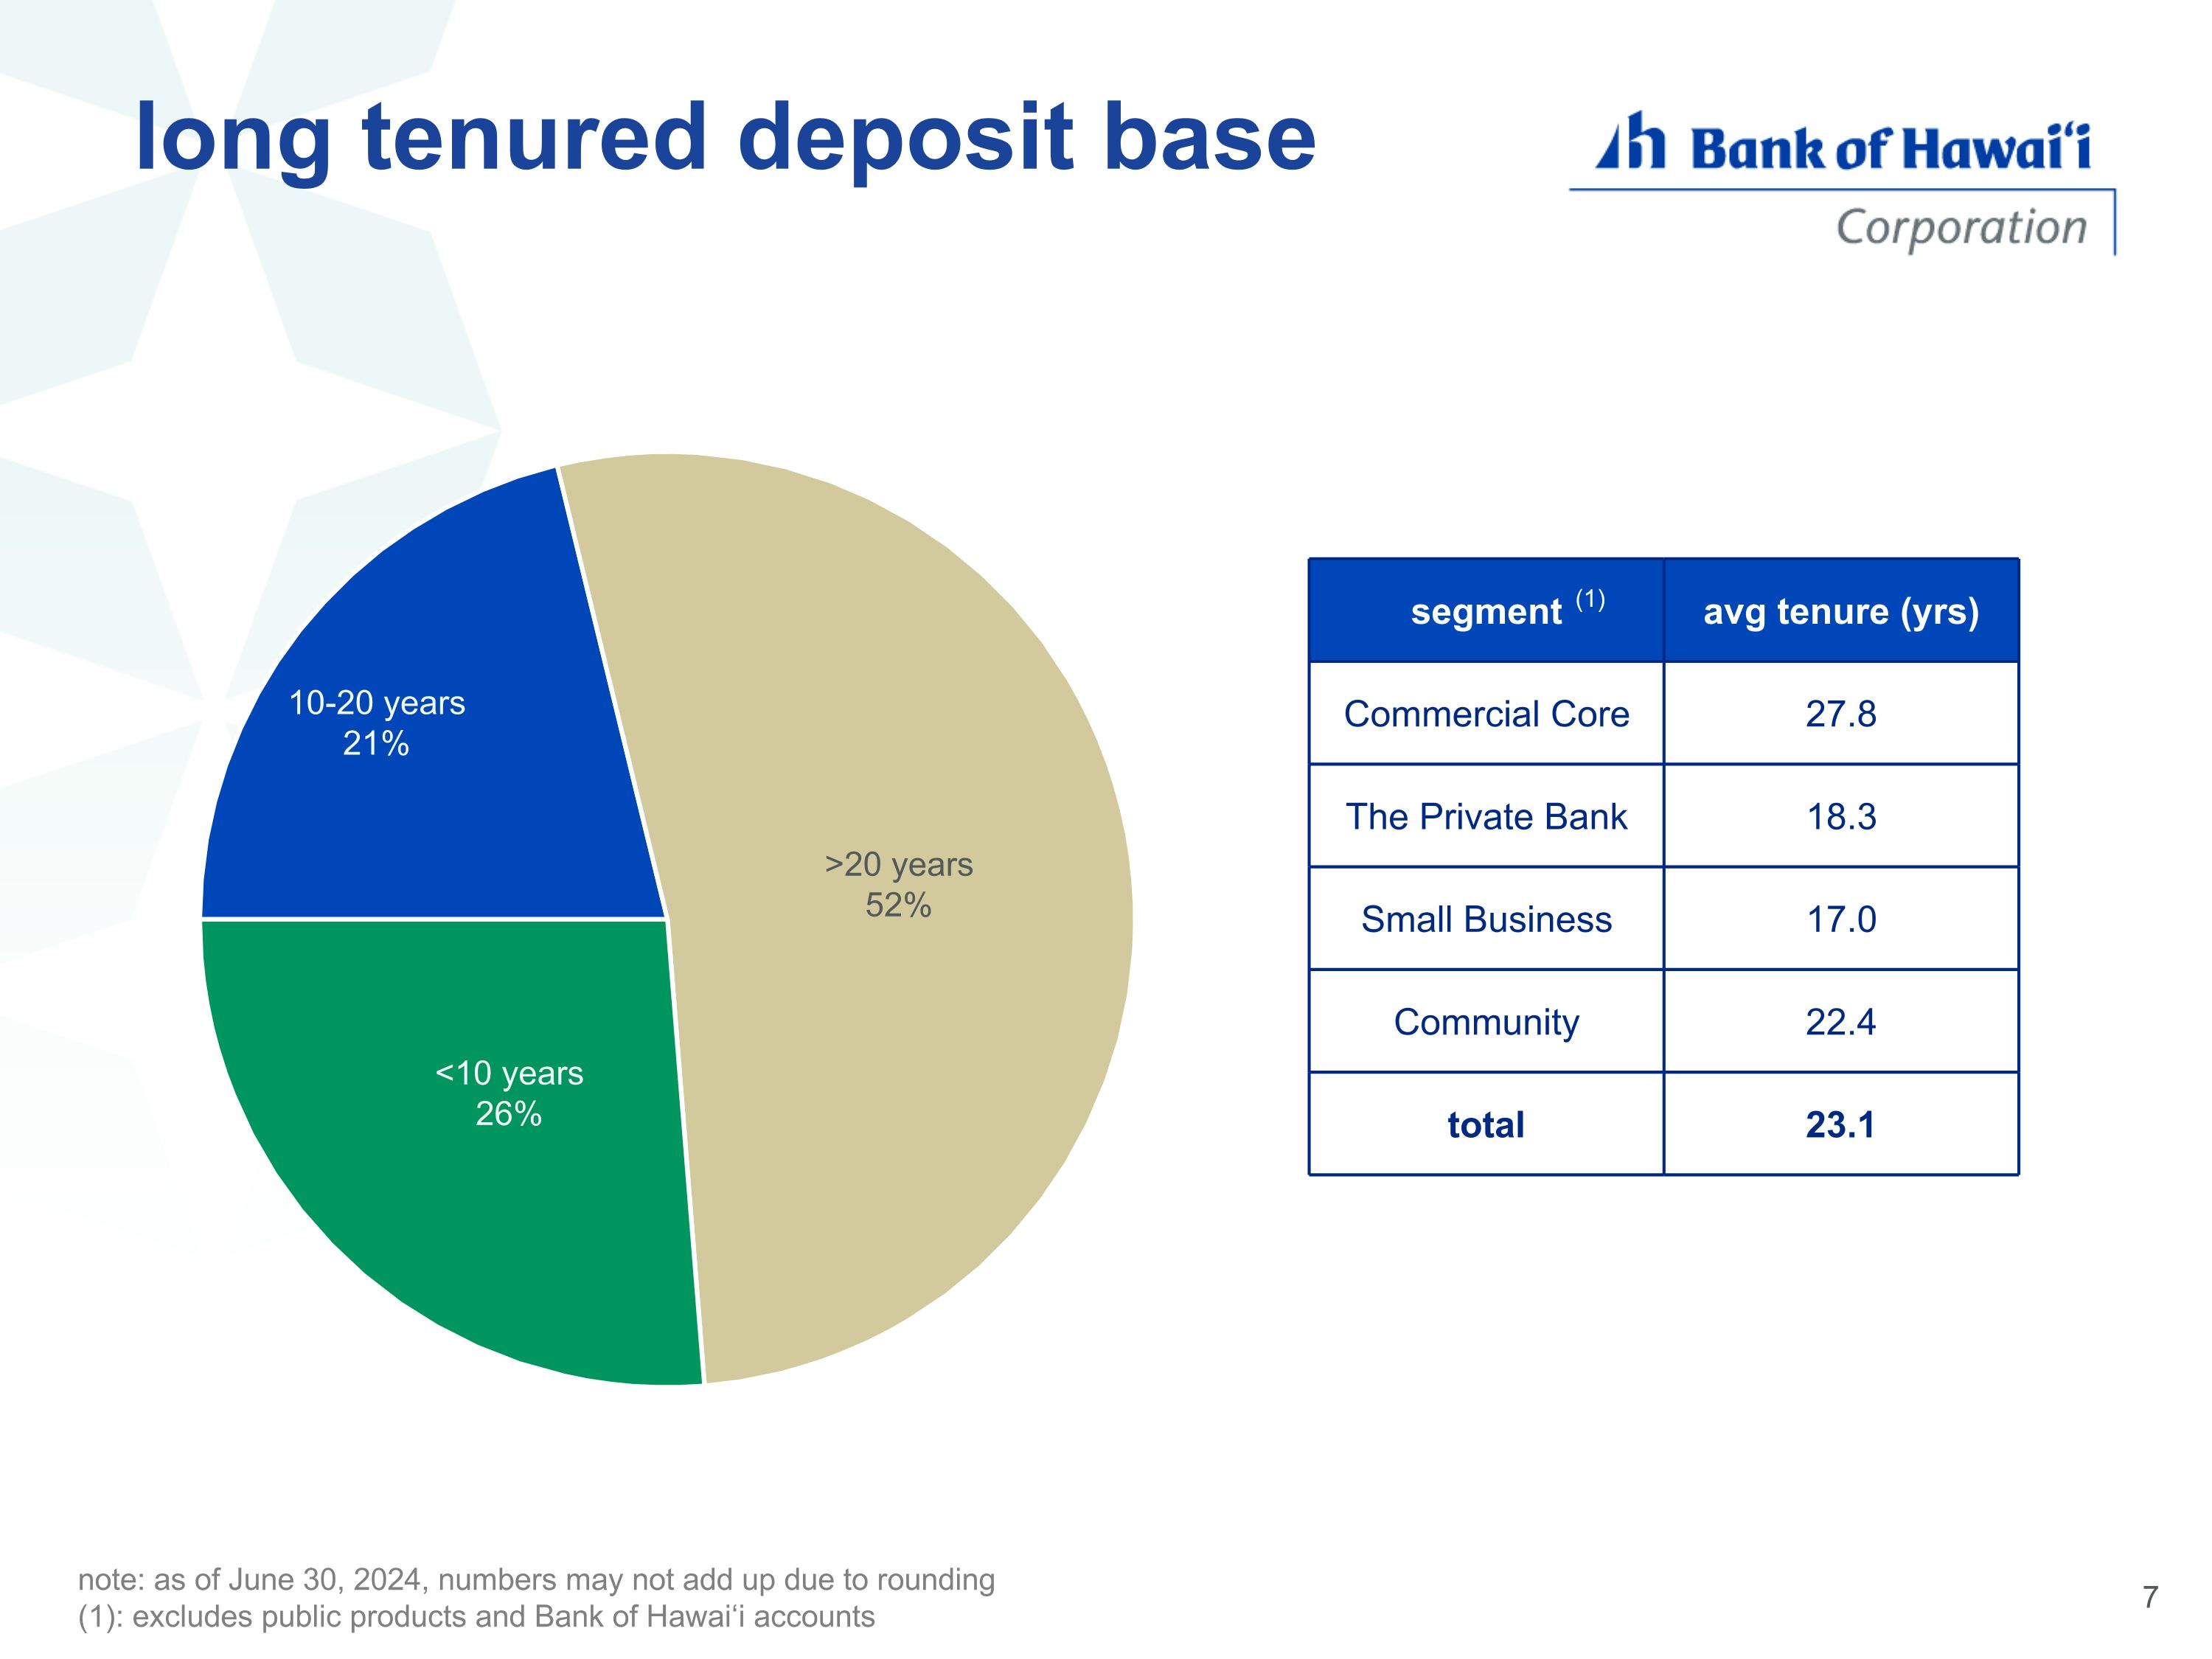
long tenured deposit base note: as of June 30, 2024, numbers may not add up due to rounding (1): excludes public products and Bank of Hawai‘i accounts segment avg tenure (yrs) Commercial Core 27.8 The Private Bank 18.3 Small Business 17.0 Community 22.4 total 23.1 (1)
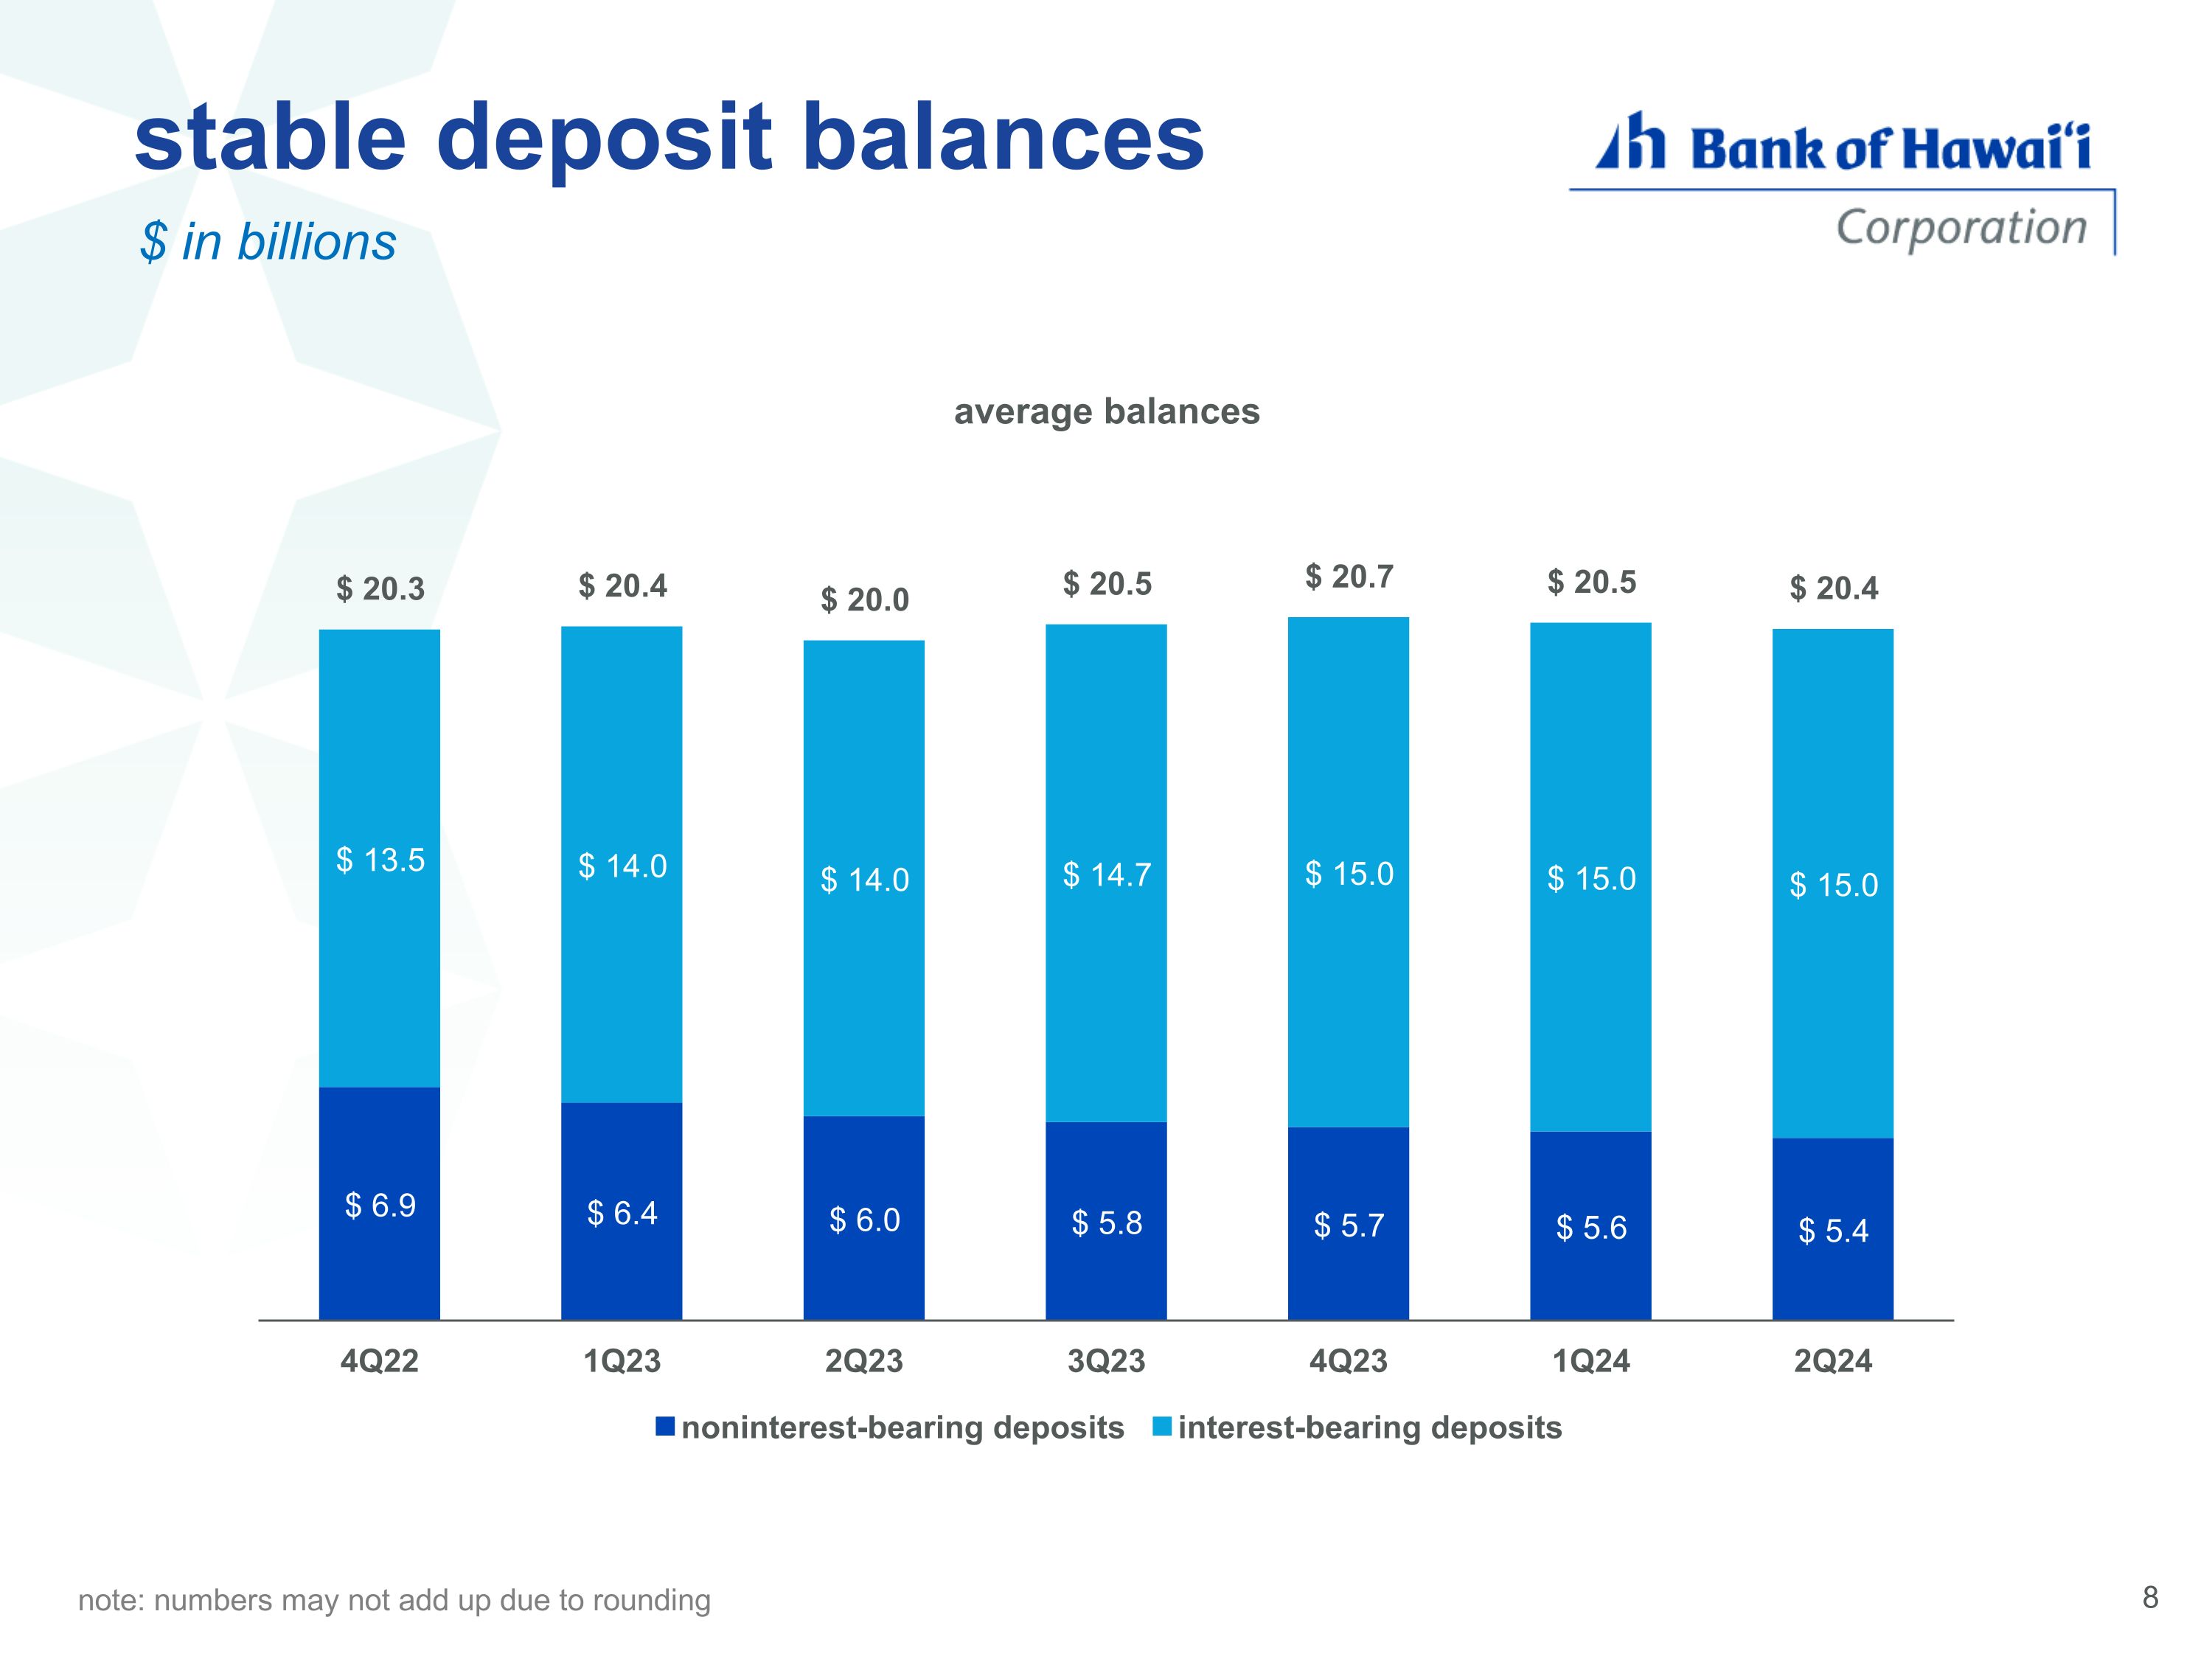
stable deposit balances $ in billions note: numbers may not add up due to rounding
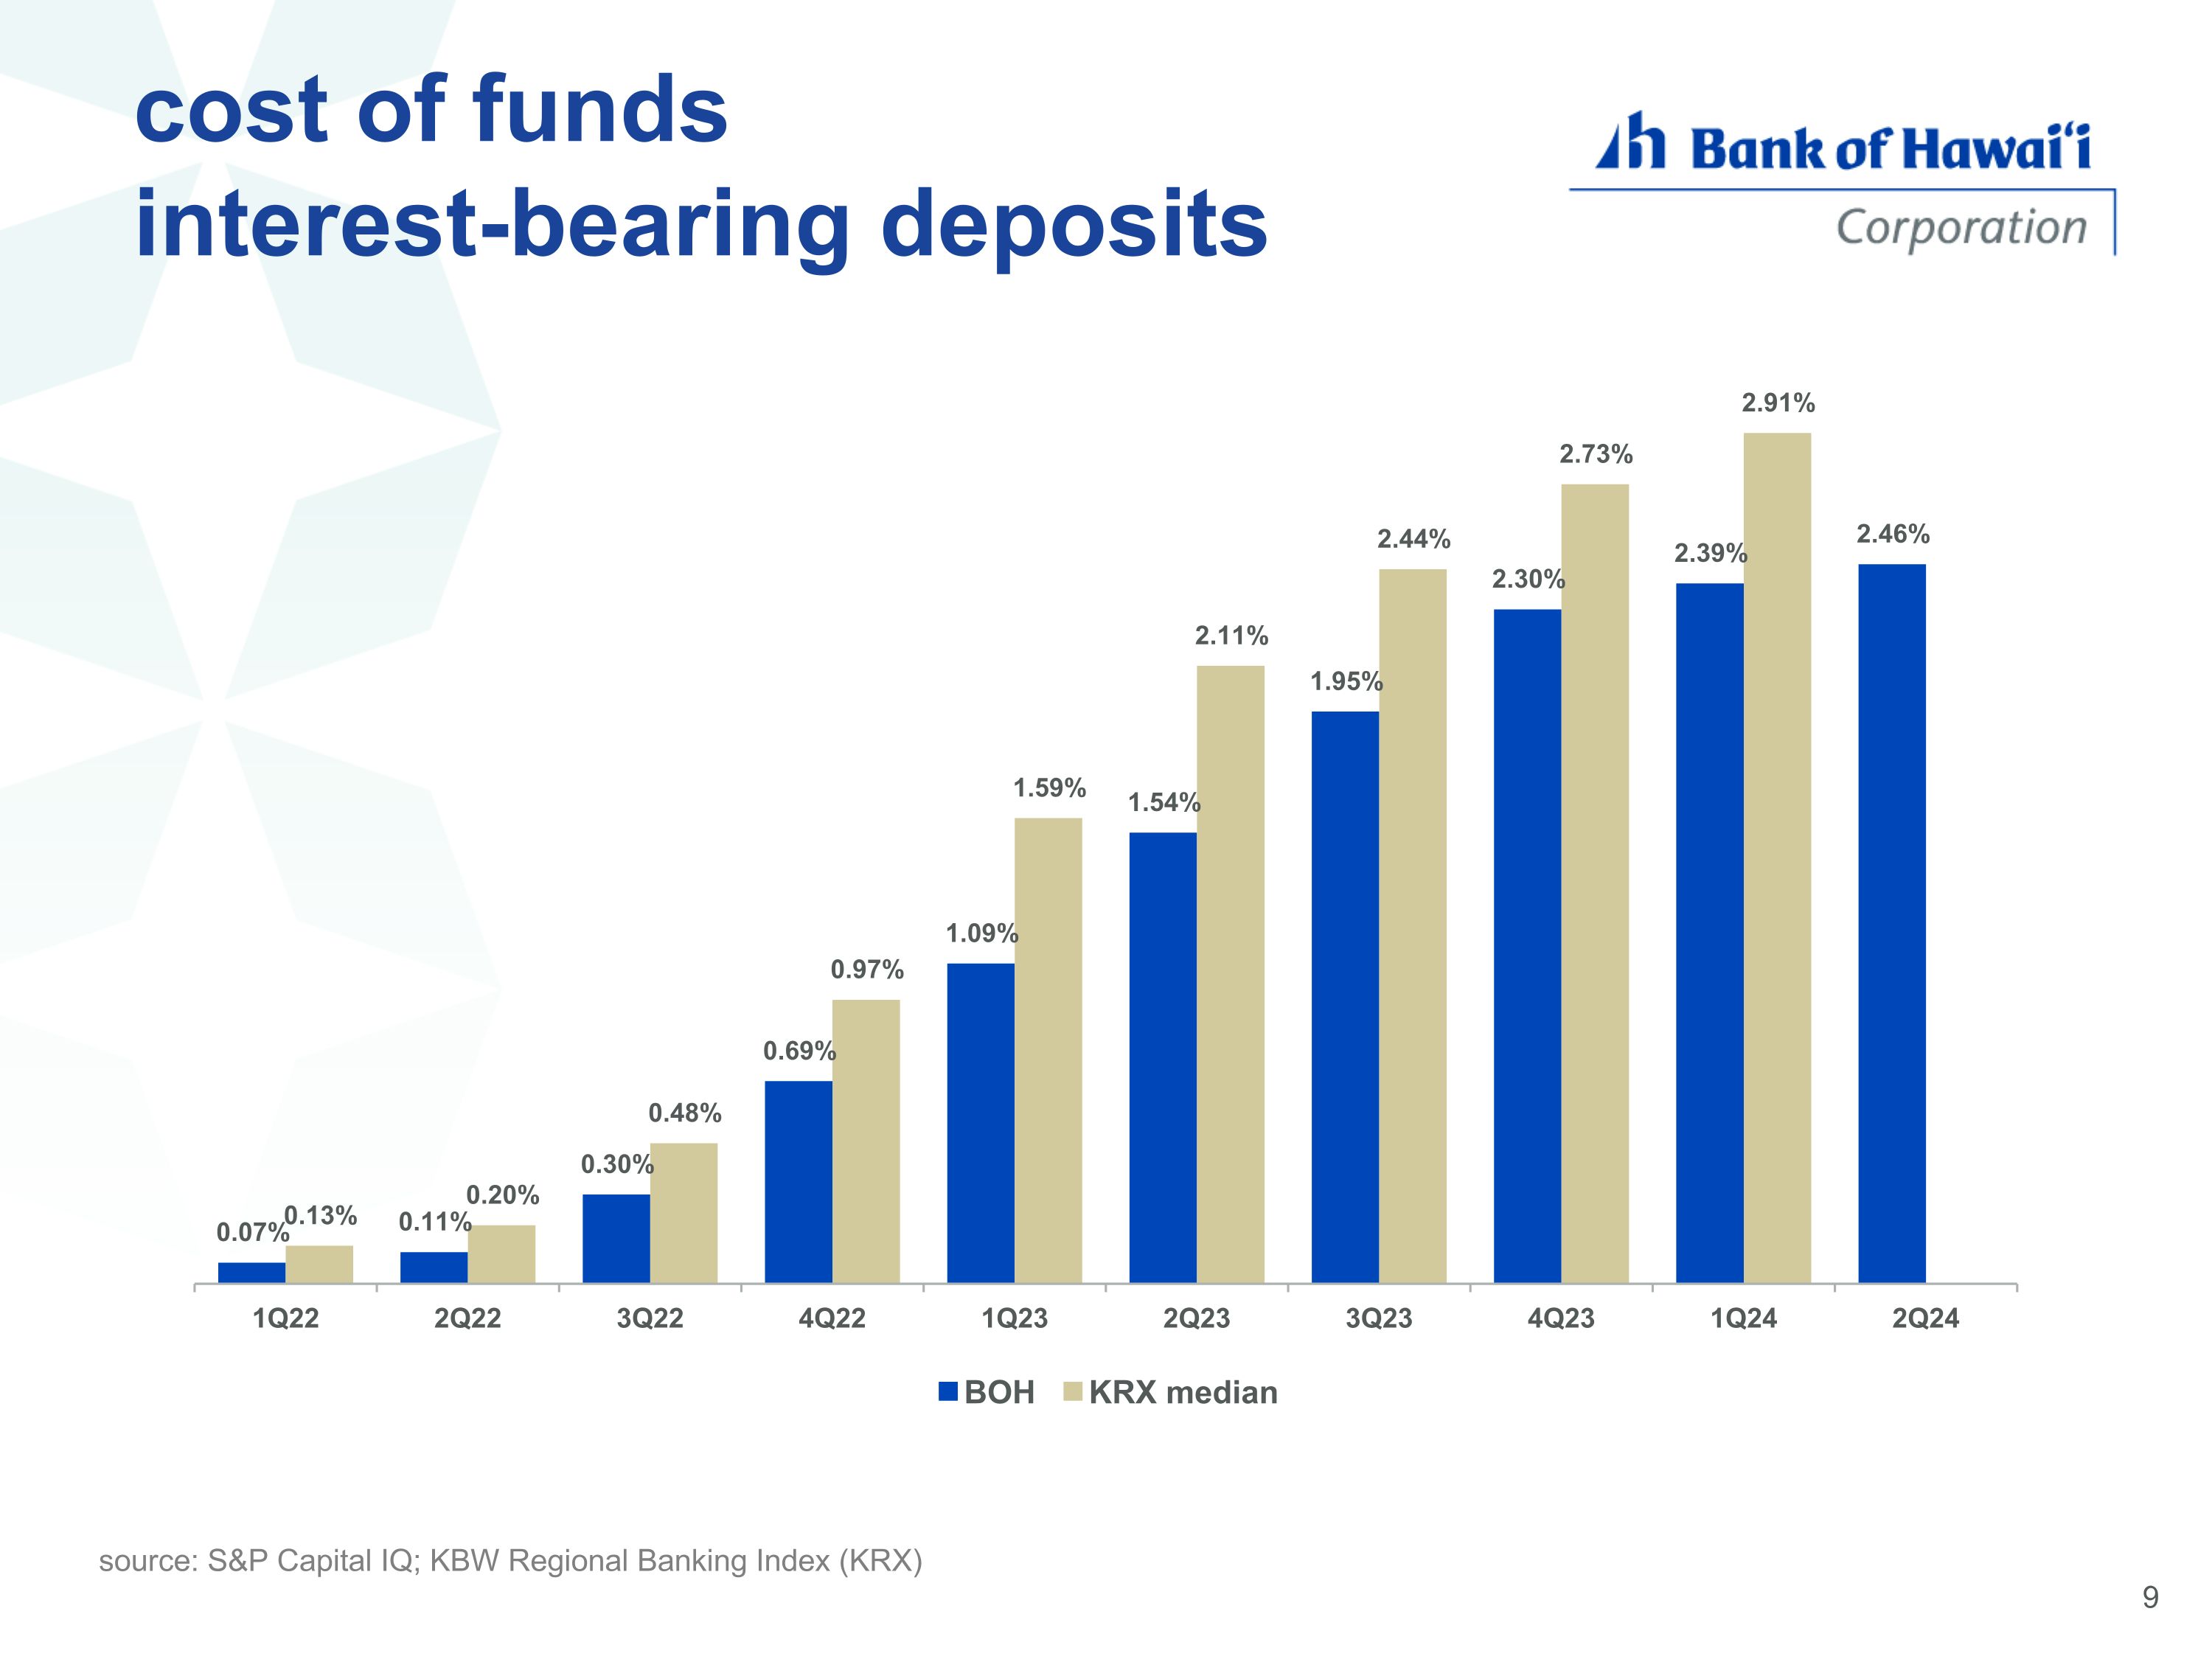
cost of funds�interest-bearing deposits source: S&P Capital IQ; KBW Regional Banking Index (KRX)
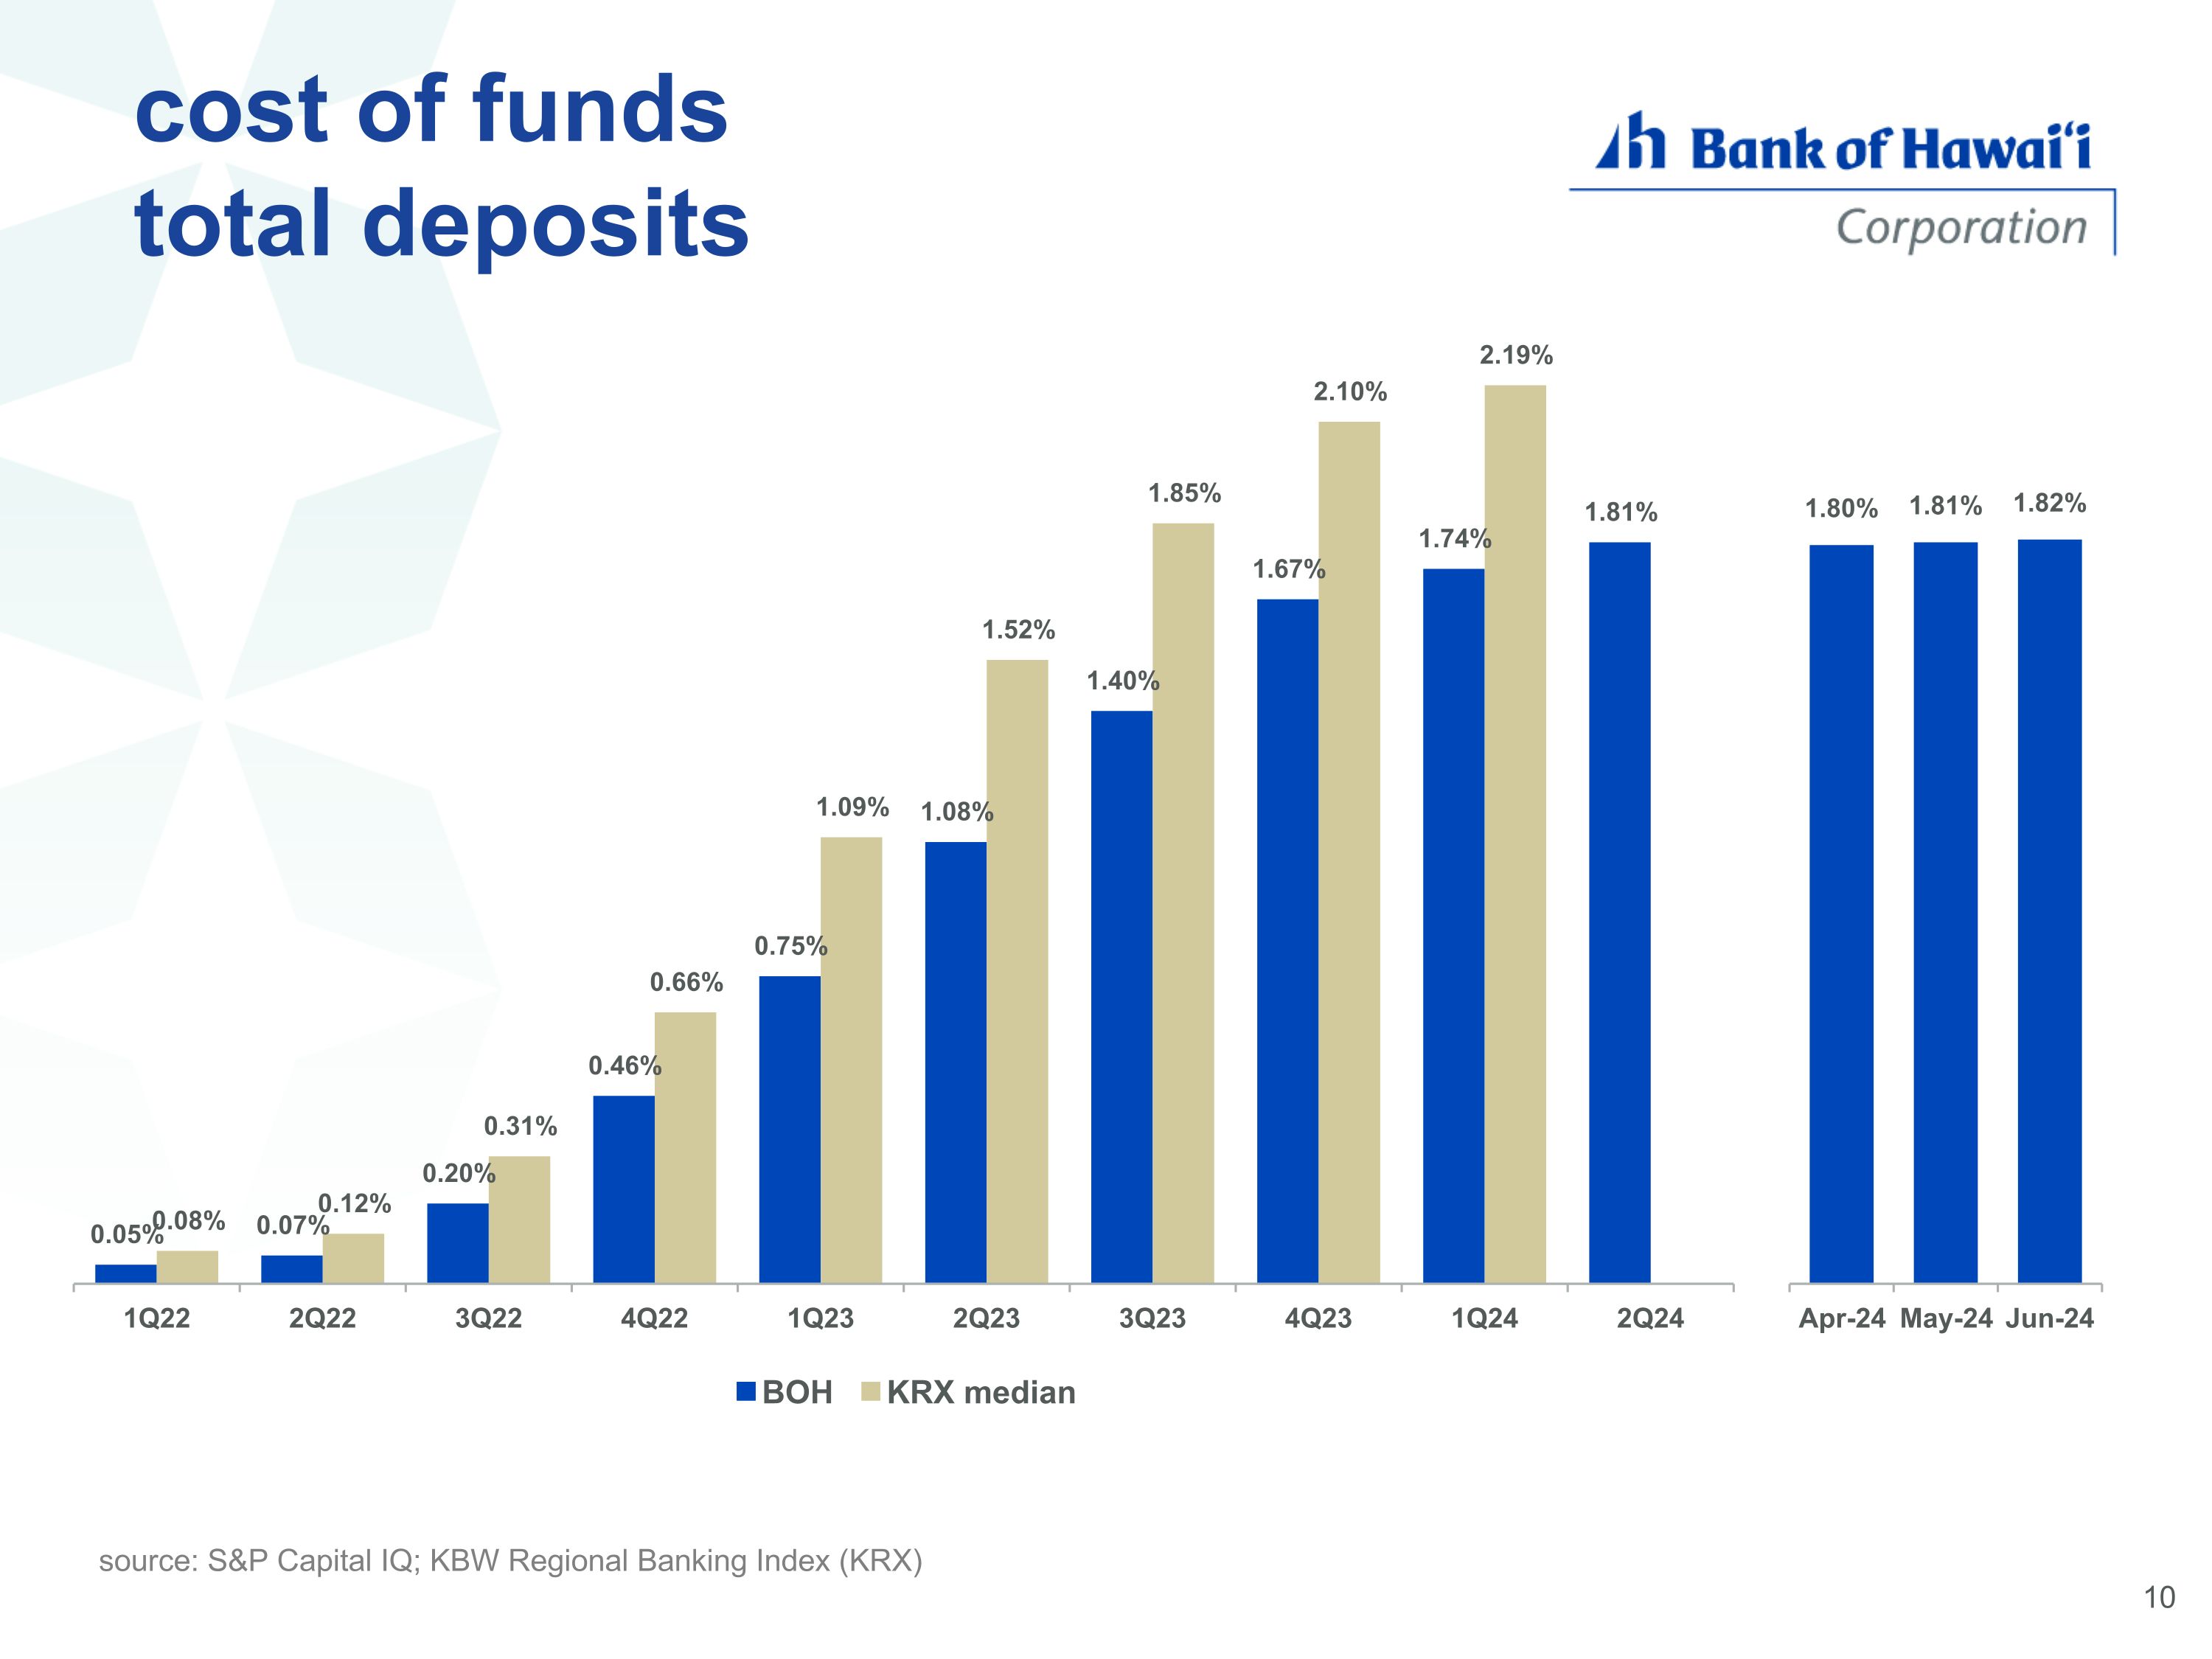
cost of funds�total deposits source: S&P Capital IQ; KBW Regional Banking Index (KRX)
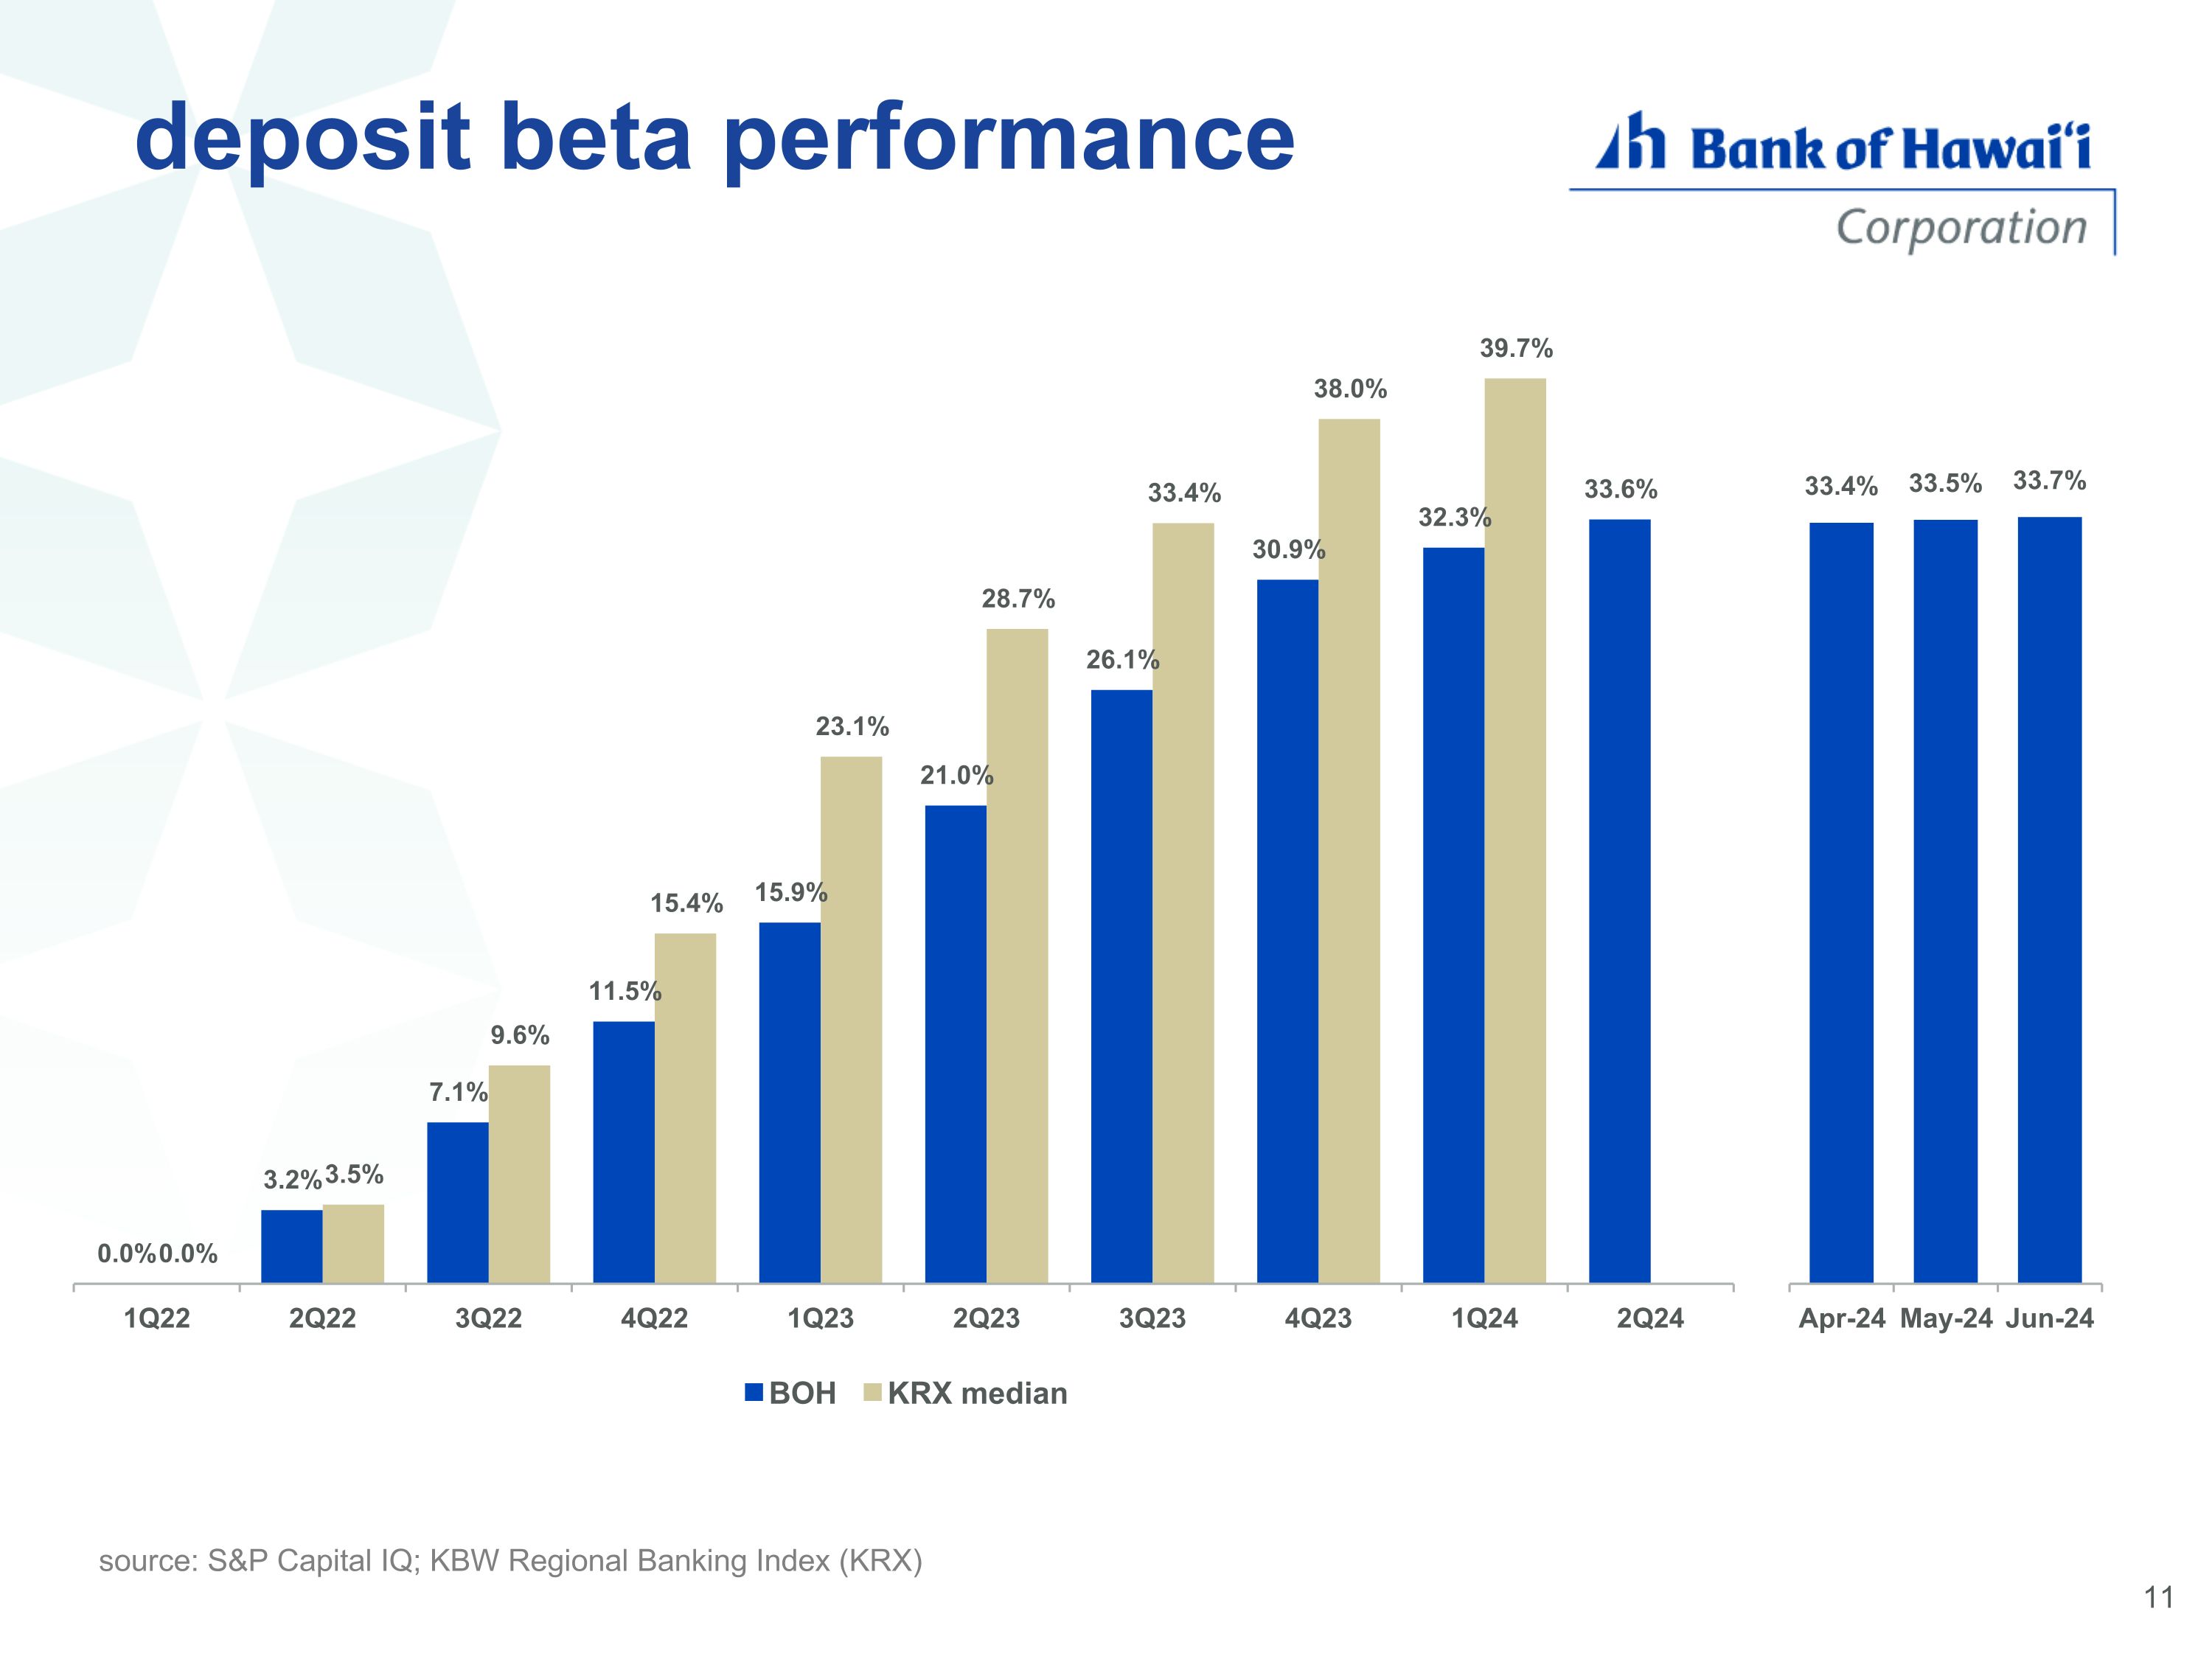
deposit beta performance source: S&P Capital IQ; KBW Regional Banking Index (KRX)
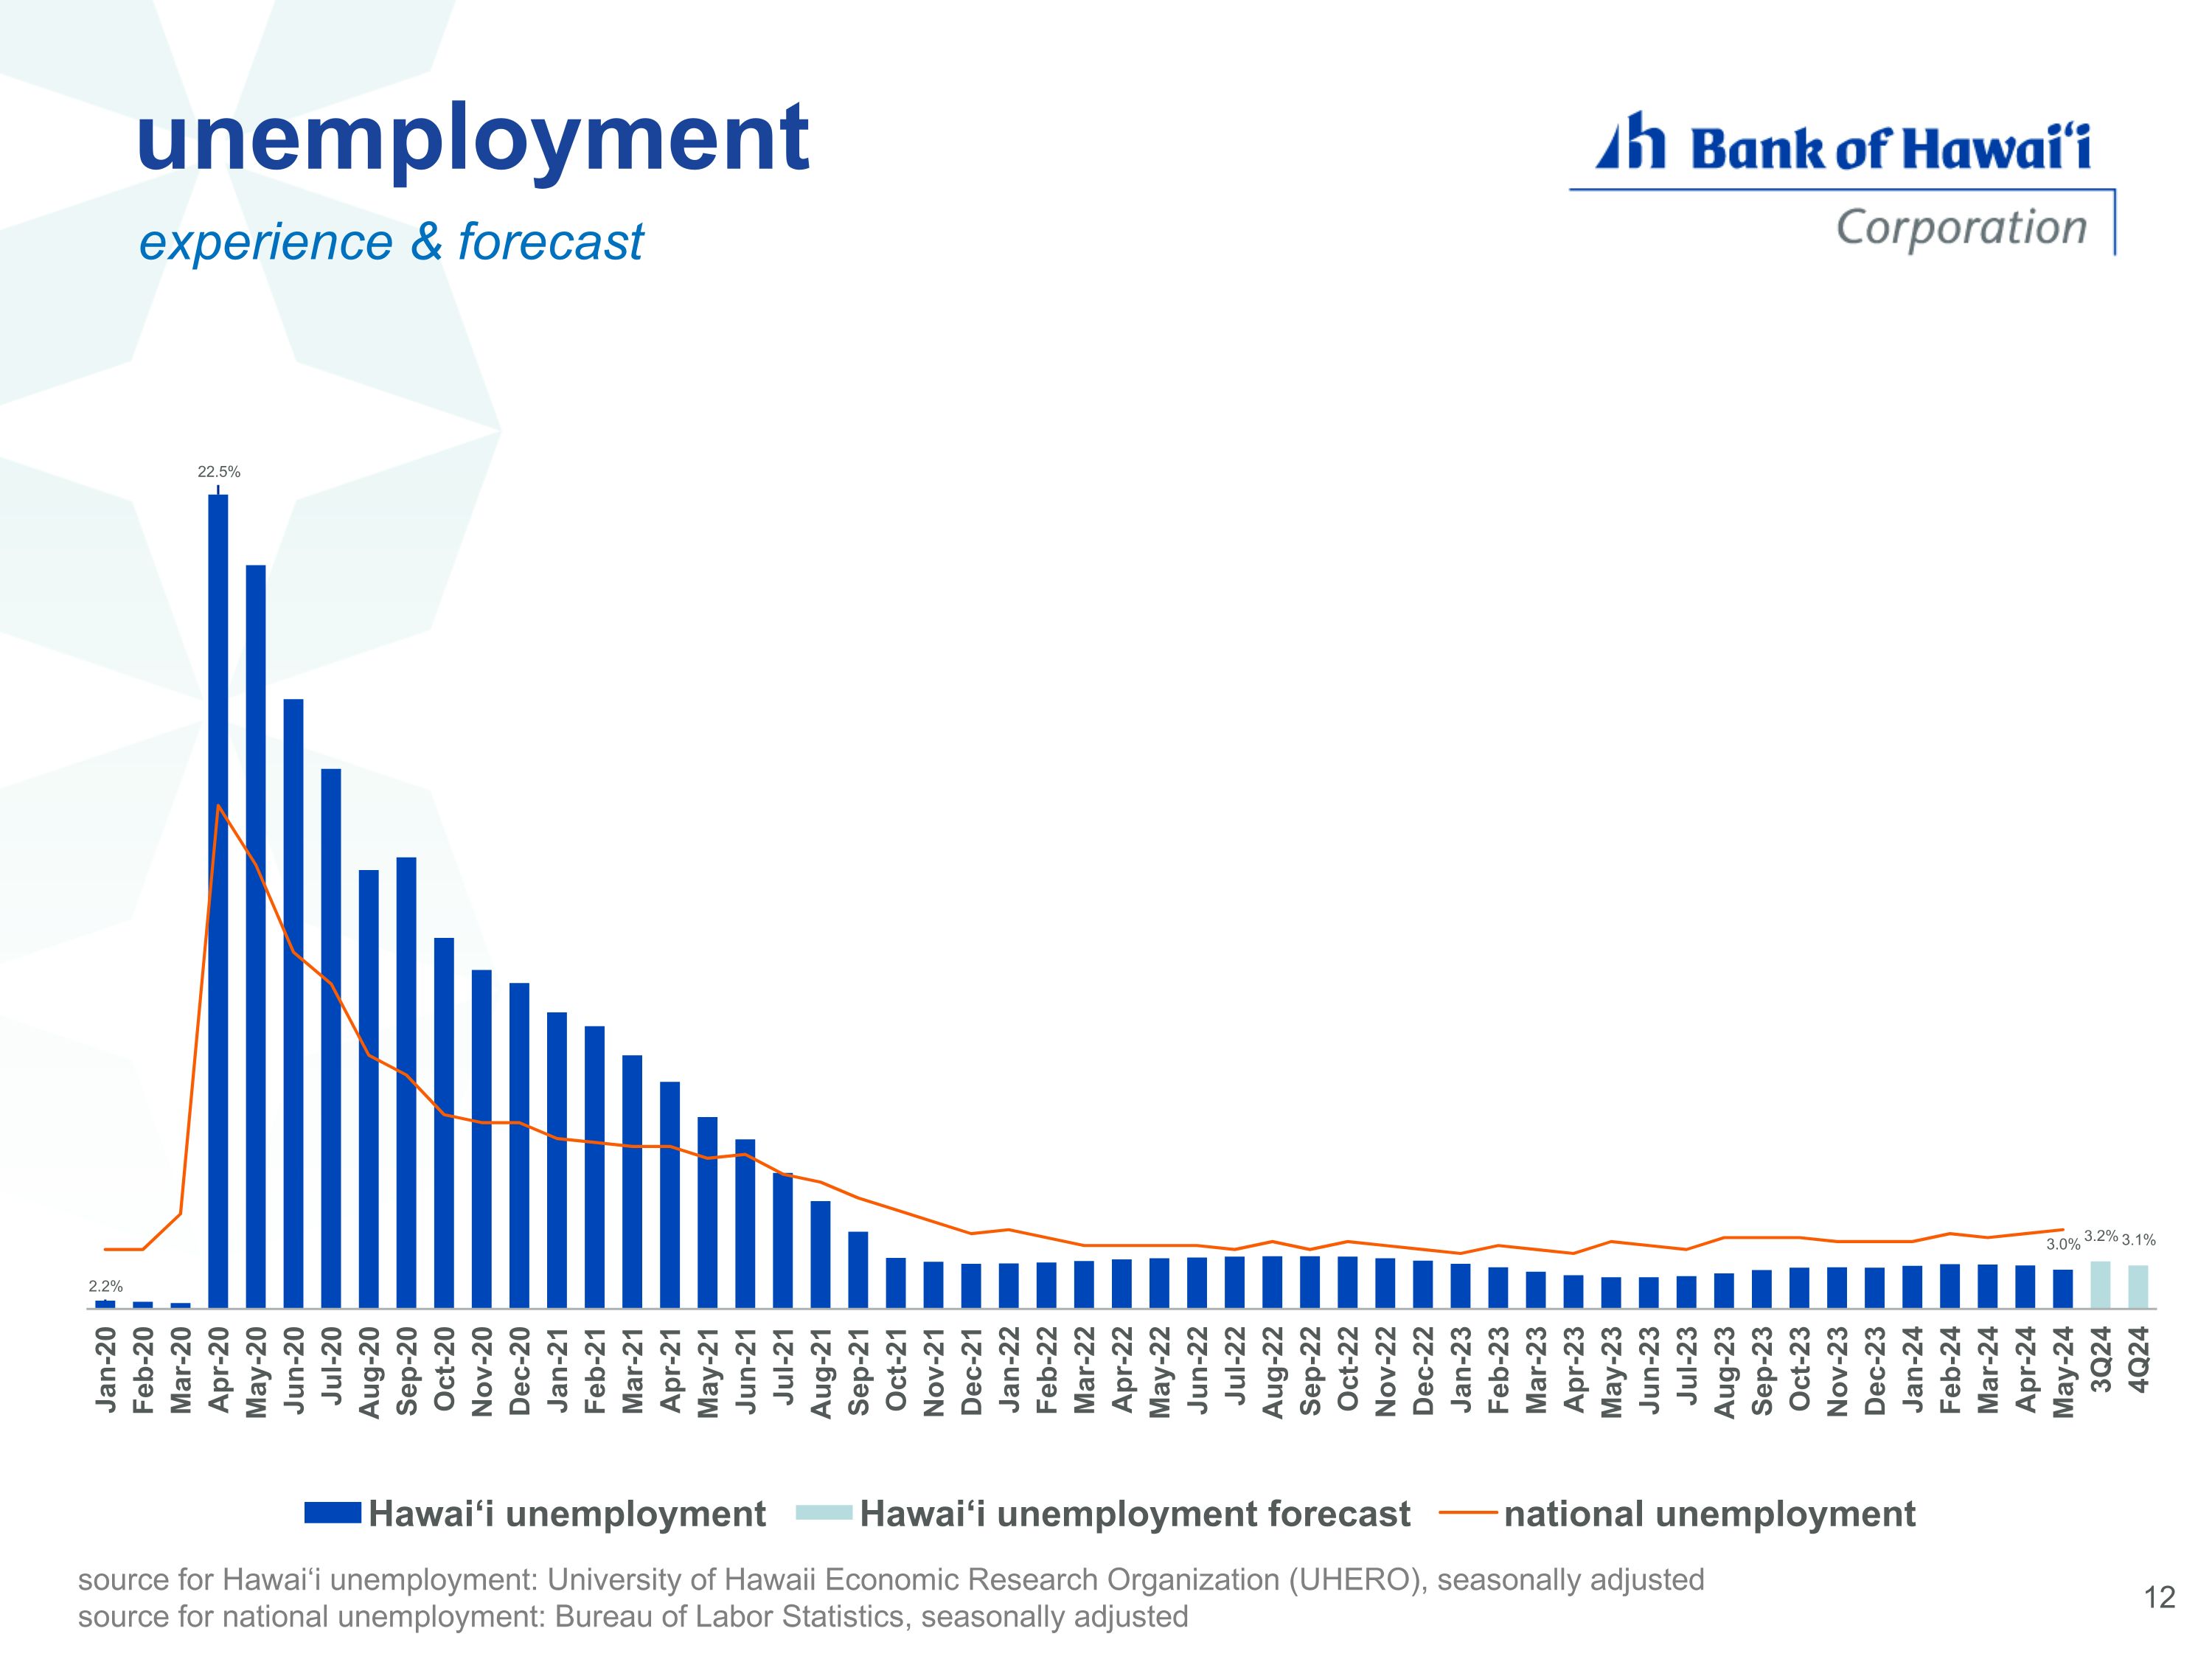
unemployment experience & forecast source for Hawai‘i unemployment: University of Hawaii Economic Research Organization (UHERO), seasonally adjusted source for national unemployment: Bureau of Labor Statistics, seasonally adjusted 12
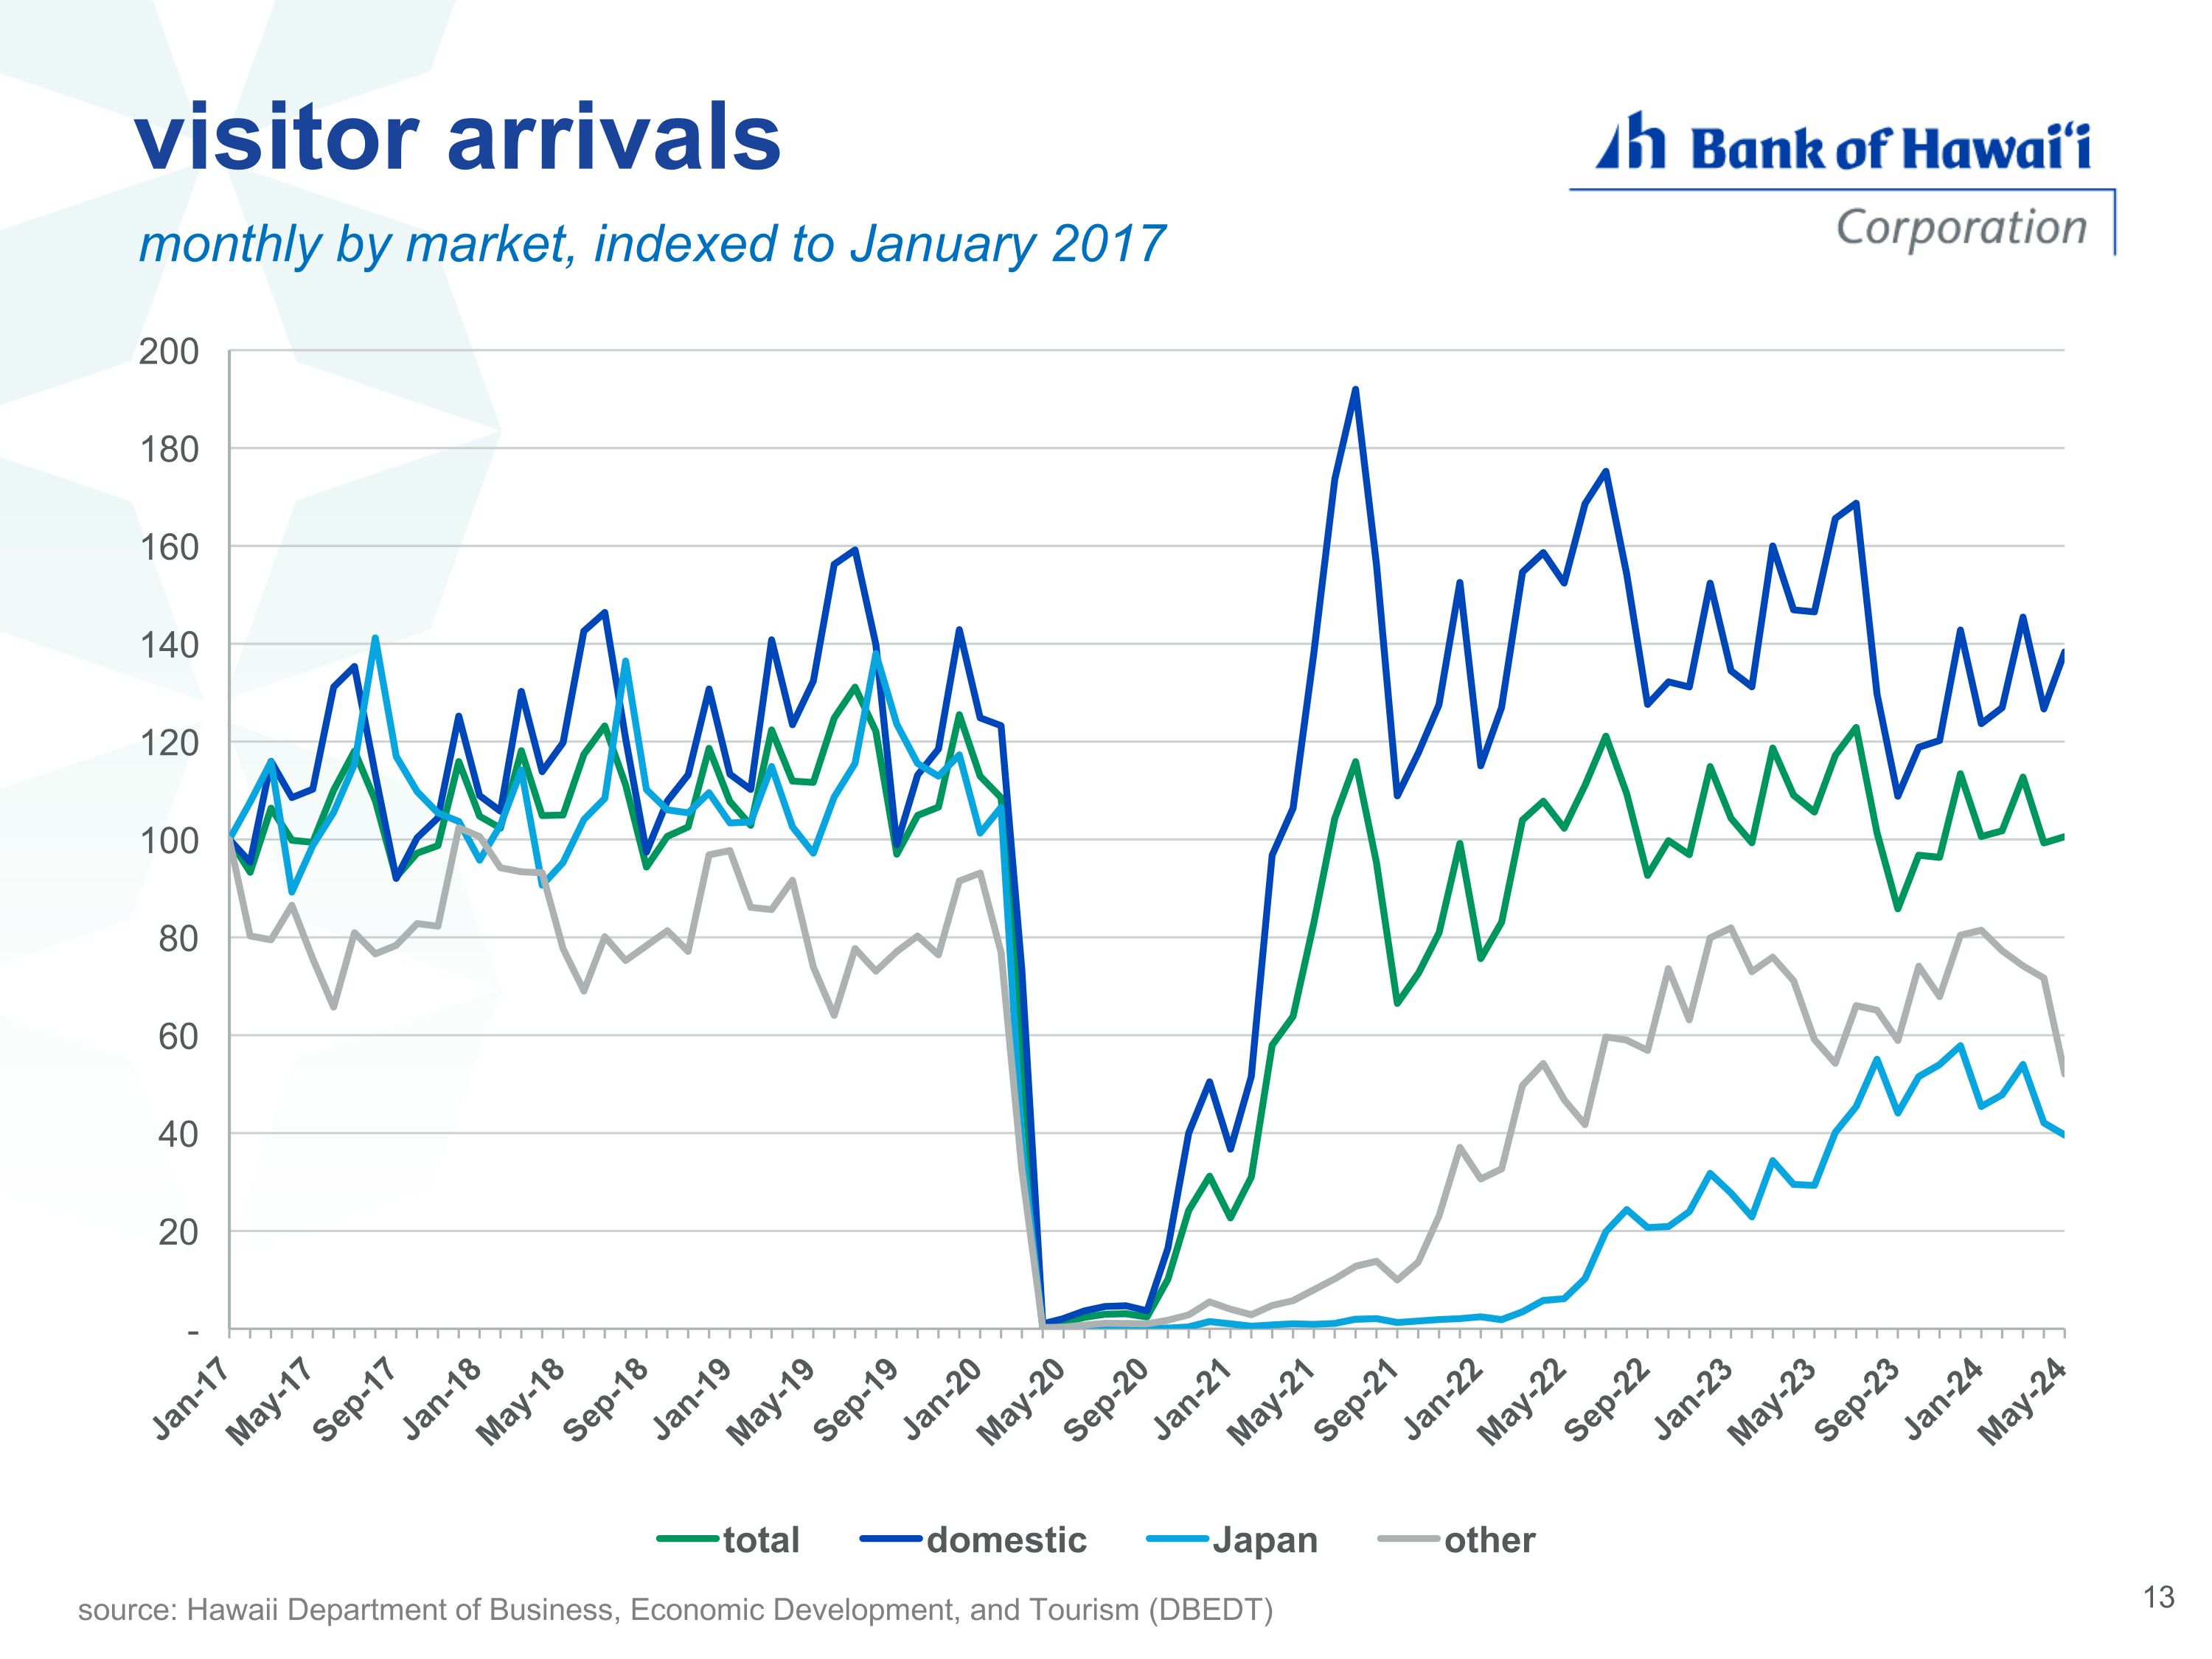
13 visitor arrivals monthly by market, indexed to January 2017 source: Hawaii Department of Business, Economic Development, and Tourism (DBEDT)
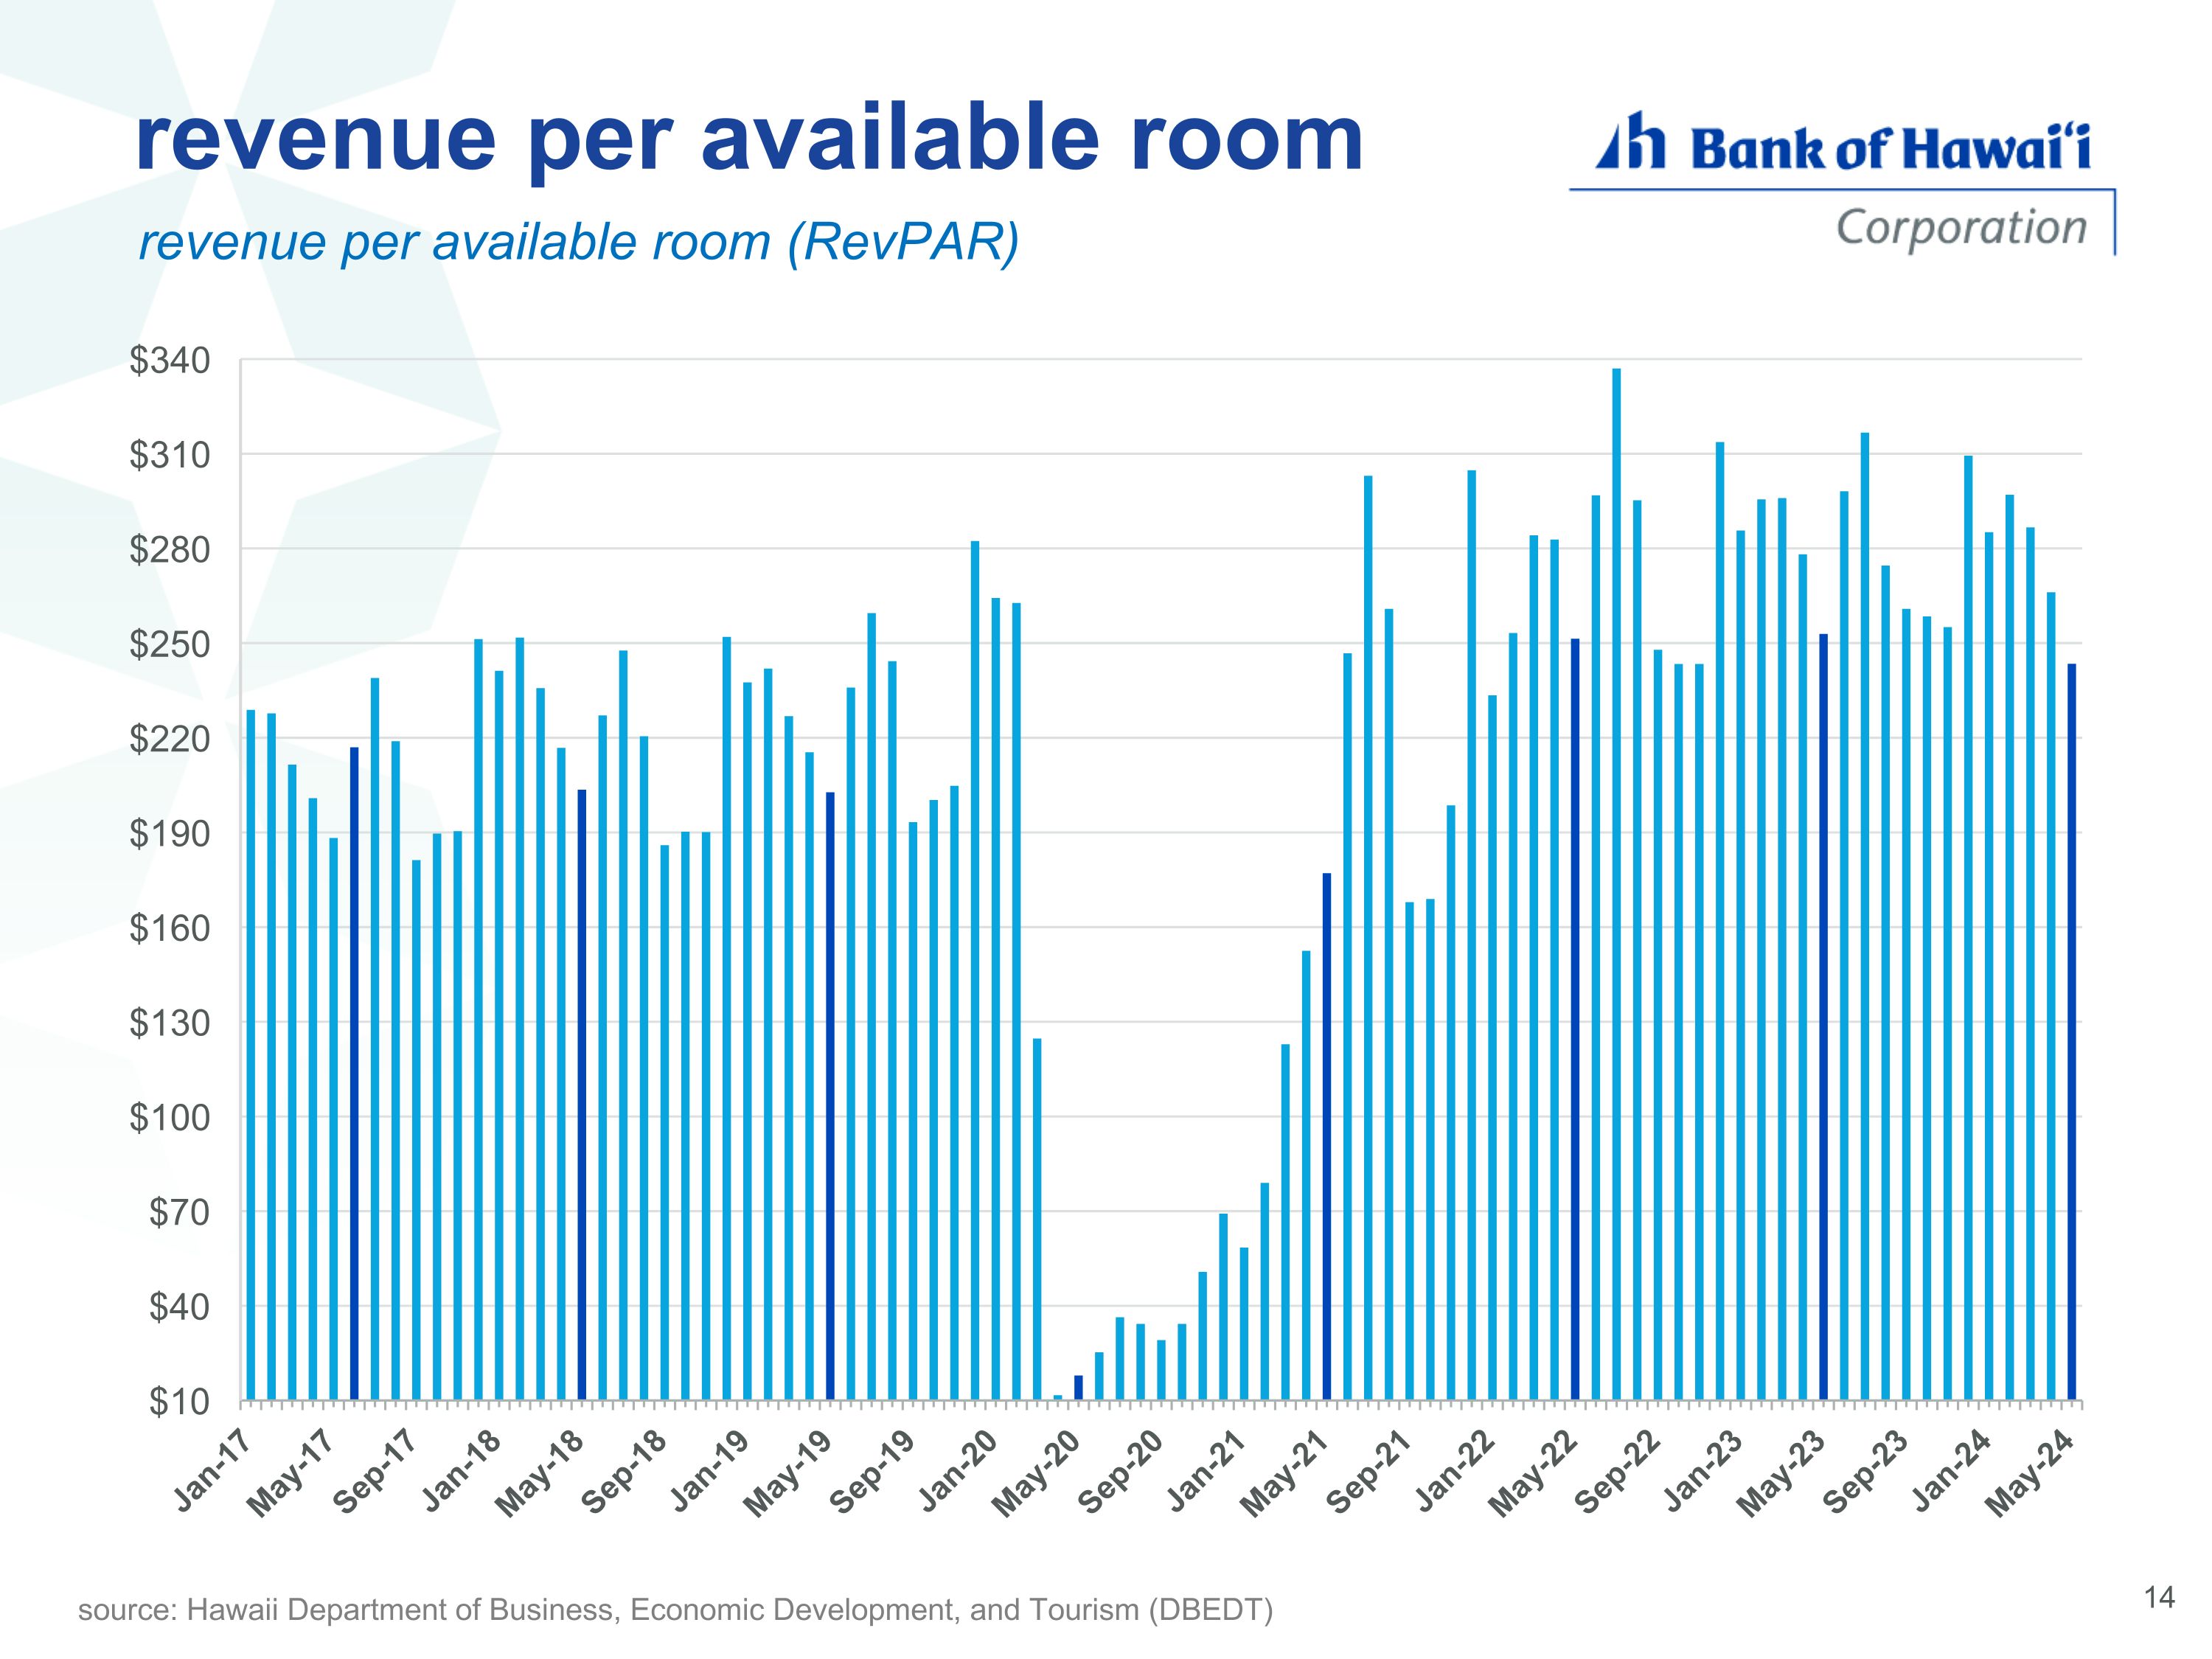
revenue per available room revenue per available room (RevPAR) source: Hawaii Department of Business, Economic Development, and Tourism (DBEDT)
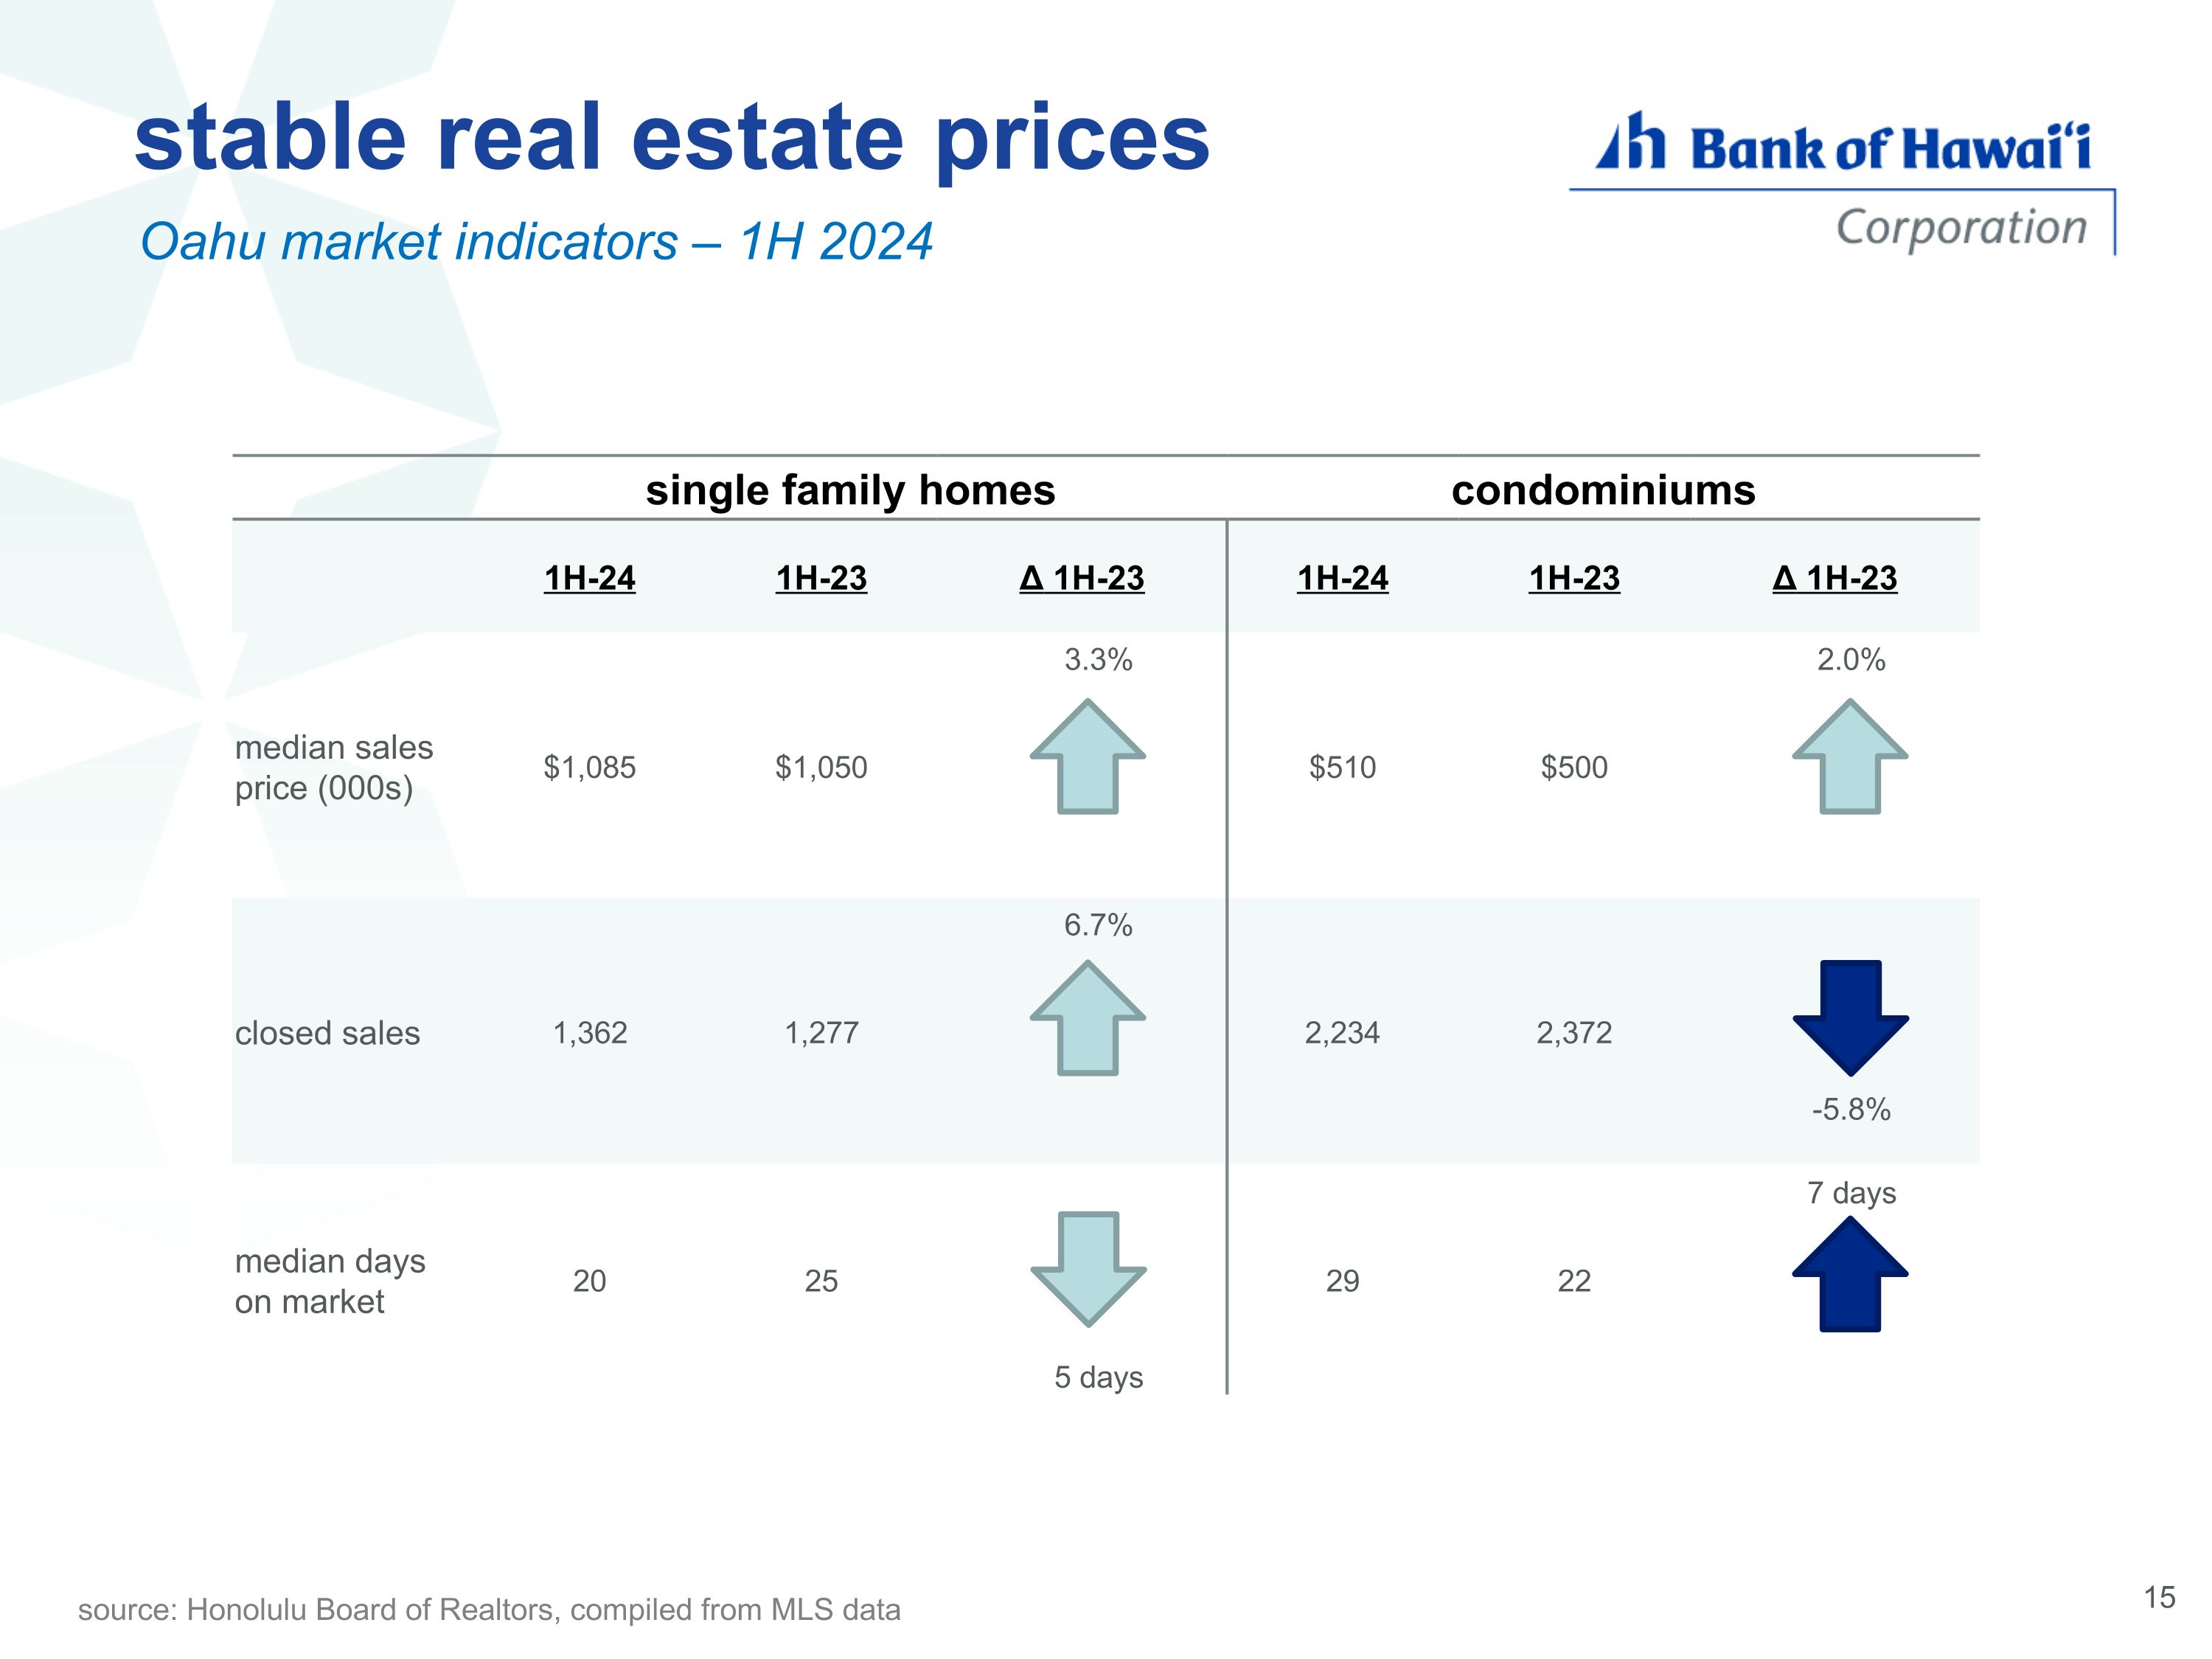
single family homes condominiums 1H-24 1H-23 Δ 1H-23 1H-24 1H-23 Δ 1H-23 median sales price (000s) $1,085 $1,050 3.3% $510 $500 2.0% closed sales 1,362 1,277 6.7% 2,234 2,372 -5.8% median days on market 20 25 5 days 29 22 7 days stable real estate prices Oahu market indicators – 1H 2024 source: Honolulu Board of Realtors, compiled from MLS data
credit performance
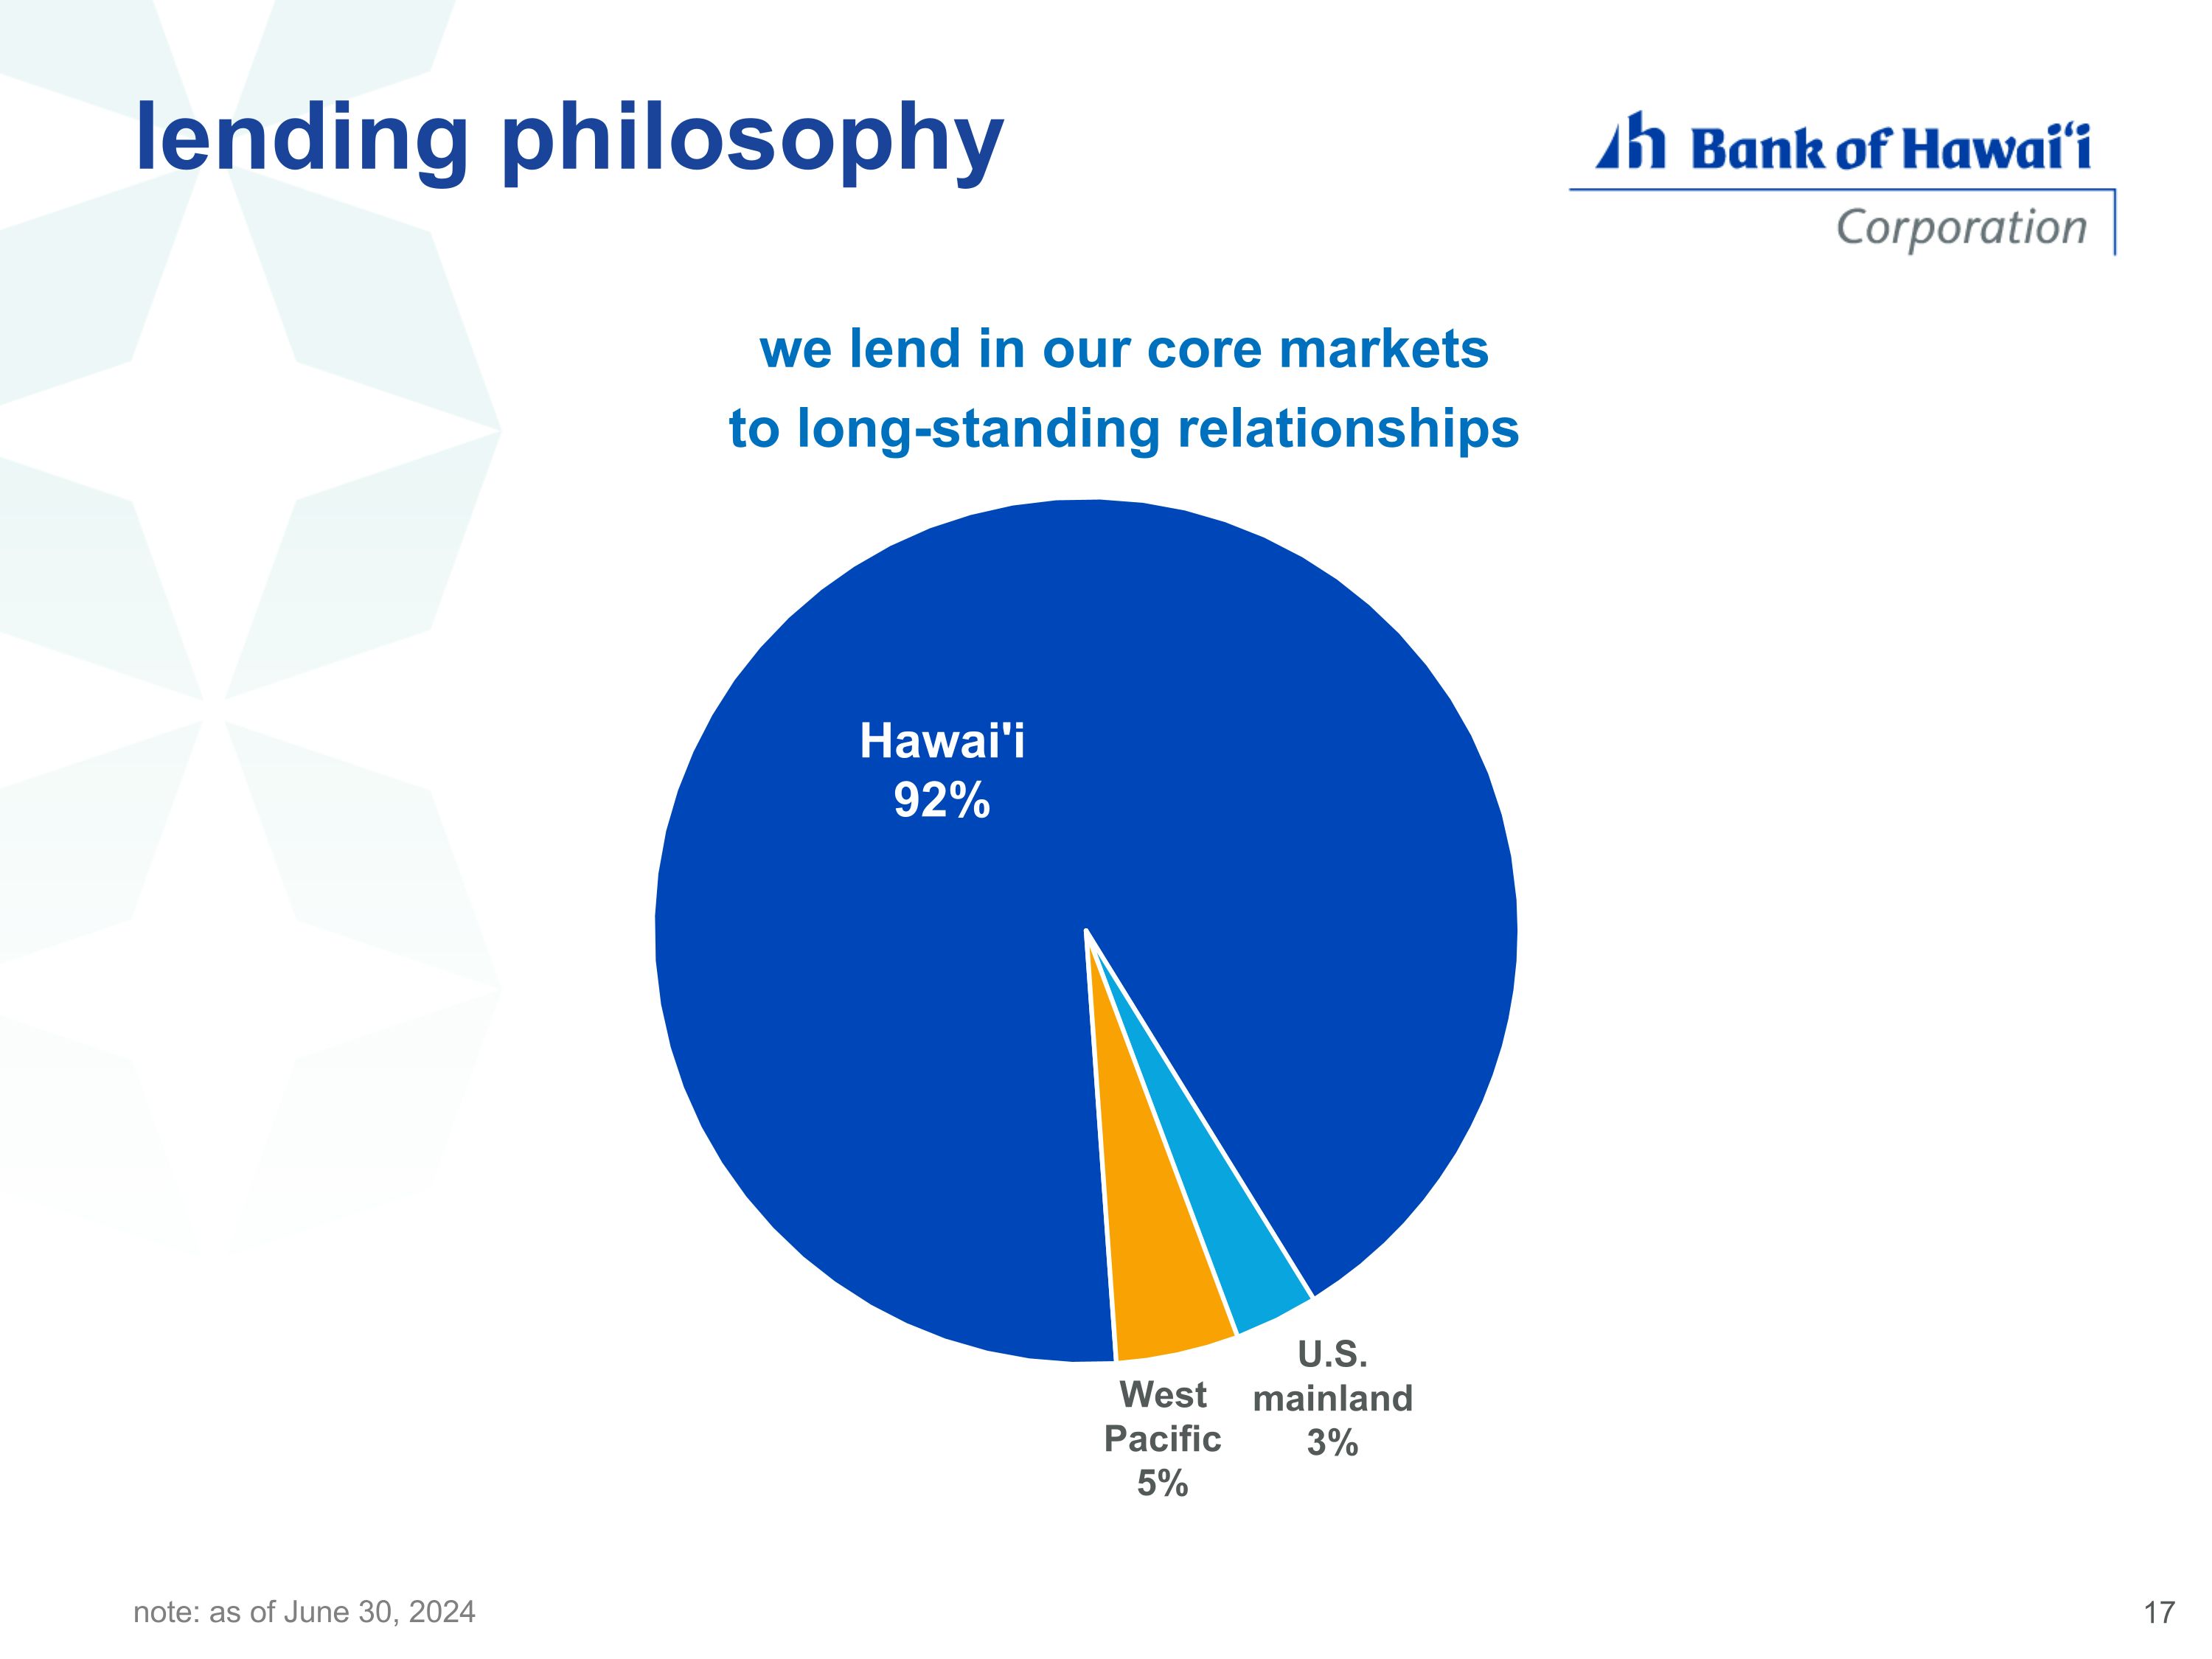
lending philosophy note: as of June 30, 2024 we lend in our core markets to long-standing relationships
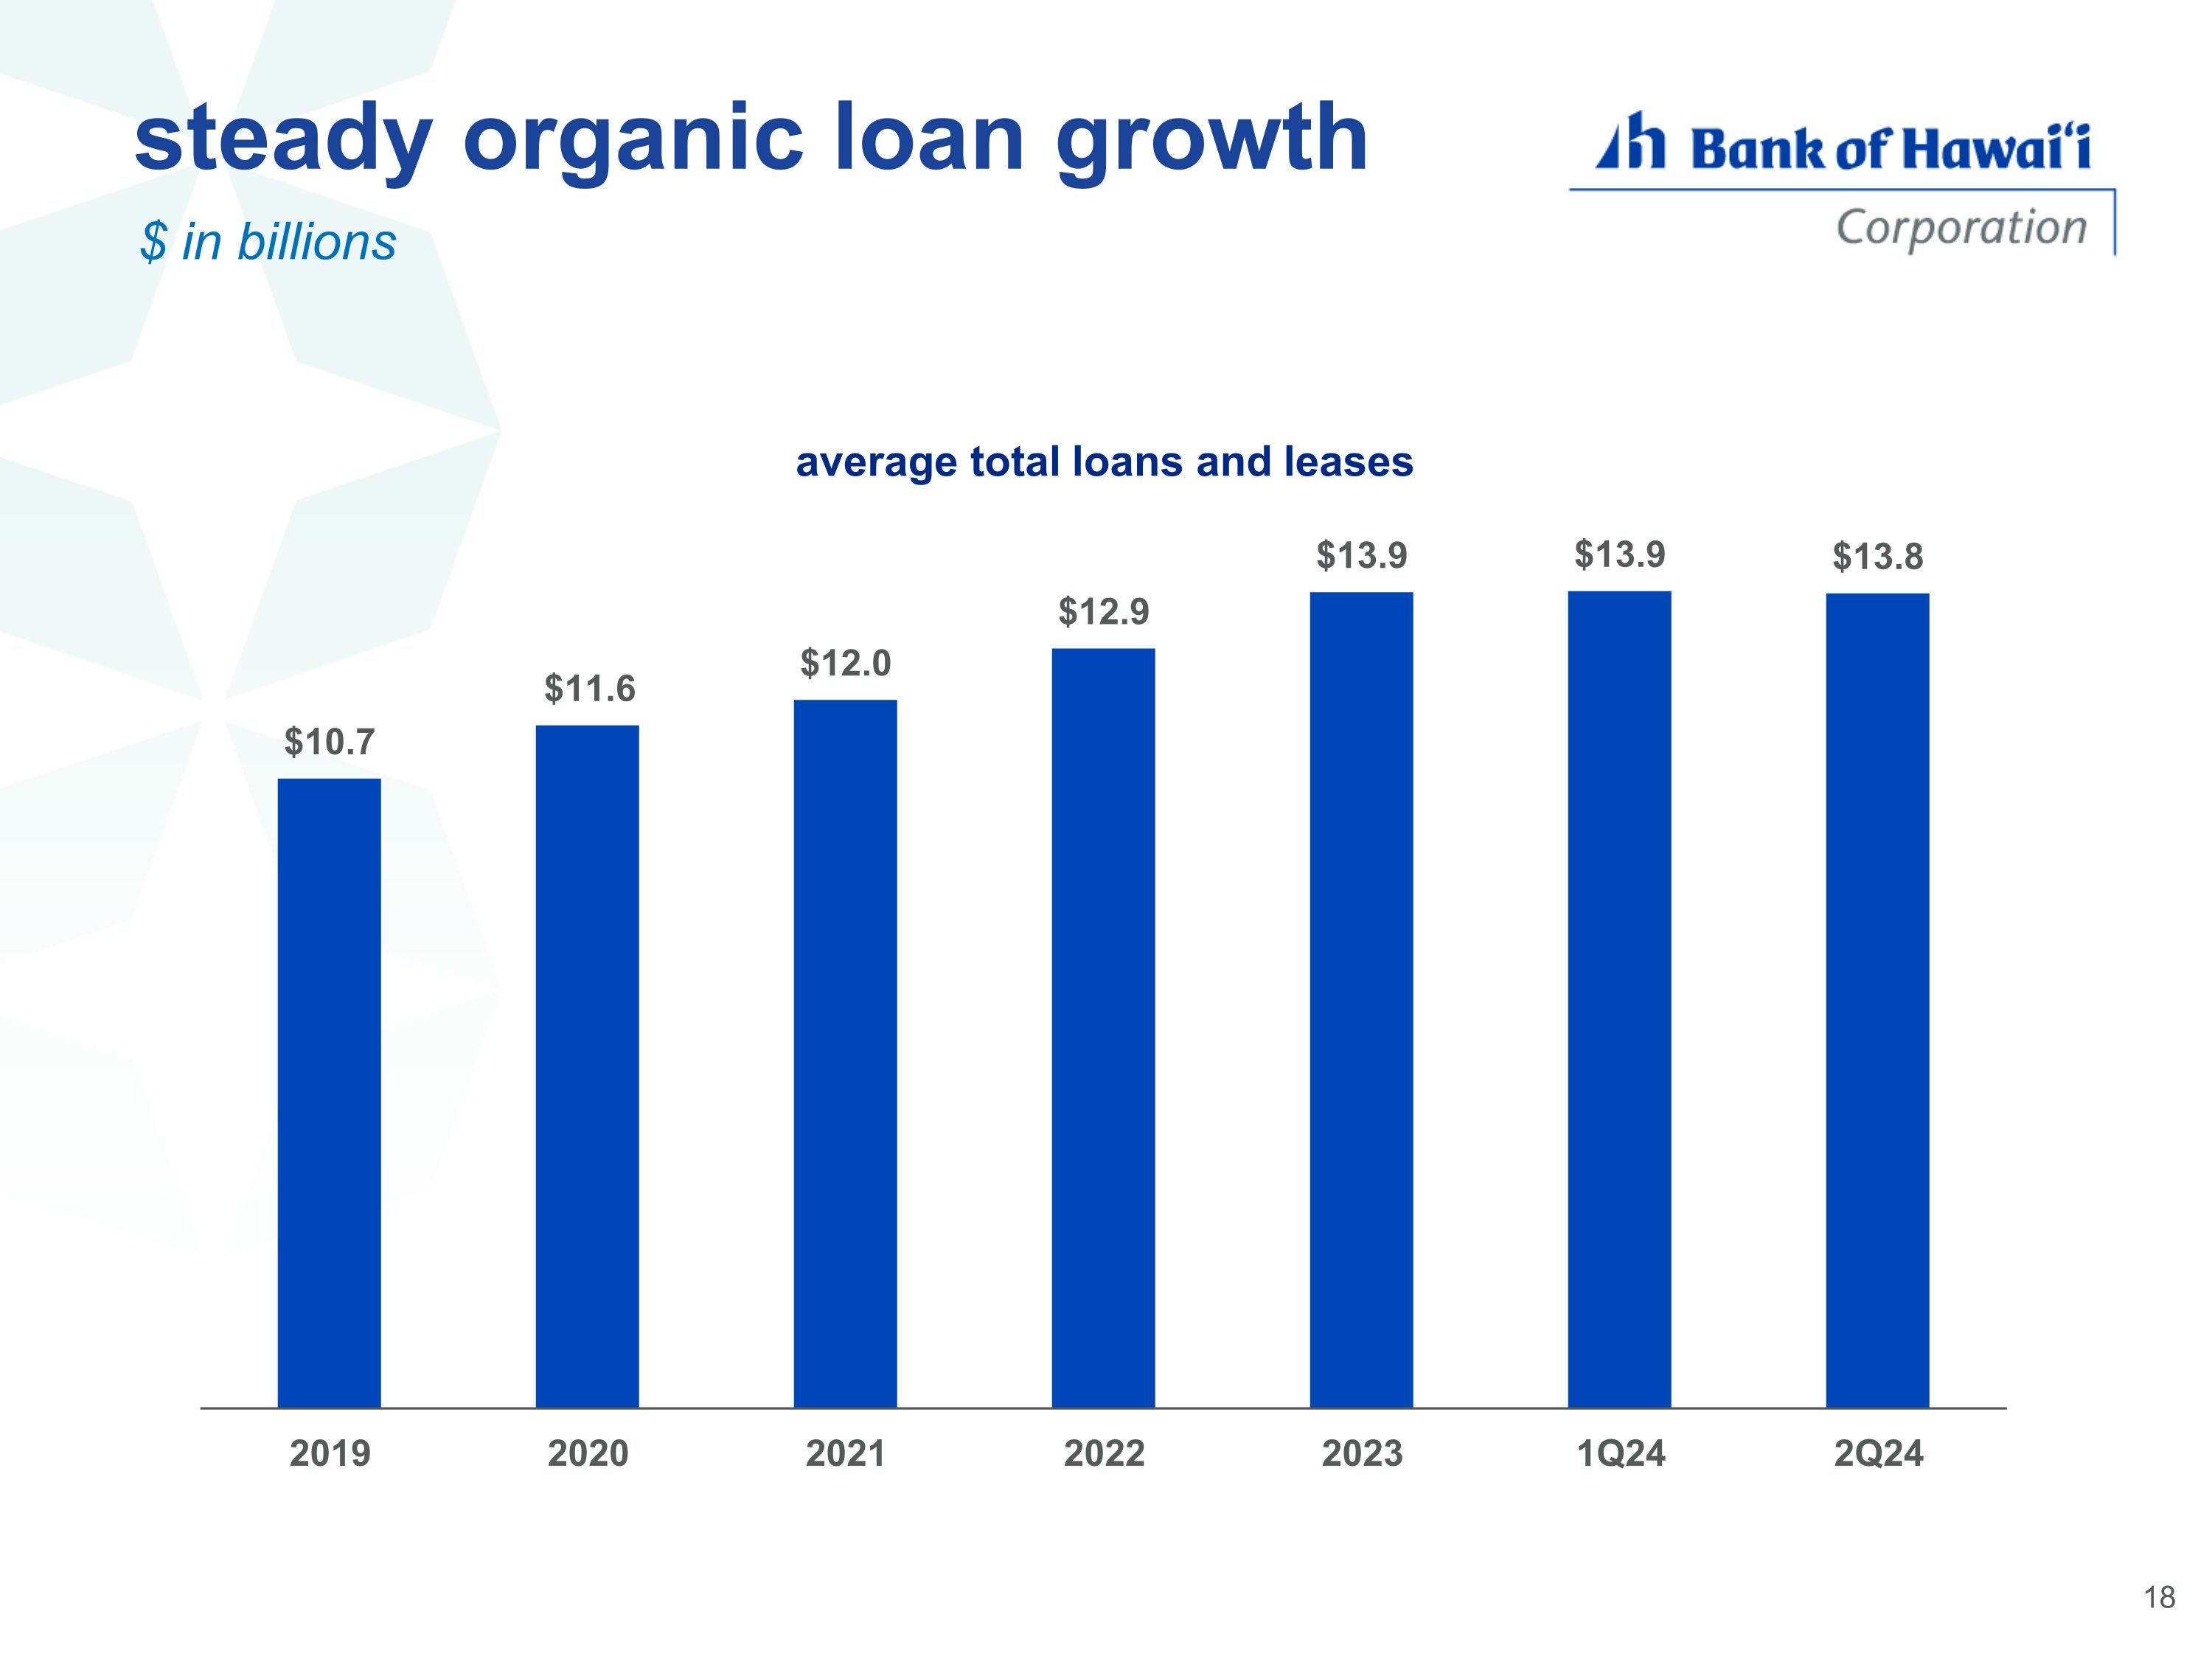
steady organic loan growth $ in billions
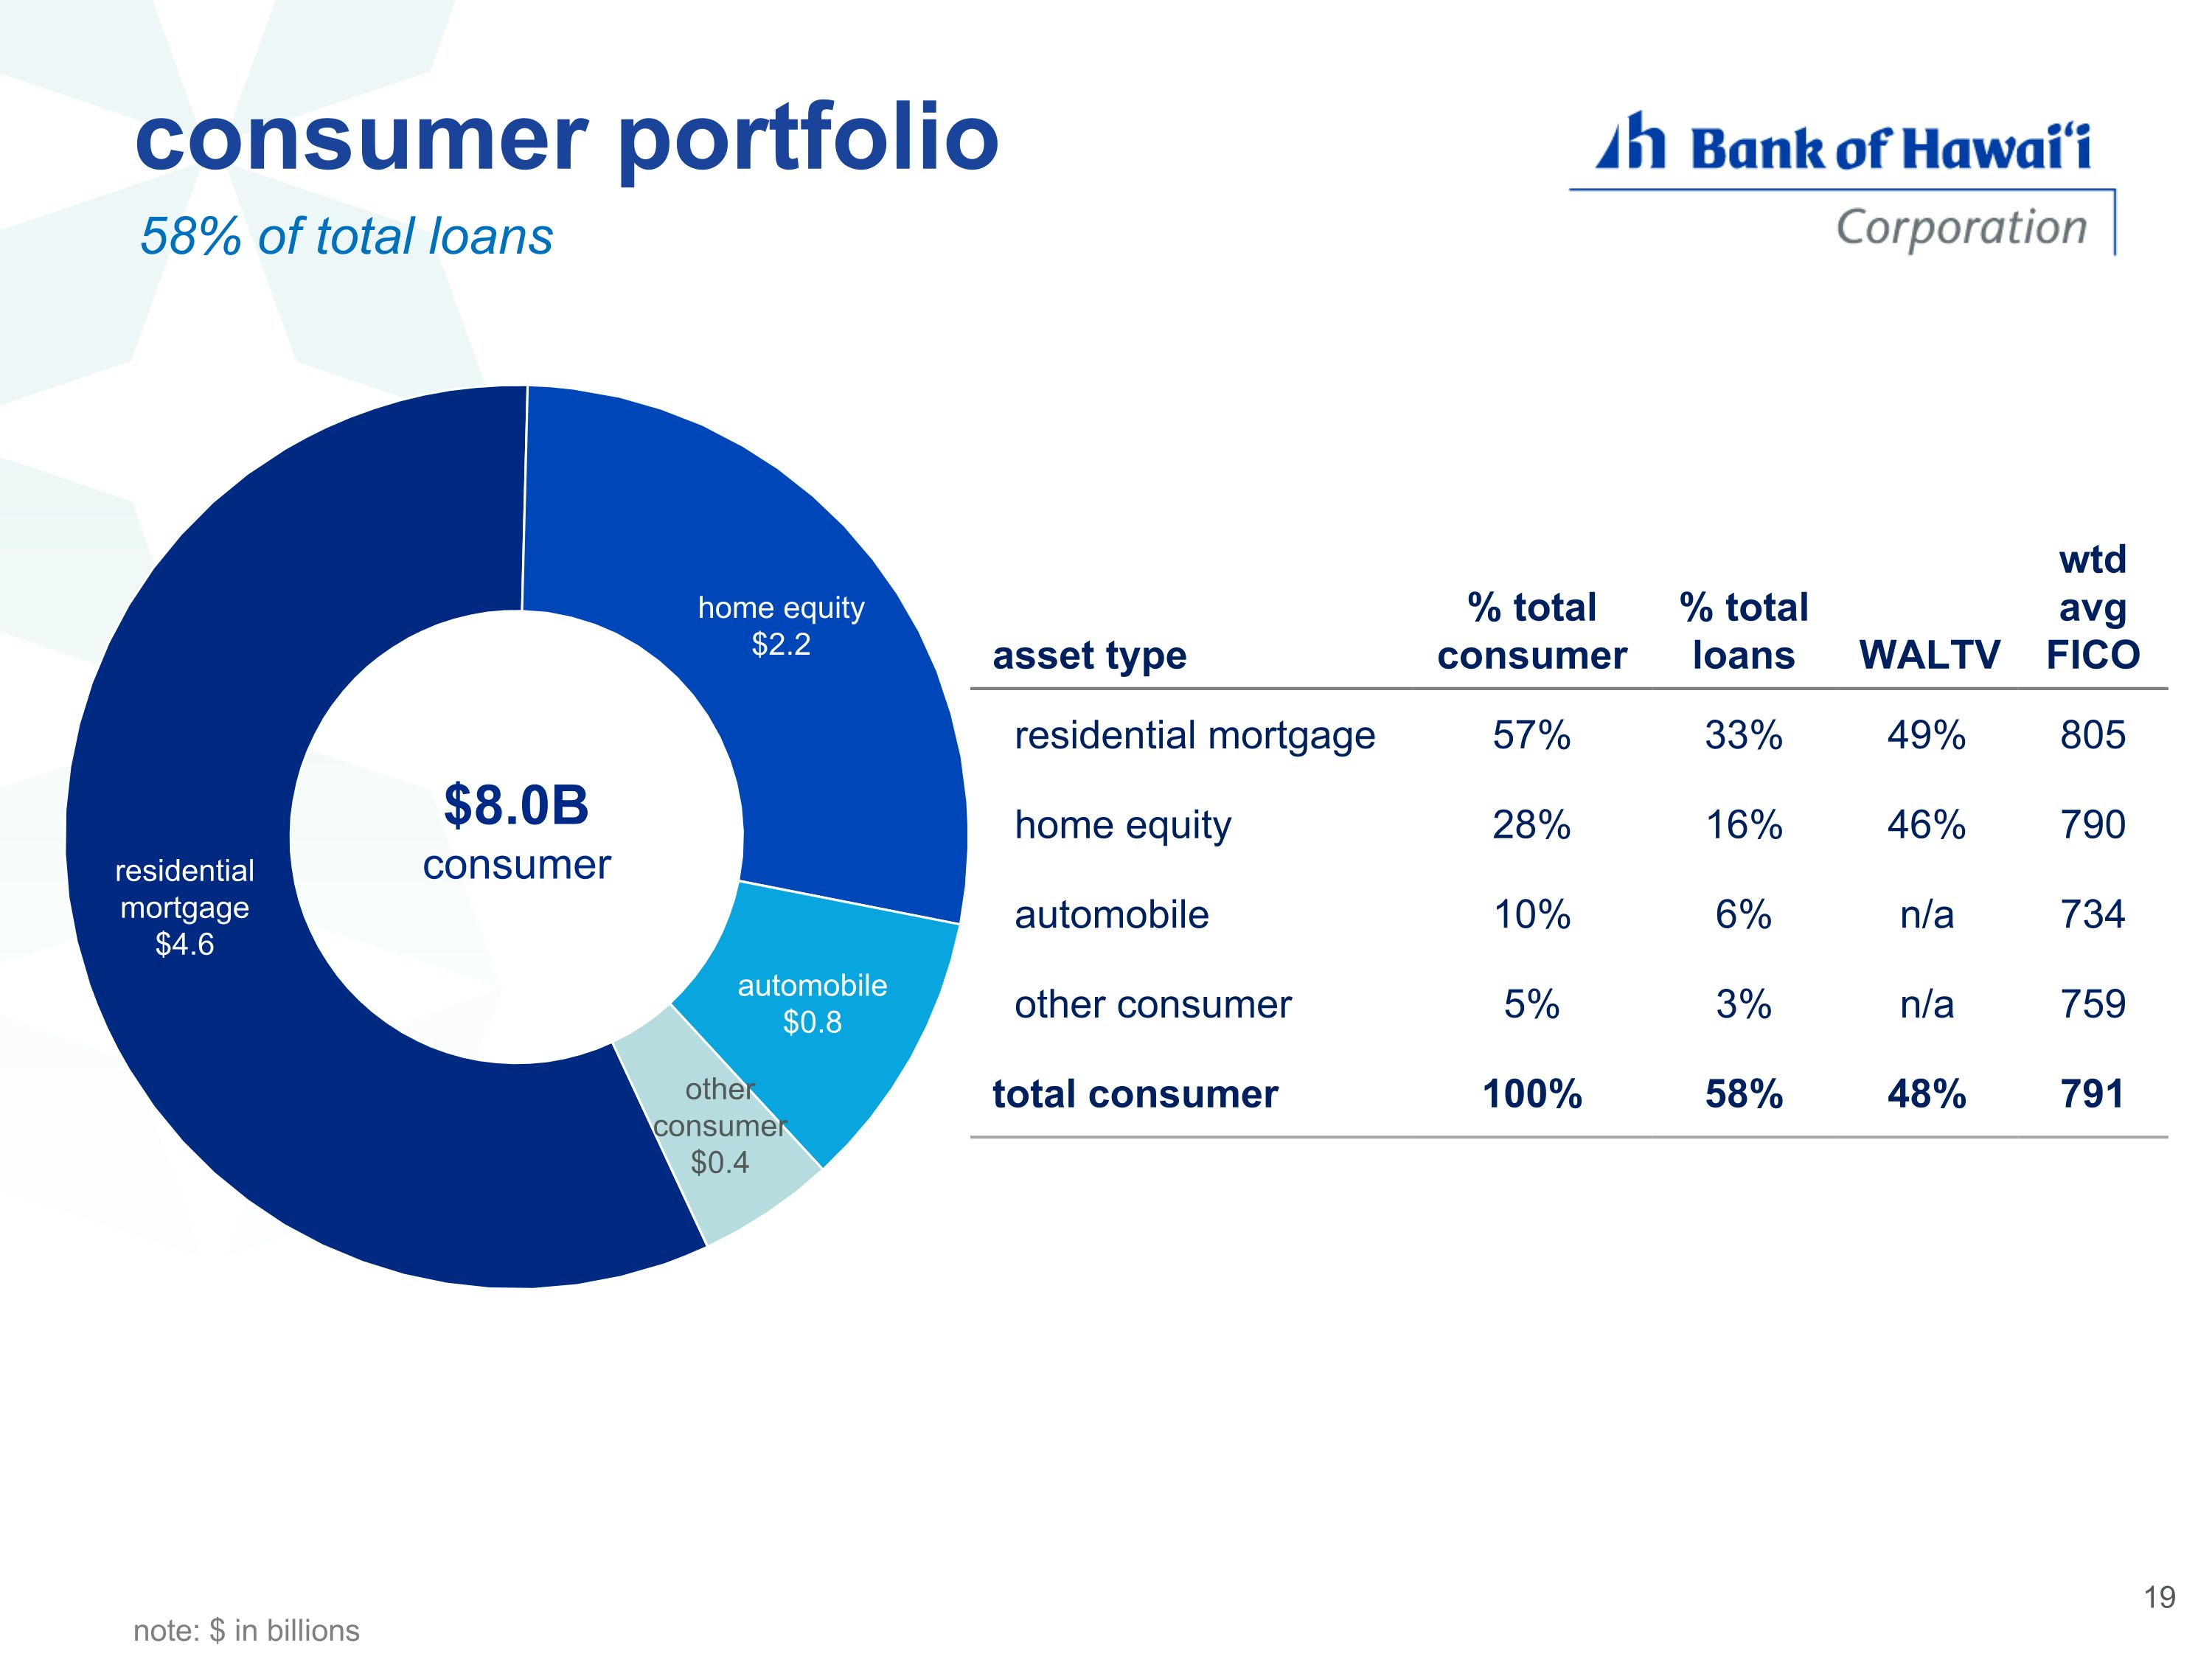
consumer portfolio 58% of total loans asset type % total consumer % total loans WALTV wtd avg FICO residential mortgage 57% 33% 49% 805 home equity 28% 16% 46% 790 automobile 10% 6% n/a 734 other consumer 5% 3% n/a 759 total consumer 100% 58% 48% 791 $8.0B consumer note: $ in billions
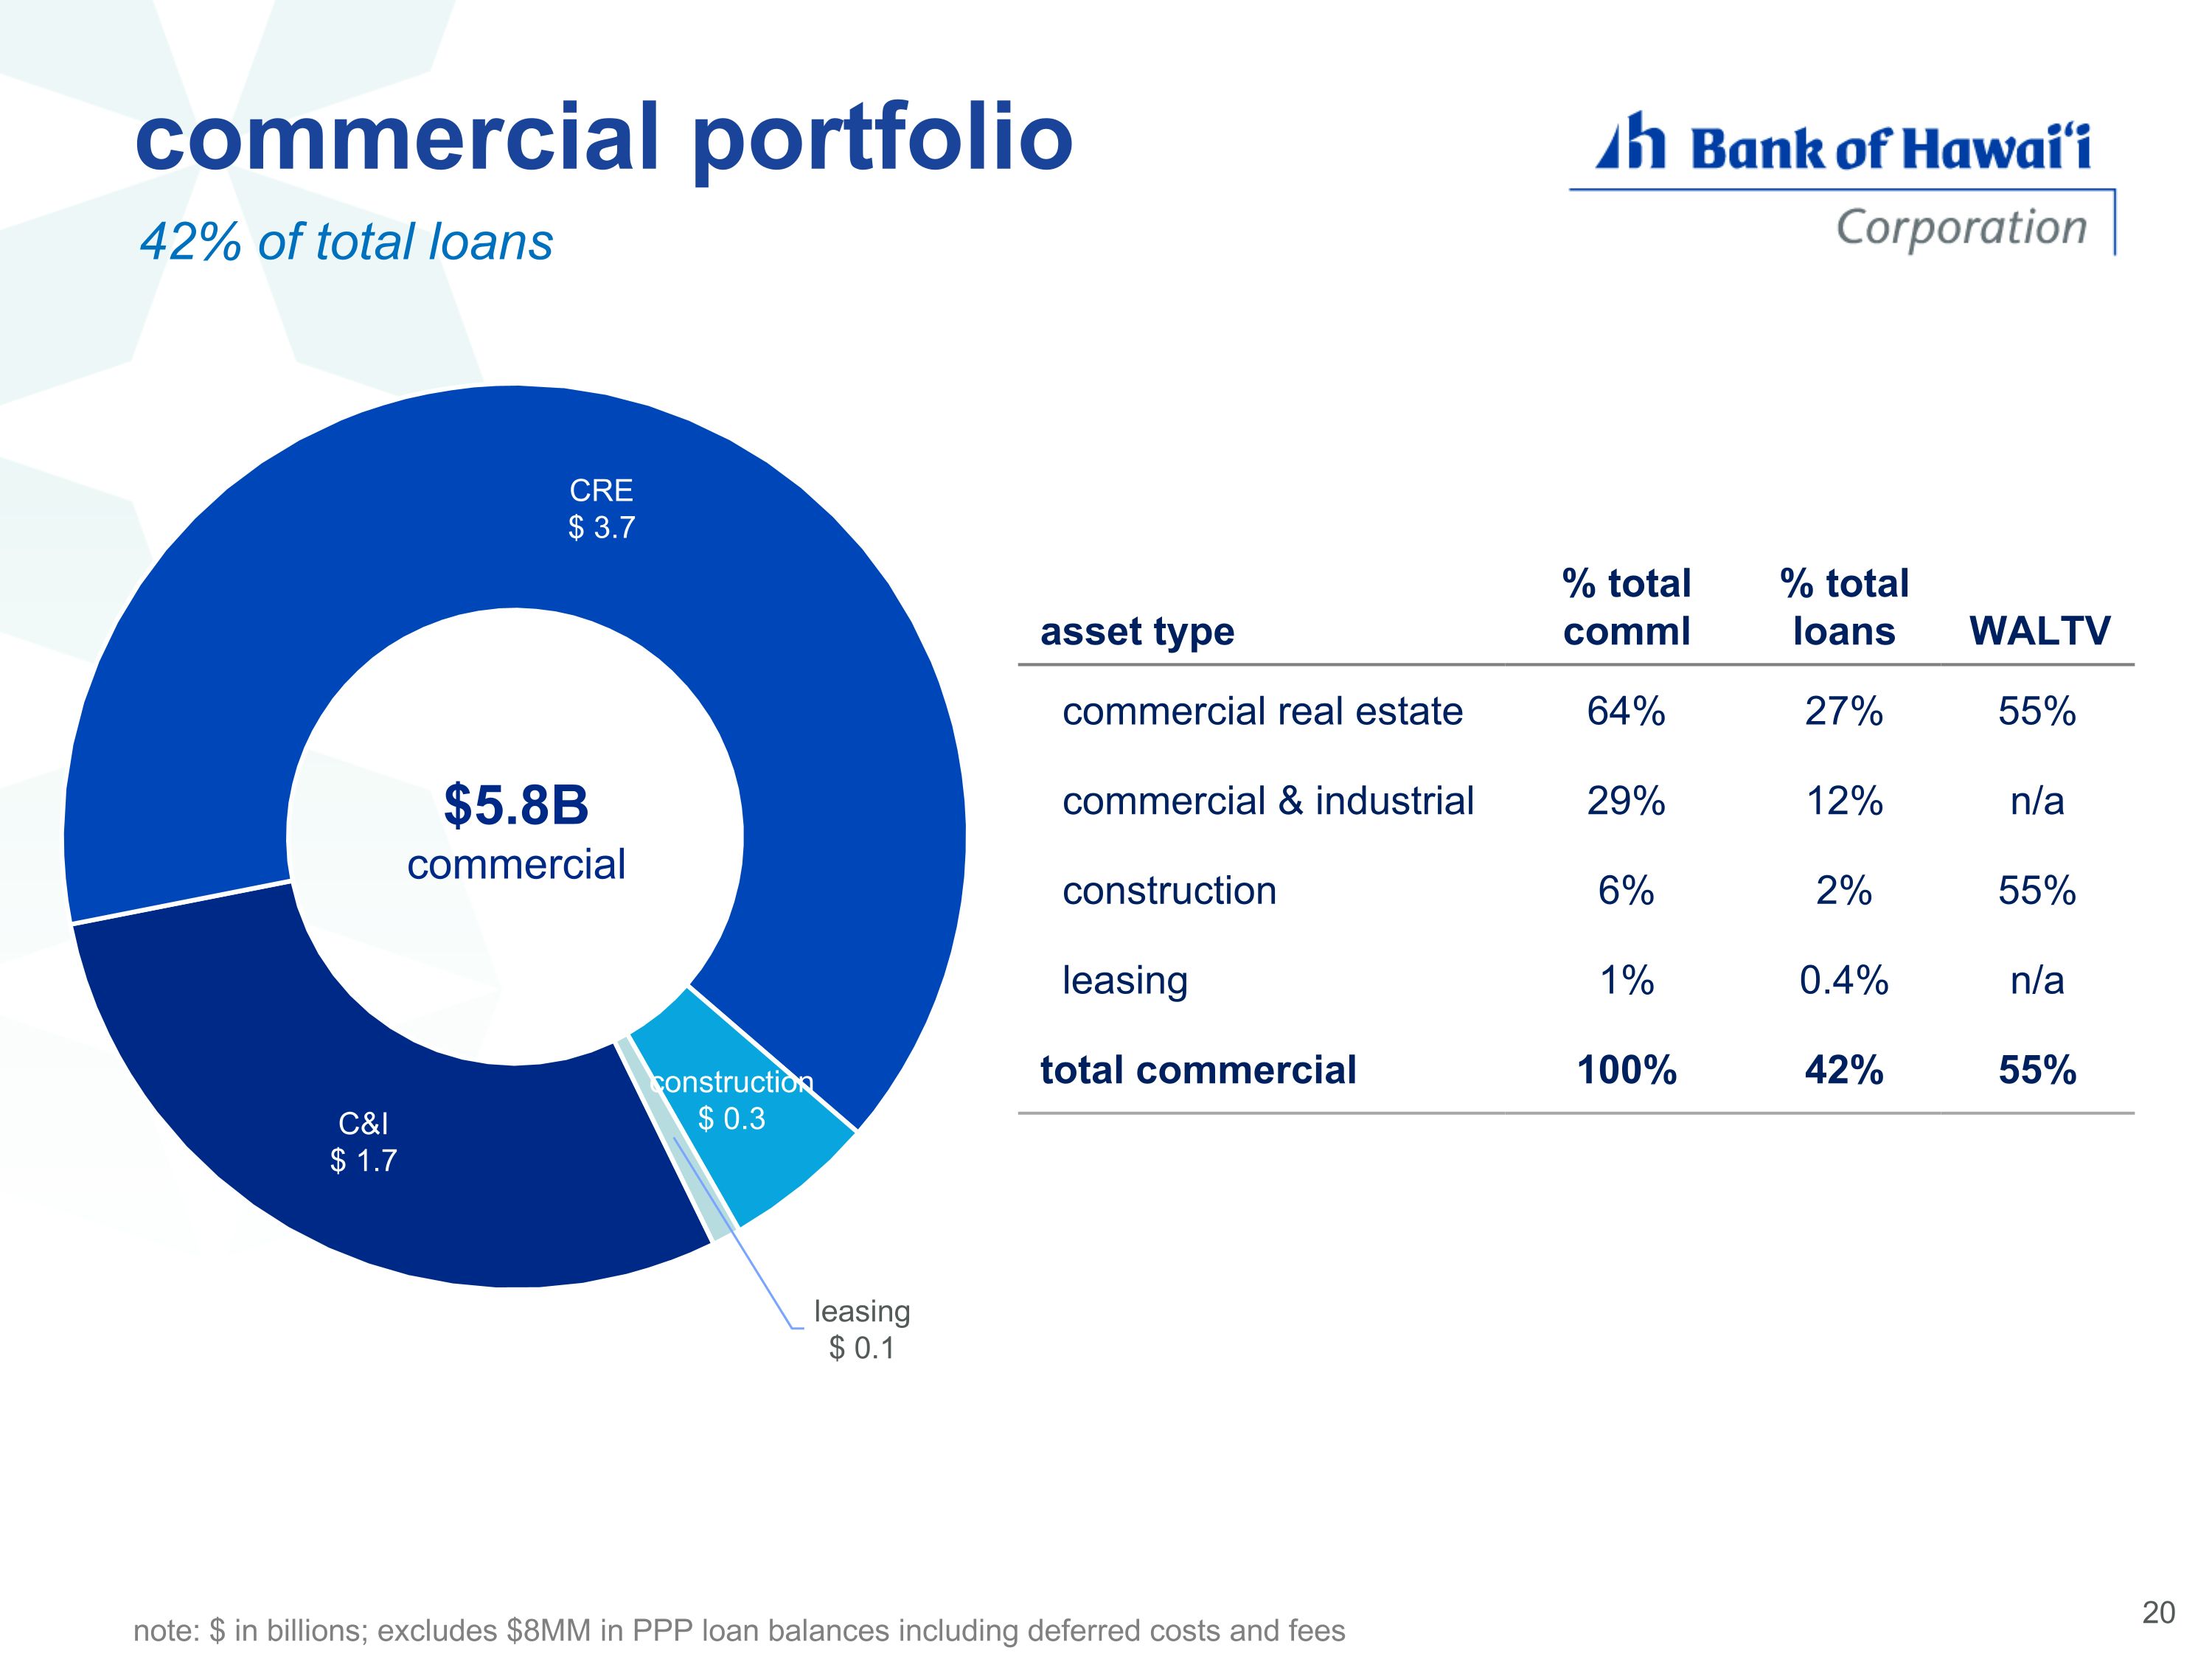
commercial portfolio residential mortgage home equity 42% of total loans $5.8B commercial asset type % total comml % total loans WALTV commercial real estate 64% 27% 55% commercial & industrial 29% 12% n/a construction 6% 2% 55% leasing 1% 0.4% n/a total commercial 100% 42% 55% note: $ in billions; excludes $8MM in PPP loan balances including deferred costs and fees
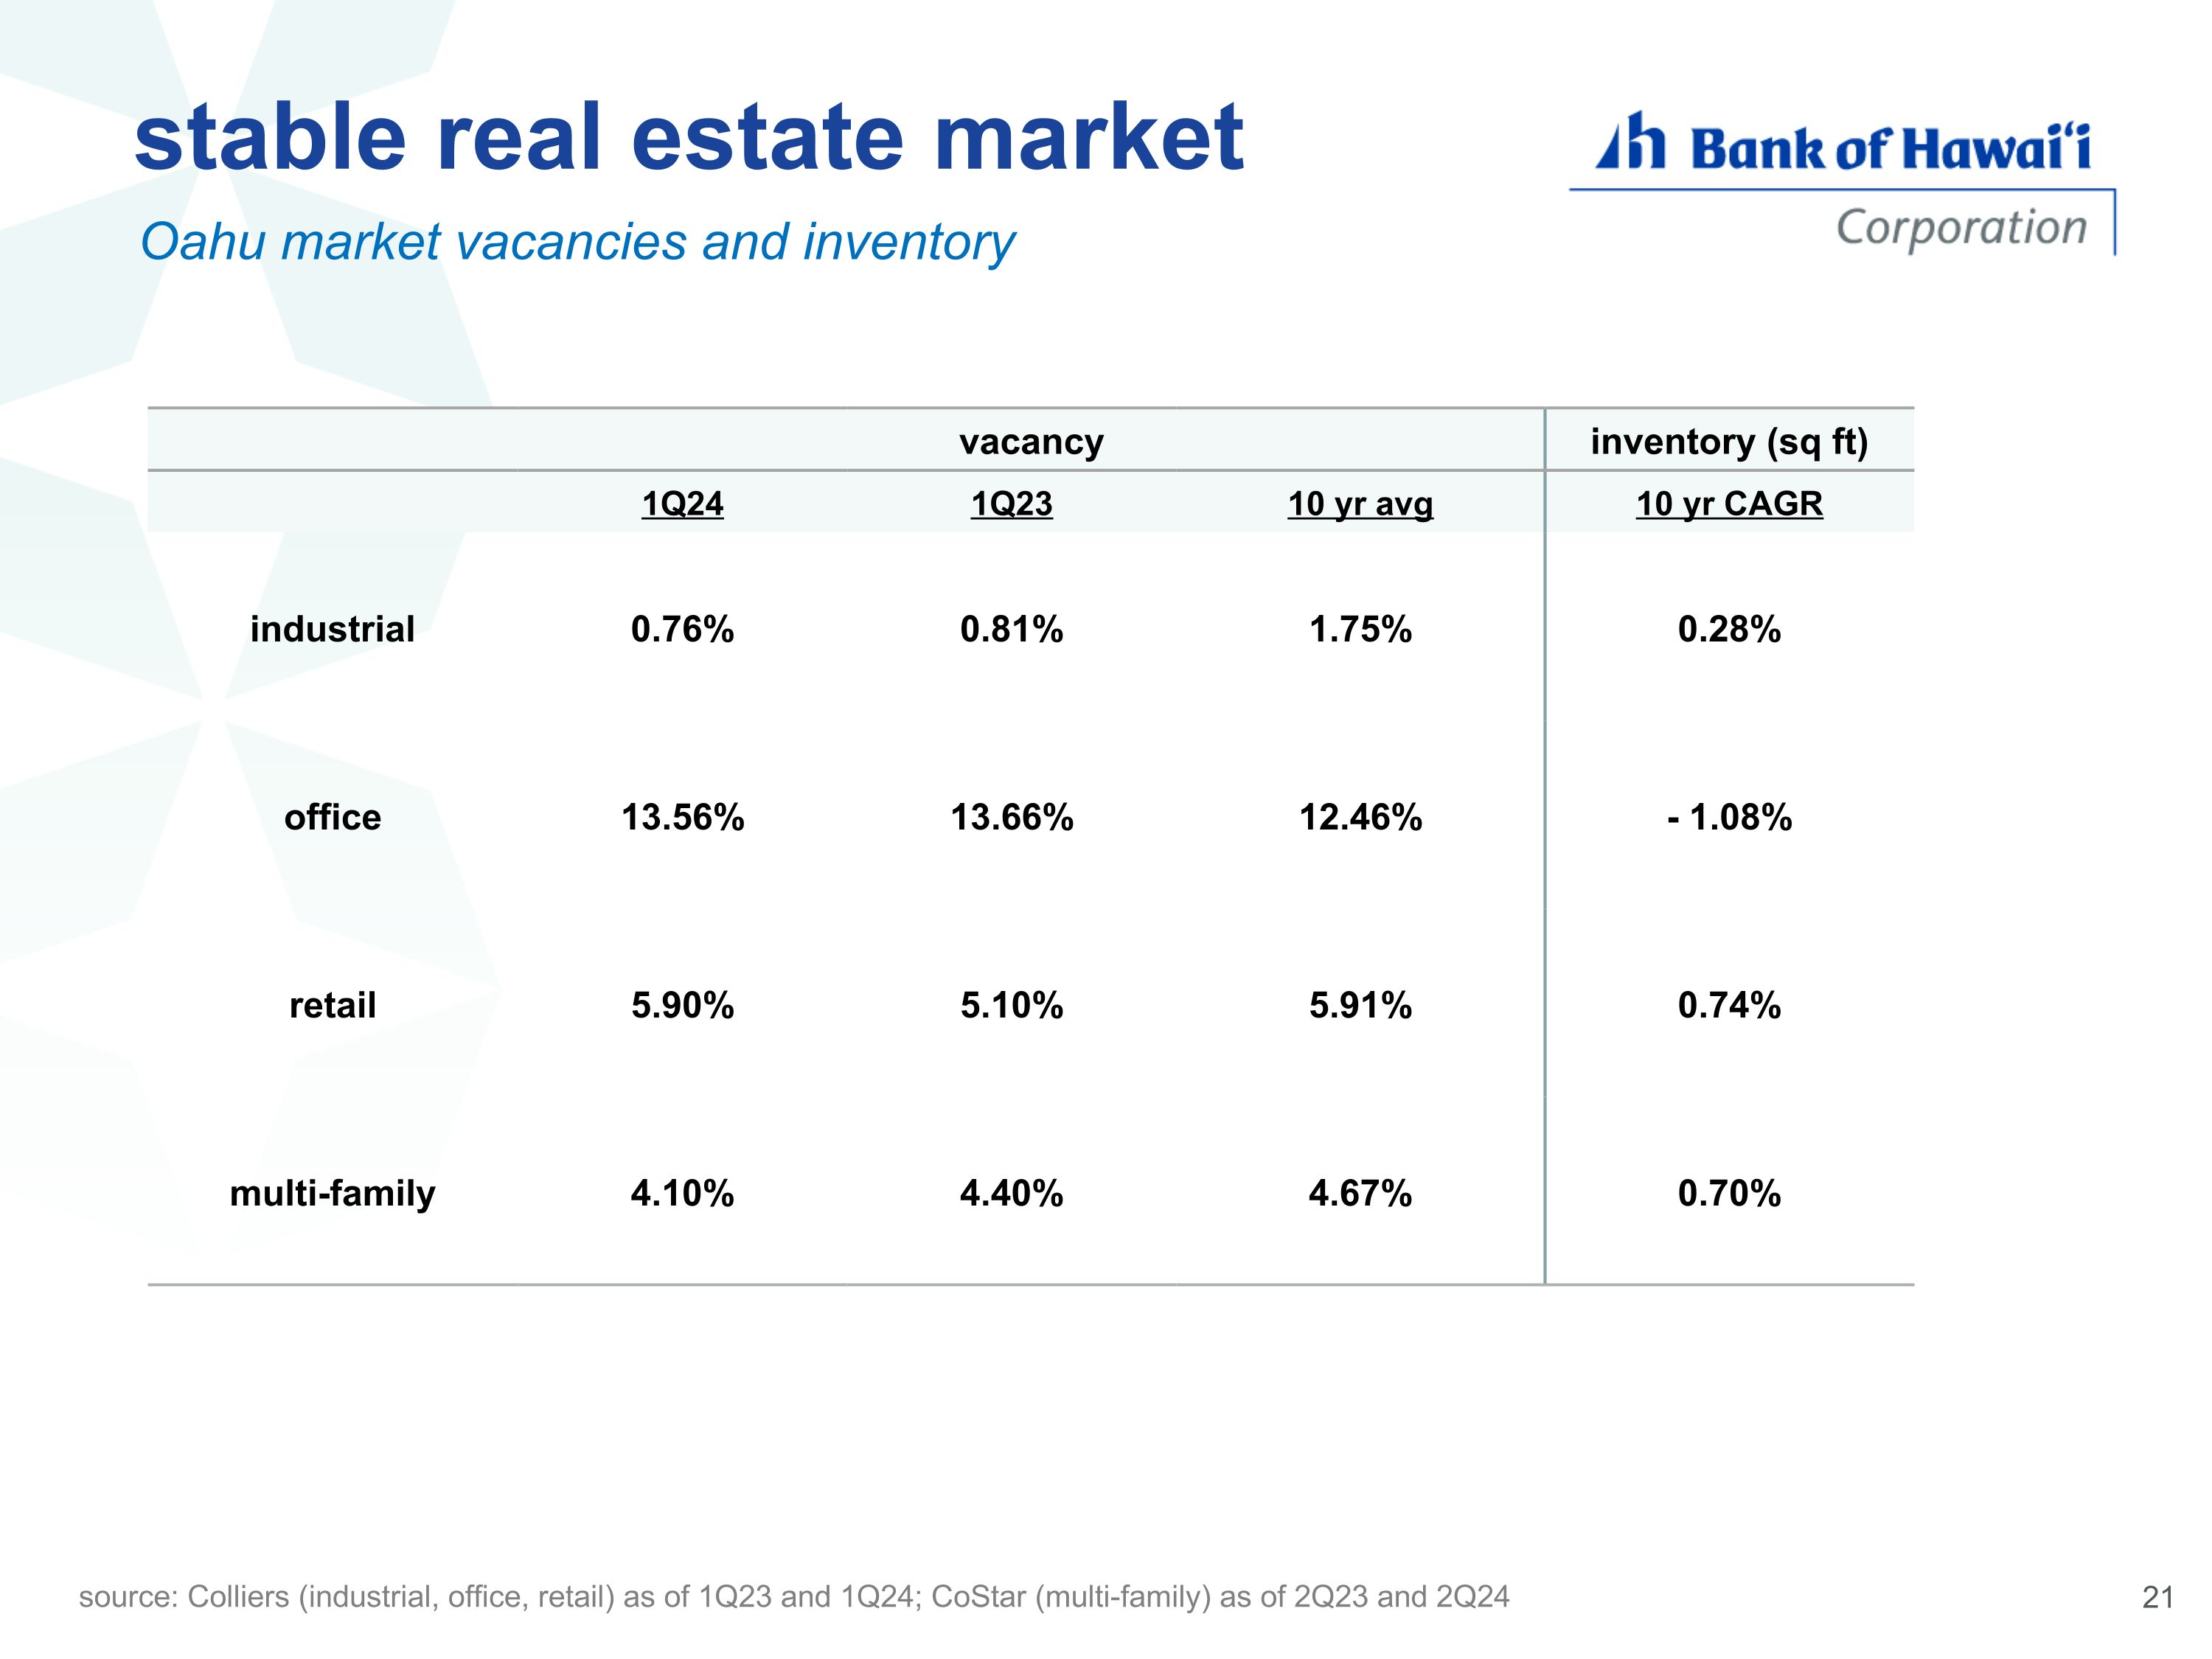
vacancy inventory (sq ft) 1Q24 1Q23 10 yr avg 10 yr CAGR industrial 0.76% 0.81% 1.75% 0.28% office 13.56% 13.66% 12.46% - 1.08% retail 5.90% 5.10% 5.91% 0.74% multi-family 4.10% 4.40% 4.67% 0.70% Oahu market vacancies and inventory source: Colliers (industrial, office, retail) as of 1Q23 and 1Q24; CoStar (multi-family) as of 2Q23 and 2Q24 stable real estate market
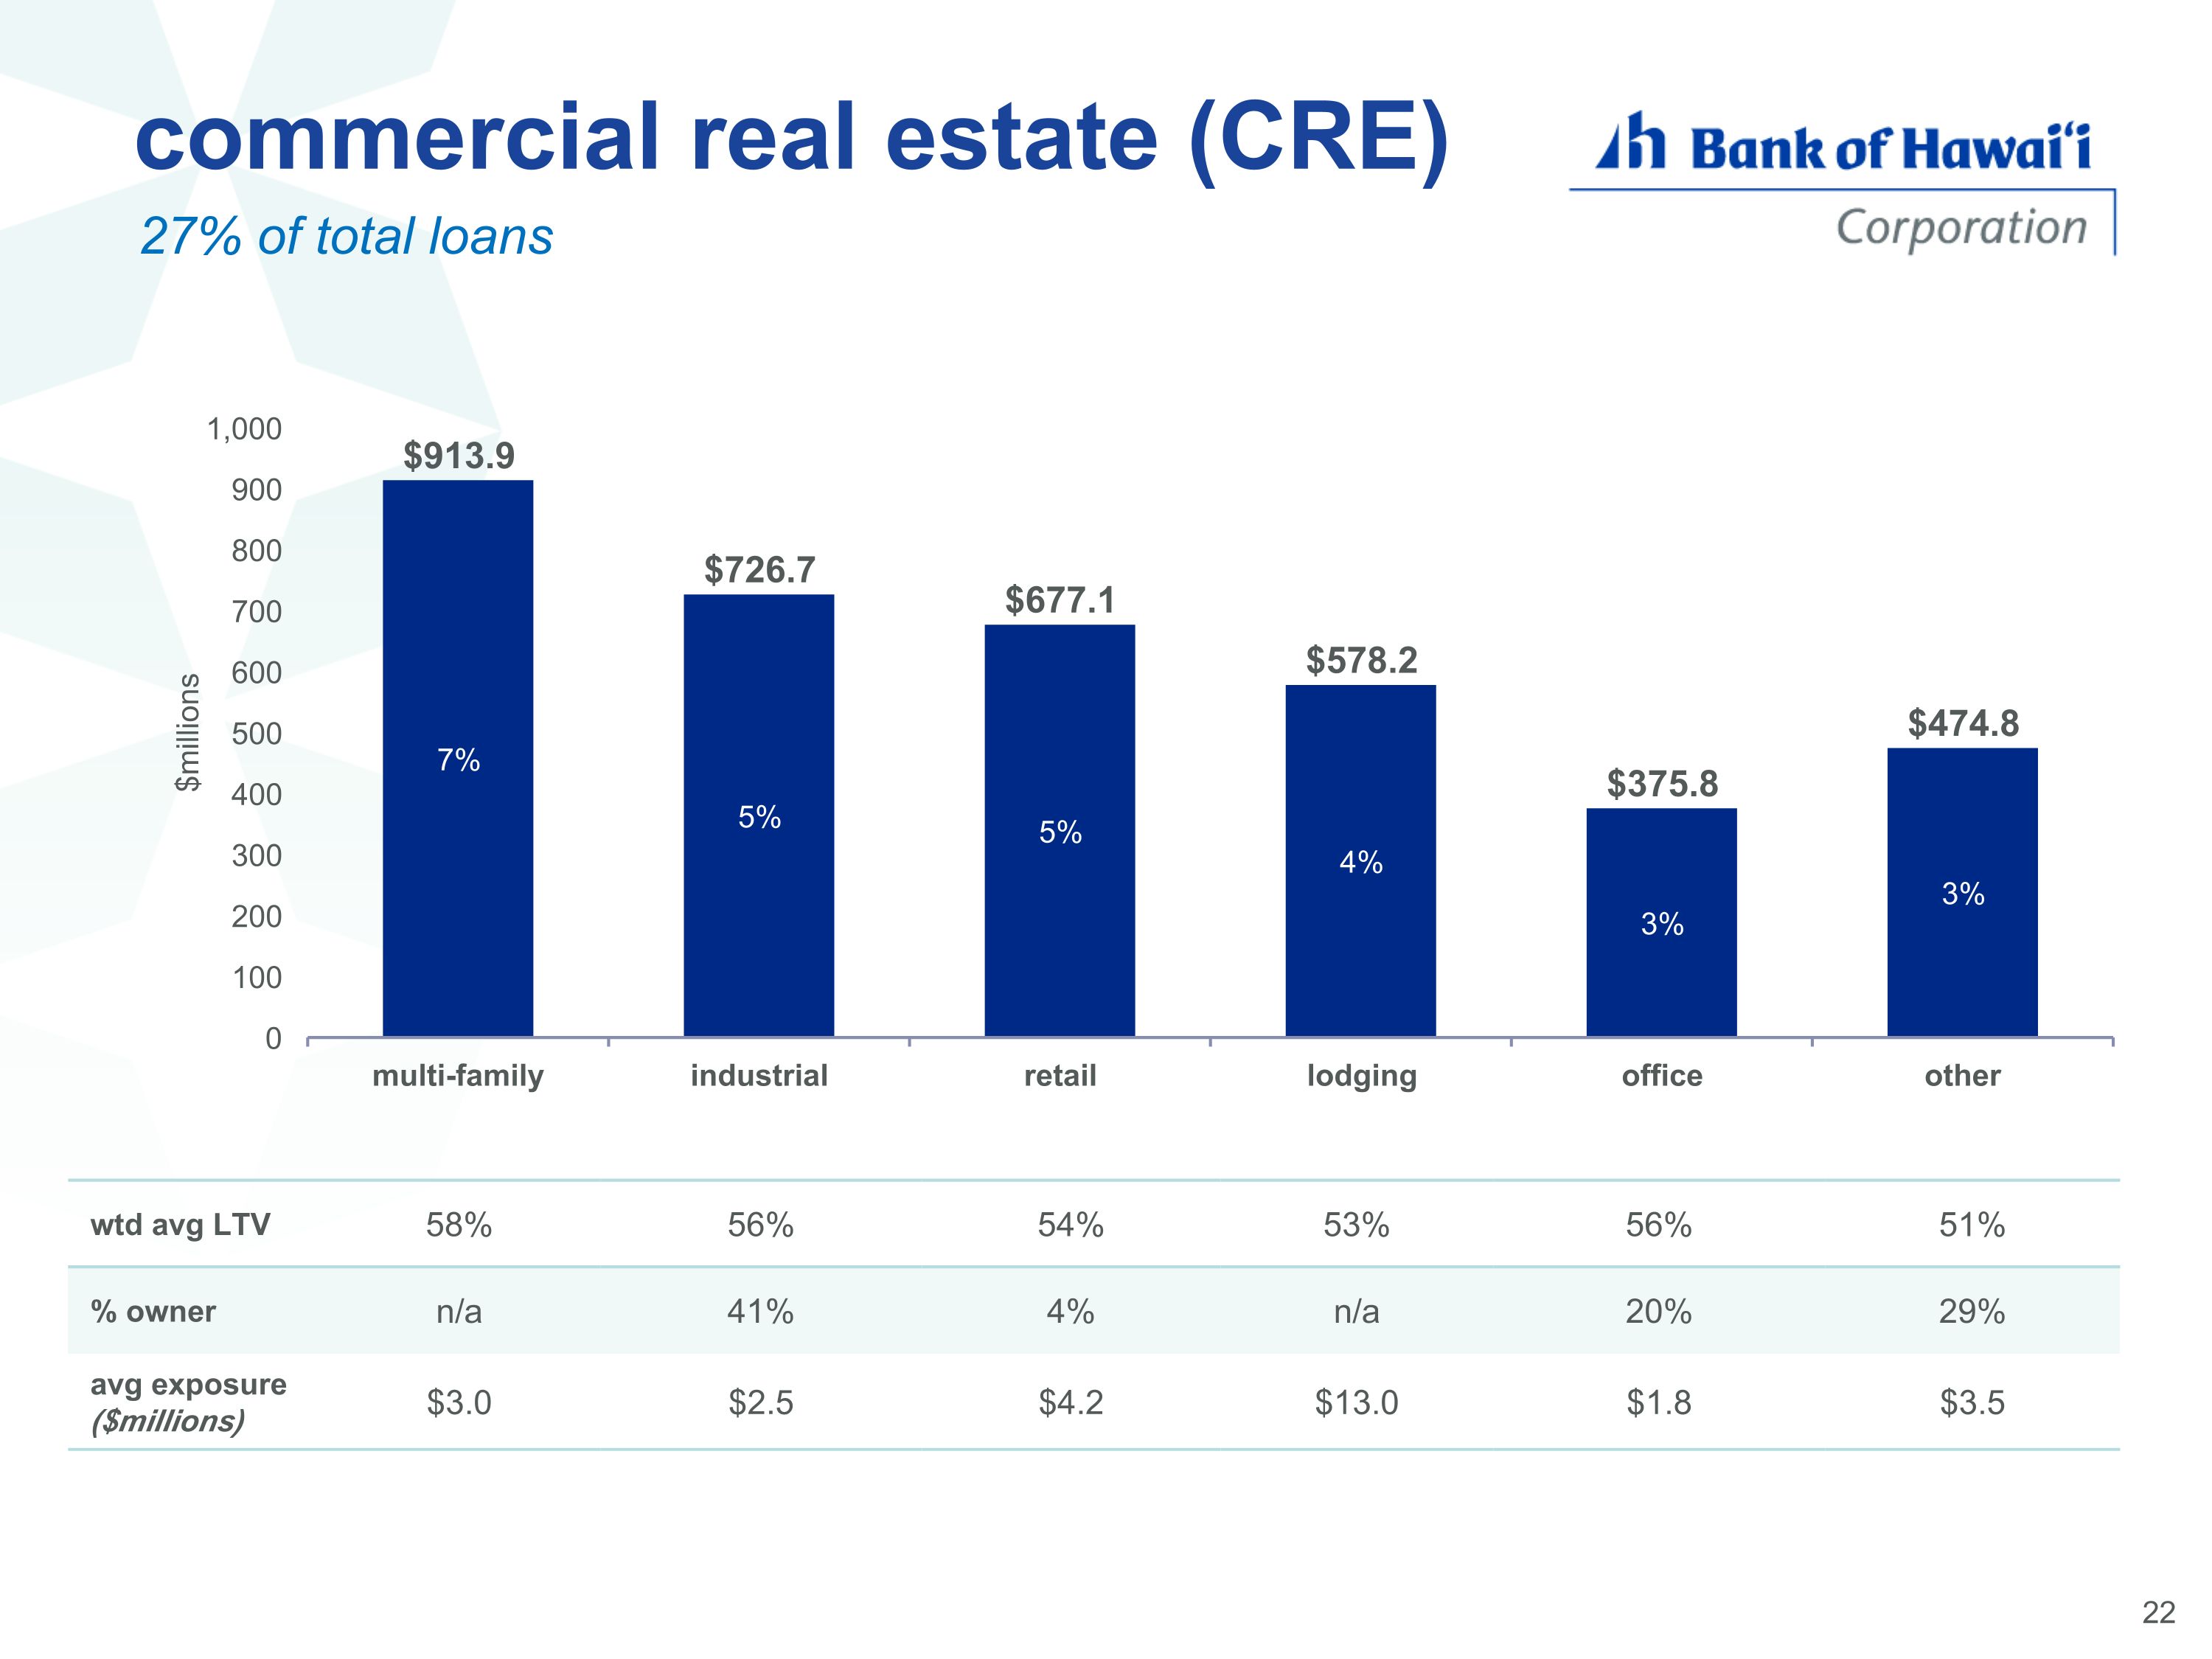
commercial real estate (CRE) 27% of total loans wtd avg LTV 58% 56% 54% 53% 56% 51% % owner n/a 41% 4% n/a 20% 29% avg exposure ($millions) $3.0 $2.5 $4.2 $13.0 $1.8 $3.5
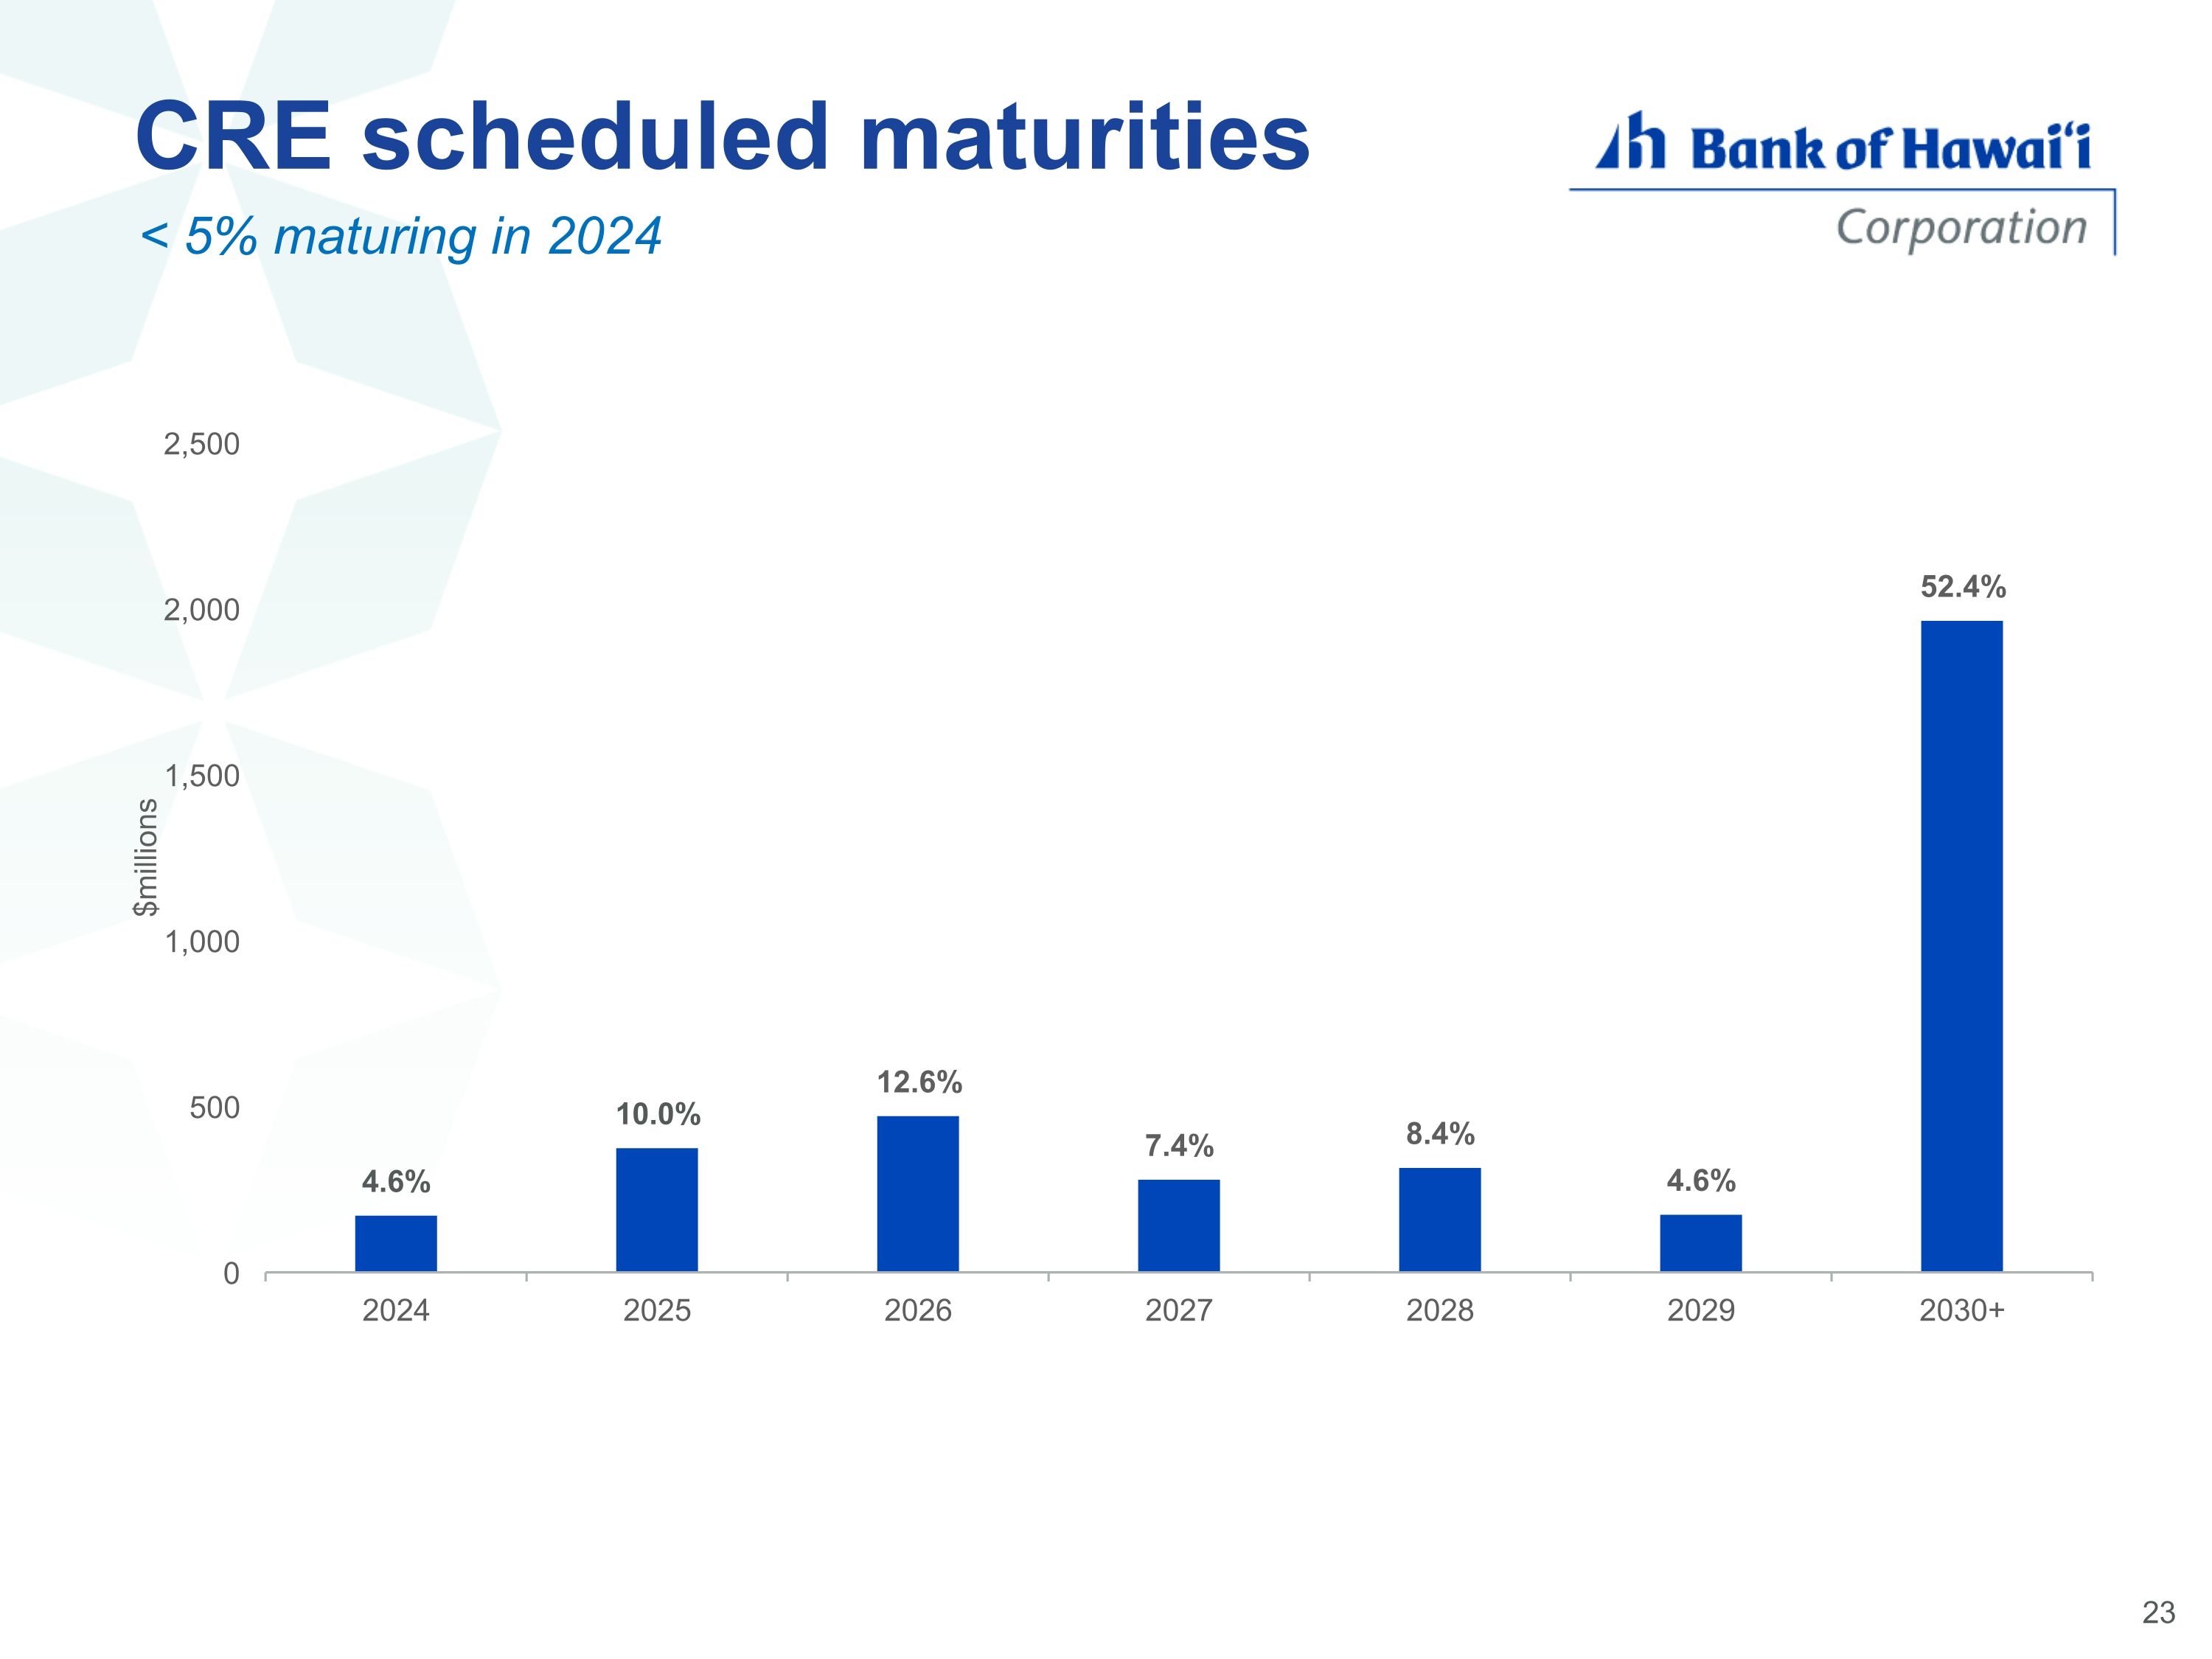
CRE scheduled maturities < 5% maturing in 2024
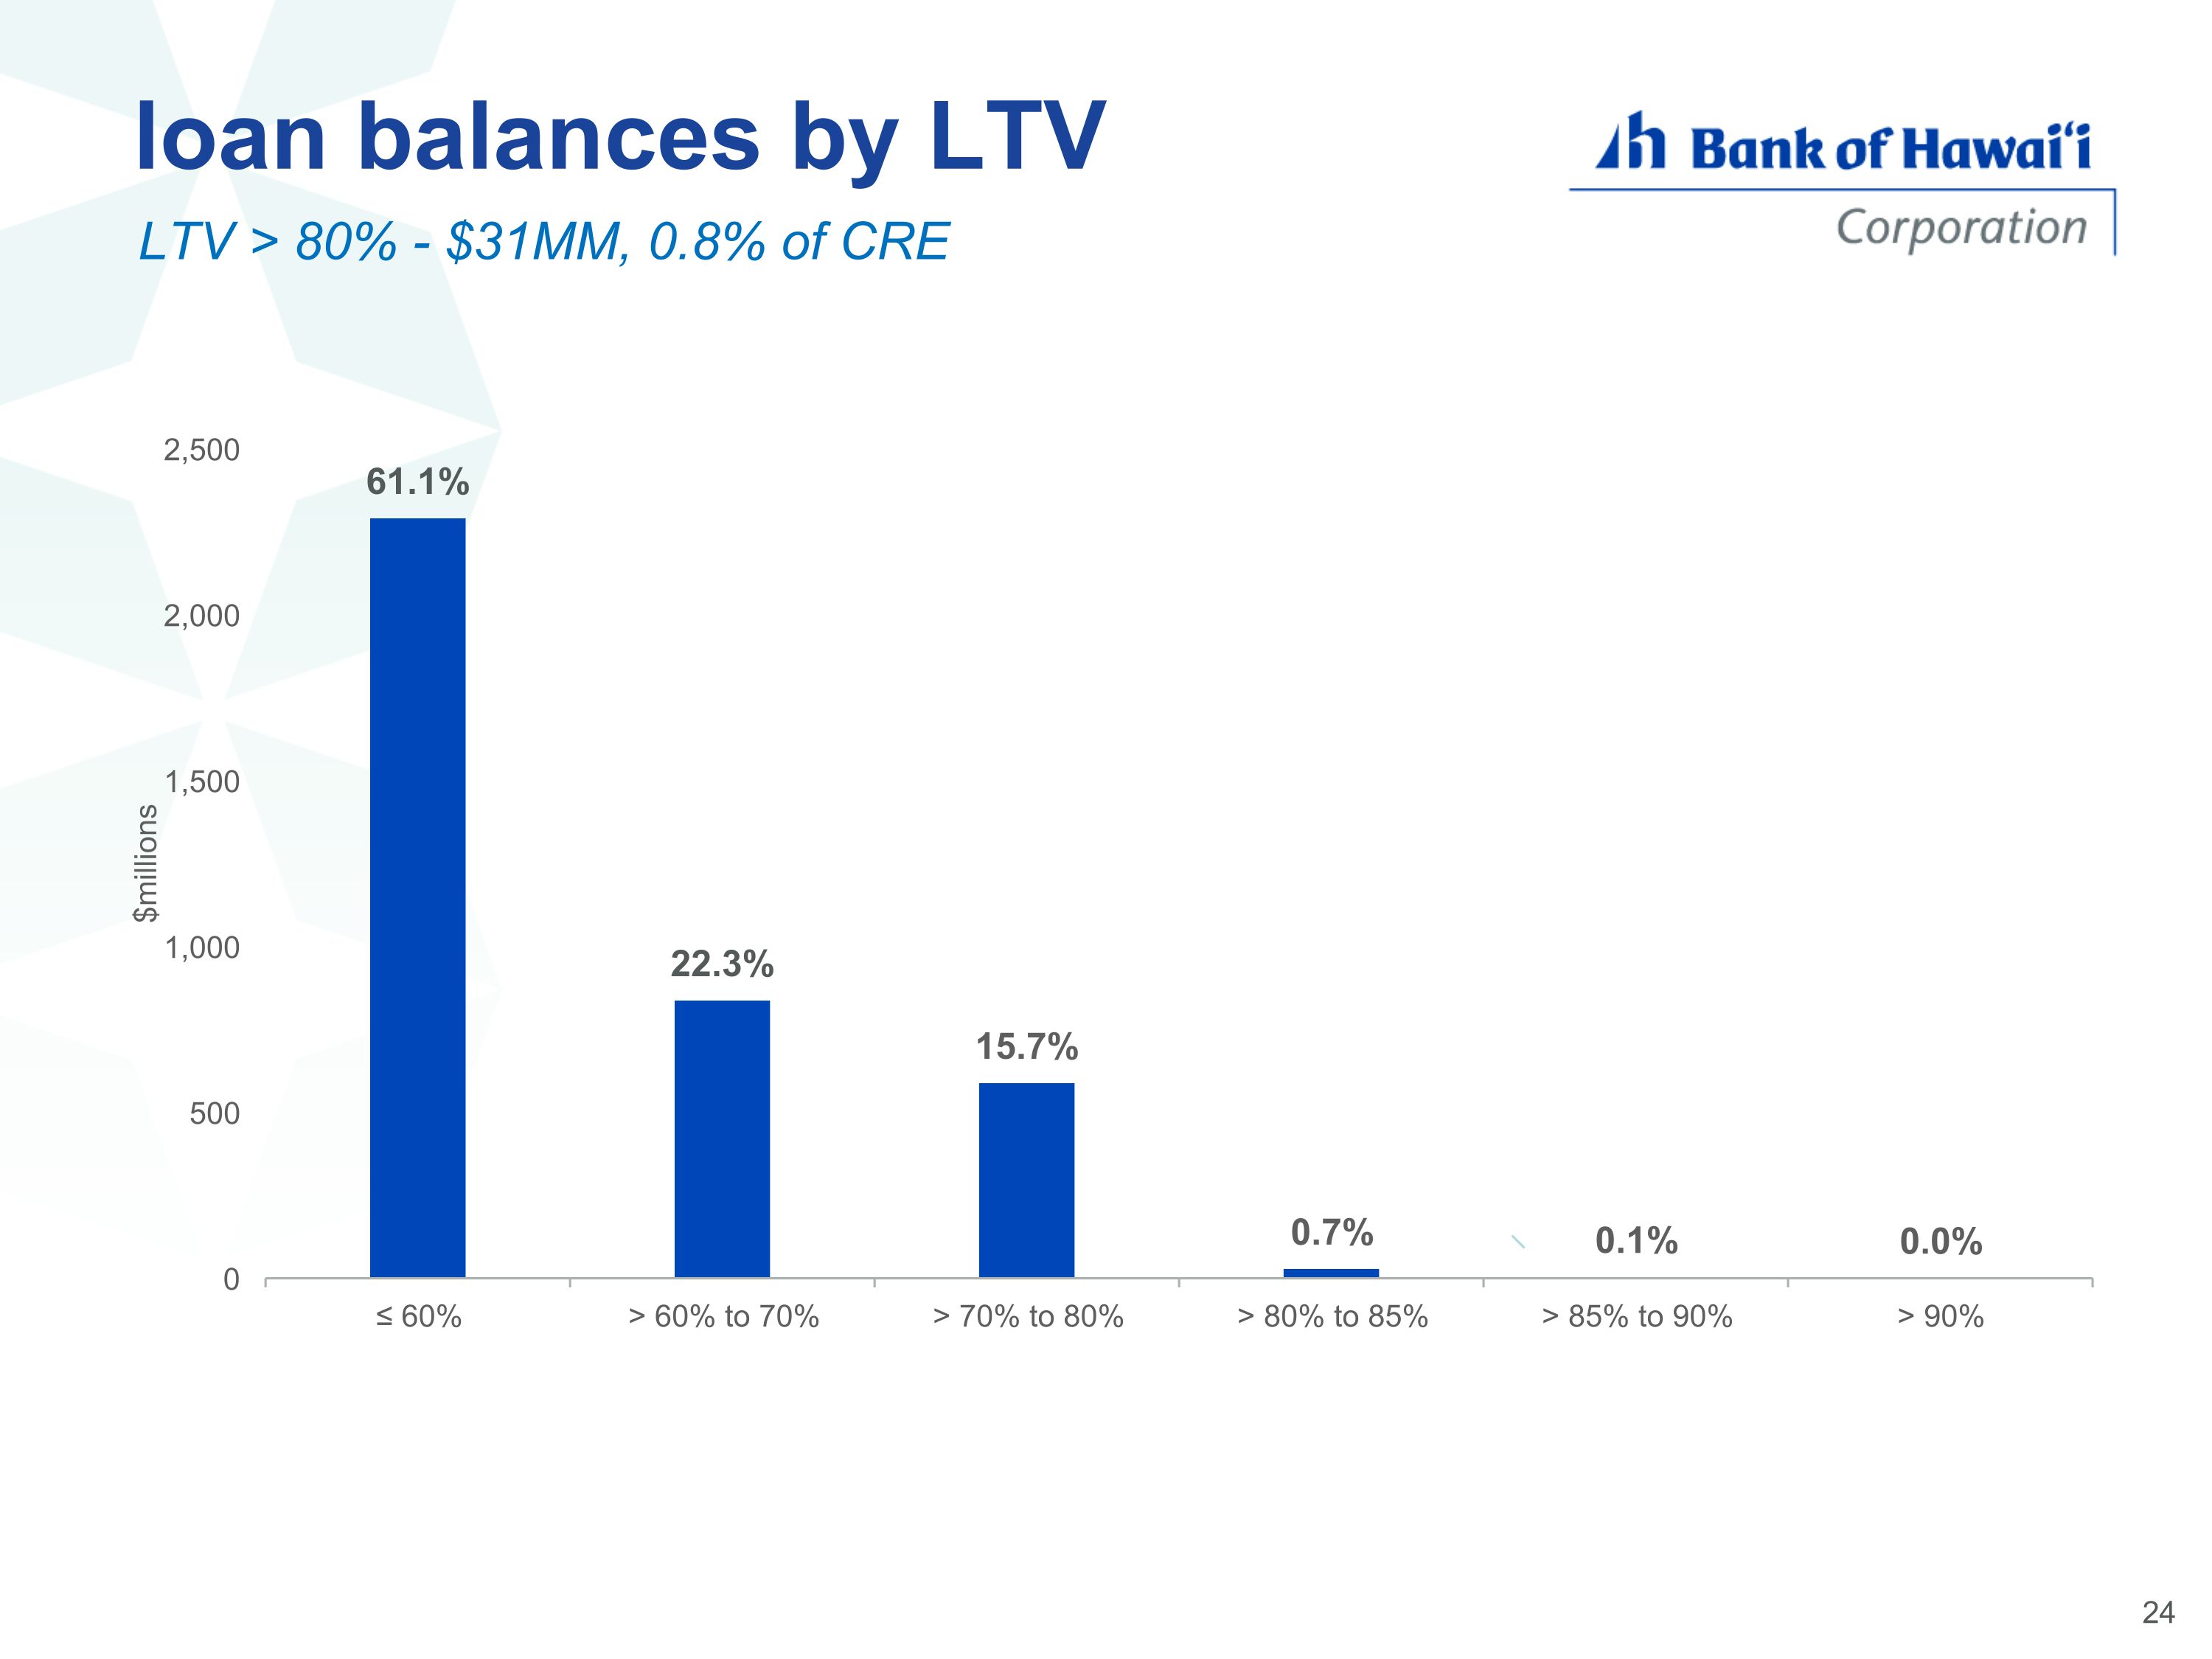
loan balances by LTV LTV > 80% - $31MM, 0.8% of CRE
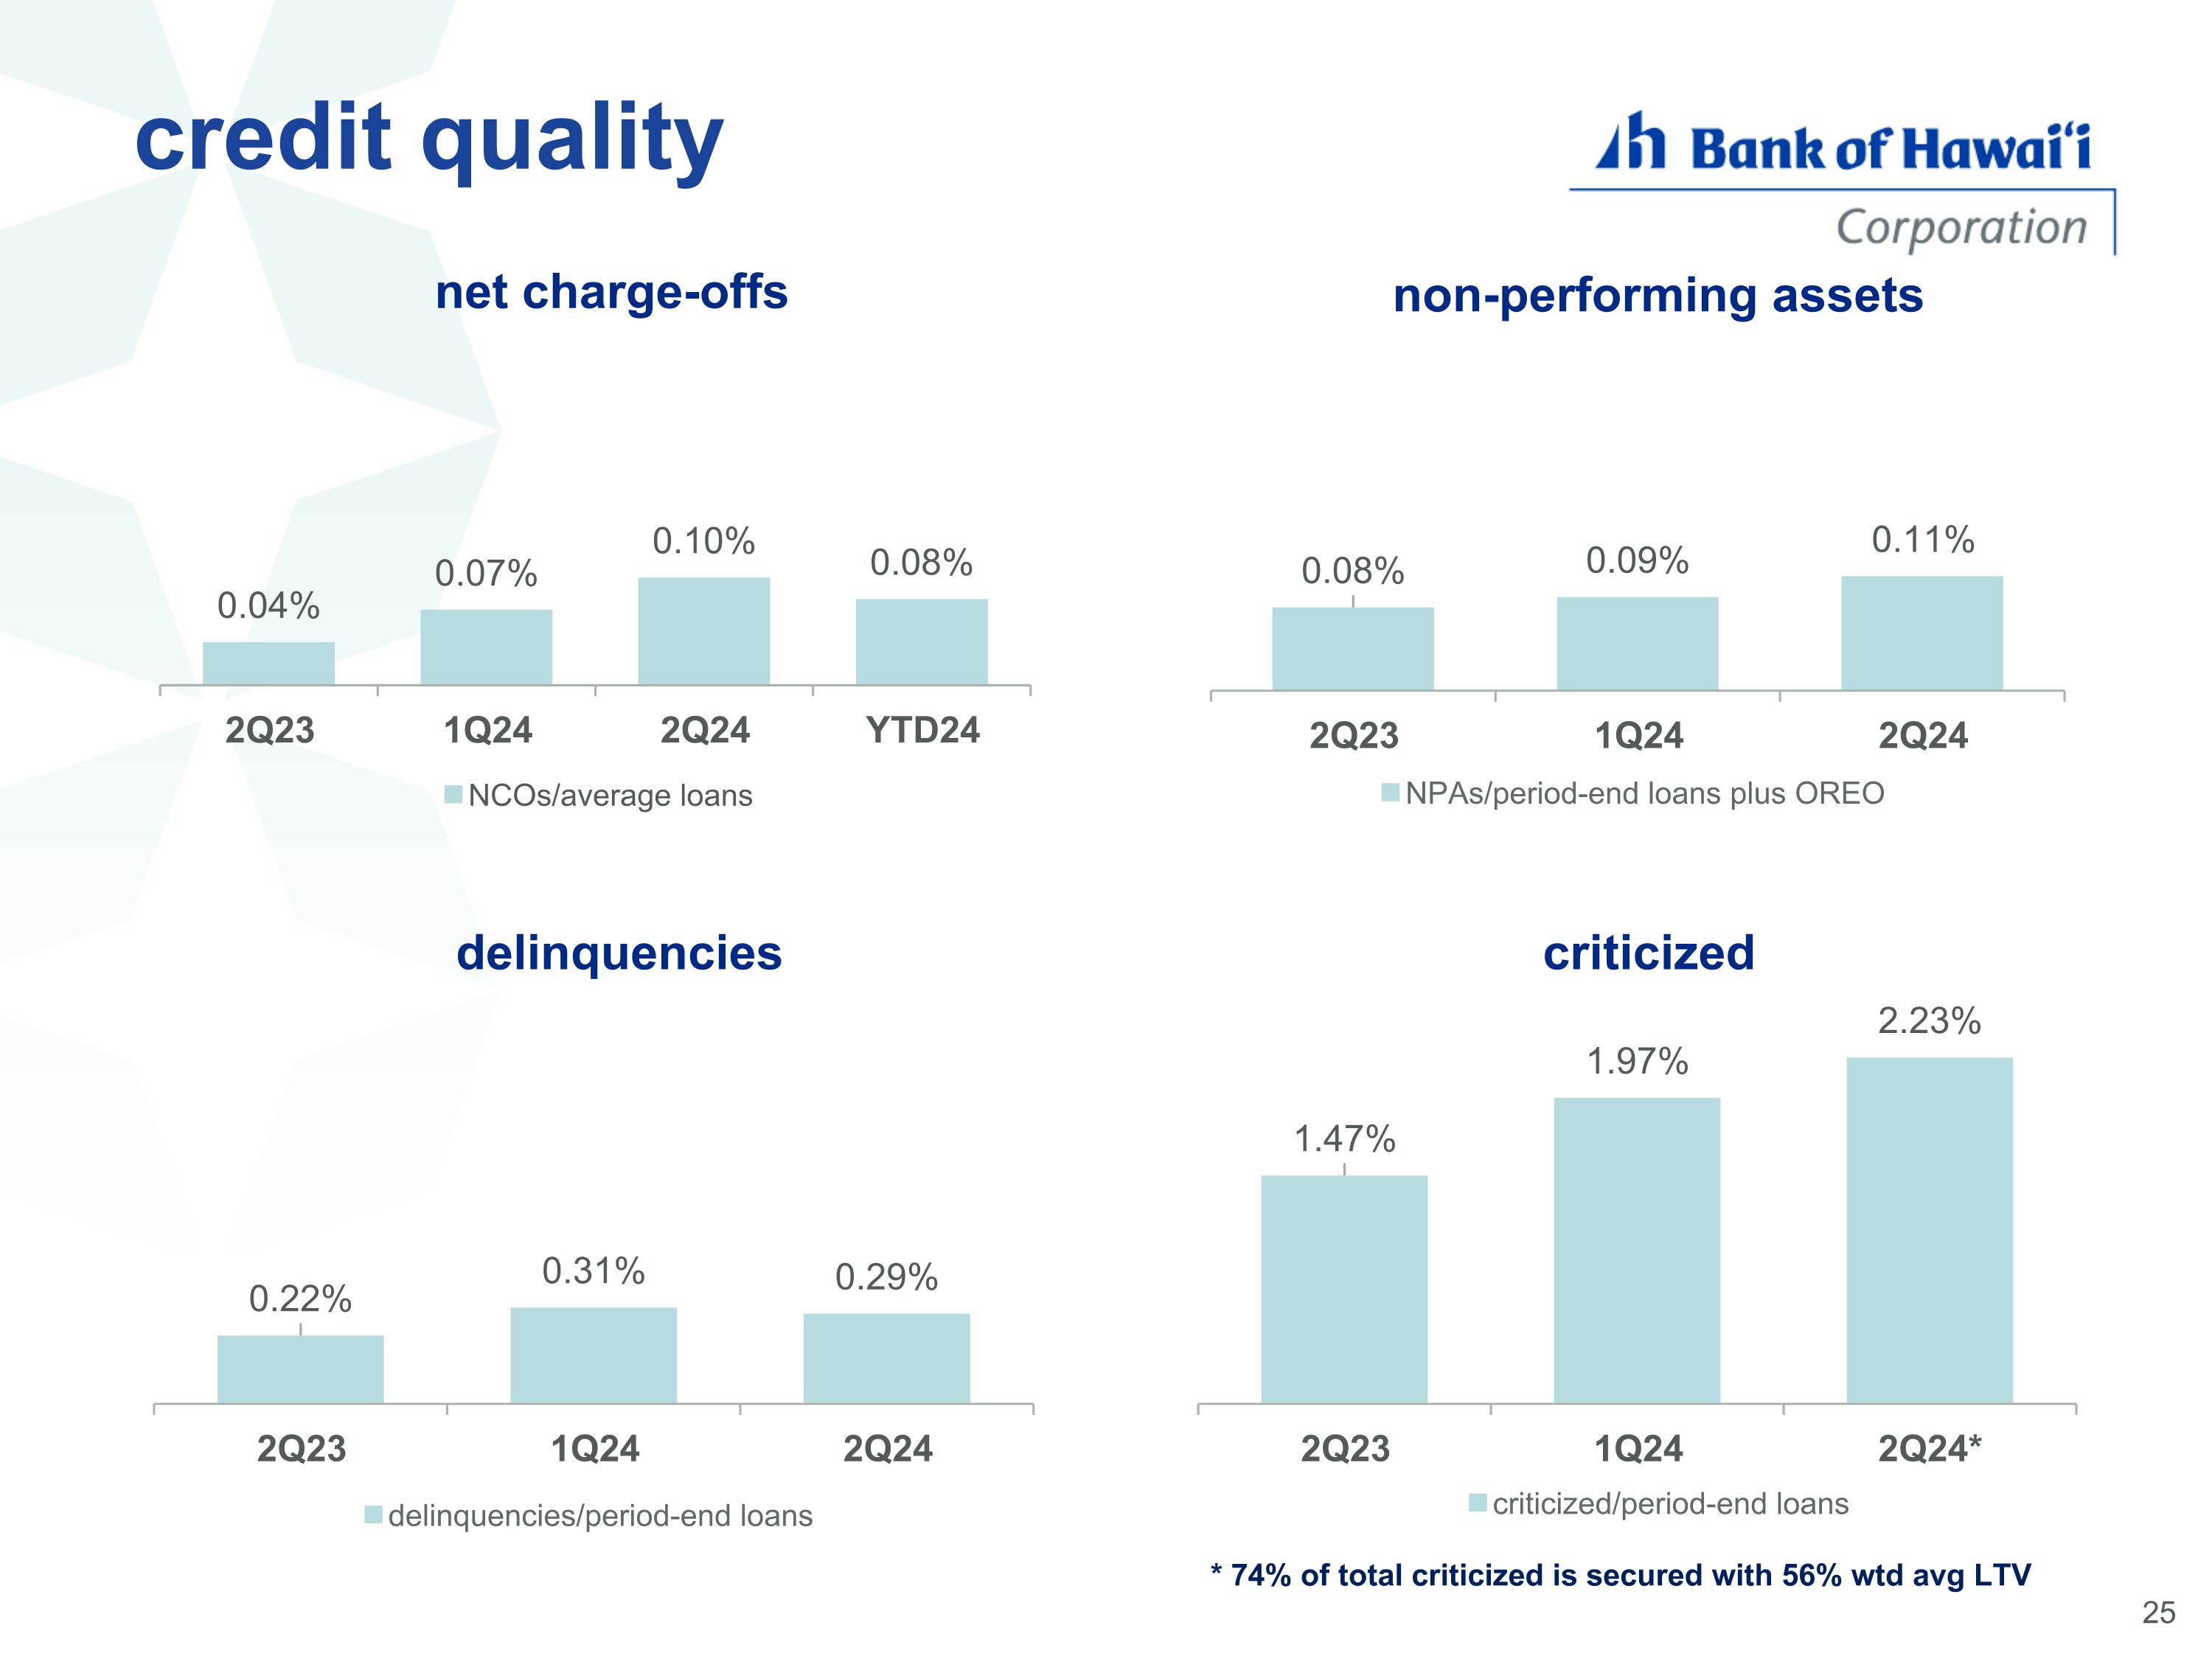
credit quality * 74% of total criticized is secured with 56% wtd avg LTV
financial update
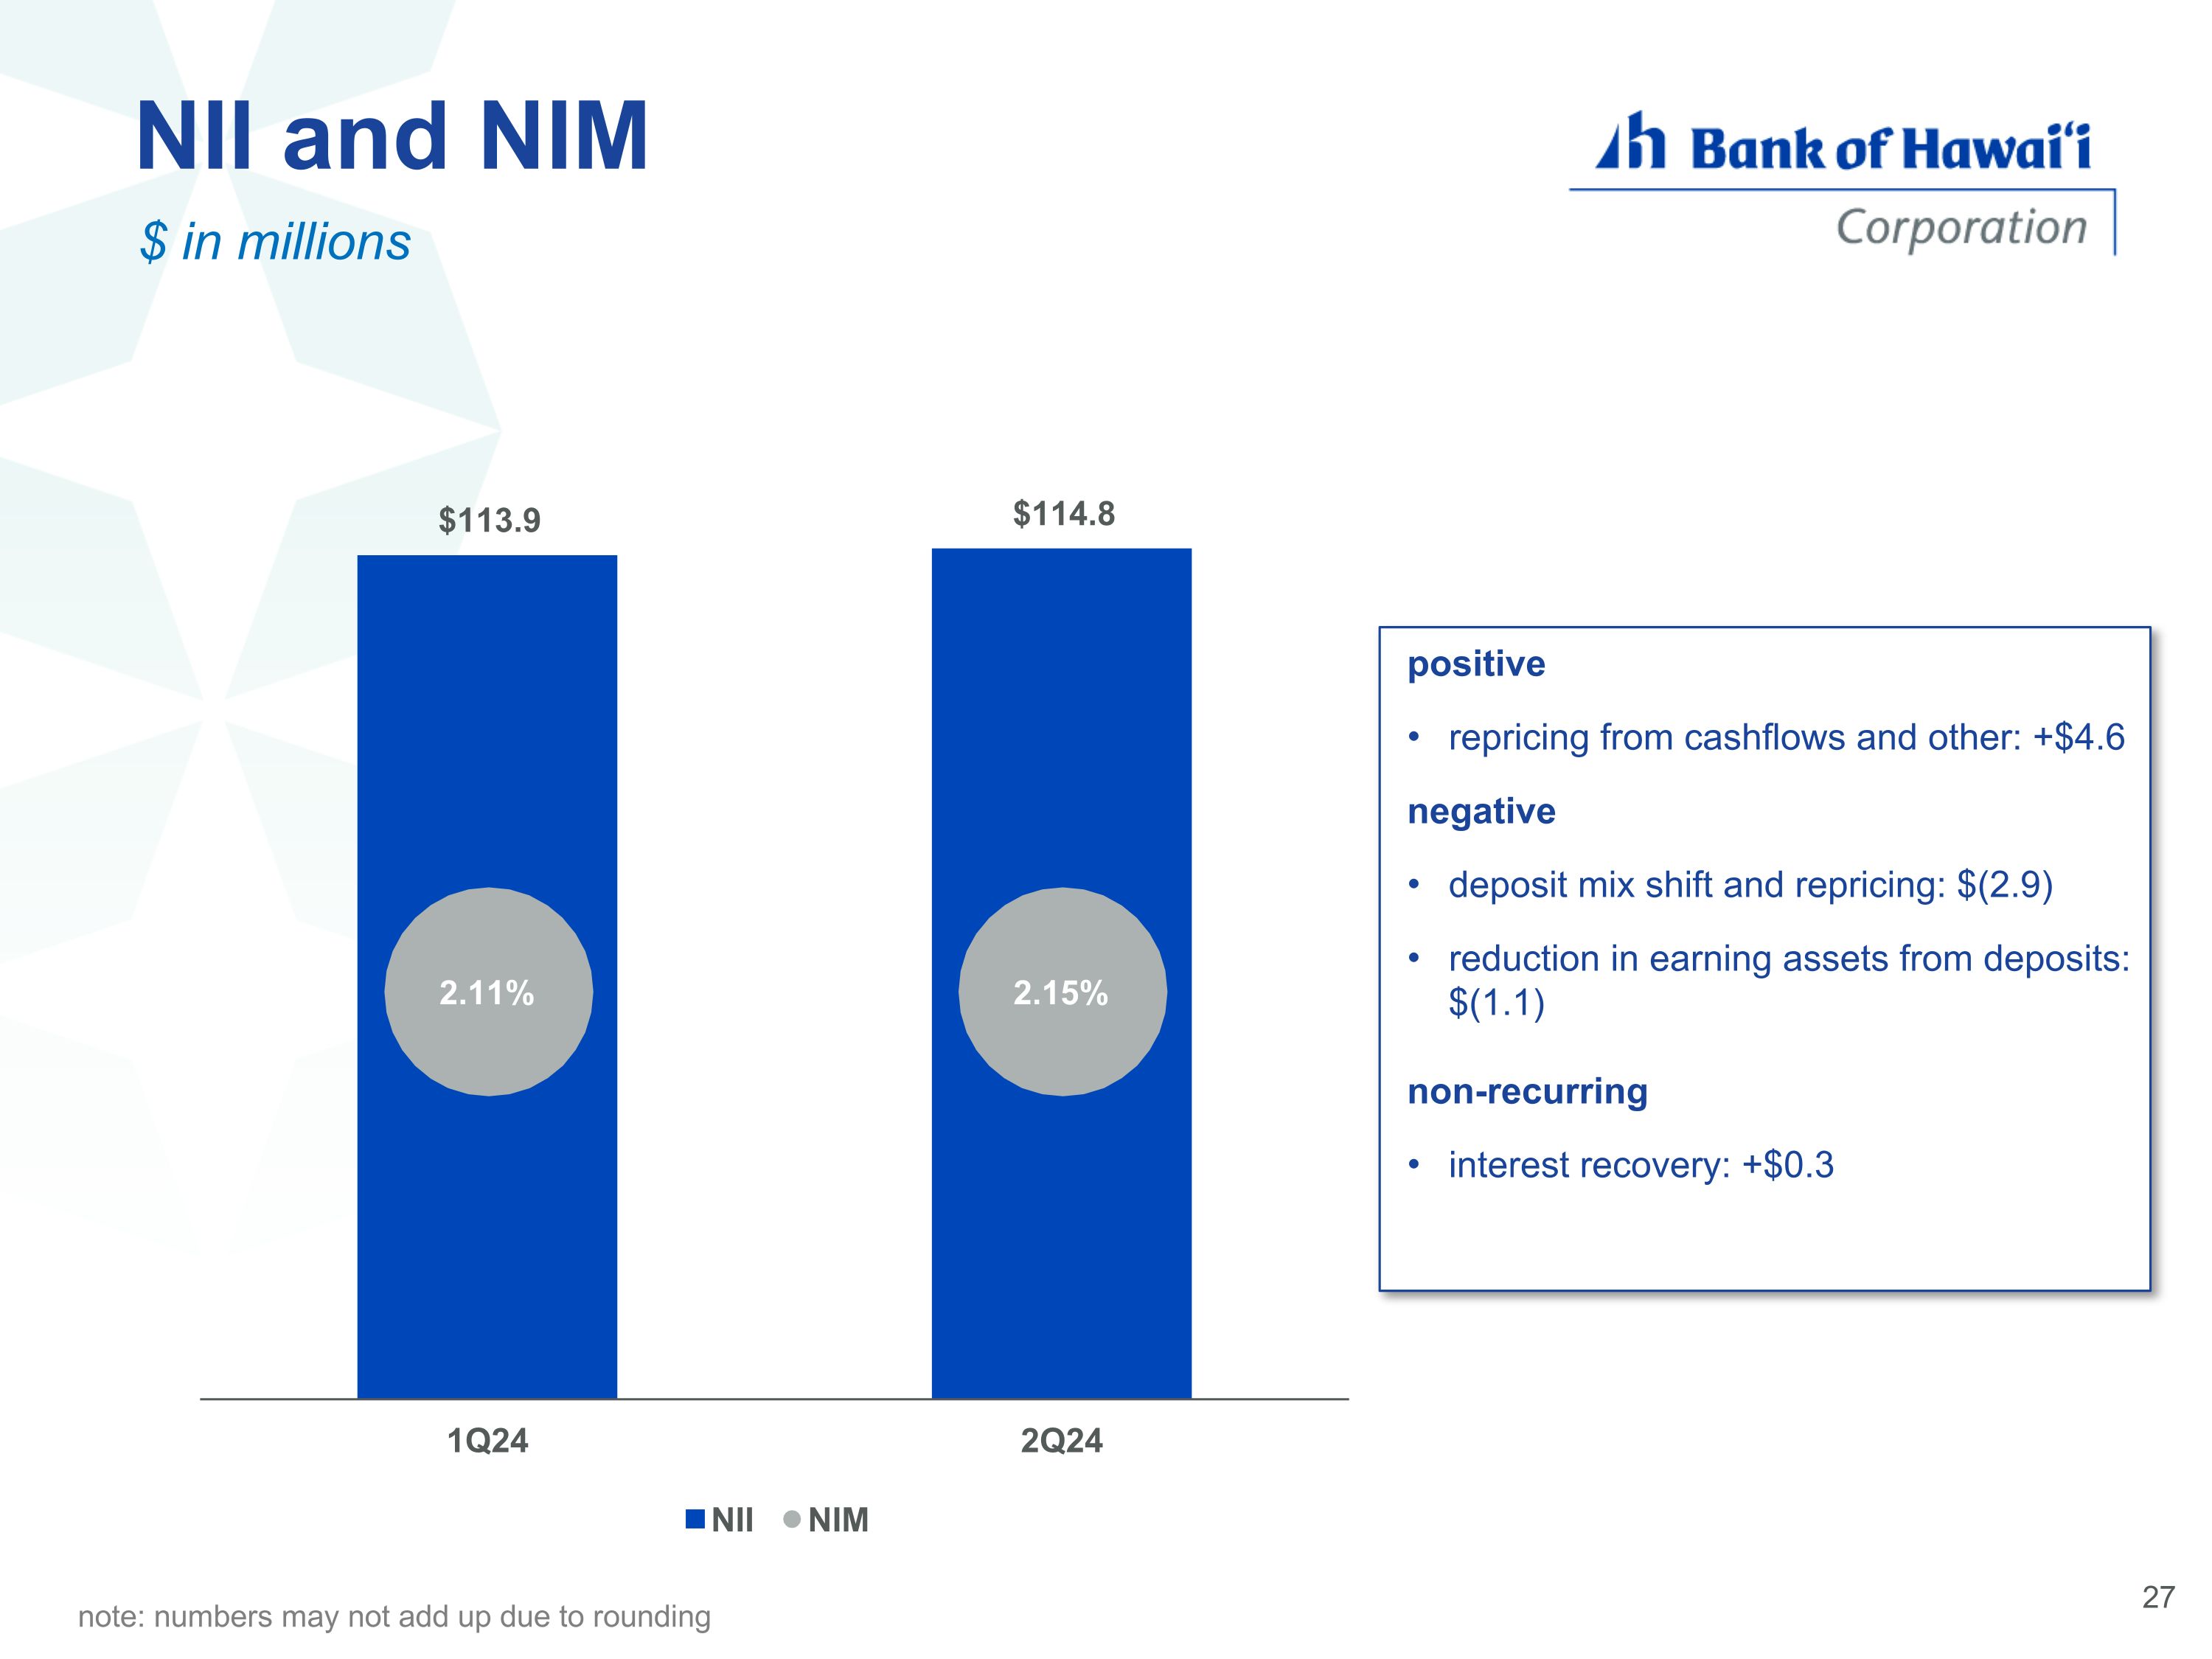
$ in millions NII and NIM positive repricing from cashflows and other: +$4.6 negative deposit mix shift and repricing: $(2.9) reduction in earning assets from deposits: $(1.1) non-recurring interest recovery: +$0.3 2.11% 2.15% note: numbers may not add up due to rounding
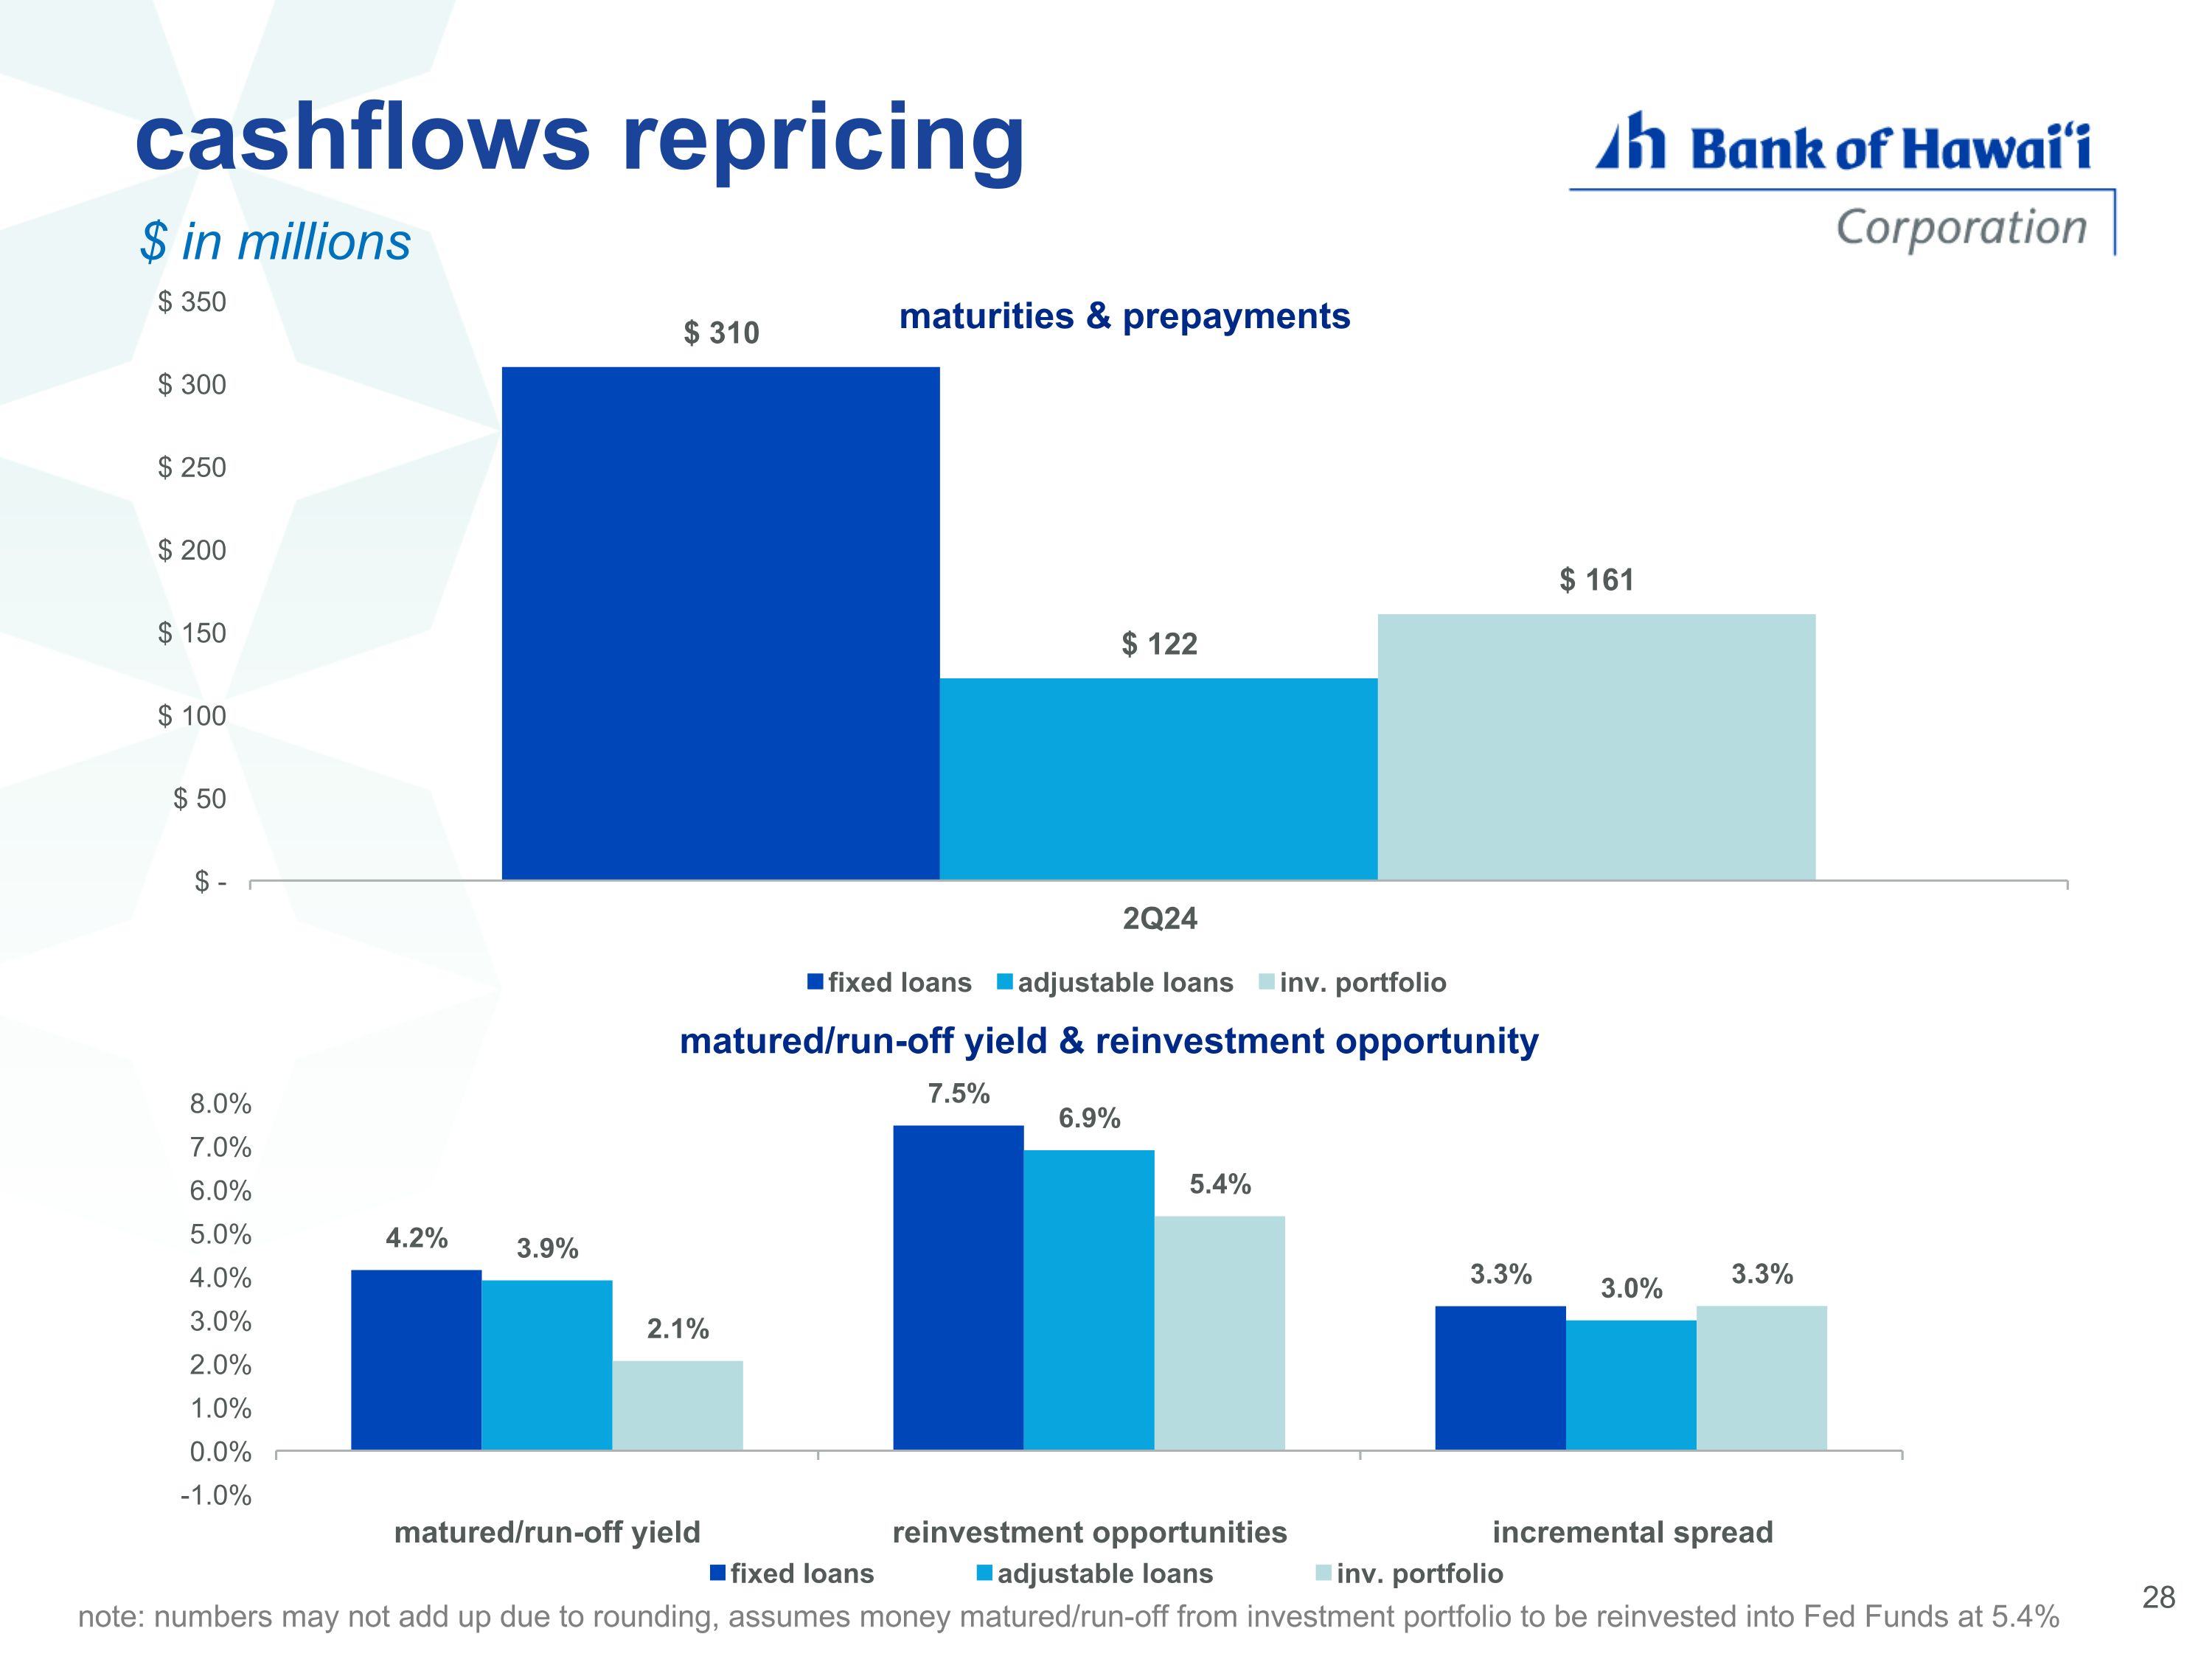
cashflows repricing note: numbers may not add up due to rounding, assumes money matured/run-off from investment portfolio to be reinvested into Fed Funds at 5.4% $ in millions
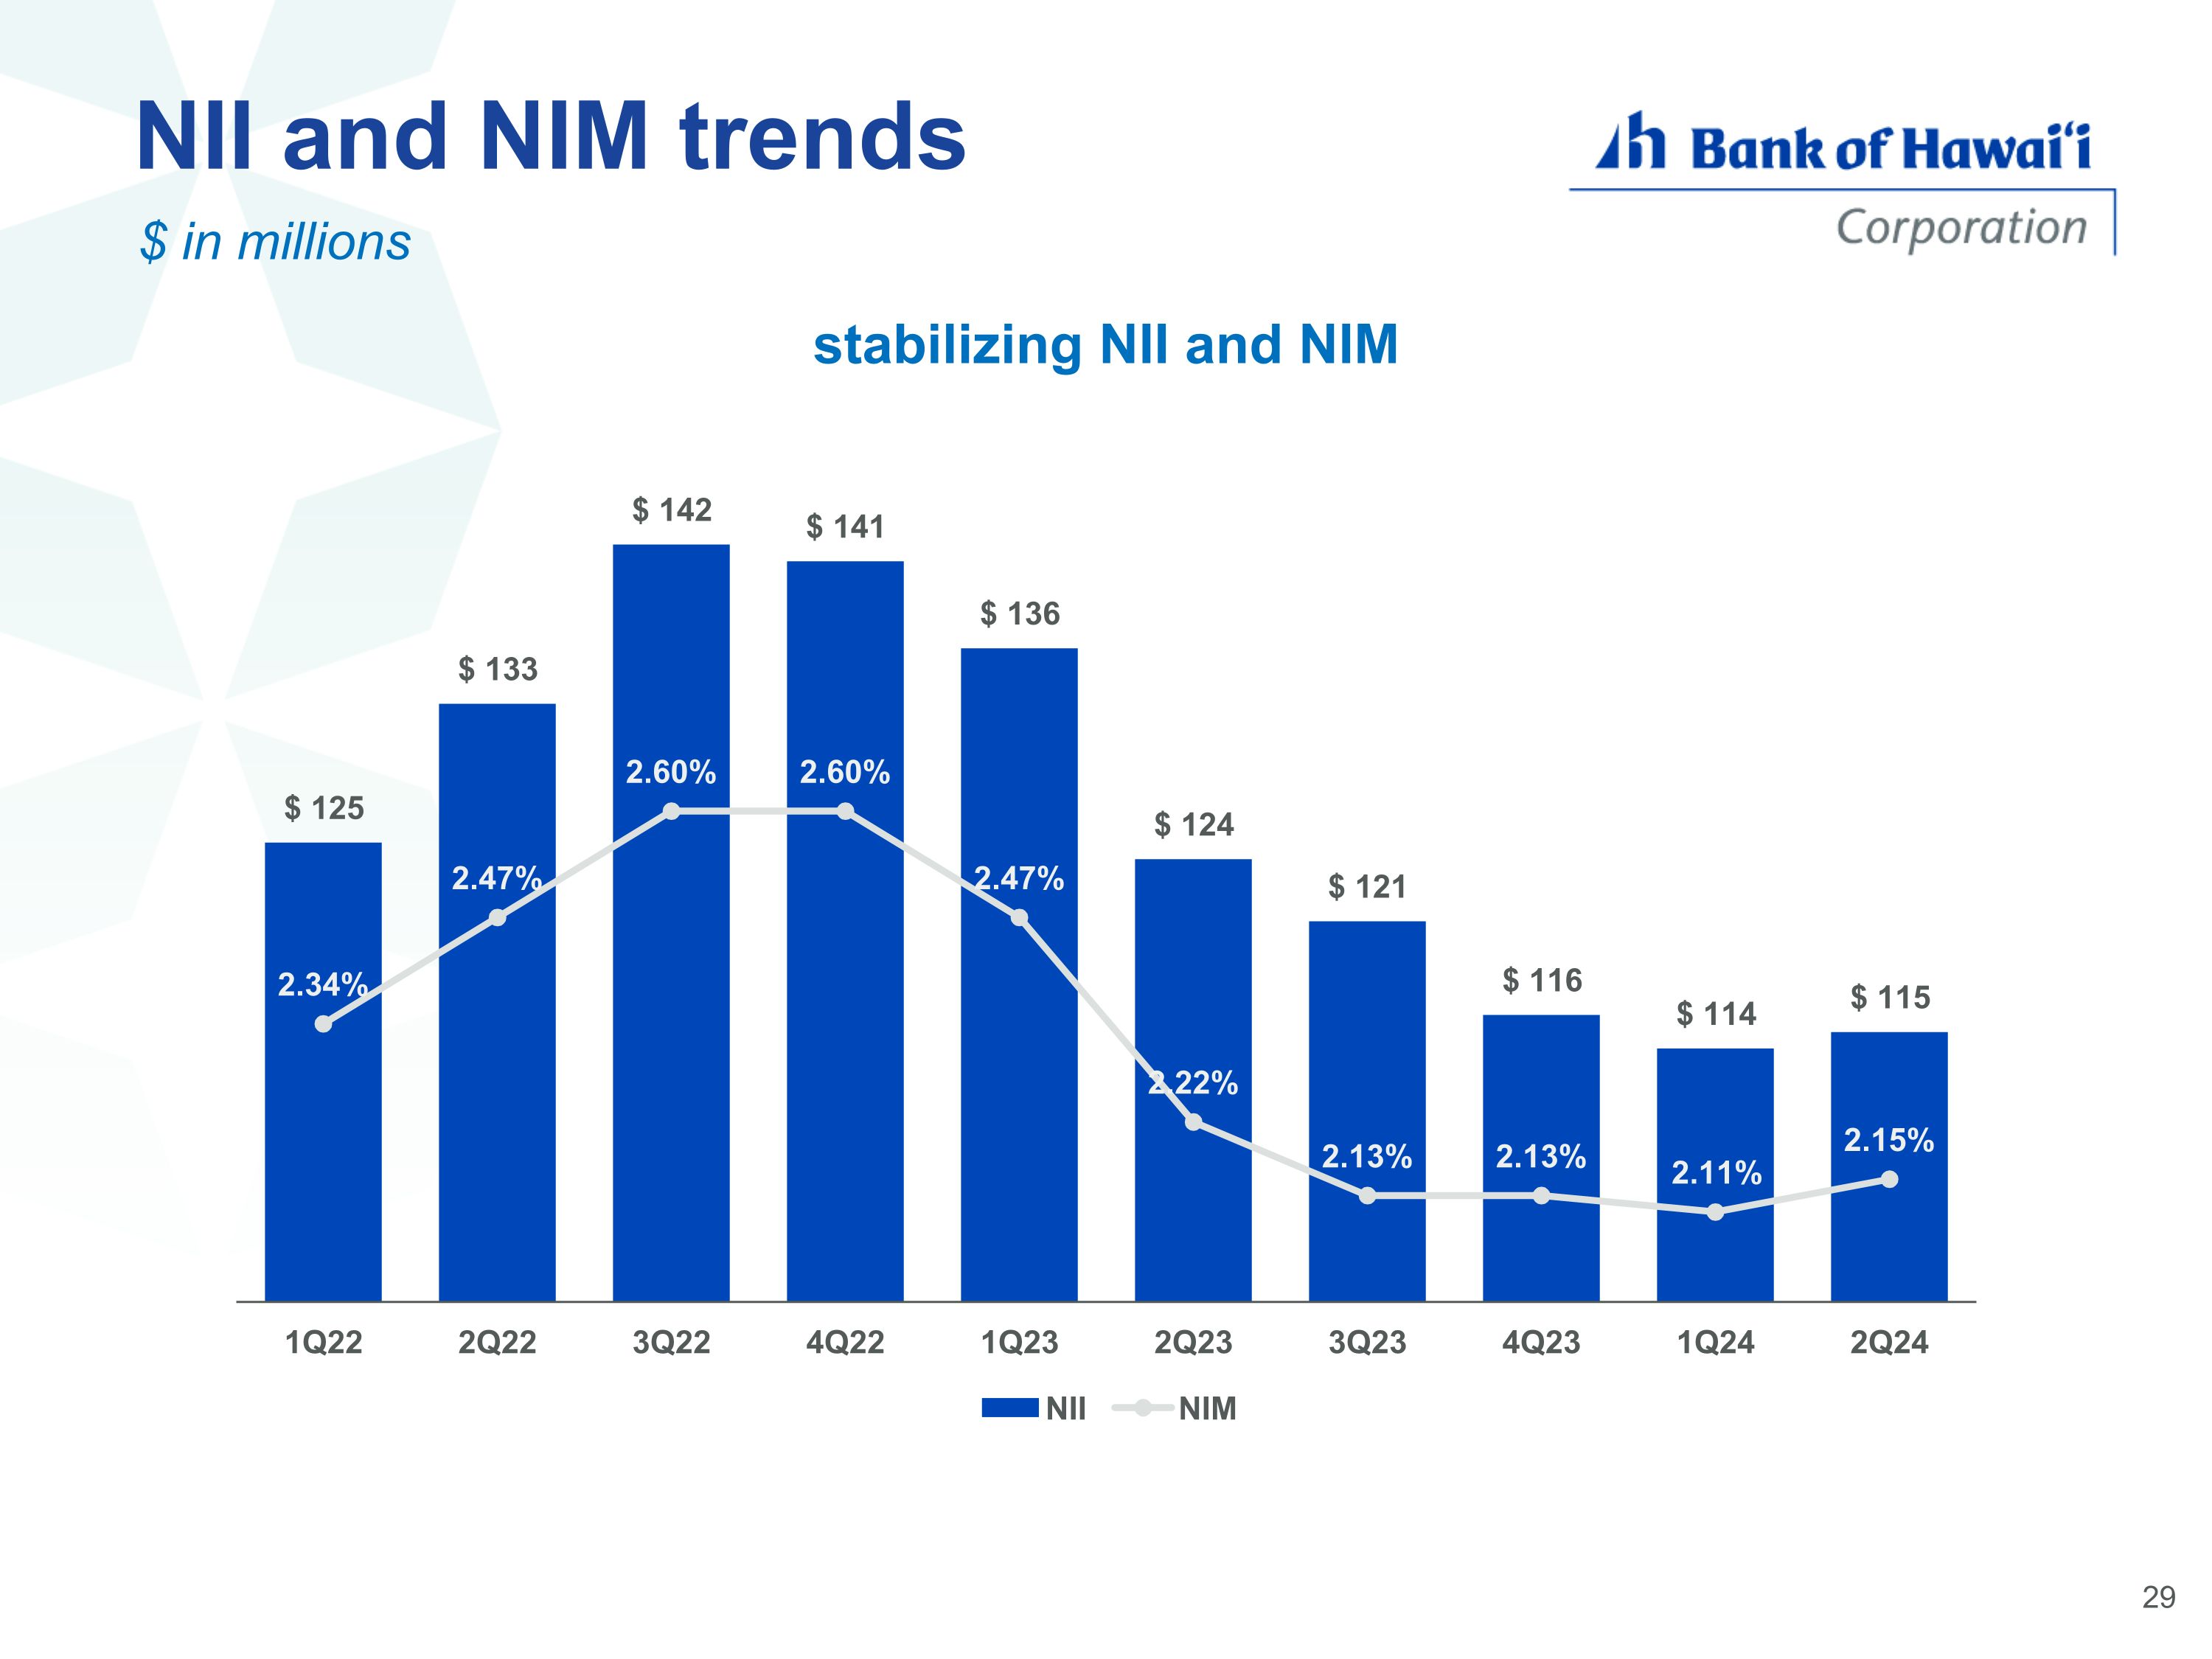
NII and NIM trends stabilizing NII and NIM $ in millions
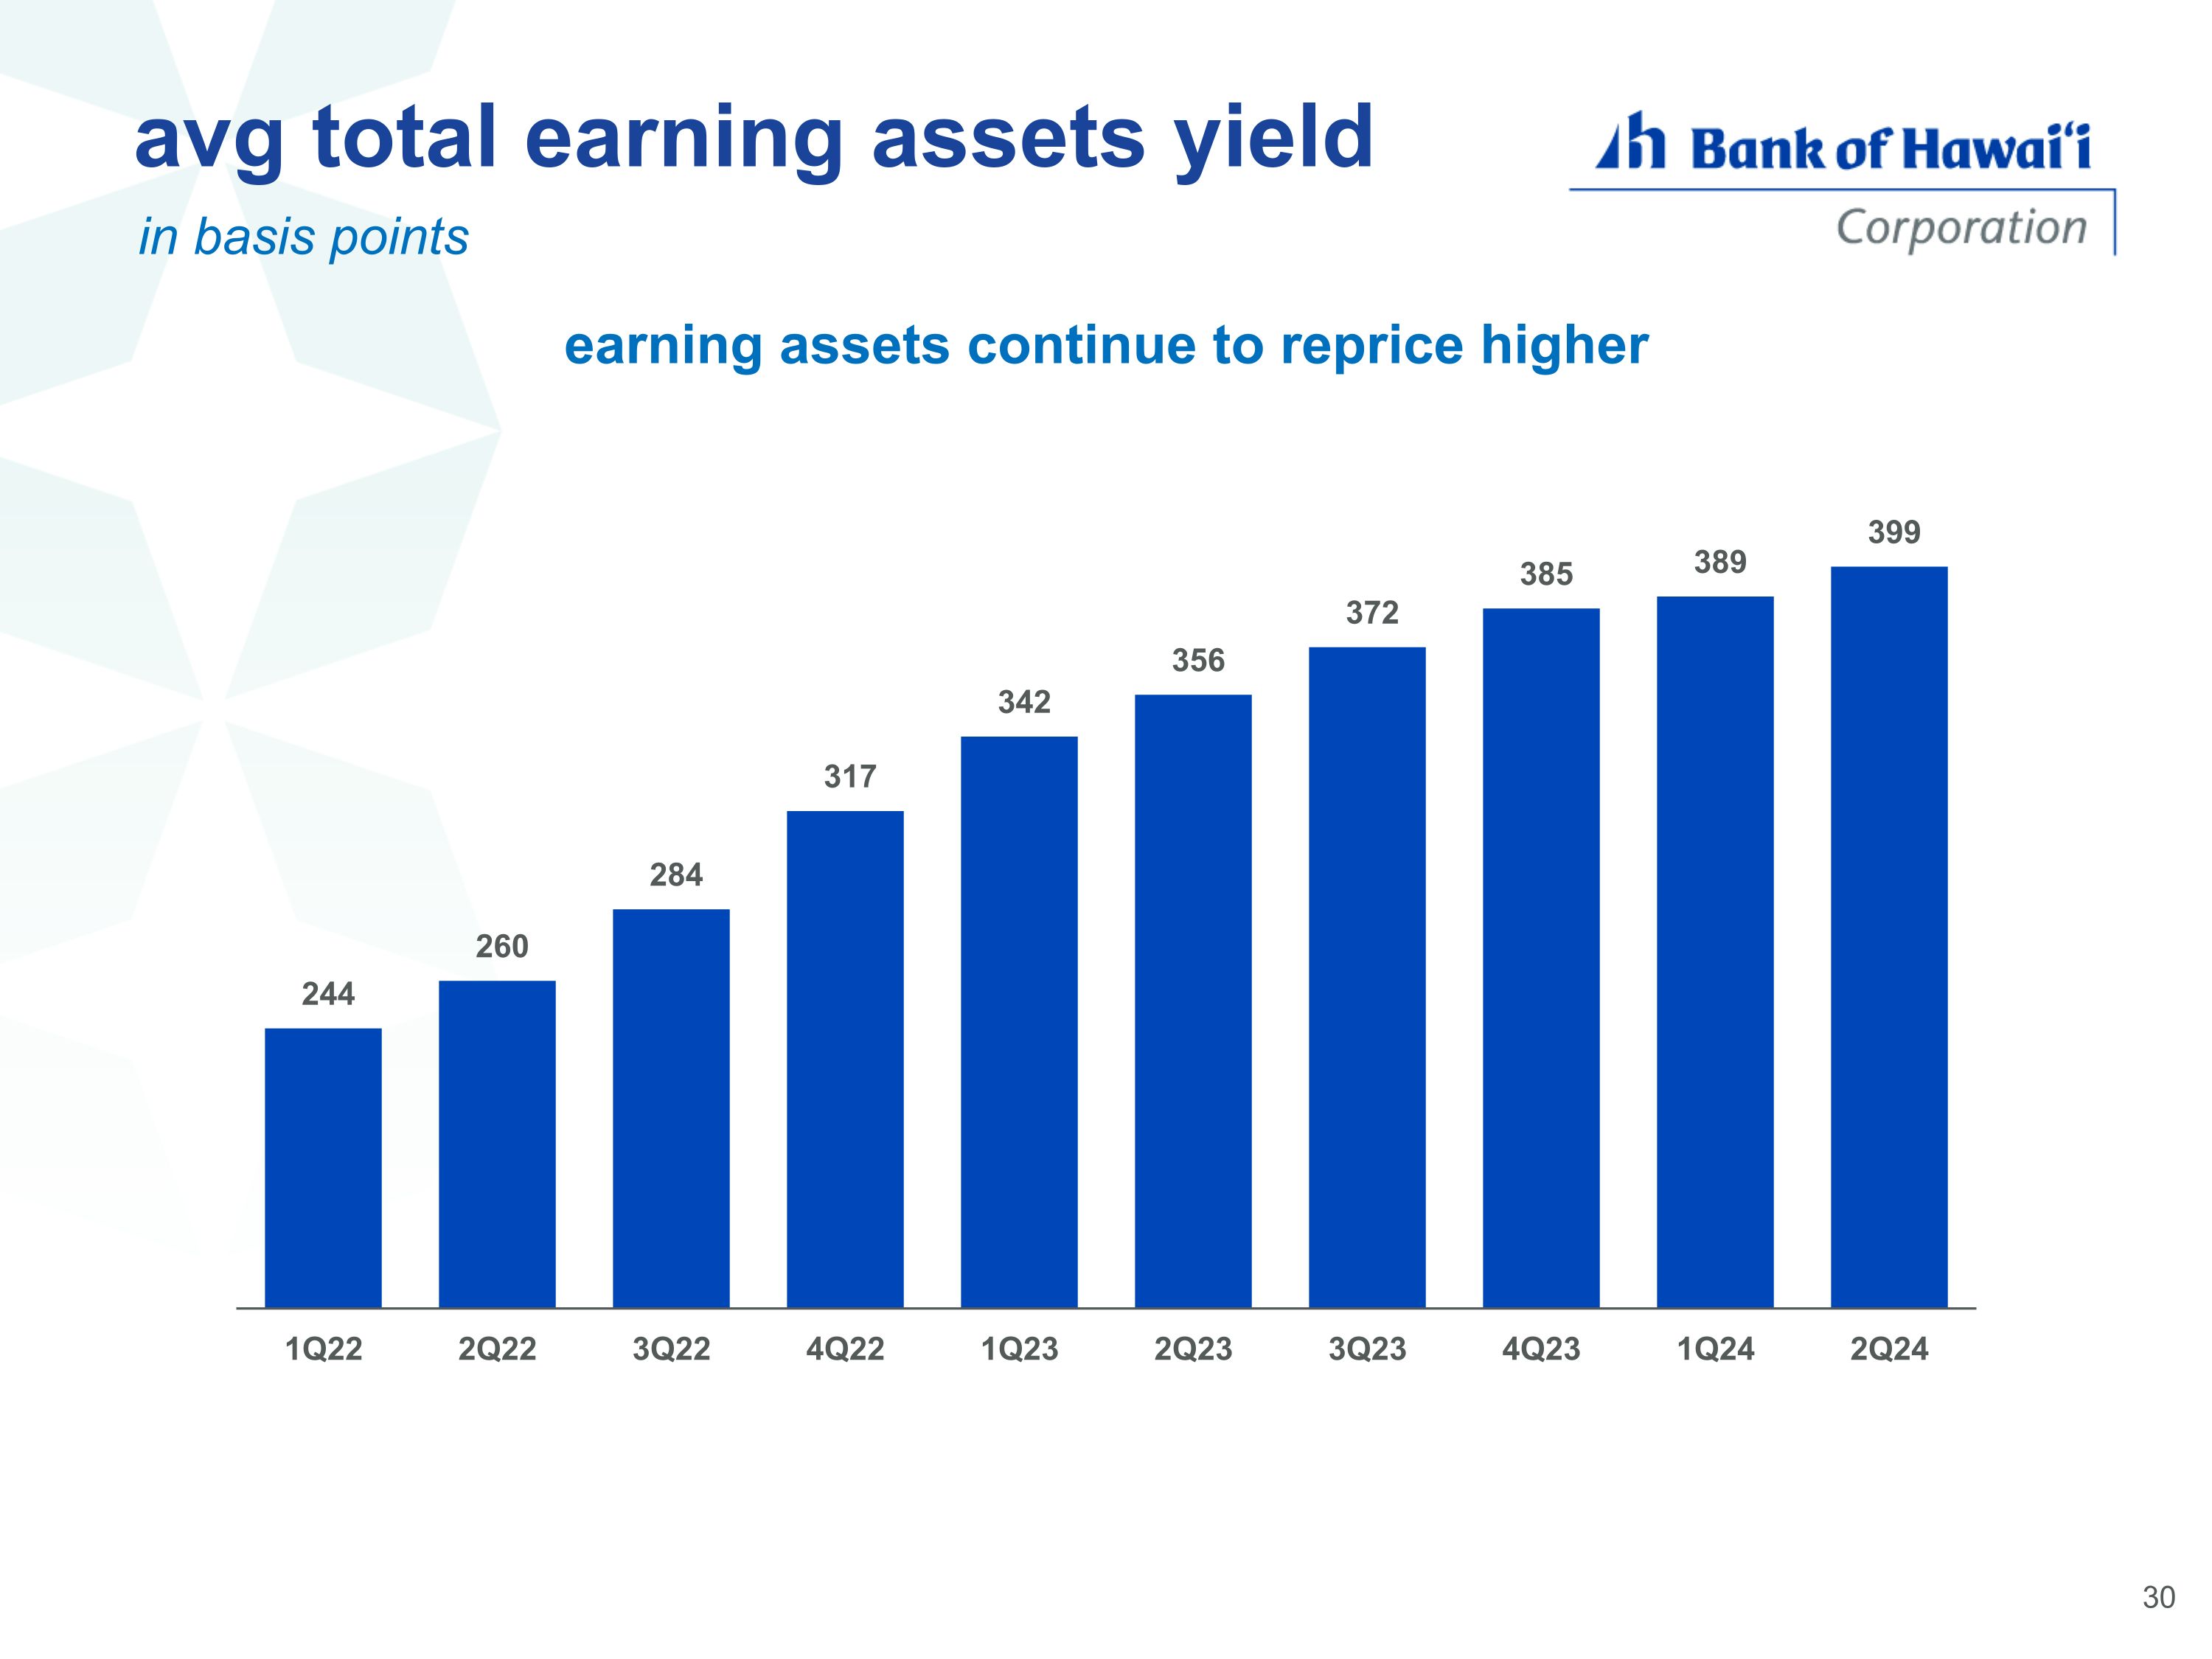
avg total earning assets yield in basis points earning assets continue to reprice higher
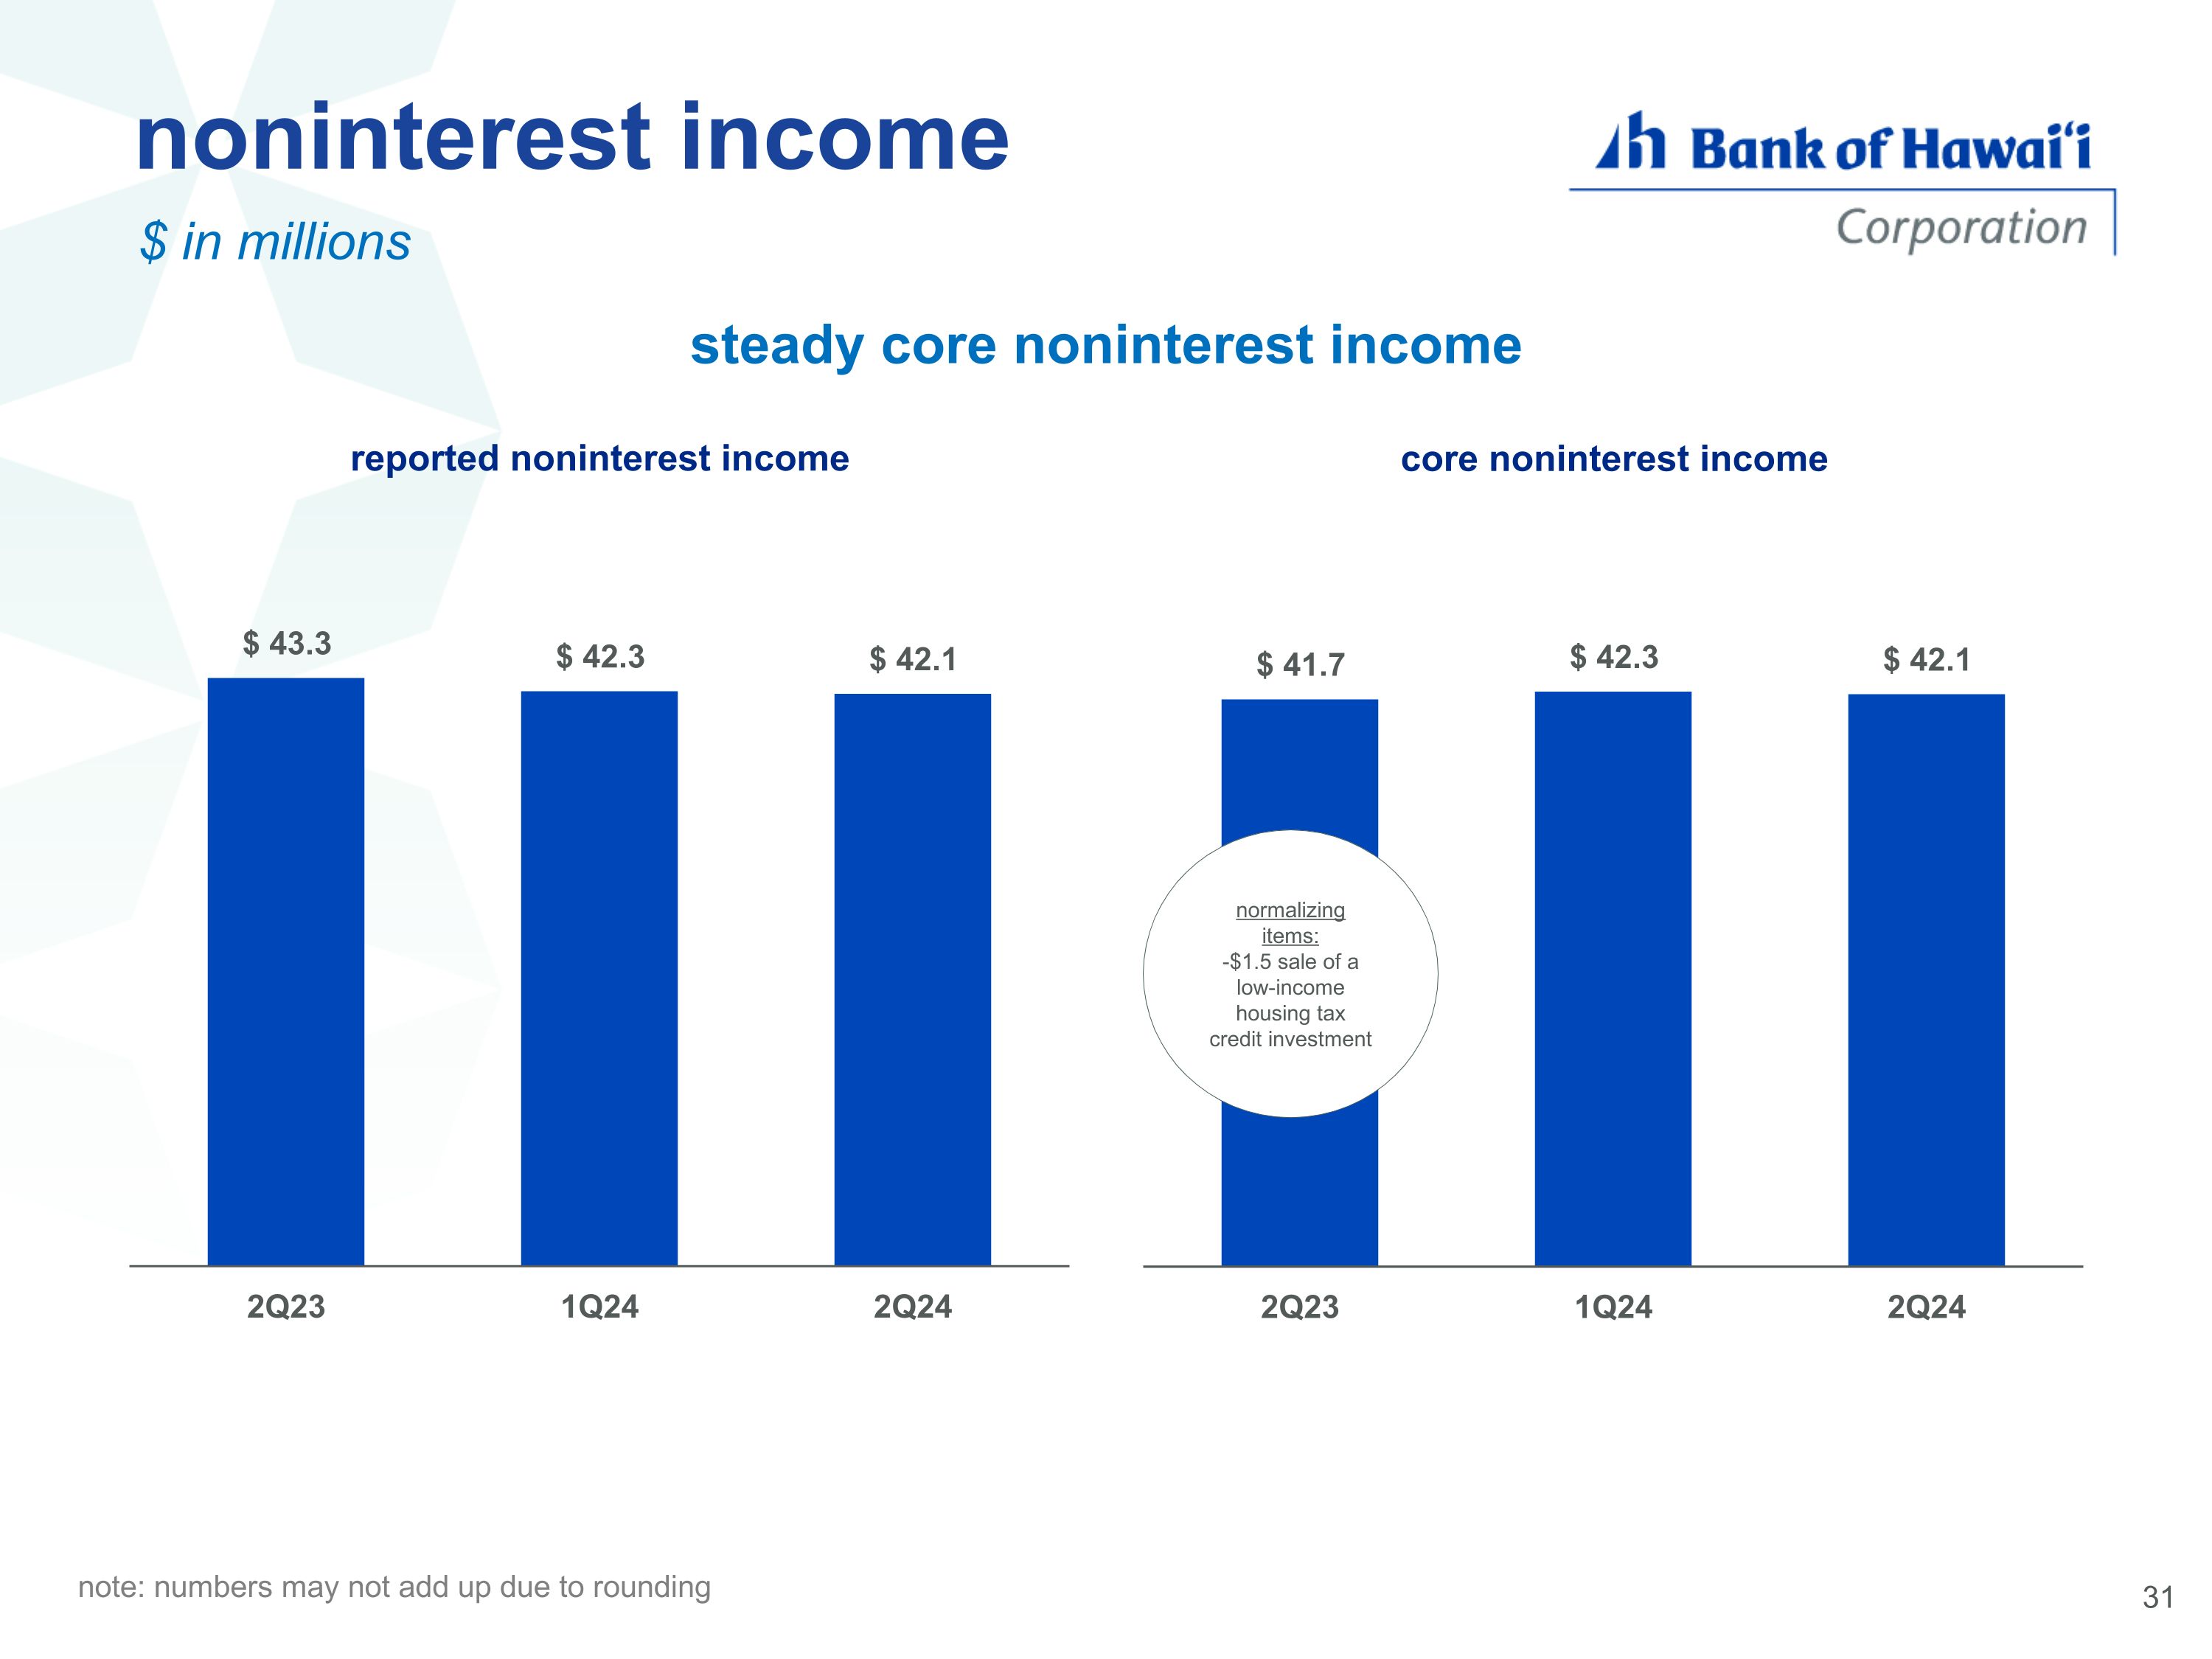
noninterest income $ in millions steady core noninterest income note: numbers may not add up due to rounding normalizing items: -$1.5 sale of a low-income housing tax credit investment
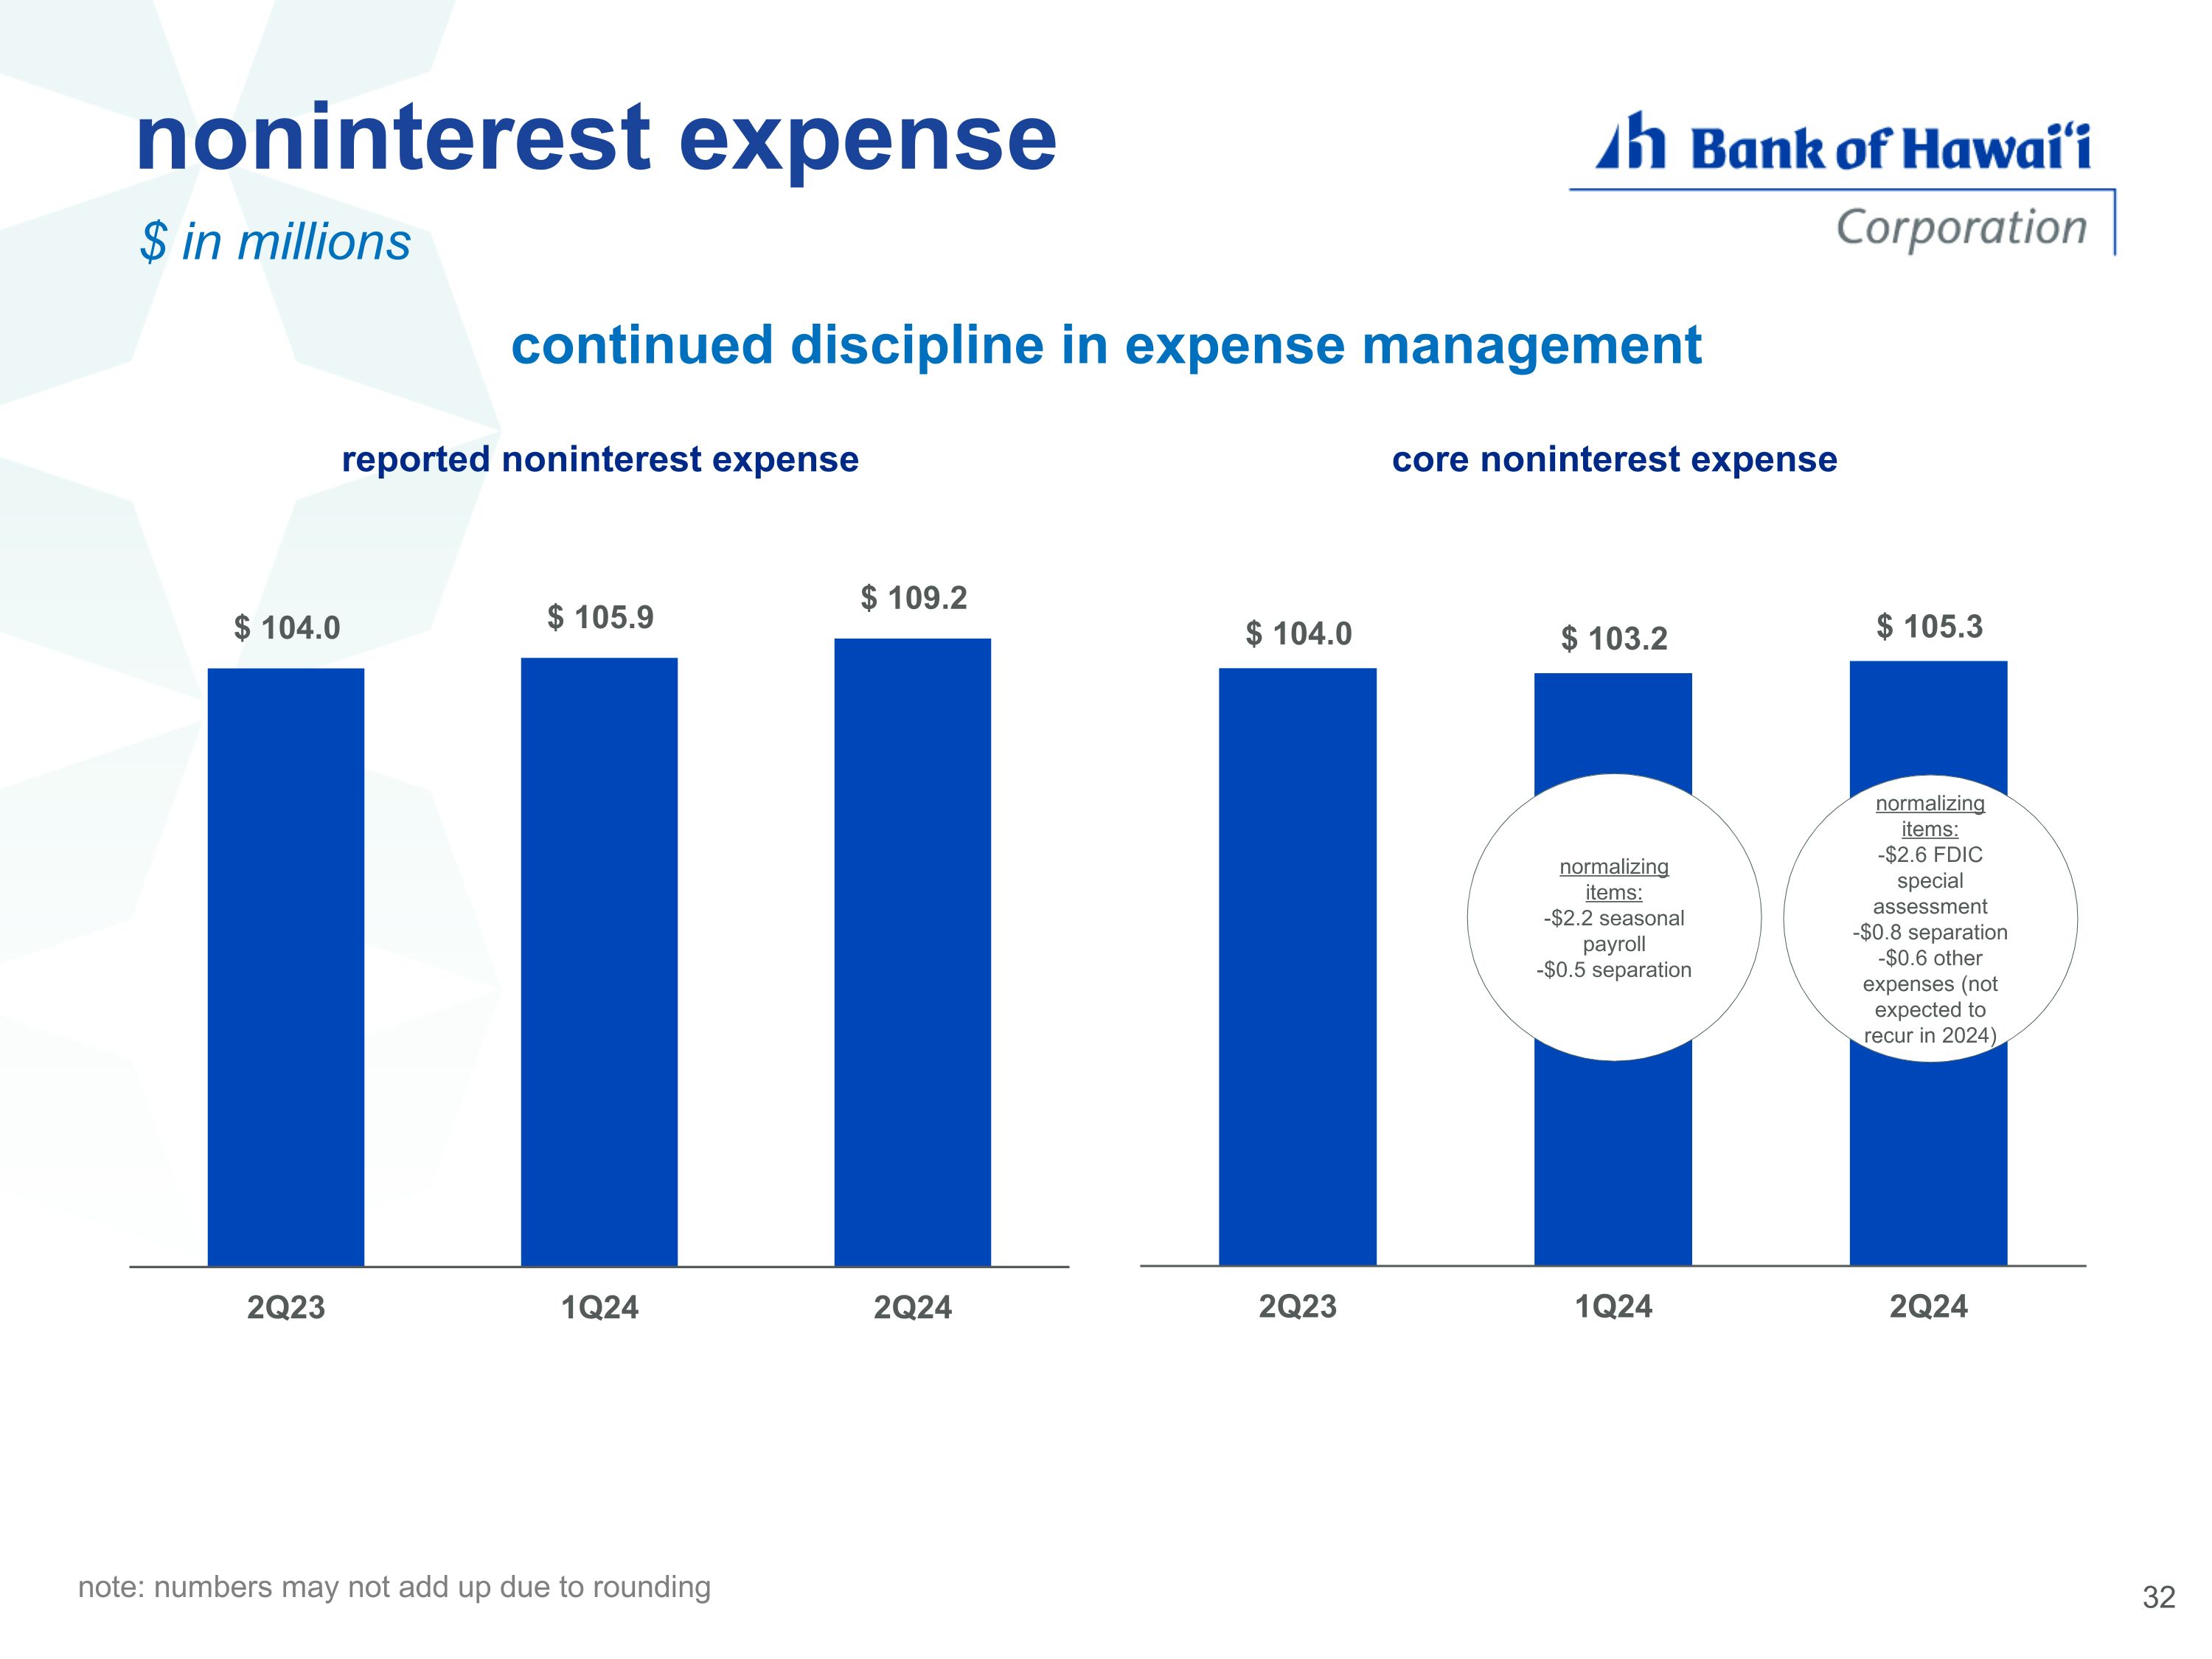
noninterest expense $ in millions continued discipline in expense management note: numbers may not add up due to rounding normalizing items: -$2.2 seasonal payroll -$0.5 separation normalizing items: -$2.6 FDIC special assessment -$0.8 separation -$0.6 other expenses (not expected to recur in 2024)
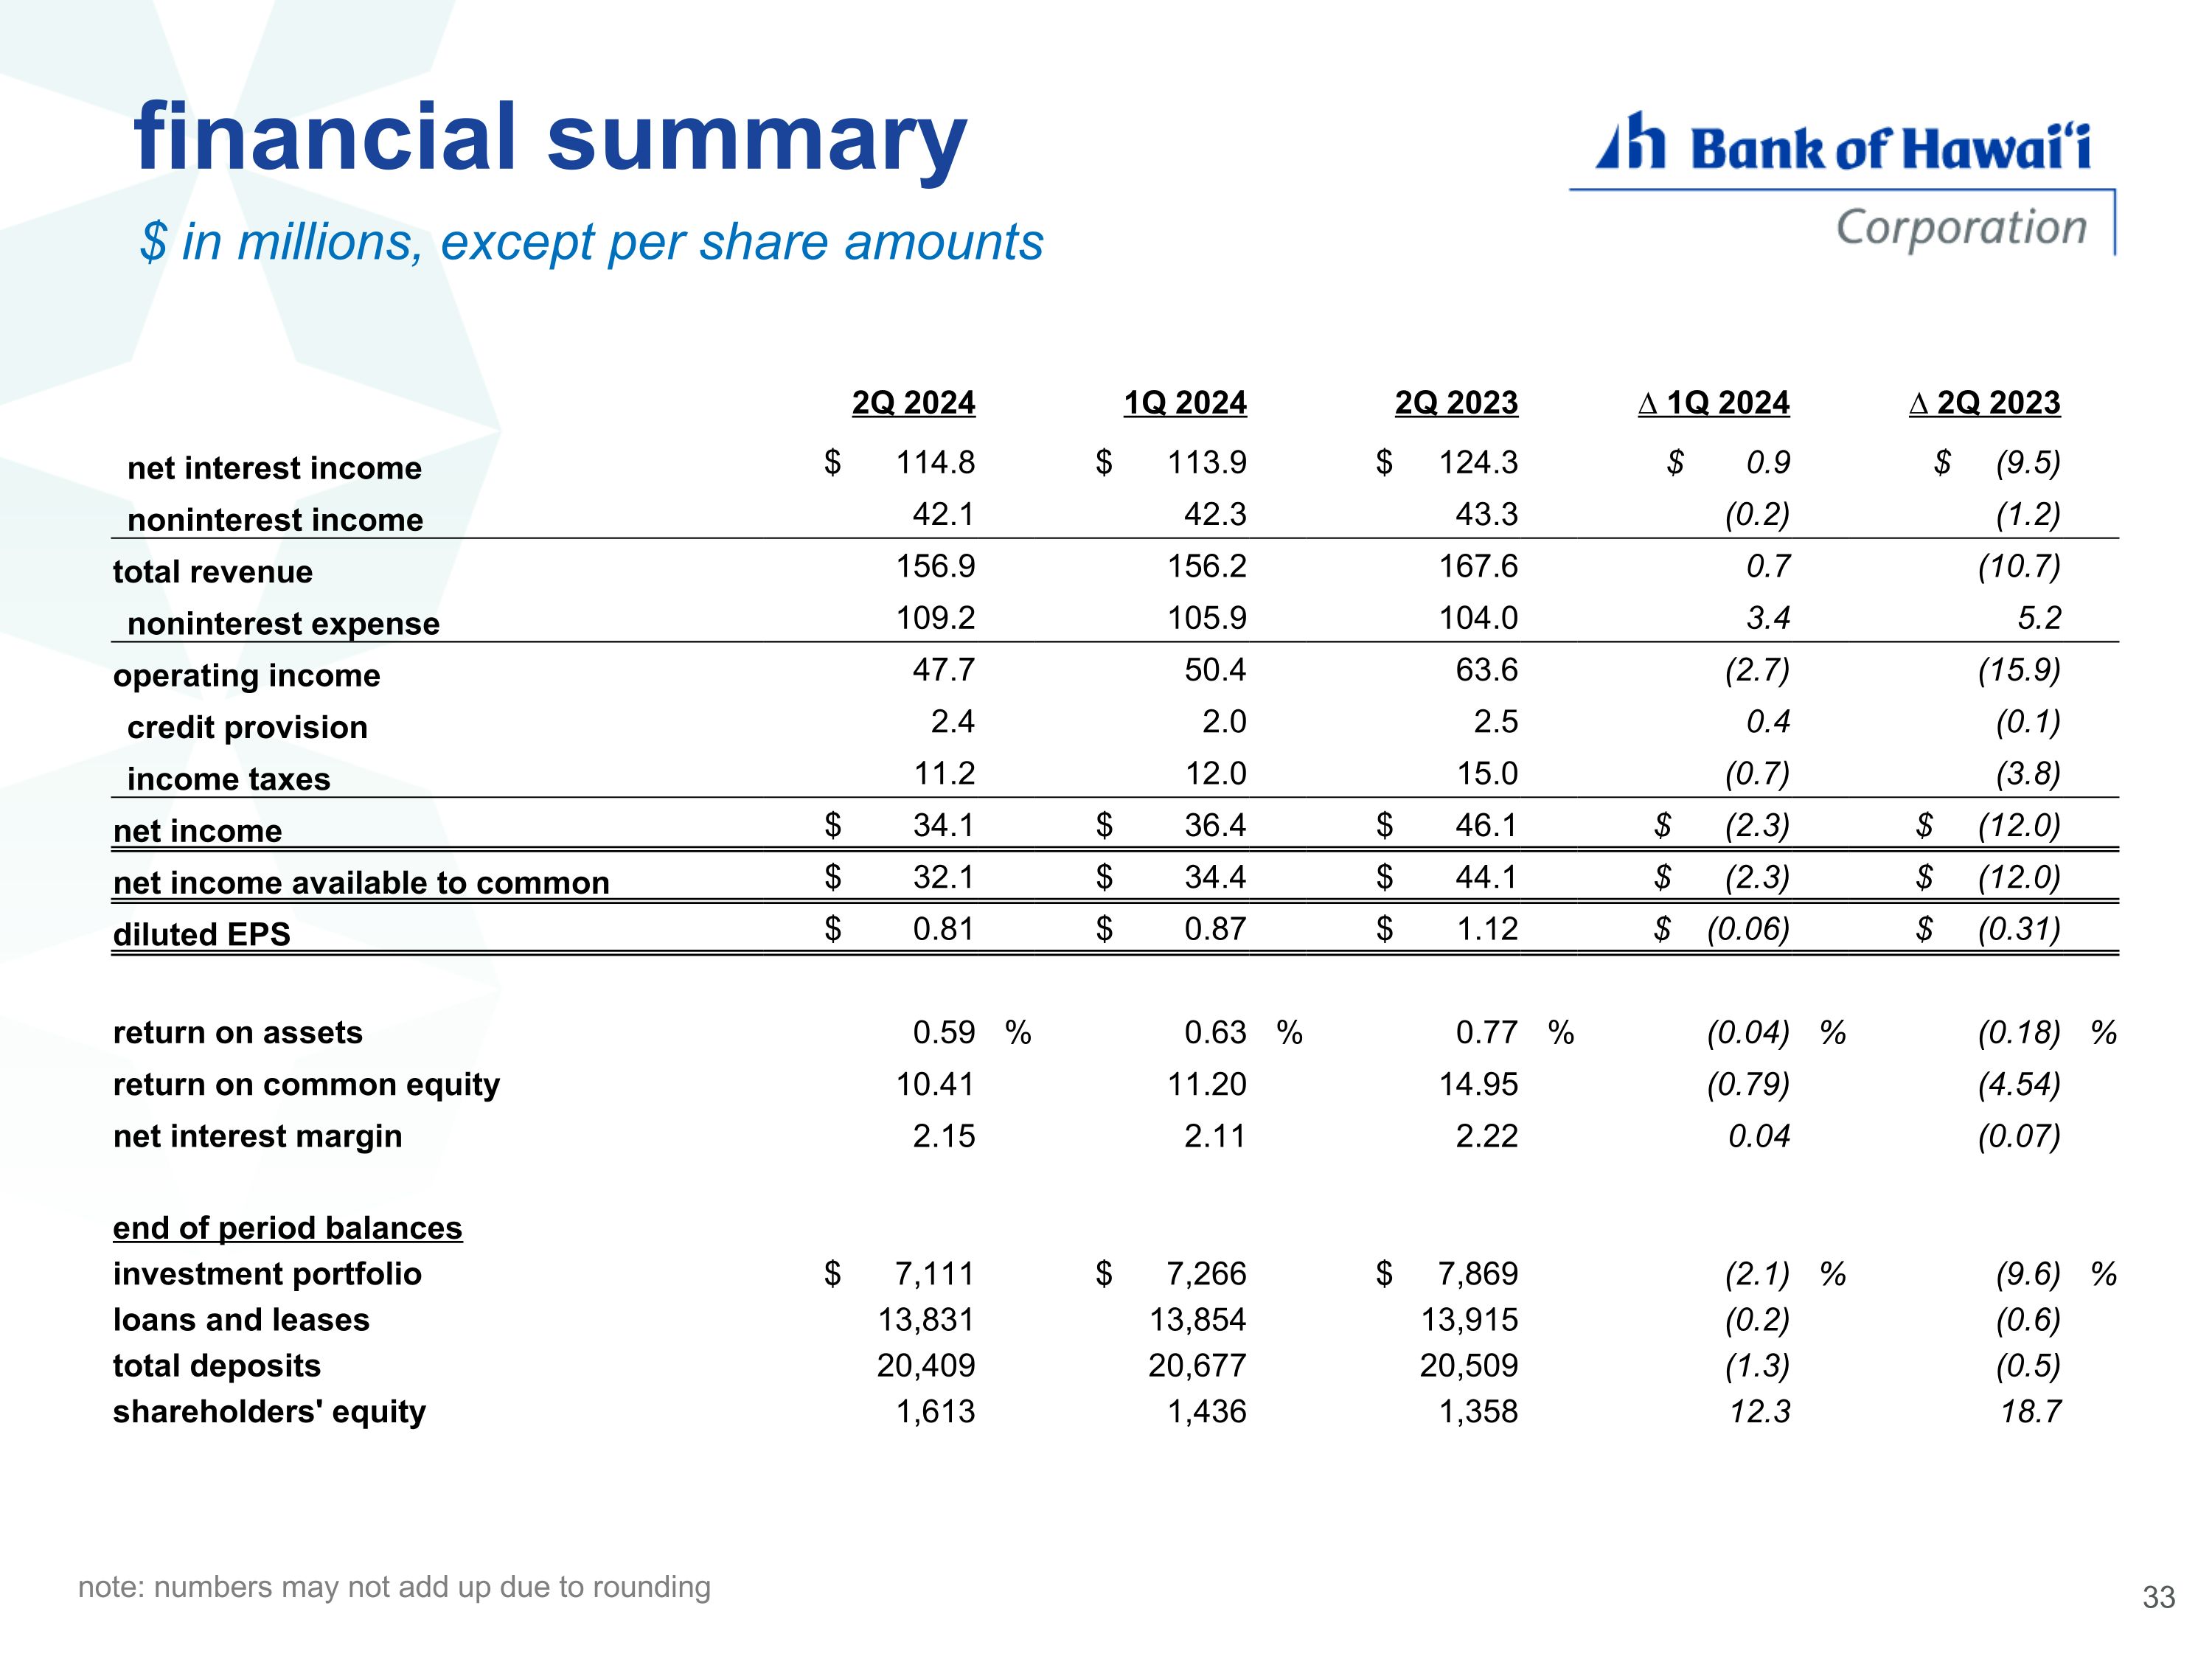
financial summary $ in millions, except per share amounts 2Q 2024 1Q 2024 2Q 2023 ∆ 1Q 2024 ∆ 2Q 2023 net interest income $ 114.8 $ 113.9 $ 124.3 $ 0.9 $ (9.5) noninterest income 42.1 42.3 43.3 (0.2) (1.2) total revenue 156.9 156.2 167.6 0.7 (10.7) noninterest expense 109.2 105.9 104.0 3.4 5.2 operating income 47.7 50.4 63.6 (2.7) (15.9) credit provision 2.4 2.0 2.5 0.4 (0.1) income taxes 11.2 12.0 15.0 (0.7) (3.8) net income $ 34.1 $ 36.4 $ 46.1 $ (2.3) $ (12.0) net income available to common $ 32.1 $ 34.4 $ 44.1 $ (2.3) $ (12.0) diluted EPS $ 0.81 $ 0.87 $ 1.12 $ (0.06) $ (0.31) return on assets 0.59 % 0.63 % 0.77 % (0.04) % (0.18) % return on common equity 10.41 11.20 14.95 (0.79) (4.54) net interest margin 2.15 2.11 2.22 0.04 (0.07) end of period balances investment portfolio $ 7,111 $ 7,266 $ 7,869 (2.1) % (9.6) % loans and leases 13,831 13,854 13,915 (0.2) (0.6) total deposits 20,409 20,677 20,509 (1.3) (0.5) shareholders' equity 1,613 1,436 1,358 12.3 18.7 note: numbers may not add up due to rounding
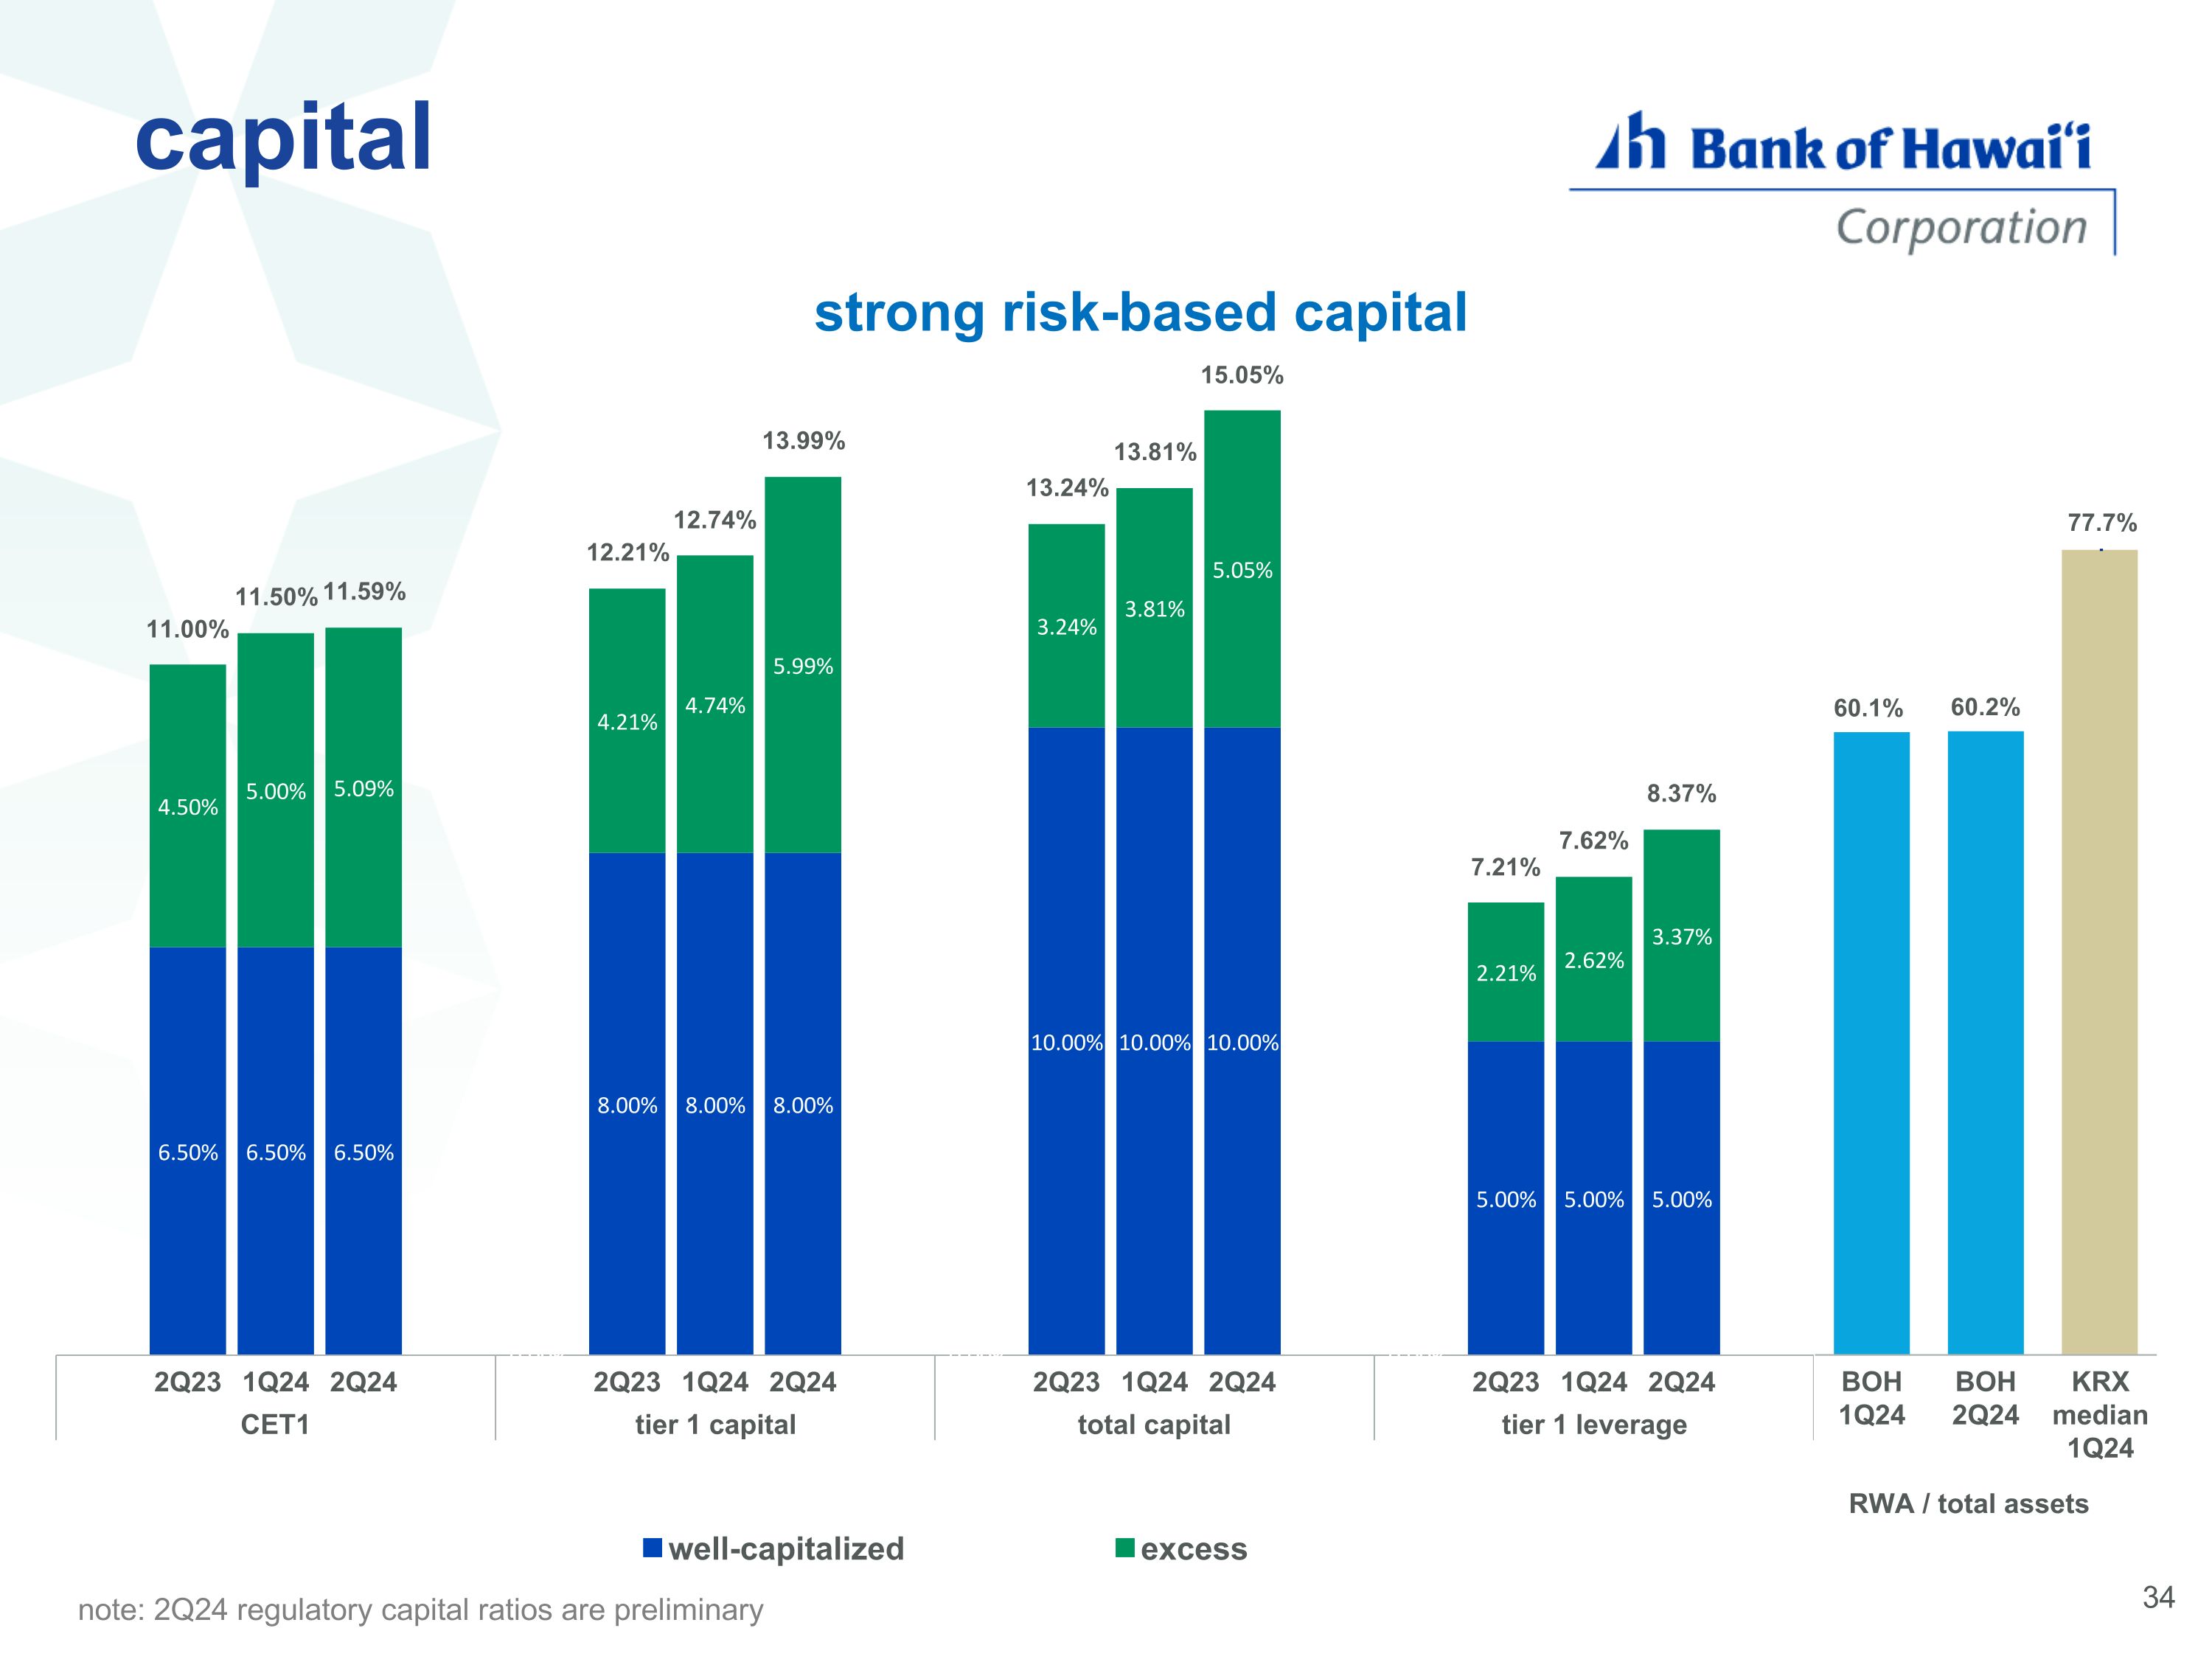
capital note: 2Q24 regulatory capital ratios are preliminary 13.6% strong risk-based capital 13.6% RWA / total assets
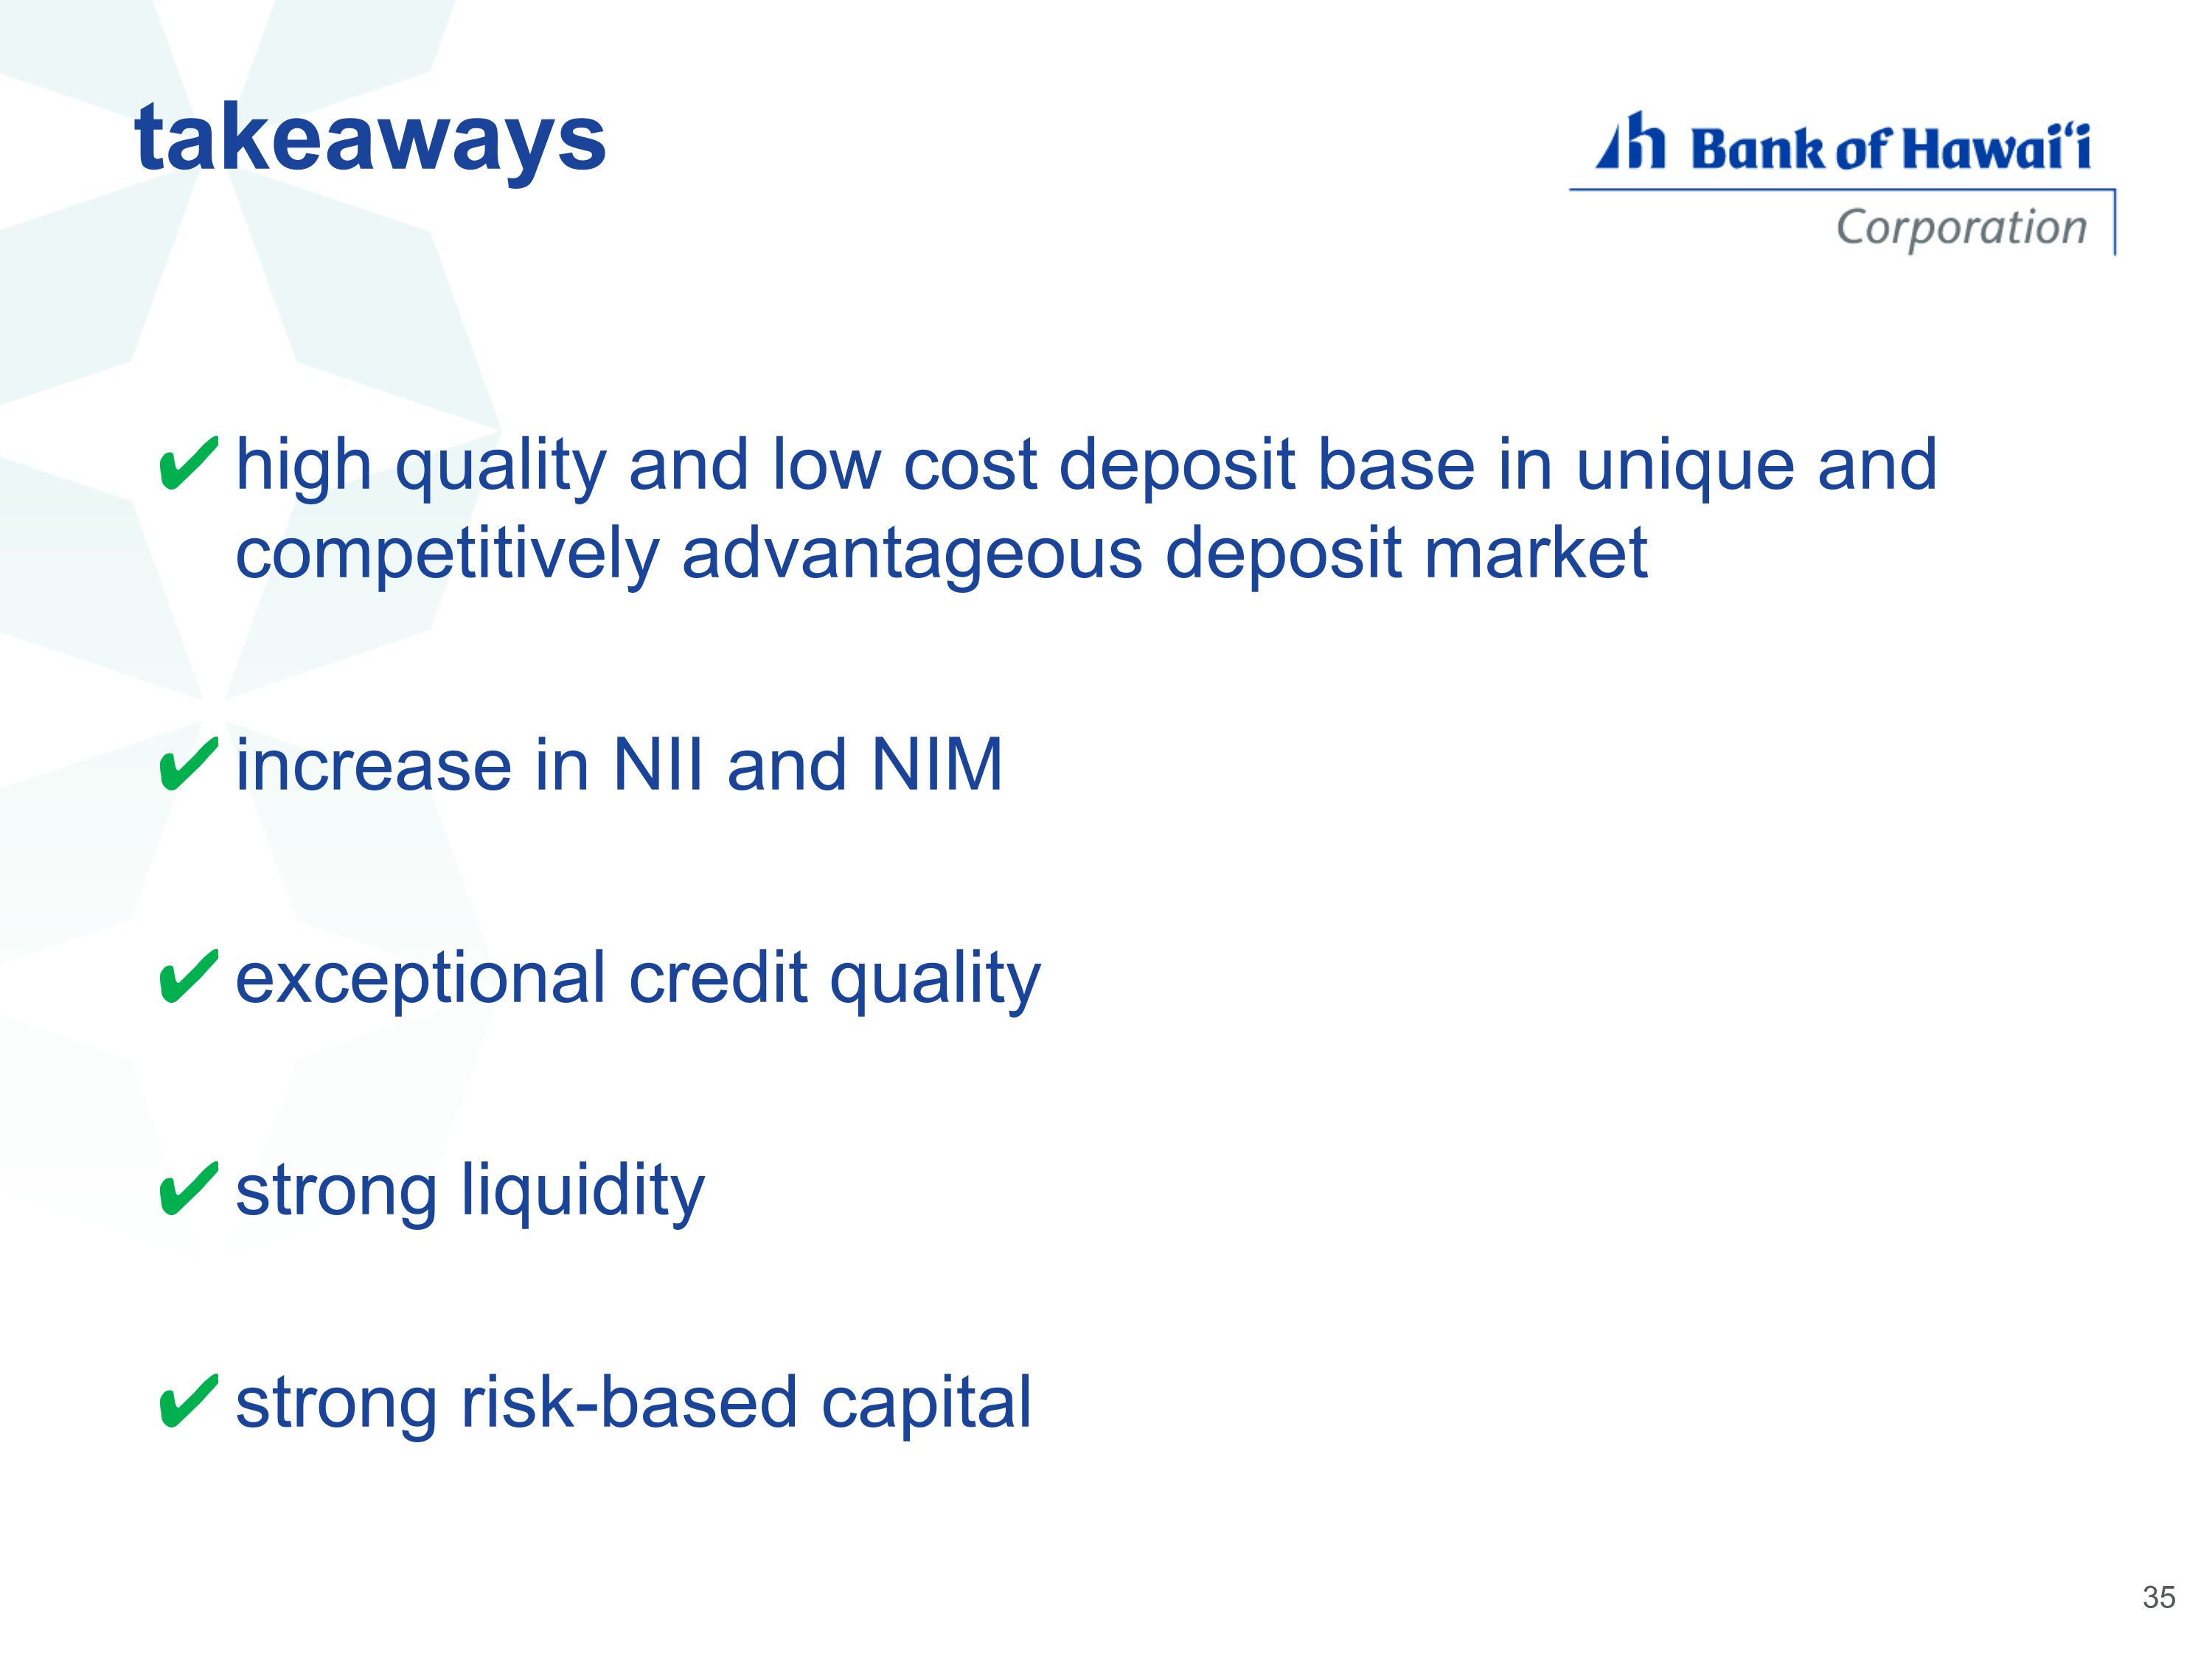
high quality and low cost deposit base in unique and competitively advantageous deposit market increase in NII and NIM exceptional credit quality strong liquidity strong risk-based capital takeaways

Q & A
appendix
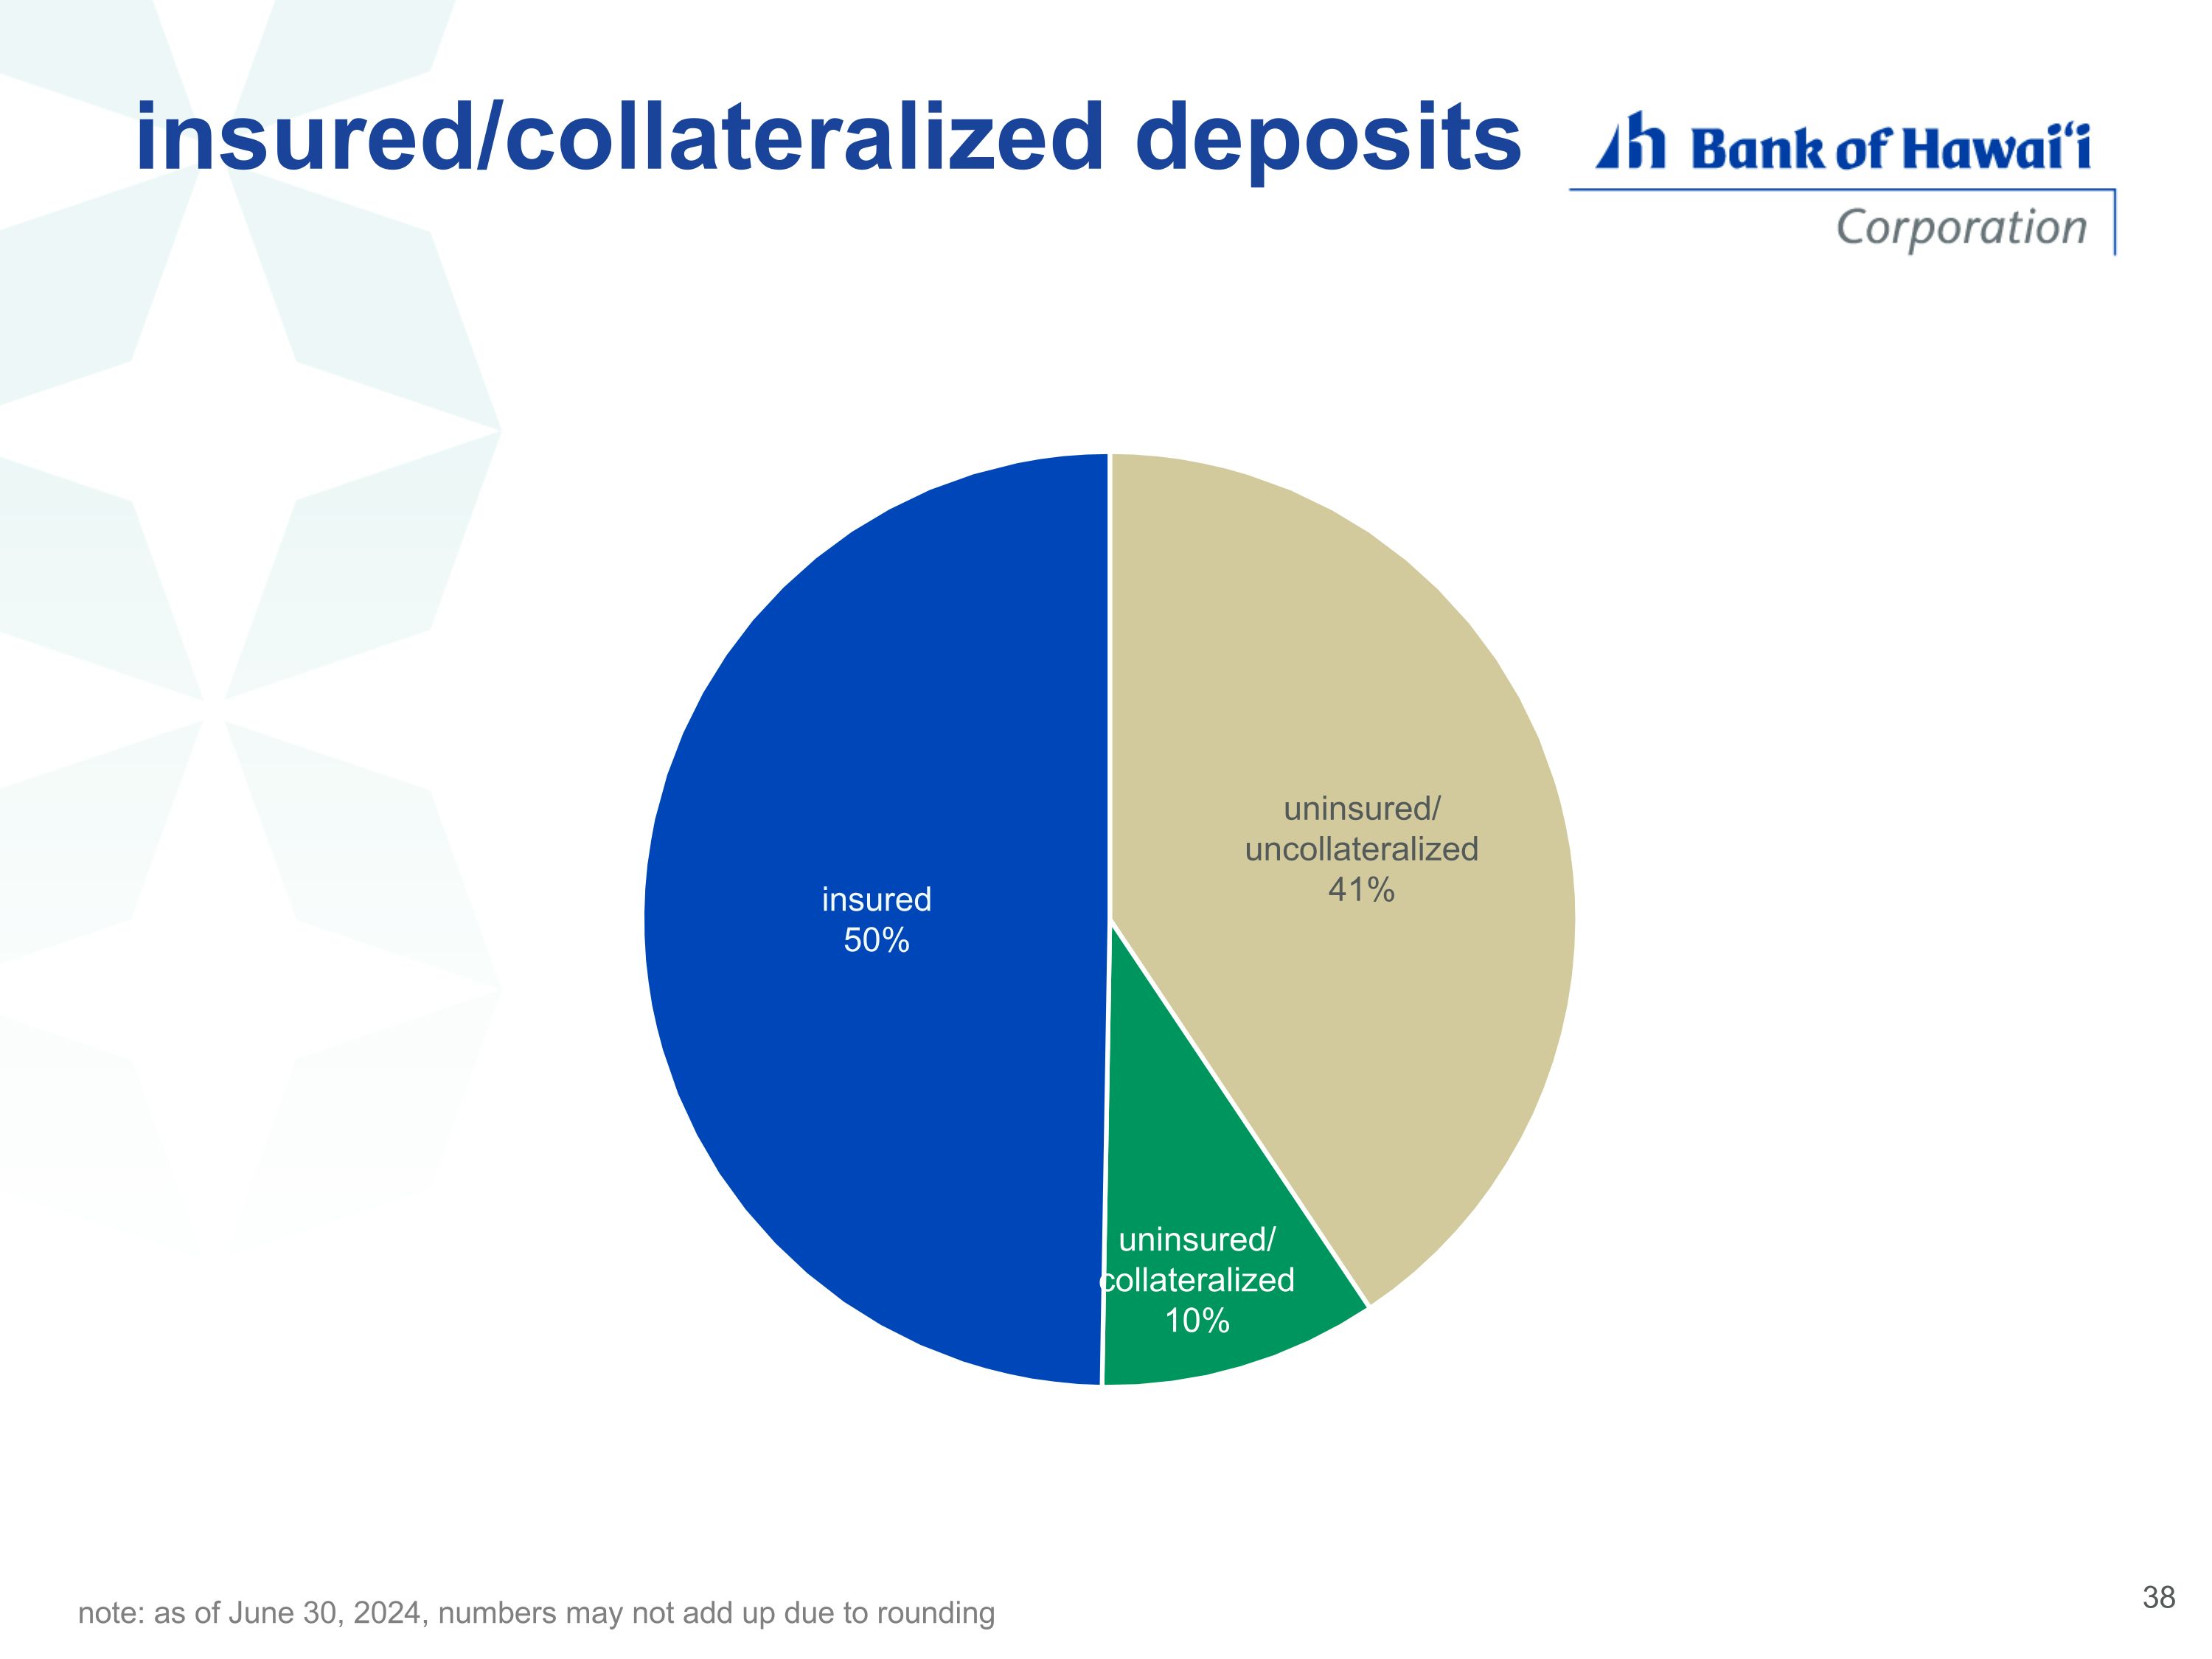
insured/collateralized deposits note: as of June 30, 2024, numbers may not add up due to rounding
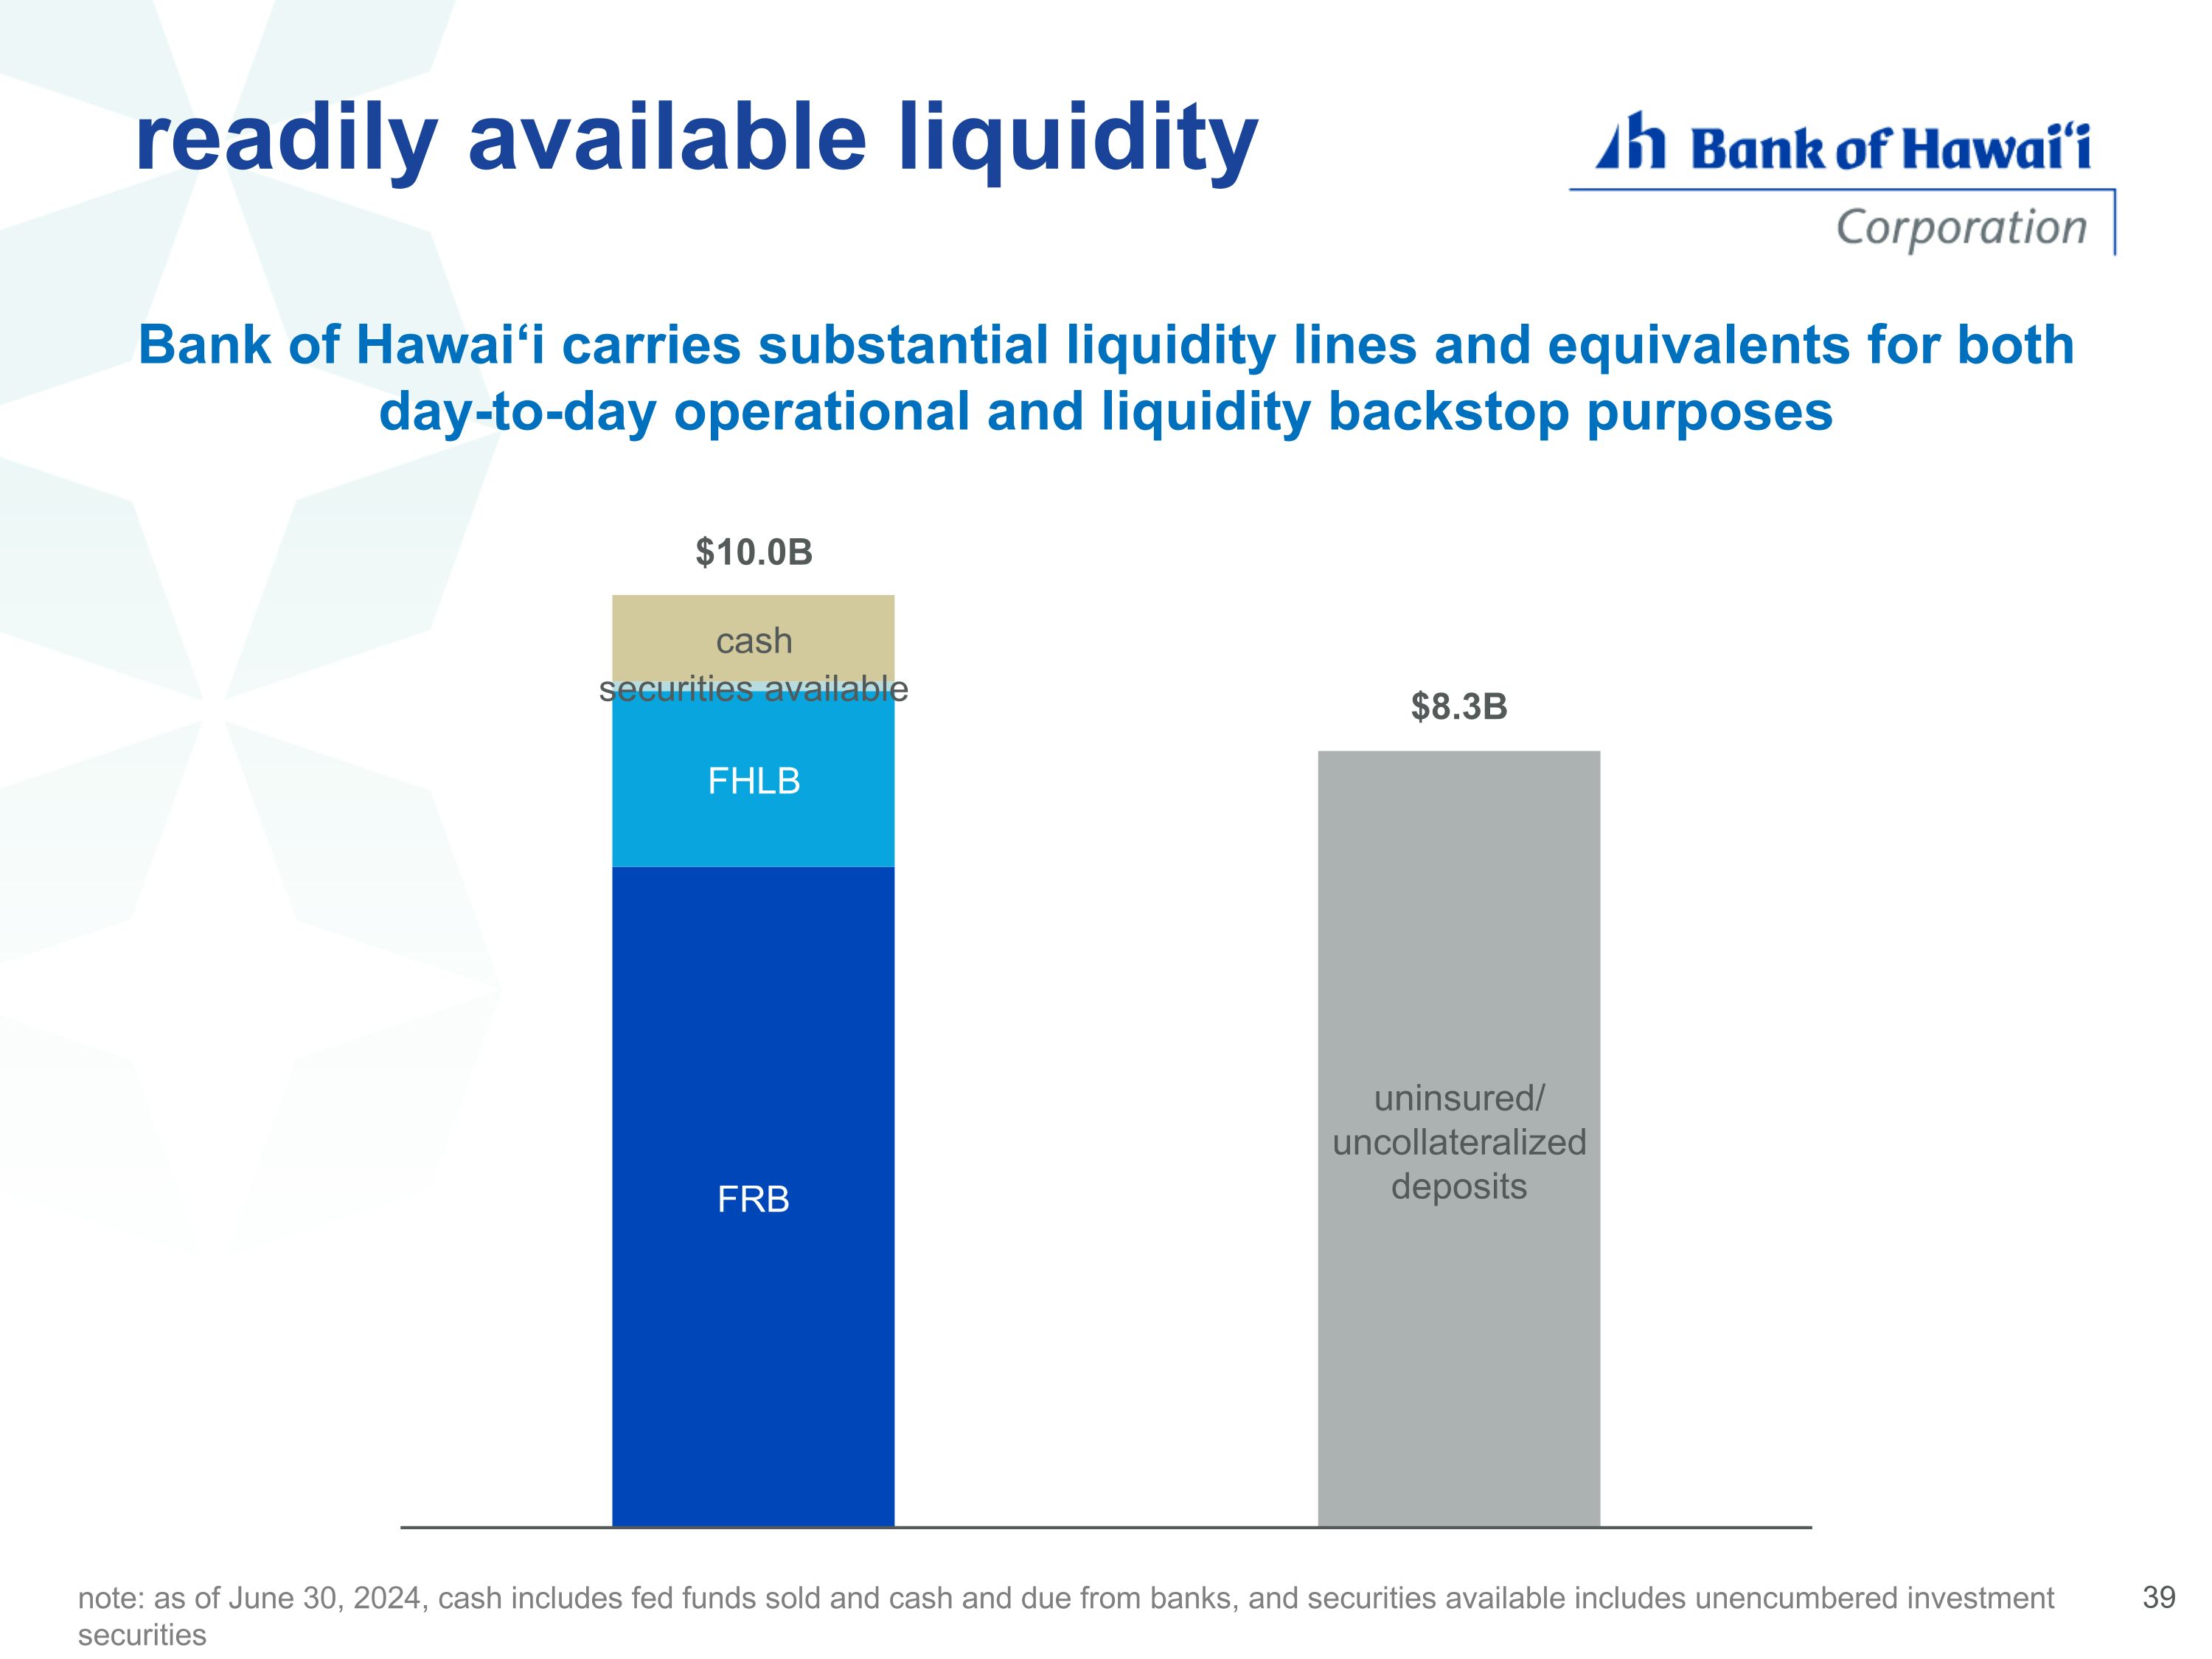
note: as of June 30, 2024, cash includes fed funds sold and cash and due from banks, and securities available includes unencumbered investment securities Bank of Hawai‘i carries substantial liquidity lines and equivalents for both day-to-day operational and liquidity backstop purposes readily available liquidity
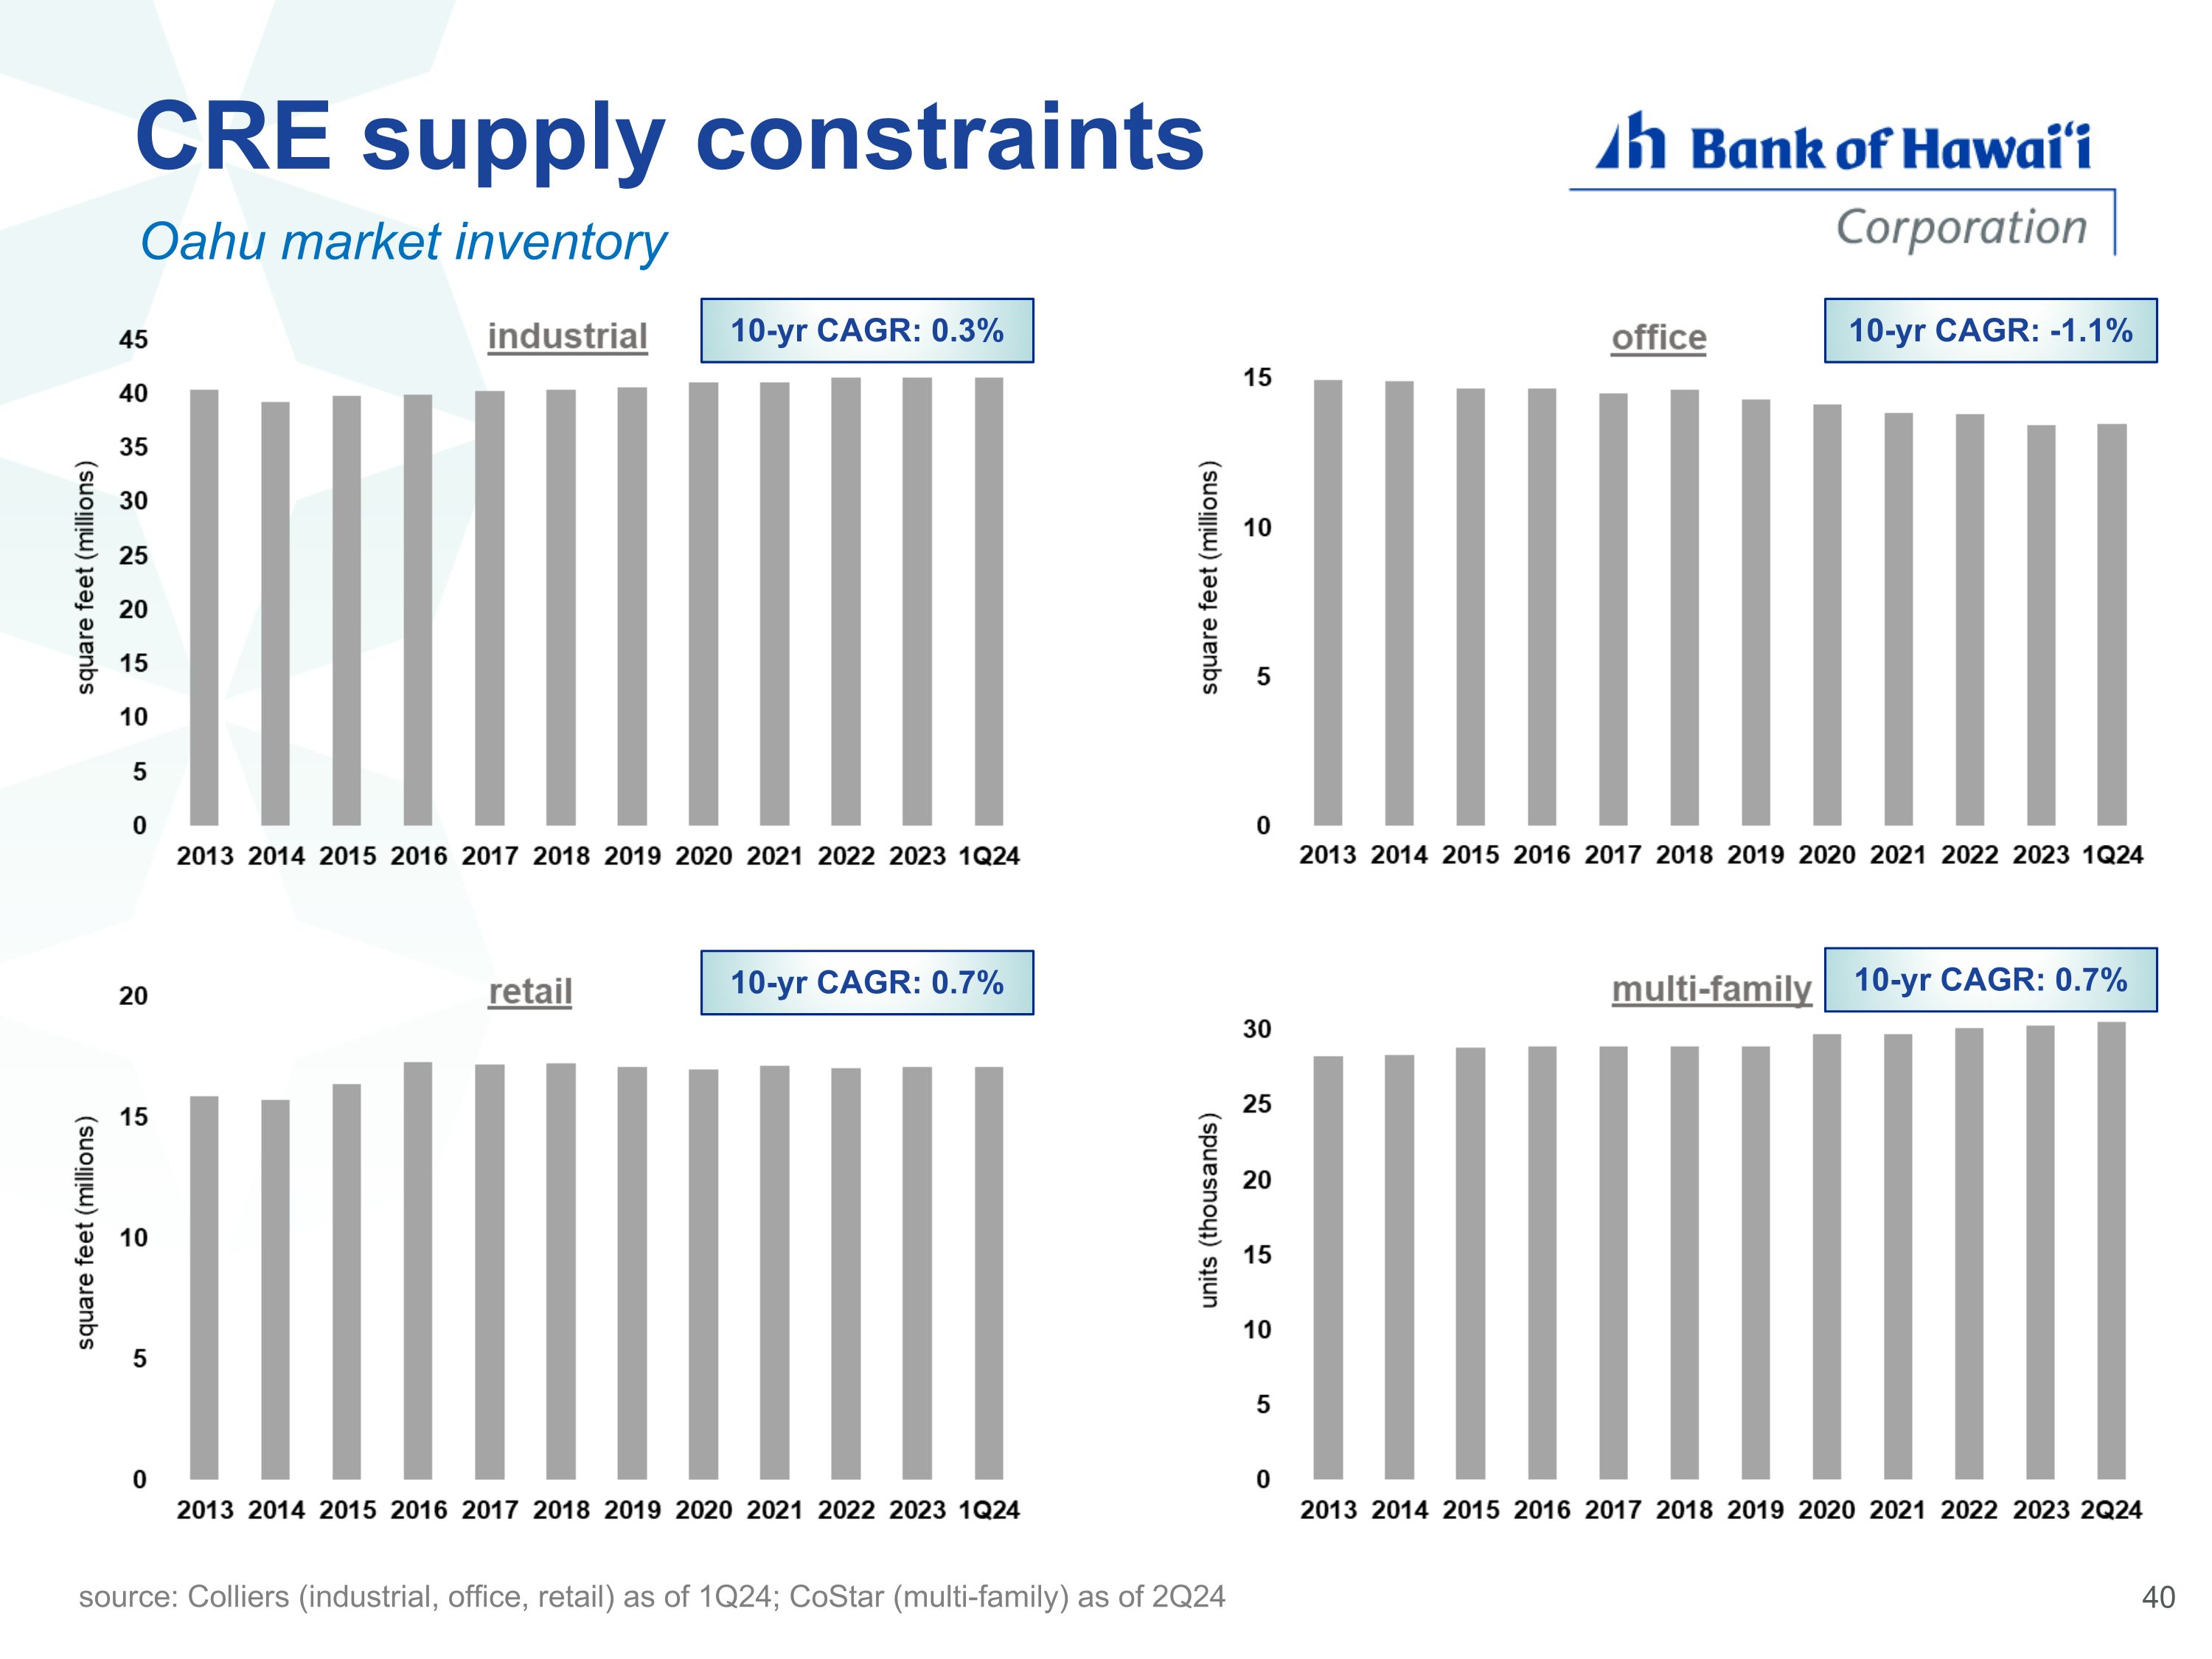
Oahu market inventory source: Colliers (industrial, office, retail) as of 1Q24; CoStar (multi-family) as of 2Q24 CRE supply constraints 10-yr CAGR: 0.3% 10-yr CAGR: -1.1% 10-yr CAGR: 0.7% 10-yr CAGR: 0.7%
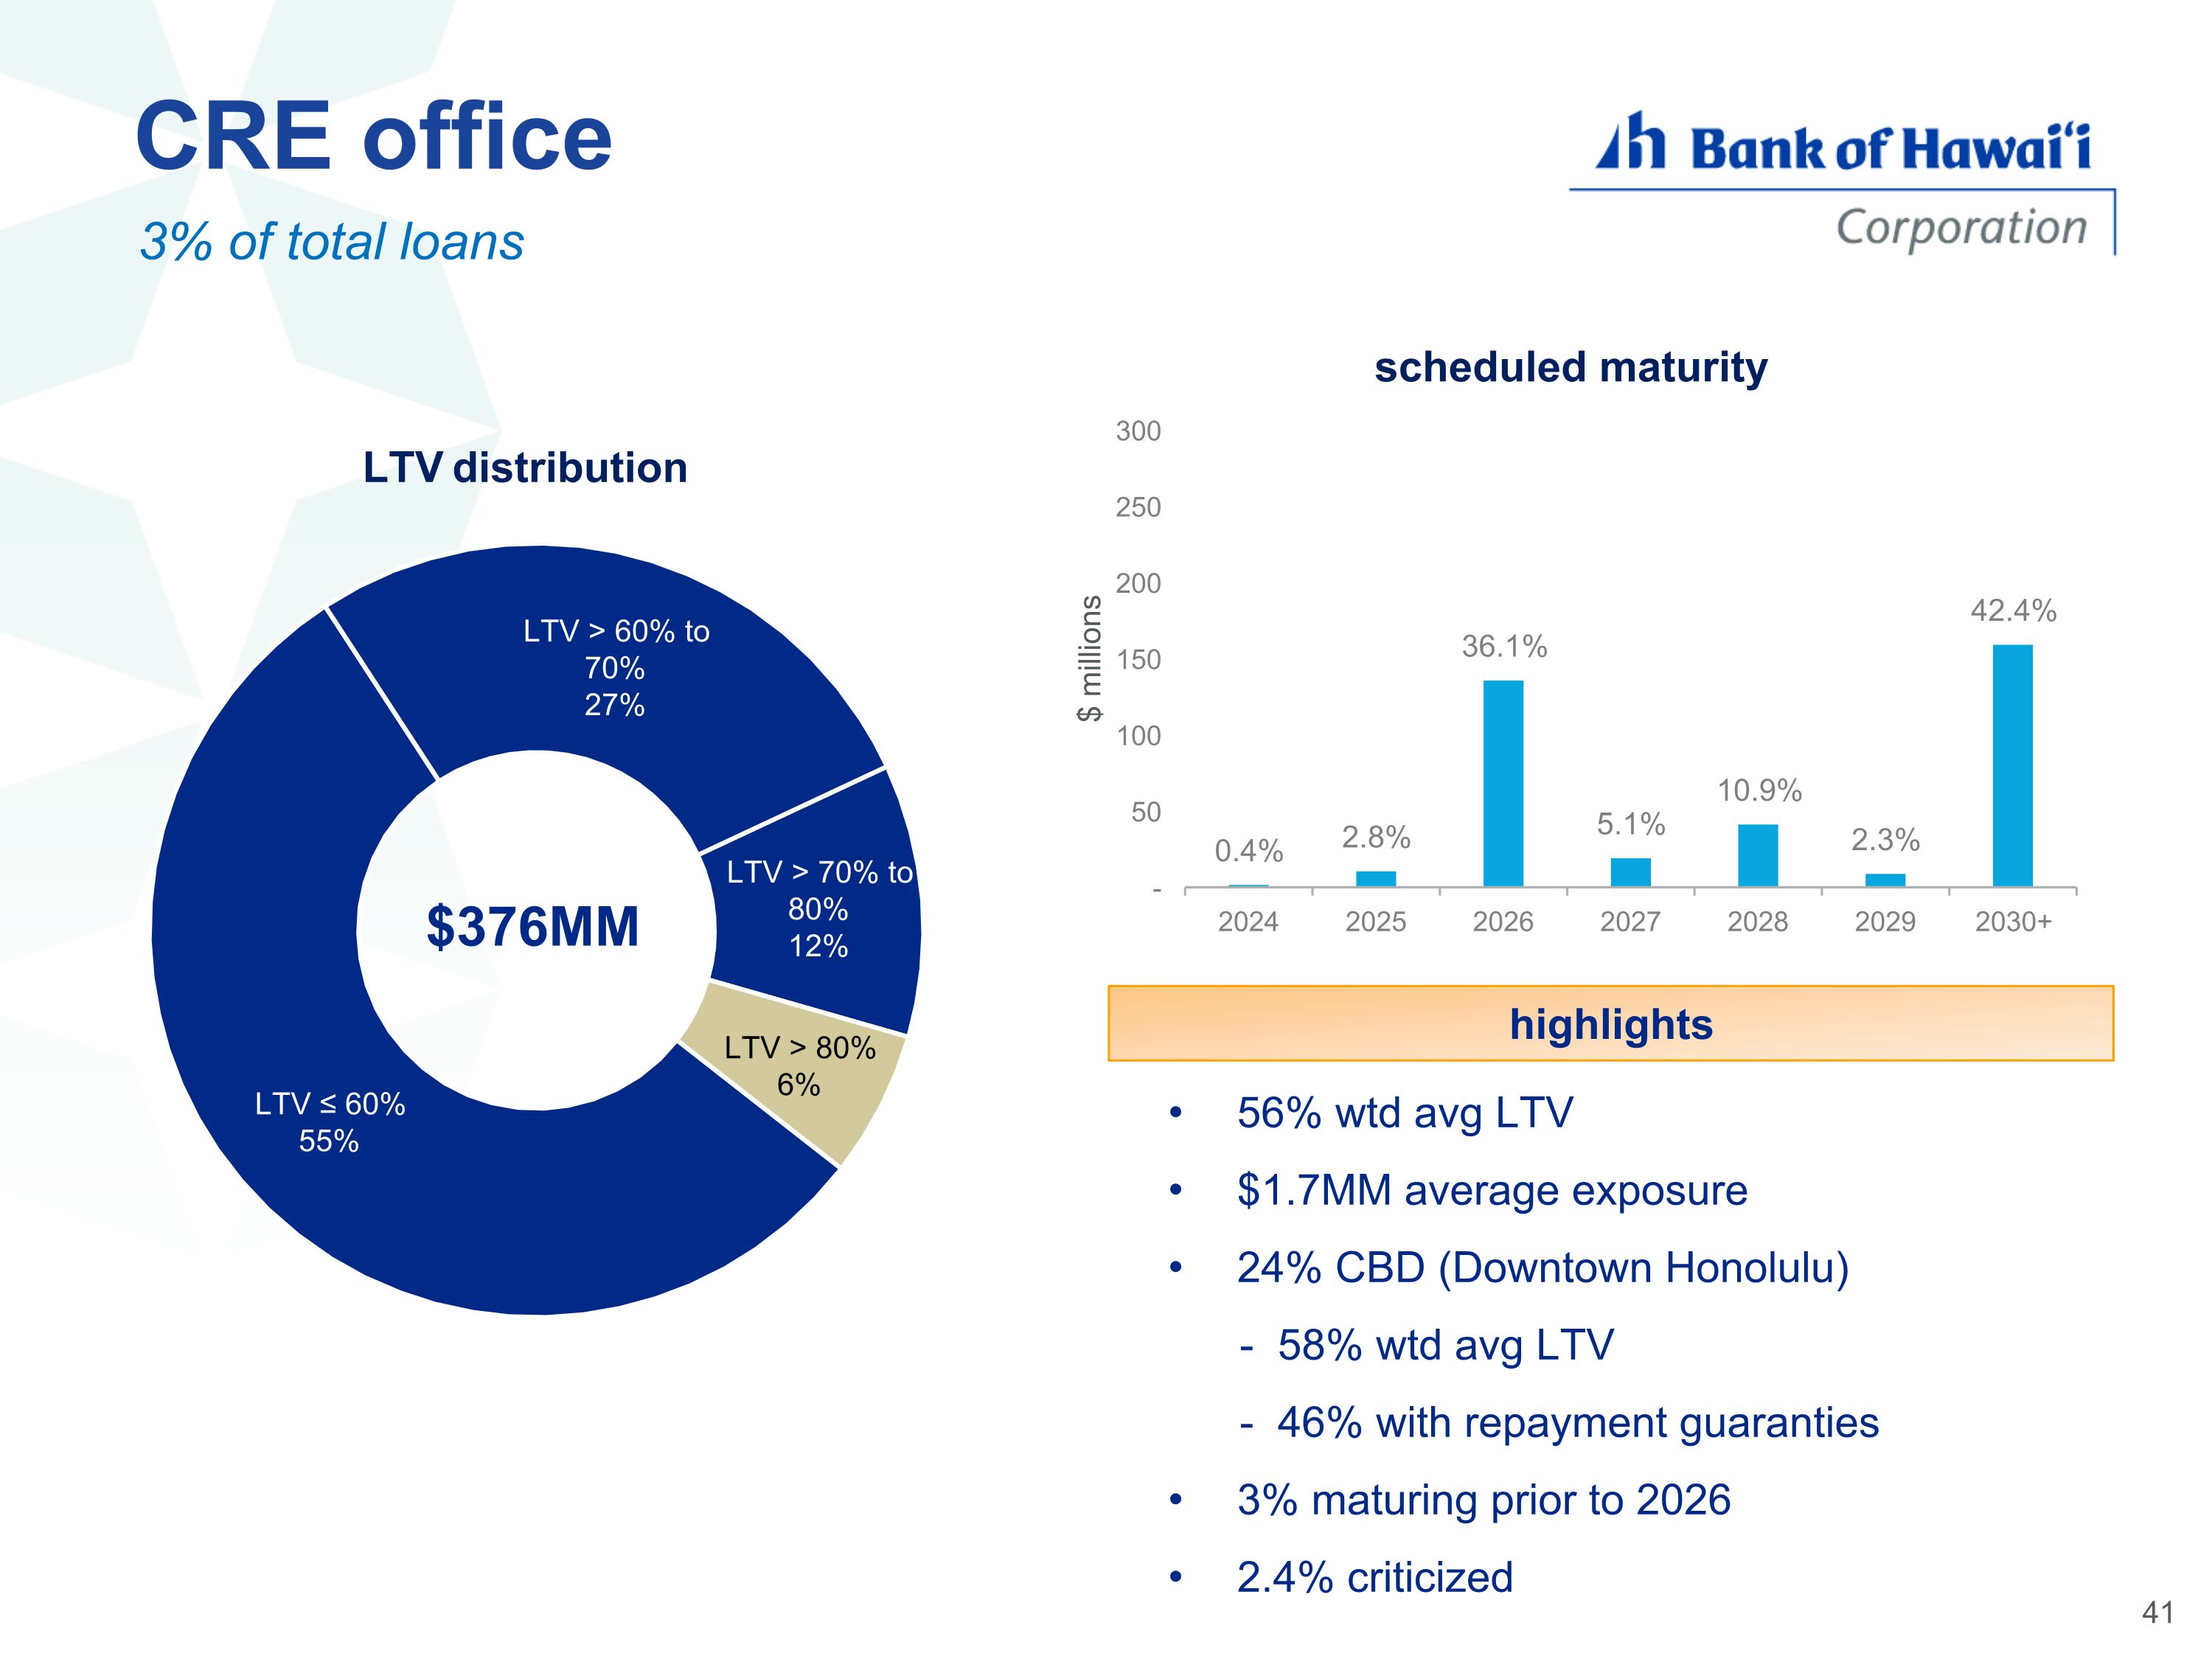
CRE office 3% of total loans 56% wtd avg LTV $1.7MM average exposure 24% CBD (Downtown Honolulu) - 58% wtd avg LTV - 46% with repayment guaranties 3% maturing prior to 2026 2.4% criticized highlights $376MM
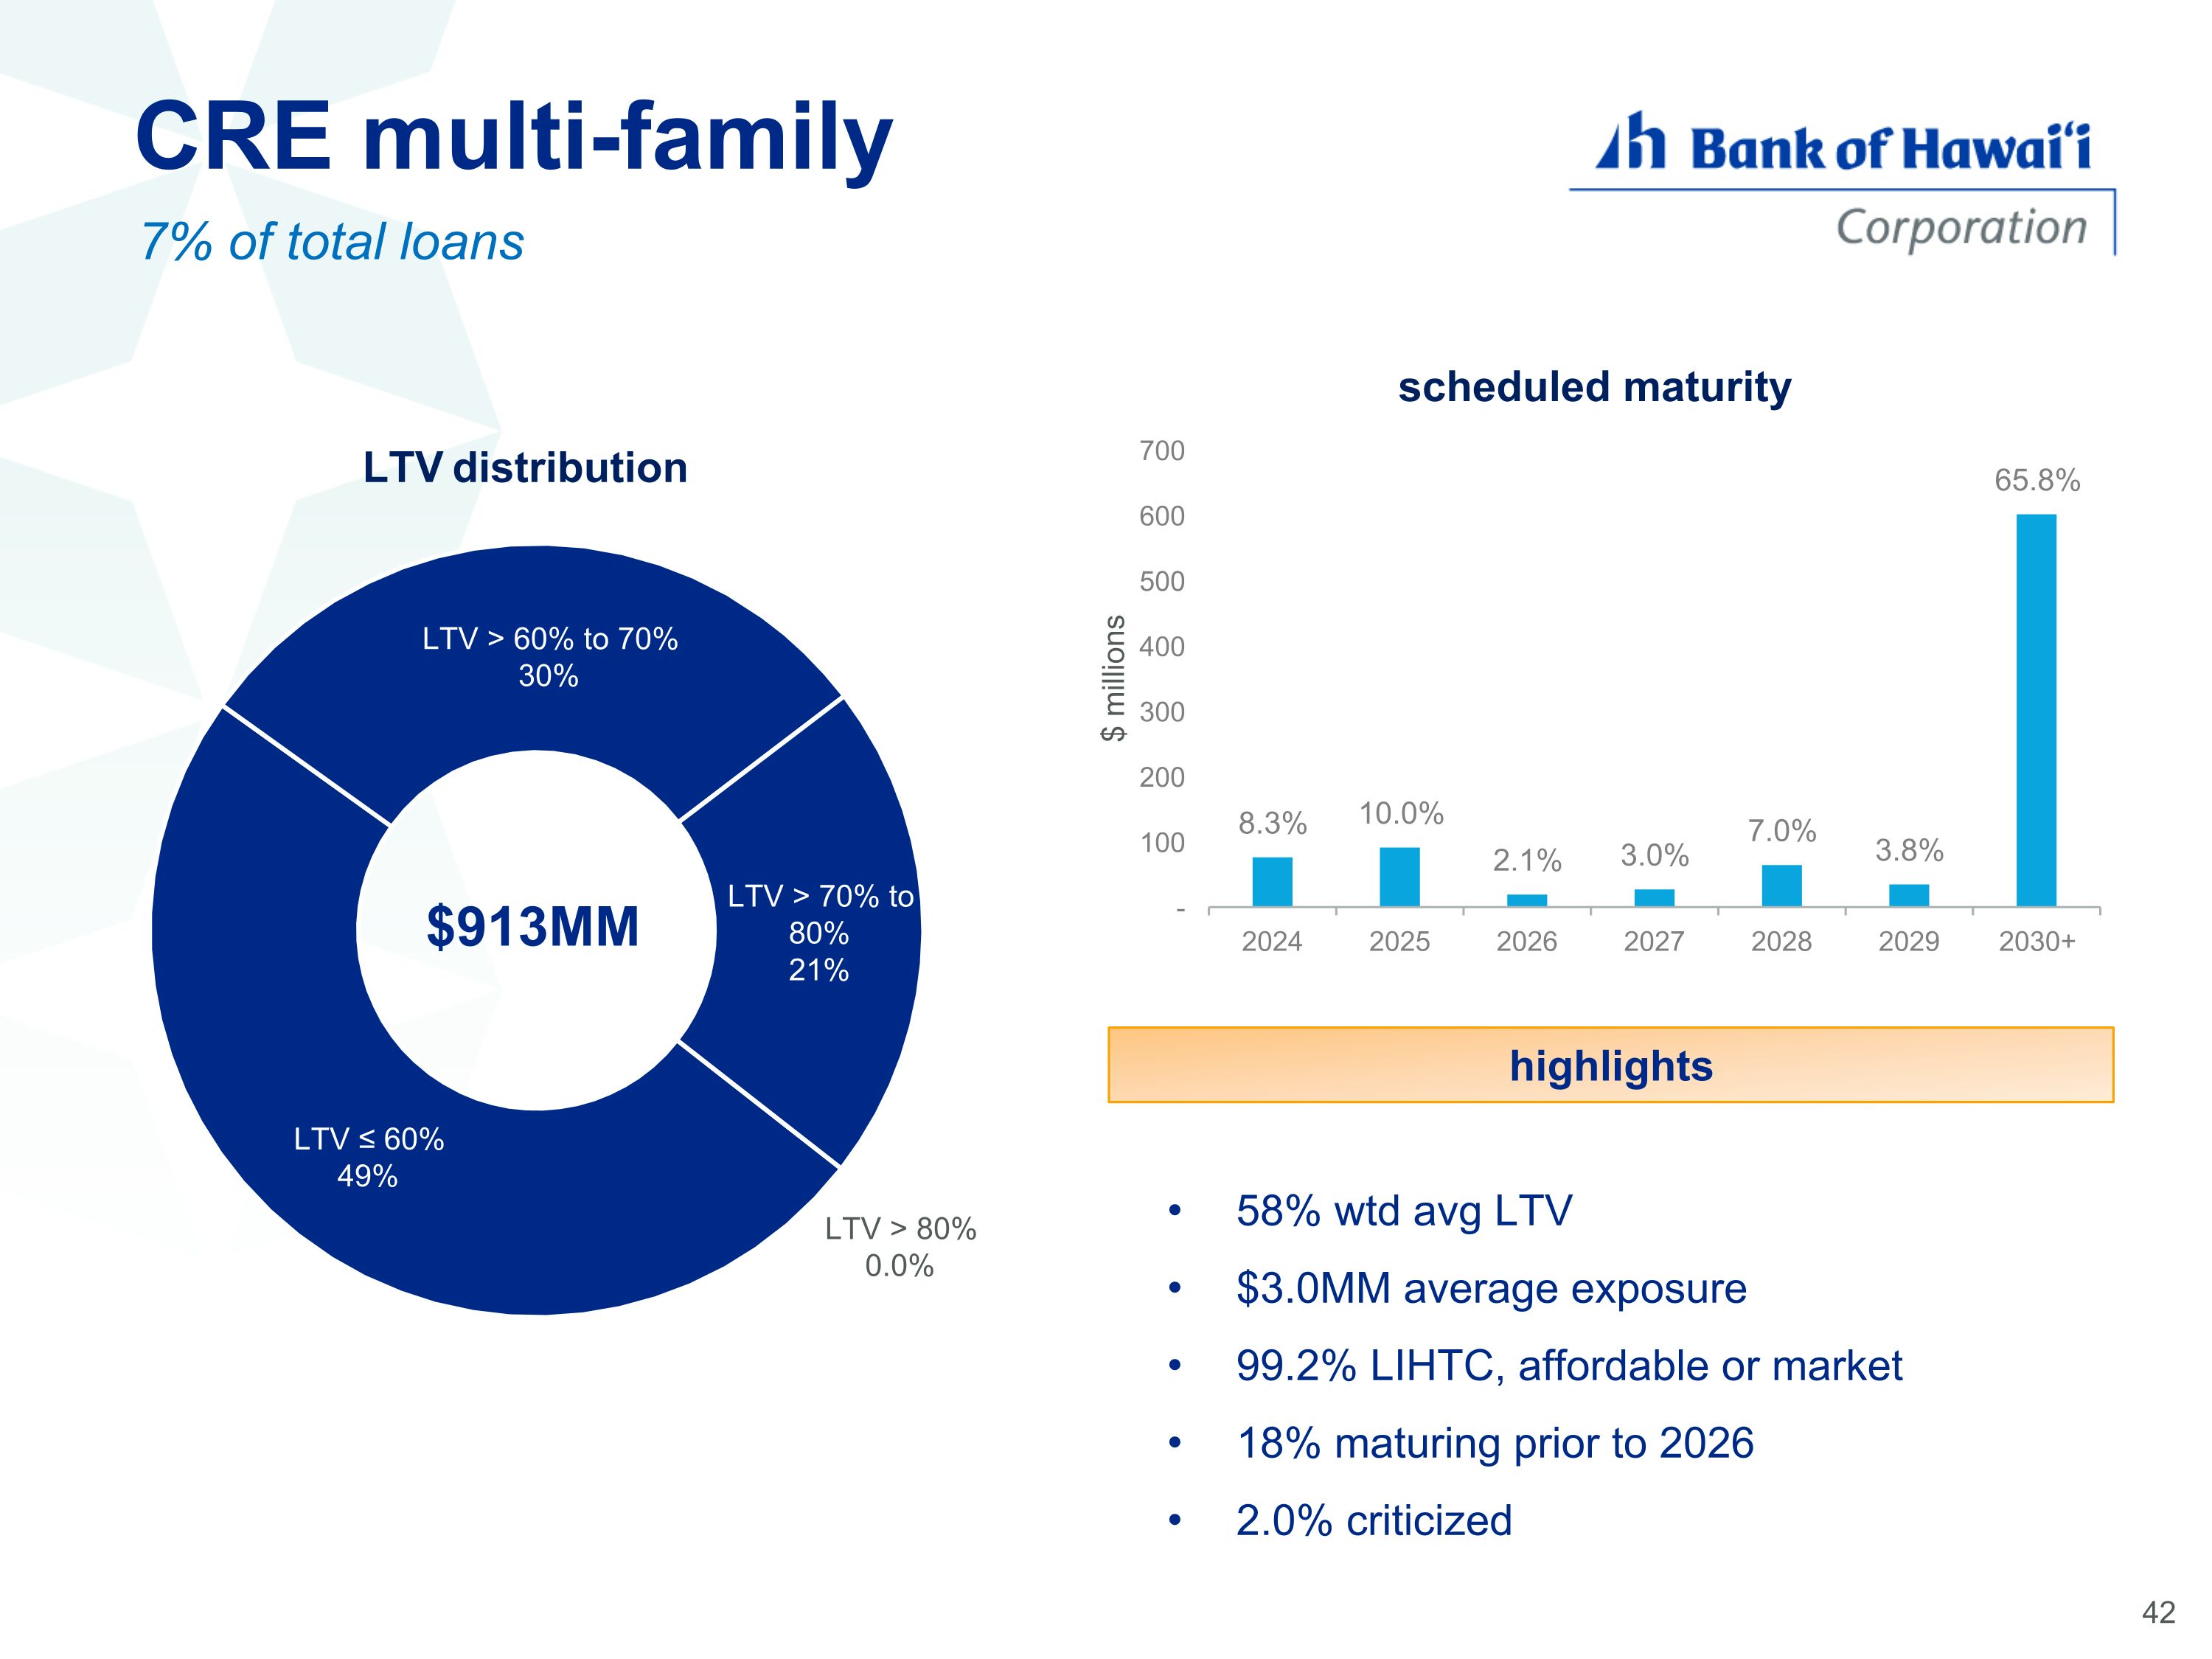
CRE multi-family 7% of total loans 58% wtd avg LTV $3.0MM average exposure 99.2% LIHTC, affordable or market 18% maturing prior to 2026 2.0% criticized highlights $913MM


