Bank of Hawai‘i Corporation fourth quarter 2022 financial report January 23, 2023 Exhibit 99.2
this presentation, and other statements made by the Company in connection with it, may contain forward-looking statements concerning, among other things, forecasts of our financial results and condition, expectations for our operations and business prospects, and our assumptions used in those forecasts and expectations. we have not committed to update forward-looking statements to reflect later events or circumstances. disclosure 2 forward-looking statements
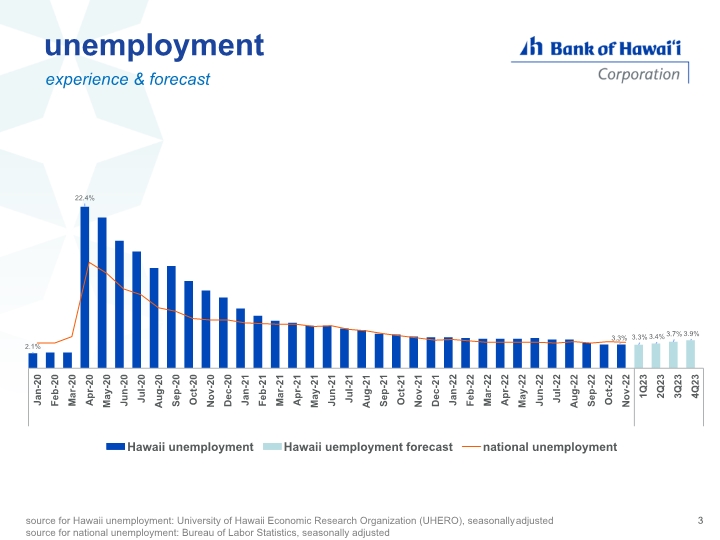
unemployment experience & forecast source for Hawaii unemployment: University of Hawaii Economic Research Organization (UHERO), seasonally adjusted source for national unemployment: Bureau of Labor Statistics, seasonally adjusted 3
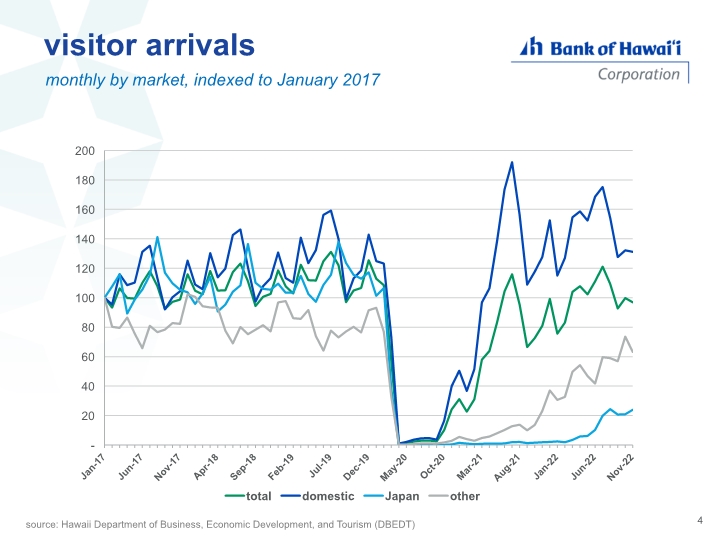
4 visitor arrivals monthly by market, indexed to January 2017 source: Hawaii Department of Business, Economic Development, and Tourism (DBEDT)
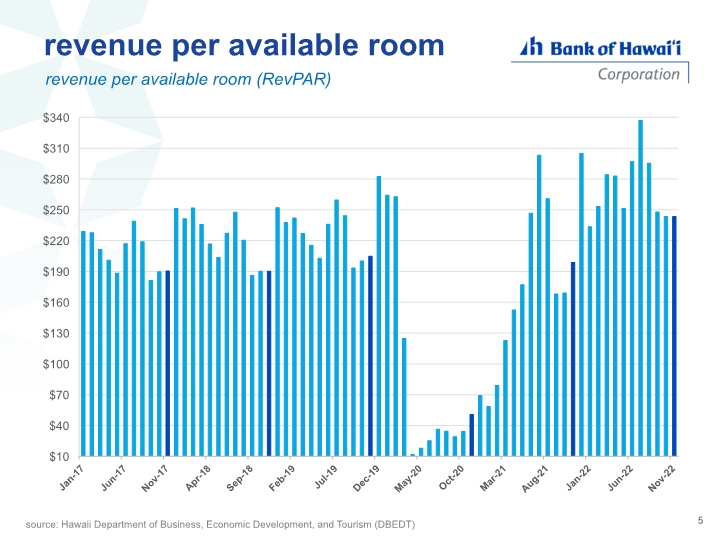
revenue per available room revenue per available room (RevPAR) 5 source: Hawaii Department of Business, Economic Development, and Tourism (DBEDT)
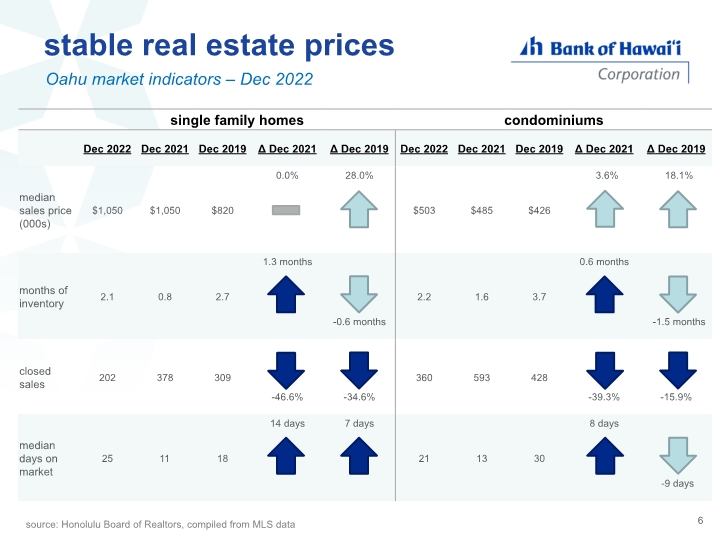
stable real estate prices Oahu market indicators – Dec 2022 6 source: Honolulu Board of Realtors, compiled from MLS data
4Q financial update
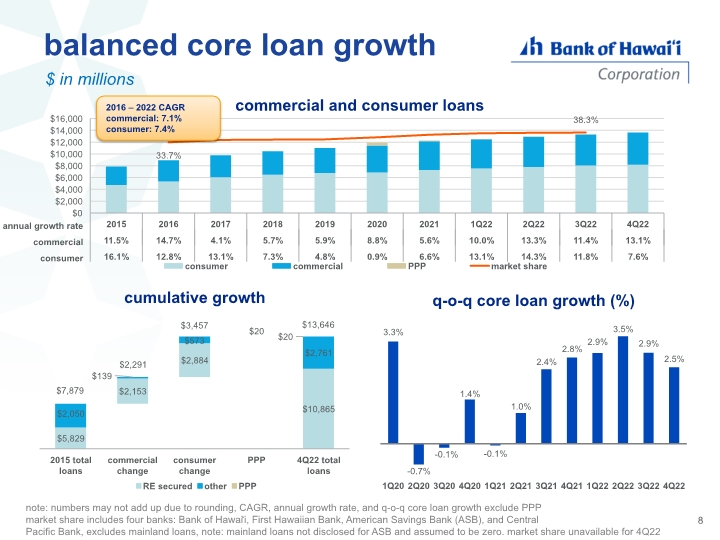
balanced core loan growth $ in millions 8 annual growth rate commercial consumer $13,646 note: numbers may not add up due to rounding, CAGR, annual growth rate, and q-o-q core loan growth exclude PPP market share includes four banks: Bank of Hawai‘i, First Hawaiian Bank, American Savings Bank (ASB), and Central Pacific Bank, excludes mainland loans, note: mainland loans not disclosed for ASB and assumed to be zero. market share unavailable for 4Q22 2016 – 2022 CAGR commercial: 7.1% consumer: 7.4%
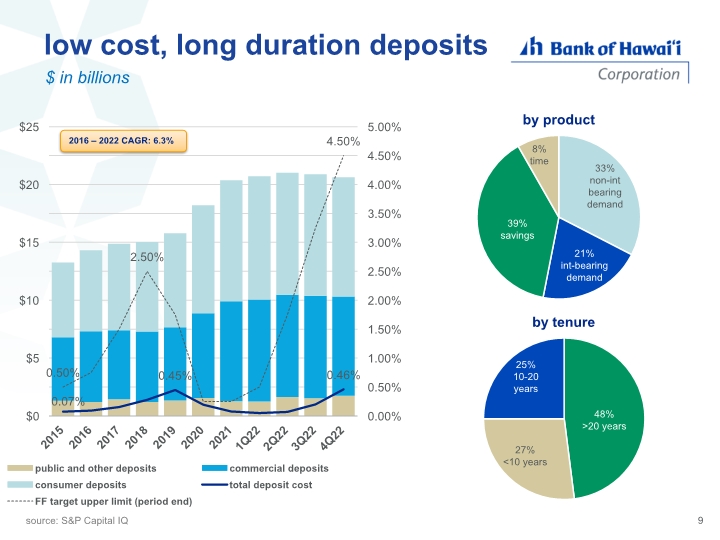
low cost, long duration deposits $ in billions 9 source: S&P Capital IQ 2016 – 2022 CAGR: 6.3%

strong deposit beta performance $ in billions 10 note: beta calculated as change in average total deposit rate divided by change in average Fed Funds rate
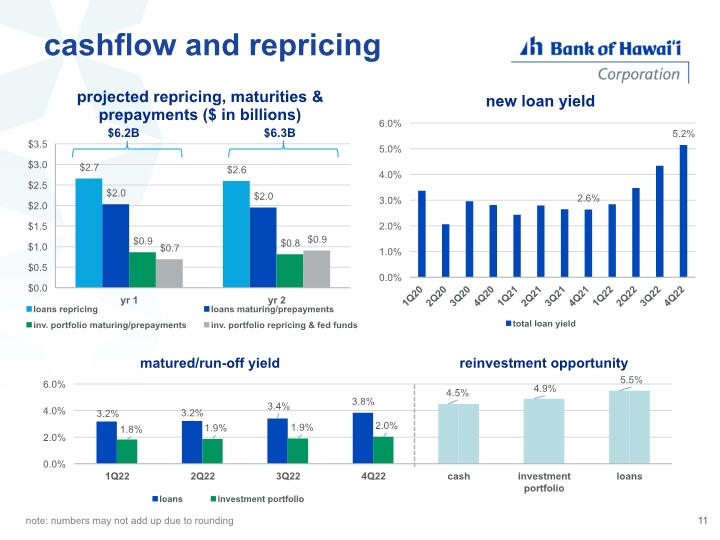
11 cashflow and repricing note: numbers may not add up due to rounding matured/run-off yield reinvestment opportunity
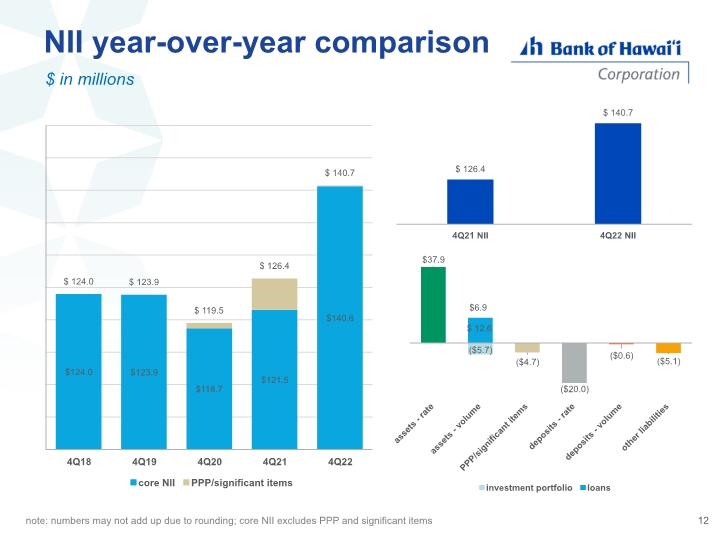
NII year-over-year comparison $ in millions 12 note: numbers may not add up due to rounding; core NII excludes PPP and significant items
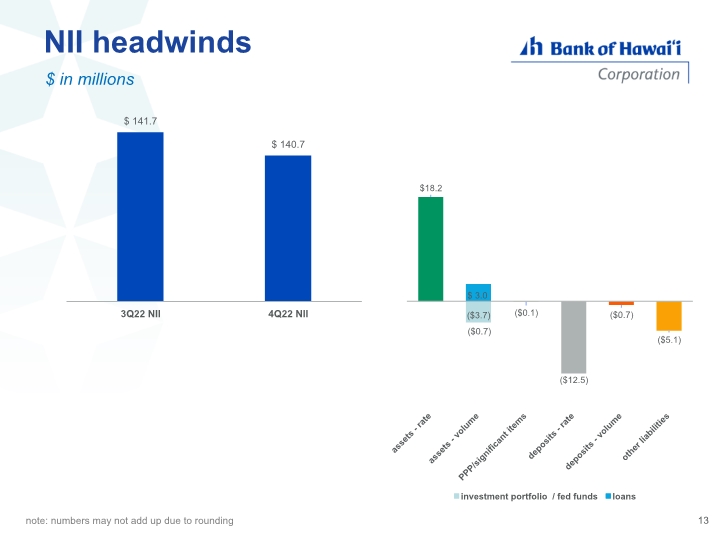
NII headwinds $ in millions 13 note: numbers may not add up due to rounding
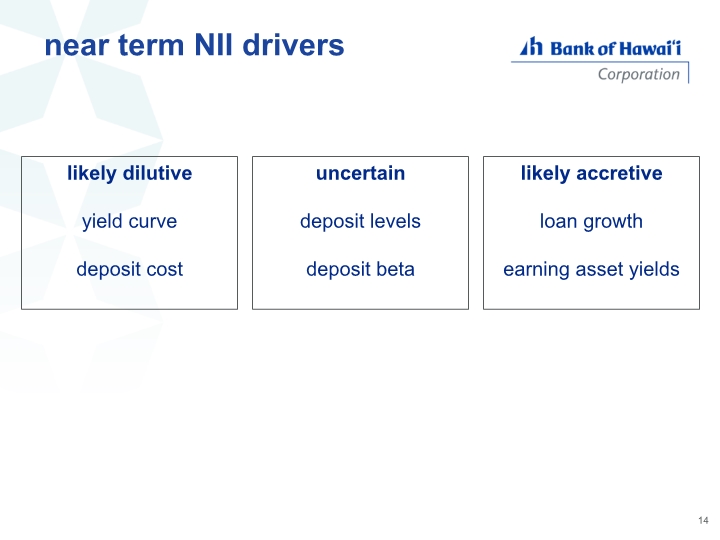
near term NII drivers 14 likely dilutive yield curve deposit cost uncertain deposit levels deposit beta likely accretive loan growth earning asset yields
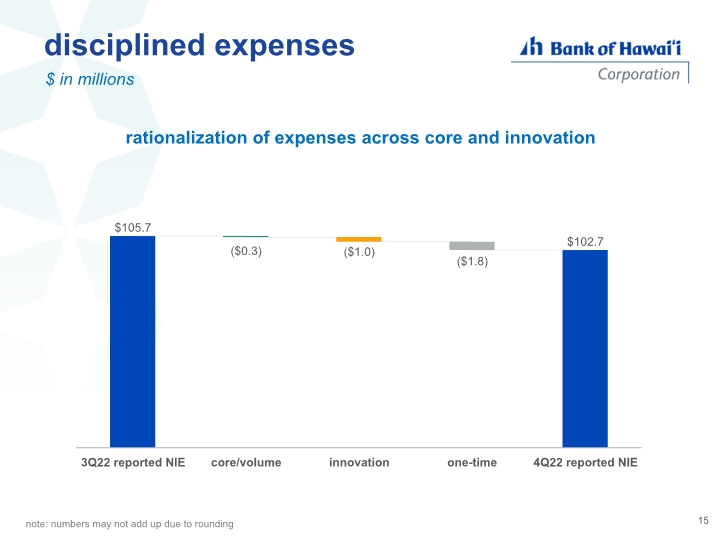
disciplined expenses $ in millions 15 rationalization of expenses across core and innovation note: numbers may not add up due to rounding
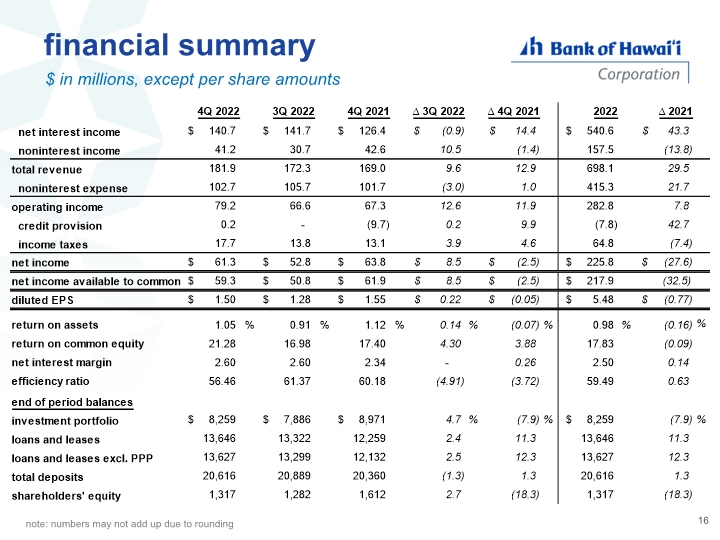
financial summary $ in millions, except per share amounts 16 note: numbers may not add up due to rounding
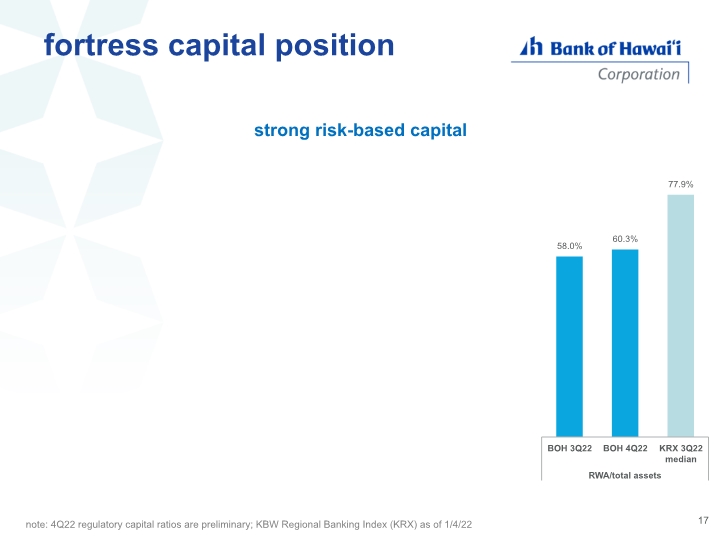
17 strong risk-based capital fortress capital position note: 4Q22 regulatory capital ratios are preliminary; KBW Regional Banking Index (KRX) as of 1/4/22
4Q credit update

loan portfolio excluding PPP 19 40% commercial 73% real estate secured wtd avg LTV 57% 57% w/ BOH ≥ 10 yrs avg balance $0.7MM CRE C&I residential mortgage home equity auto leasing other consumer construction 60% consumer 84% real estate secured wtd avg LTV 55% 57% w/ BOH ≥ 10 yrs 80% of portfolio secured with quality real estate with combined weighted average loan to value of 56% note: excludes $20MM in PPP loan balances including deferred costs and fees
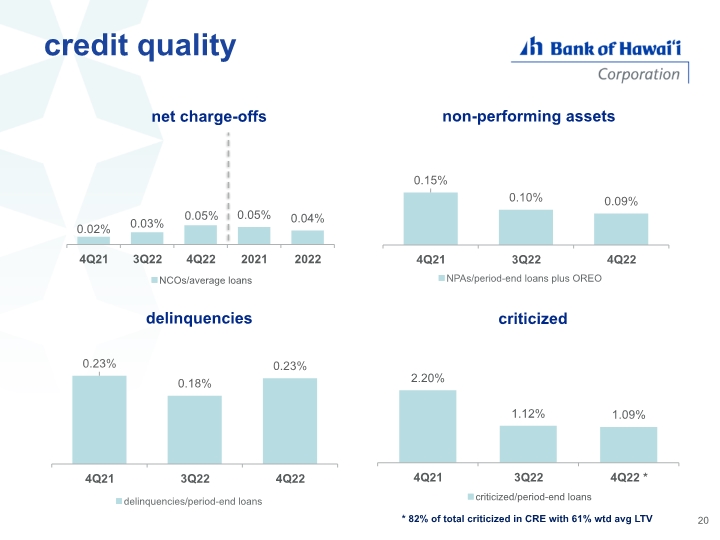
credit quality 20 * 82% of total criticized in CRE with 61% wtd avg LTV
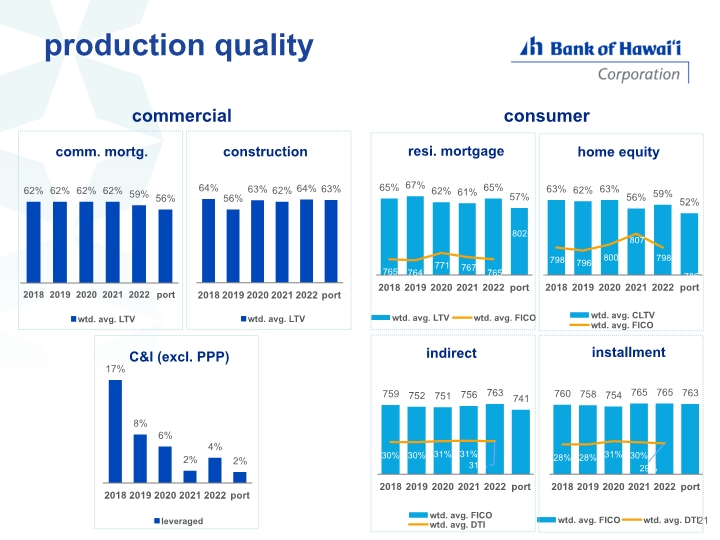
production quality 21 commercial consumer
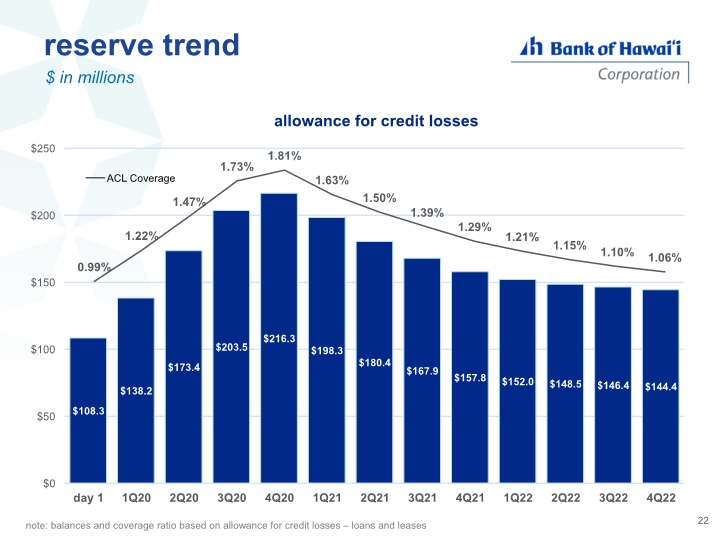
reserve trend 22 $ in millions allowance for credit losses note: balances and coverage ratio based on allowance for credit losses – loans and leases
well positioned for current environment 23 market leading brand awareness and penetration superior credit quality deposit betas fortified by granular, long-tenured deposit base controlled expenses solid capital

Q & A


