Exhibit 99.1
HEI 2012 Statistical Supplement Shelee M. T. Kimura Manager, Investor Relations and Strategic Planning Phone: 808-543-7384 Fax: 808-203-1164 E-mail: skimura@hei.com |
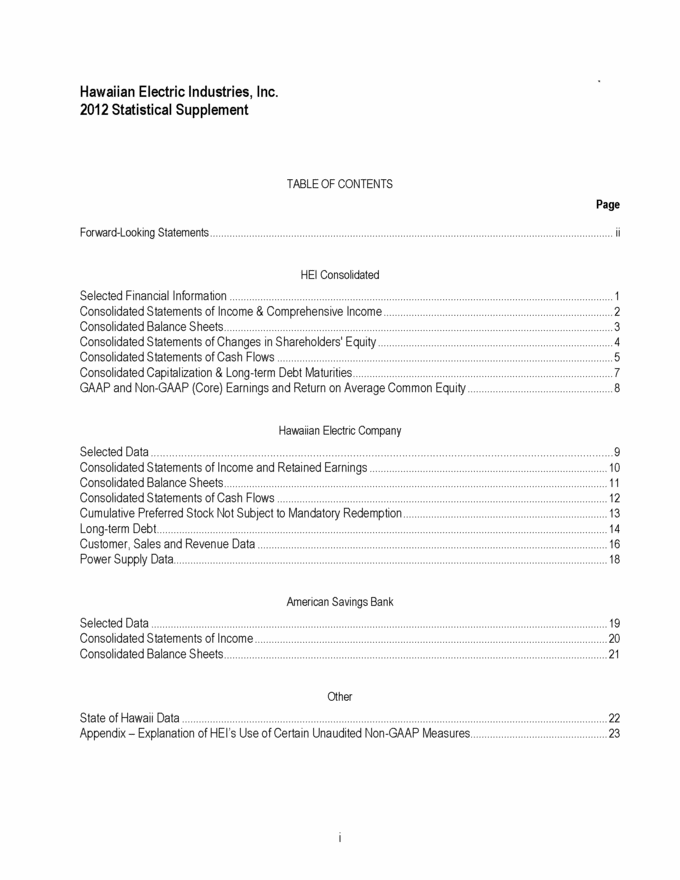
10 Hawaiian Electric Industries, Inc. 2012 Statistical Supplement TABLE OF CONTENTS Page Forward-Looking Statements ii HEI Consolidated Selected Financial Information 1 Consolidated Statements of Income & Comprehensive Income 2 Consolidated Balance Sheets 3 Consolidated Statements of Changes in Shareholders' Equity 4 Consolidated Statements of Cash Flows 5 Consolidated Capitalization & Long-term Debt Maturities 7 GAAP and Non-GAAP (Core) Earnings and Return on Average Common Equity 8 Hawaiian Electric Company Selected Data 9 Consolidated Statements of Income and Retained Earnings 10 Consolidated Balance Sheets 11 Consolidated Statements of Cash Flows 12 Cumulative Preferred Stock Not Subject to Mandatory Redemption 13 Long-term Debt 14 Customer, Sales and Revenue Data 16 Power Supply Data 18 American Savings Bank Selected Data 19 Consolidated Statements of Income 20 Consolidated Balance Sheets 21 Other State of Hawaii Data 22 Appendix – Explanation of HEI’s Use of Certain Unaudited Non-GAAP Measures 23 i |
Forward-Looking Statements This report and other presentations made by Hawaiian Electric Industries, Inc. (HEI) and Hawaiian Electric Company, Inc. (HECO) and their subsidiaries contain “forward-looking statements,” which include statements that are predictive in nature, depend upon or refer to future events or conditions, and usually include words such as “expects,” “anticipates,” “intends,” “plans,” “believes,” “predicts,” “estimates” or similar expressions. In addition, any statements concerning future financial performance, ongoing business strategies or prospects or possible future actions are also forward-looking statements. Forward-looking statements are based on current expectations and projections about future events and are subject to risks, uncertainties and the accuracy of assumptions concerning HEI and its subsidiaries (collectively, the Company), the performance of the industries in which they do business and economic and market factors, among other things. These forward-looking statements are not guarantees of future performance. Risks, uncertainties and other important factors that could cause actual results to differ materially from those described in forward-looking statements and from historical results include, but are not limited to, the following: • international, national and local economic conditions, including the state of the Hawaii tourism, defense and construction industries, the strength or weakness of the Hawaii and continental U.S. real estate markets (including the fair value and/or the actual performance of collateral underlying loans held by American Savings Bank, F.S.B. (ASB), which could result in higher loan loss provisions and write-offs), decisions concerning the extent of the presence of the federal government and military in Hawaii, the implications and potential impacts of U.S. and foreign capital and credit market conditions and federal, state and international responses to those conditions, and the potential impacts of global developments (including global economic conditions and uncertainties, unrest, conflict and the overthrow of governmental regimes in North Africa and the Middle East, terrorist acts, the war on terrorism, continuing U.S. presence in Afghanistan and potential conflict or crisis with North Korea or Iran); • weather and natural disasters (e.g., hurricanes, earthquakes, tsunamis, lightning strikes and the potential effects of global warming, such as more severe storms and rising sea levels), including their impact on Company operations and the economy; • the timing and extent of changes in interest rates and the shape of the yield curve; • the ability of the Company to access credit markets to obtain commercial paper and other short-term and long-term debt financing (including lines of credit) and to access capital markets to issue HEI common stock under volatile and challenging market conditions, and the cost of such financings, if available; • the risks inherent in changes in the value of the Company’s pension and other retirement plan assets and ASB’s securities available for sale; • changes in laws, regulations, market conditions and other factors that result in changes in assumptions used to calculate retirement benefits costs and funding requirements; • the impact of the Dodd-Frank Wall Street Reform and Consumer Protection Act of 2010 (Dodd-Frank Act) and of the rules and regulations that the Dodd-Frank Act requires to be promulgated; • increasing competition in the banking industry (e.g., increased price competition for deposits, or an outflow of deposits to alternative investments, which may have an adverse impact on ASB’s cost of funds); • the implementation of the Energy Agreement with the State of Hawaii and Consumer Advocate (Energy Agreement) setting forth the goals and objectives of a Hawaii Clean Energy Initiative (HCEI), revenue decoupling and the fulfillment by the electric utilities of their commitments under the Energy Agreement (given the Public Utilities Commission of the State of Hawaii (PUC) approvals needed; the PUC’s potential delay in considering (and potential disapproval of actual or proposed) HCEI-related costs; reliance by the Company on outside parties like the state, independent power producers (IPPs) and developers; potential changes in political support for the HCEI; and uncertainties surrounding wind power, the proposed undersea cables, biofuels, environmental assessments and the impacts of implementation of the HCEI on future costs of electricity); • capacity and supply constraints or difficulties, especially if generating units (utility-owned or IPP-owned) fail or measures such as demand-side management (DSM), distributed generation, combined heat and power or other firm capacity supply-side resources fall short of achieving their forecasted benefits or are otherwise insufficient to reduce or meet peak demand; • fuel oil price changes, performance by suppliers of their fuel oil delivery obligations and the continued availability to the electric utilities of their energy cost adjustment clauses (ECACs); • the continued availability to the electric utilities of other cost recovery mechanisms, including the purchased power adjustment clauses (PPACs), revenue adjustment mechanisms (RAMs) and pension and postretirement benefits other than pensions (OPEB) tracking mechanisms, and the continued decoupling of revenues from sales; • the impact of fuel price volatility on customer satisfaction and political and regulatory support for the utilities; ii |
• the risks associated with increasing reliance on renewable energy, as contemplated under the Energy Agreement, including the availability and cost of non-fossil fuel supplies for renewable energy generation and the operational impacts of adding intermittent sources of renewable energy to the electric grid; • the ability of IPPs to deliver the firm capacity anticipated in their power purchase agreements (PPAs); • the ability of the electric utilities to negotiate, periodically, favorable fuel supply and collective bargaining agreements; • new technological developments that could affect the operations and prospects of HEI and its subsidiaries (including HECO and its subsidiaries and ASB) or their competitors; • cyber security risks and the potential for cyber incidents, including potential incidents at HEI, ASB and HECO and their subsidiaries (including at ASB branches and at the electric utility plants) and incidents at data processing centers they use, to the extent not prevented by intrusion detection and prevention systems, anti-virus software, firewalls and other general information technology controls; • federal, state, county and international governmental and regulatory actions, such as changes in laws, rules and regulations applicable to HEI, HECO, ASB and their subsidiaries (including changes in taxation, increases in capital requirements, regulatory changes resulting from the HCEI, environmental laws and regulations (including resulting compliance costs and risks of fines and penalties), the regulation of greenhouse gas (GHG) emissions, governmental fees and assessments (such as Federal Deposit Insurance Corporation assessments), and potential carbon “cap and trade” legislation that may fundamentally alter costs to produce electricity and accelerate the move to renewable generation); • decisions by the PUC in rate cases and other proceedings (including the risks of delays in the timing of decisions, adverse changes in final decisions from interim decisions and the disallowance of project costs as a result of adverse regulatory audit reports or otherwise); • decisions by the PUC and by other agencies and courts on land use, environmental and other permitting issues (such as required corrective actions and restrictions and penalties that may arise, such as with respect to environmental conditions or renewable portfolio standards (RPS)); • potential enforcement actions by the Office of the Comptroller of the Currency, the Federal Reserve Board (FRB), the Federal Deposit Insurance Corporation (FDIC) and/or other governmental authorities (such as consent orders, required corrective actions, restrictions and penalties that may arise, for example, with respect to compliance deficiencies under existing or new banking and consumer protection laws and regulations or with respect to capital adequacy); • ability to recover increasing costs and earn a reasonable return on capital investments not covered by revenue adjustment mechanisms; • the risks associated with the geographic concentration of HEI’s businesses and ASB’s loans, ASB’s concentration in a single product type (i.e., first mortgages) and ASB’s significant credit relationships (i.e., concentrations of large loans and/or credit lines with certain customers); • changes in accounting principles applicable to HEI, HECO, ASB and their subsidiaries, including the possible adoption of International Financial Reporting Standards or new U.S. accounting standards, the potential discontinuance of regulatory accounting and the effects of potentially required consolidation of variable interest entities (VIEs) or required capital lease accounting for PPAs with IPPs; • changes by securities rating agencies in their ratings of the securities of HEI and HECO and the results of financing efforts; • faster than expected loan prepayments that can cause an acceleration of the amortization of premiums on loans and investments and the impairment of mortgage-servicing assets of ASB; • changes in ASB’s loan portfolio credit profile and asset quality which may increase or decrease the required level of allowance for loan losses and charge-offs; • changes in ASB’s deposit cost or mix which may have an adverse impact on ASB’s cost of funds; • the final outcome of tax positions taken by HEI, HECO, ASB and their subsidiaries; • the risks of suffering losses and incurring liabilities that are uninsured (e.g., damages to the utilities’ transmission and distribution system and losses from business interruption) or underinsured (e.g., losses not covered as a result of insurance deductibles or other exclusions or exceeding policy limits); and • other risks or uncertainties described elsewhere in other reports (e.g., Item 1A. Risk Factors in the Company’s Annual Report on Form 10-K) previously and subsequently filed by HEI and/or HECO with the Securities and Exchange Commission (SEC). Forward-looking statements speak only as of the date of the report, presentation or filing in which they are made. Except to the extent required by the federal securities laws, HEI, HECO, ASB and their subsidiaries undertake no obligation to publicly update or revise any forward-looking statements, whether as a result of new information, future events or otherwise. iii |
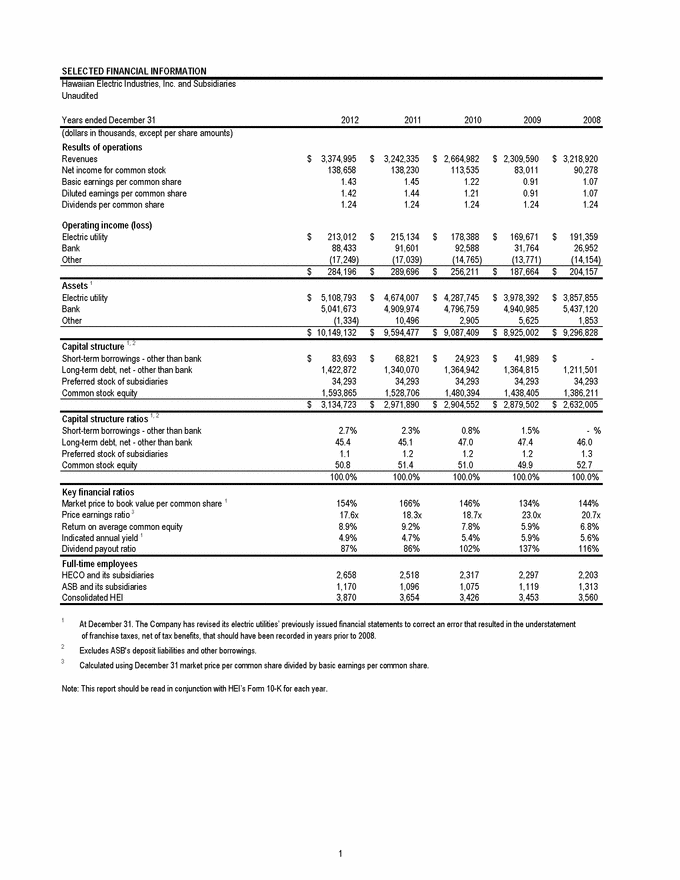
SELECTED FINANCIAL INFORMATION Hawaiian Electric Industries, Inc. and Subsidiaries Unaudited Years ended December 31 2012 2011 2010 2009 2008 (dollars in thousands, except per share amounts) Results of operations Revenues $3,374,995 $3,242,335 $2,664,982 $2,309,590 $3,218,920 Net income for common stock 138,658 138,230 113,535 83,011 90,278 Basic earnings per common share 1.43 1.45 1.22 0.91 1.07 Diluted earnings per common share 1.42 1.44 1.21 0.91 1.07 Dividends per common share 1.24 1.24 1.24 1.24 1.24 Operating income (loss) Electric utility $213,012 $215,134 $178,388 $169,671 $191,359 Bank 88,433 91,601 92,588 31,764 26,952 Other (17,249) (17,039) (14,765) (13,771) (14,154) $284,196 $289,696 $256,211 $187,664 $204,157 Assets 1 Electric utility $5,108,793 $4,674,007 $4,287,745 $3,978,392 $3,857,855 Bank 5,041,673 4,909,974 4,796,759 4,940,985 5,437,120 Other (1,334) 10,496 2,905 5,625 1,853 $10,149,132 $9,594,477 $9,087,409 $8,925,002 $9,296,828 Capital structure 1, 2 Short-term borrowings - other than bank $83,693 $68,821 $24,923 $41,989 $- Long-term debt, net - other than bank 1,422,872 1,340,070 1,364,942 1,364,815 1,211,501 Preferred stock of subsidiaries 34,293 34,293 34,293 34,293 34,293 Common stock equity 1,593,865 1,528,706 1,480,394 1,438,405 1,386,211 $3,134,723 $2,971,890 $2,904,552 $2,879,502 $2,632,005 Capital structure ratios 1, 2 Short-term borrowings - other than bank 2.7% 2.3% 0.8% 1.5% - % Long-term debt, net - other than bank 45.4 45.1 47.0 47.4 46.0 Preferred stock of subsidiaries 1.1 1.2 1.2 1.2 1.3 Common stock equity 50.8 51.4 51.0 49.9 52.7 100.0% 100.0% 100.0% 100.0% 100.0% Key financial ratios Market price to book value per common share 1 154% 166% 146% 134% 144% Price earnings ratio 3 17.6x 18.3x 18.7x 23.0x 20.7x Return on average common equity 8.9% 9.2% 7.8% 5.9% 6.8% Indicated annual yield 1 4.9% 4.7% 5.4% 5.9% 5.6% Dividend payout ratio 87% 86% 102% 137% 116% Full-time employees HECO and its subsidiaries 2,658 2,518 2,317 2,297 2,203 ASB and its subsidiaries 1,170 1,096 1,075 1,119 1,313 Consolidated HEI 3,870 3,654 3,426 3,453 3,560 1 At December 31. The Company has revised its electric utilities’ previously issued financial statements to correct an error that resulted in the understatement of franchise taxes, net of tax benefits, that should have been recorded in years prior to 2008. 2 Excludes ASB's deposit liabilities and other borrowings. 3 Calculated using December 31 market price per common share divided by basic earnings per common share. Note: This report should be read in conjunction with HEI’s Form 10-K for each year. 1 |
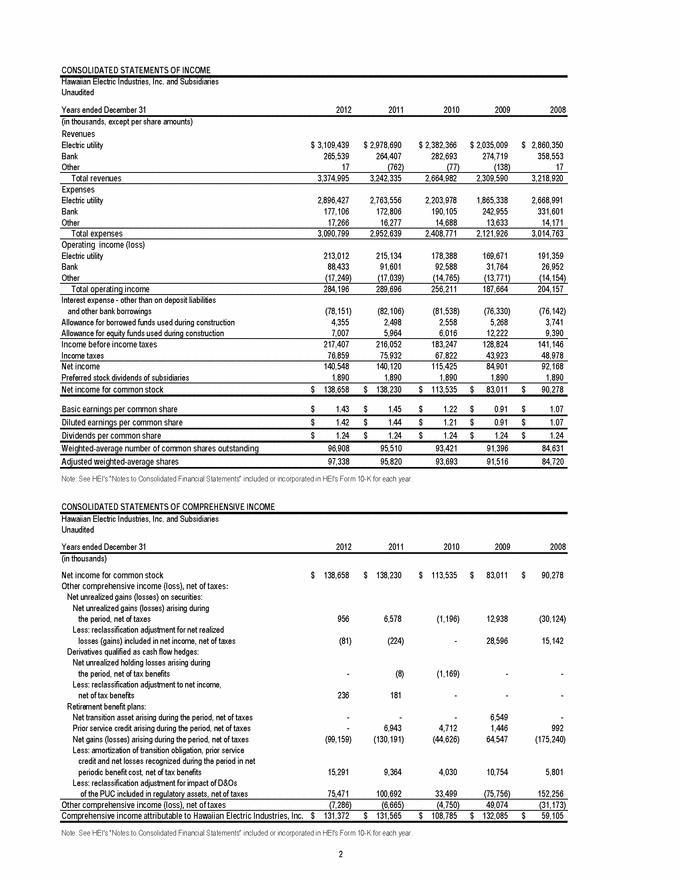
CONSOLIDATED STATEMENTS OF INCOME Hawaiian Electric Industries, Inc. and Subsidiaries Unaudited Years ended December 31 2012 2011 2010 2009 2008 (in thousands, except per share amounts) Revenues Electric utility $3,109,439 $2,978,690 $2,382,366 $2,035,009 $2,860,350 Bank 265,539 264,407 282,693 274,719 358,553 Other 17 (762) (77) (138) 17 Total revenues 3,374,995 3,242,335 2,664,982 2,309,590 3,218,920 Expenses Electric utility 2,896,427 2,763,556 2,203,978 1,865,338 2,668,991 Bank 177,106 172,806 190,105 242,955 331,601 Other 17,266 16,277 14,688 13,633 14,171 Total expenses 3,090,799 2,952,639 2,408,771 2,121,926 3,014,763 Operating income (loss) Electric utility 213,012 215,134 178,388 169,671 191,359 Bank 88,433 91,601 92,588 31,764 26,952 Other (17,249) (17,039) (14,765) (13,771) (14,154) Total operating income 284,196 289,696 256,211 187,664 204,157 Interest expense - other than on deposit liabilities and other bank borrowings (78,151) (82,106) (81,538) (76,330) (76,142) Allowance for borrowed funds used during construction 4,355 2,498 2,558 5,268 3,741 Allowance for equity funds used during construction 7,007 5,964 6,016 12,222 9,390 Income before income taxes 217,407 216,052 183,247 128,824 141,146 Income taxes 76,859 75,932 67,822 43,923 48,978 Net income 140,548 140,120 115,425 84,901 92,168 Preferred stock dividends of subsidiaries 1,890 1,890 1,890 1,890 1,890 Net income for common stock $138,658 $138,230 $113,535 $83,011 $90,278 Basic earnings per common share $1.43 $1.45 $1.22 $0.91 $1.07 Diluted earnings per common share $1.42 $1.44 $1.21 $0.91 $1.07 Dividends per common share $1.24 $1.24 $1.24 $1.24 $1.24 Weighted-average number of common shares outstanding 96,908 95,510 93,421 91,396 84,631 Adjusted weighted-average shares 97,338 95,820 93,693 91,516 84,720 Note: See HEI's “Notes to Consolidated Financial Statements” included or incorporated in HEI's Form 10-K for each year. CONSOLIDATED STATEMENTS OF COMPREHENSIVE INCOME Hawaiian Electric Industries, Inc. and Subsidiaries Unaudited Years ended December 31 2012 2011 2010 2009 2008 (in thousands) Net income for common stock $138,658 $138,230 $113,535 $83,011 $90,278 Other comprehensive income (loss), net of taxes: Net unrealized gains (losses) on securities: Net unrealized gains (losses) arising during the period, net of taxes 956 6,578 (1,196) 12,938 (30,124) Less: reclassification adjustment for net realized losses (gains) included in net income, net of taxes (81) (224) - 28,596 15,142 Derivatives qualified as cash flow hedges: Net unrealized holding losses arising during the period, net of tax benefits - (8) (1,169) - - Less: reclassification adjustment to net income, net of tax benefits 236 181 - - - Retirement benefit plans: Net transition asset arising during the period, net of taxes - - - 6,549 - Prior service credit arising during the period, net of taxes - 6,943 4,712 1,446 992 Net gains (losses) arising during the period, net of taxes (99,159) (130,191) (44,626) 64,547 (175,240) Less: amortization of transition obligation, prior service credit and net losses recognized during the period in net periodic benefit cost, net of tax benefits 15,291 9,364 4,030 10,754 5,801 Less: reclassification adjustment for impact of D&Os of the PUC included in regulatory assets, net of taxes 75,471 100,692 33,499 (75,756) 152,256 Other comprehensive income (loss), net of taxes (7,286) (6,665) (4,750) 49,074 (31,173) Comprehensive income attributable to Hawaiian Electric Industries, Inc. $131,372 $131,565 $108,785 $132,085 $59,105 Note: See HEI's “Notes to Consolidated Financial Statements” included or incorporated in HEI's Form 10-K for each year. 2 |
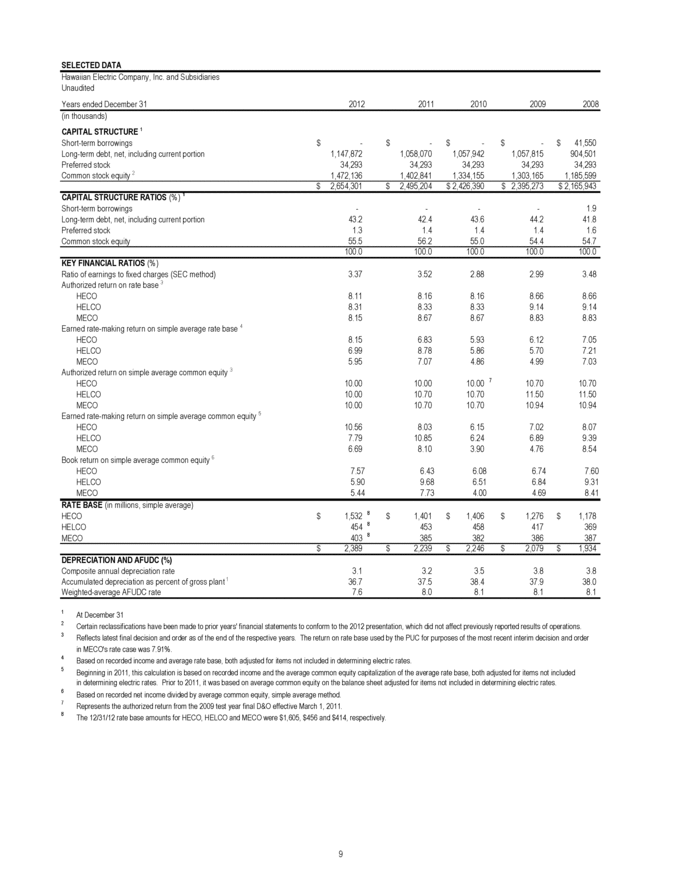
SELECTED DATA Hawaiian Electric Company, Inc. and Subsidiaries Unaudited Years ended December 31 2012 2011 2010 2009 2008 (in thousands) CAPITAL STRUCTURE 1 Short-term borrowings -$ -$ -$ -$ 41,550$ Long-term debt, net, including current portion 1,147,872 1,058,070 1,057,942 1,057,815 904,501 Preferred stock 34,293 34,293 34,293 34,293 34,293 Common stock equity 2 1,472,136 1,402,841 1,334,155 1,303,165 1,185,599 2,654,301$ 2,495,204$ 2,426,390$ 2,395,273$ 2,165,943$ CAPITAL STRUCTURE RATIOS (%) 1 Short-term borrowings - - - - 1.9 Long-term debt, net, including current portion 43.2 42.4 43.6 44.2 41.8 Preferred stock 1.3 1.4 1.4 1.4 1.6 Common stock equity 55.5 56.2 55.0 54.4 54.7 100.0 100.0 100.0 100.0 100.0 KEY FINANCIAL RATIOS (%) Ratio of earnings to fixed charges (SEC method) 3.37 3.52 2.88 2.99 3.48 Authorized return on rate base 3 HECO 8.11 8.16 8.16 8.66 8.66 HELCO 8.31 8.33 8.33 9.14 9.14 MECO 8.15 8.67 8.67 8.83 8.83 Earned rate-making return on simple average rate base 4 HECO 8.15 6.83 5.93 6.12 7.05 HELCO 6.99 8.78 5.86 5.70 7.21 MECO 5.95 7.07 4.86 4.99 7.03 Authorized return on simple average common equity 3 HECO 10.00 10.00 10.00 7 10.70 10.70 HELCO 10.00 10.70 10.70 11.50 11.50 MECO 10.00 10.70 10.70 10.94 10.94 Earned rate-making return on simple average common equity 5 HECO 10.56 8.03 6.15 7.02 8.07 HELCO 7.79 10.85 6.24 6.89 9.39 MECO 6.69 8.10 3.90 4.76 8.54 Book return on simple average common equity 6 HECO 7.57 6.43 6.08 6.74 7.60 HELCO 5.90 9.68 6.51 6.84 9.31 MECO 5.44 7.73 4.00 4.69 8.41 RATE BASE (in millions, simple average) HECO 1,532$ 8 1,401$ 1,406$ 1,276$ 1,178$ HELCO 454 8 453 458 417 369 MECO 403 8 385 382 386 387 2,389$ 2,239$ 2,246$ 2,079$ 1,934$ DEPRECIATION AND AFUDC (%) Composite annual depreciation rate 3.1 3.2 3.5 3.8 3.8 Accumulated depreciation as percent of gross plant 1 36.7 37.5 38.4 37.9 38.0 Weighted-average AFUDC rate 7.6 8.0 8.1 8.1 8.1 1 At December 31 2 Certain reclassifications have been made to prior years' financial statements to conform to the 2012 presentation, which did not affect previously reported results of operations. 3 Reflects latest final decision and order as of the end of the respective years. The return on rate base used by the PUC for purposes of the most recent interim decision and order in MECO's rate case was 7.91%. 4 Based on recorded income and average rate base, both adjusted for items not included in determining electric rates. 5 Beginning in 2011, this calculation is based on recorded income and the average common equity capitalization of the average rate base, both adjusted for items not included in determining electric rates. Prior to 2011, it was based on average common equity on the balance sheet adjusted for items not included in determining electric rates. 6 Based on recorded net income divided by average common equity, simple average method. 7 Represents the authorized return from the 2009 test year final D&O effective March 1, 2011. 8 The 12/31/12 rate base amounts for HECO, HELCO and MECO were $1,605, $456 and $414, respectively. |
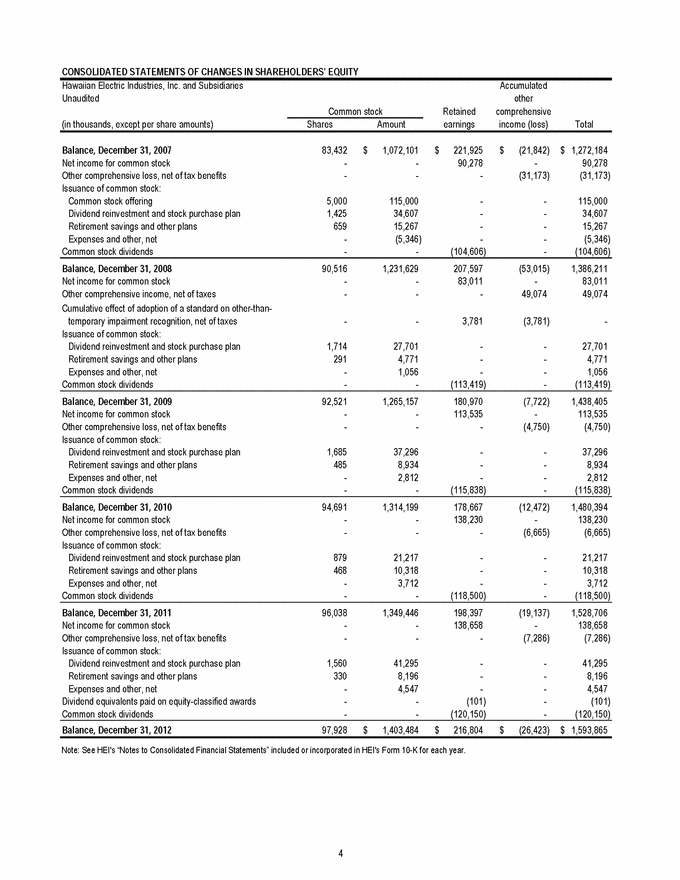
CONSOLIDATED STATEMENTS OF CHANGES IN SHAREHOLDERS' EQUITY Hawaiian Electric Industries, Inc. and Subsidiaries Accumulated Unaudited other Common stock Retained comprehensive (in thousands, except per share amounts) Shares Amount earnings income (loss) Total Balance, December 31, 2007 83,432 $1,072,101 $221,925 $(21,842) $1,272,184 Net income for common stock - - 90,278 - 90,278 Other comprehensive loss, net of tax benefits - - - (31,173) (31,173) Issuance of common stock: Common stock offering 5,000 115,000 - - 115,000 Dividend reinvestment and stock purchase plan 1,425 34,607 - - 34,607 Retirement savings and other plans 659 15,267 - - 15,267 Expenses and other, net - (5,346) - - (5,346) Common stock dividends - - (104,606) - (104,606) Balance, December 31, 2008 90,516 1,231,629 207,597 (53,015) 1,386,211 Net income for common stock - - 83,011 - 83,011 Other comprehensive income, net of taxes - - - 49,074 49,074 Cumulative effect of adoption of a standard on other-than- temporary impairment recognition, net of taxes - - 3,781 (3,781) - Issuance of common stock: Dividend reinvestment and stock purchase plan 1,714 27,701 - - 27,701 Retirement savings and other plans 291 4,771 - - 4,771 Expenses and other, net - 1,056 - - 1,056 Common stock dividends - - (113,419) - (113,419) Balance, December 31, 2009 92,521 1,265,157 180,970 (7,722) 1,438,405 Net income for common stock - - 113,535 - 113,535 Other comprehensive loss, net of tax benefits - - - (4,750) (4,750) Issuance of common stock: Dividend reinvestment and stock purchase plan 1,685 37,296 - - 37,296 Retirement savings and other plans 485 8,934 - - 8,934 Expenses and other, net - 2,812 - - 2,812 Common stock dividends - - (115,838) - (115,838) Balance, December 31, 2010 94,691 1,314,199 178,667 (12,472) 1,480,394 Net income for common stock - - 138,230 - 138,230 Other comprehensive loss, net of tax benefits - - - (6,665) (6,665) Issuance of common stock: Dividend reinvestment and stock purchase plan 879 21,217 - - 21,217 Retirement savings and other plans 468 10,318 - - 10,318 Expenses and other, net - 3,712 - - 3,712 Common stock dividends - - (118,500) - (118,500) Balance, December 31, 2011 96,038 1,349,446 198,397 (19,137) 1,528,706 Net income for common stock - - 138,658 - 138,658 Other comprehensive loss, net of tax benefits - - - (7,286) (7,286) Issuance of common stock: Dividend reinvestment and stock purchase plan 1,560 41,295 - - 41,295 Retirement savings and other plans 330 8,196 - - 8,196 Expenses and other, net - 4,547 - - 4,547 Dividend equivalents paid on equity-classified awards - - (101) - (101) Common stock dividends - - (120,150) - (120,150) Balance, December 31, 2012 97,928 $1,403,484 $216,804 $(26,423) $1,593,865 Note: See HEI's “Notes to Consolidated Financial Statements” included or incorporated in HEI's Form 10-K for each year. 4 |
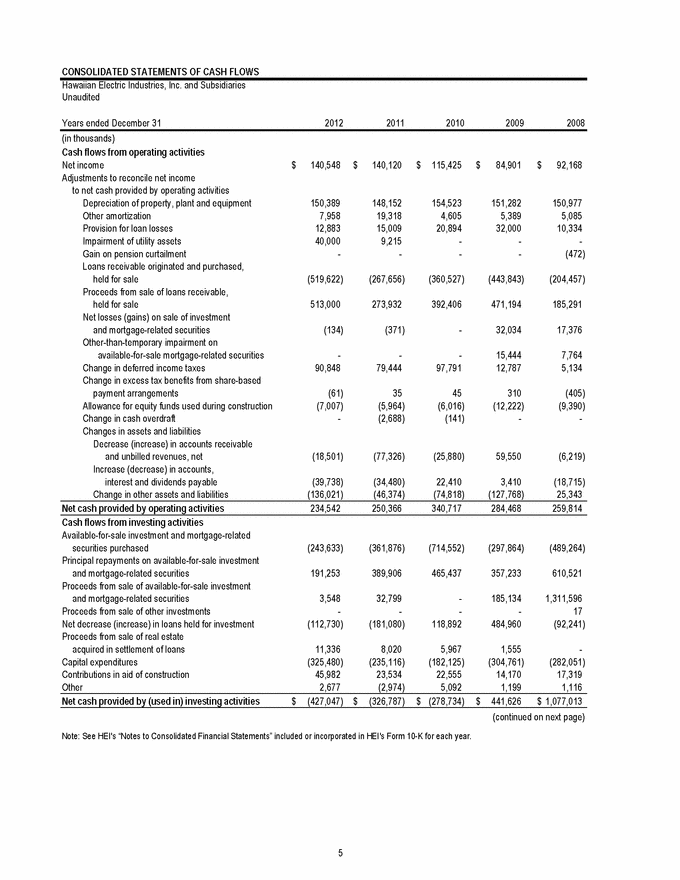
CONSOLIDATED STATEMENTS OF CASH FLOWS Hawaiian Electric Industries, Inc. and Subsidiaries Unaudited Years ended December 31 2012 2011 2010 2009 2008 (in thousands) Cash flows from operating activities Net income $140,548 $140,120 $115,425 $84,901 $92,168 Adjustments to reconcile net income to net cash provided by operating activities Depreciation of property, plant and equipment 150,389 148,152 154,523 151,282 150,977 Other amortization 7,958 19,318 4,605 5,389 5,085 Provision for loan losses 12,883 15,009 20,894 32,000 10,334 Impairment of utility assets 40,000 9,215 - - - Gain on pension curtailment - - - - (472) Loans receivable originated and purchased, held for sale (519,622) (267,656) (360,527) (443,843) (204,457) Proceeds from sale of loans receivable, held for sale 513,000 273,932 392,406 471,194 185,291 Net losses (gains) on sale of investment and mortgage-related securities (134) (371) - 32,034 17,376 Other-than-temporary impairment on available-for-sale mortgage-related securities - - - 15,444 7,764 Change in deferred income taxes 90,848 79,444 97,791 12,787 5,134 Change in excess tax benefits from share-based payment arrangements (61) 35 45 310 (405) Allowance for equity funds used during construction (7,007) (5,964) (6,016) (12,222) (9,390) Change in cash overdraft - (2,688) (141) - - Changes in assets and liabilities Decrease (increase) in accounts receivable and unbilled revenues, net (18,501) (77,326) (25,880) 59,550 (6,219) Increase (decrease) in accounts, interest and dividends payable (39,738) (34,480) 22,410 3,410 (18,715) Change in other assets and liabilities (136,021) (46,374) (74,818) (127,768) 25,343 Net cash provided by operating activities 234,542 250,366 340,717 284,468 259,814 Cash flows from investing activities Available-for-sale investment and mortgage-related securities purchased (243,633) (361,876) (714,552) (297,864) (489,264) Principal repayments on available-for-sale investment and mortgage-related securities 191,253 389,906 465,437 357,233 610,521 Proceeds from sale of available-for-sale investment and mortgage-related securities 3,548 32,799 - 185,134 1,311,596 Proceeds from sale of other investments - - - - 17 Net decrease (increase) in loans held for investment (112,730) (181,080) 118,892 484,960 (92,241) Proceeds from sale of real estate acquired in settlement of loans 11,336 8,020 5,967 1,555 - Capital expenditures (325,480) (235,116) (182,125) (304,761) (282,051) Contributions in aid of construction 45,982 23,534 22,555 14,170 17,319 Other 2,677 (2,974) 5,092 1,199 1,116 Net cash provided by (used in) investing activities $(427,047) $(326,787) $(278,734) $441,626 $1,077,013 (continued on next page) Note: See HEI's “Notes to Consolidated Financial Statements” included or incorporated in HEI's Form 10-K for each year. 5 |
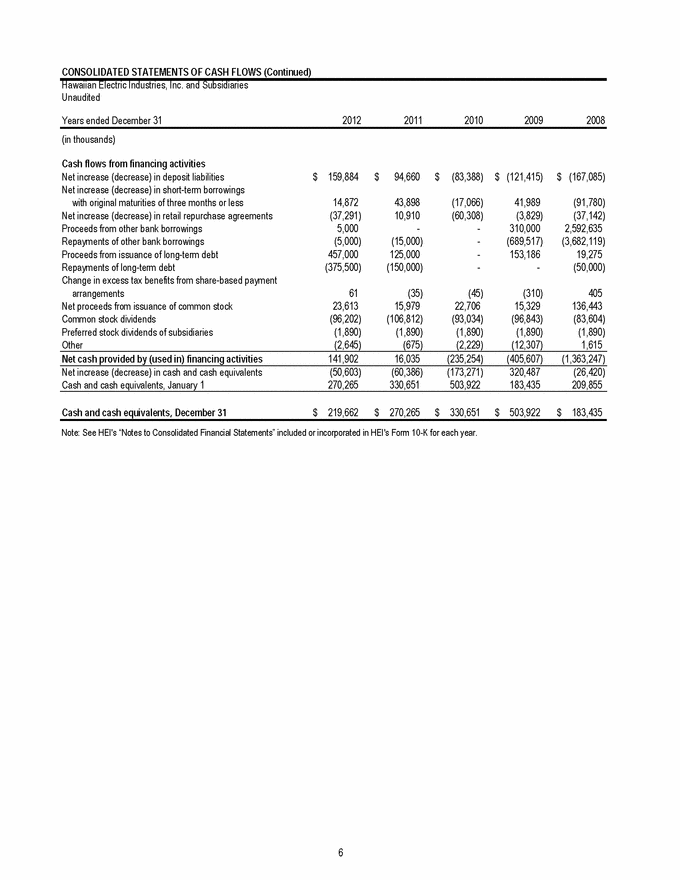
CONSOLIDATED STATEMENTS OF CASH FLOWS (Continued) Hawaiian Electric Industries, Inc. and Subsidiaries Unaudited Years ended December 31 2012 2011 2010 2009 2008 (in thousands) Cash flows from financing activities Net increase (decrease) in deposit liabilities $159,884 $94,660 $(83,388) $(121,415) $(167,085) Net increase (decrease) in short-term borrowings with original maturities of three months or less 14,872 43,898 (17,066) 41,989 (91,780) Net increase (decrease) in retail repurchase agreements (37,291) 10,910 (60,308) (3,829) (37,142) Proceeds from other bank borrowings 5,000 - - 310,000 2,592,635 Repayments of other bank borrowings (5,000) (15,000) - (689,517) (3,682,119) Proceeds from issuance of long-term debt 457,000 125,000 - 153,186 19,275 Repayments of long-term debt (375,500) (150,000) - - (50,000) Change in excess tax benefits from share-based payment arrangements 61 (35) (45) (310) 405 Net proceeds from issuance of common stock 23,613 15,979 22,706 15,329 136,443 Common stock dividends (96,202) (106,812) (93,034) (96,843) (83,604) Preferred stock dividends of subsidiaries (1,890) (1,890) (1,890) (1,890) (1,890) Other (2,645) (675) (2,229) (12,307) 1,615 Net cash provided by (used in) financing activities 141,902 16,035 (235,254) (405,607) (1,363,247) Net increase (decrease) in cash and cash equivalents (50,603) (60,386) (173,271) 320,487 (26,420) Cash and cash equivalents, January 1 270,265 330,651 503,922 183,435 209,855 Cash and cash equivalents, December 31 $219,662 $270,265 $330,651 $503,922 $183,435 Note: See HEI's “Notes to Consolidated Financial Statements” included or incorporated in HEI's Form 10-K for each year. 6 |
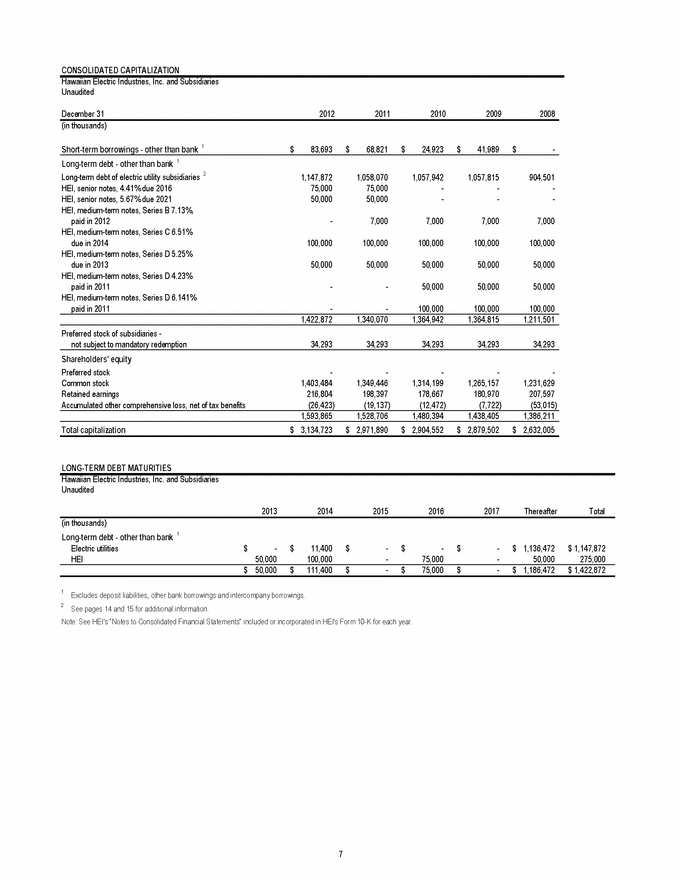
CONSOLIDATED CAPITALIZATION Hawaiian Electric Industries, Inc. and Subsidiaries Unaudited December 31 2012 2011 2010 2009 2008 (in thousands) Short-term borrowings - other than bank 1 $83,693 $68,821 $24,923 $41,989 $- Long-term debt - other than bank 1 Long-term debt of electric utility subsidiaries 2 1,147,872 1,058,070 1,057,942 1,057,815 904,501 HEI, senior notes, 4.41% due 2016 75,000 75,000 - - - HEI, senior notes, 5.67% due 2021 50,000 50,000 - - - HEI, medium-term notes, Series B 7.13%, paid in 2012 - 7,000 7,000 7,000 7,000 HEI, medium-term notes, Series C 6.51% due in 2014 100,000 100,000 100,000 100,000 100,000 HEI, medium-term notes, Series D 5.25% due in 2013 50,000 50,000 50,000 50,000 50,000 HEI, medium-term notes, Series D 4.23% paid in 2011 - - 50,000 50,000 50,000 HEI, medium-term notes, Series D 6.141% paid in 2011 - - 100,000 100,000 100,000 1,422,872 1,340,070 1,364,942 1,364,815 1,211,501 Preferred stock of subsidiaries - not subject to mandatory redemption 34,293 34,293 34,293 34,293 34,293 Shareholders' equity Preferred stock - - - - - Common stock 1,403,484 1,349,446 1,314,199 1,265,157 1,231,629 Retained earnings 216,804 198,397 178,667 180,970 207,597 Accumulated other comprehensive loss, net of tax benefits (26,423) (19,137) (12,472) (7,722) (53,015) 1,593,865 1,528,706 1,480,394 1,438,405 1,386,211 Total capitalization $3,134,723 $2,971,890 $2,904,552 $2,879,502 $2,632,005 LONG-TERM DEBT MATURITIES Hawaiian Electric Industries, Inc. and Subsidiaries Unaudited 2013 2014 2015 2016 2017 Thereafter Total (in thousands) Long-term debt - other than bank 1 Electric utilities $- $11,400 $- $- $- $1,136,472 $1,147,872 HEI 50,000 100,000 - 75,000 - 50,000 275,000 $50,000 $111,400 $- $75,000 $- $1,186,472 $1,422,872 1 Excludes deposit liabilities, other bank borrowings and intercompany borrowings. 2 See pages 14 and 15 for additional information. Note: See HEI's “Notes to Consolidated Financial Statements” included or incorporated in HEI's Form 10-K for each year. 7 |
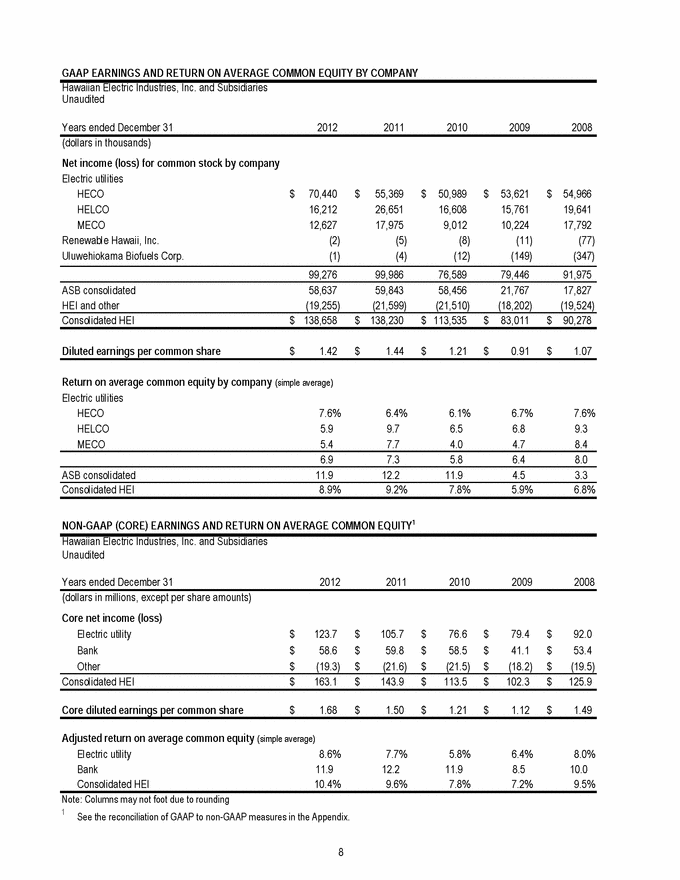
GAAP EARNINGS AND RETURN ON AVERAGE COMMON EQUITY BY COMPANY Hawaiian Electric Industries, Inc. and Subsidiaries Unaudited Years ended December 31 2012 2011 2010 2009 2008 (dollars in thousands) Net income (loss) for common stock by company Electric utilities HECO $70,440 $55,369 $50,989 $53,621 $54,966 HELCO 16,212 26,651 16,608 15,761 19,641 MECO 12,627 17,975 9,012 10,224 17,792 Renewable Hawaii, Inc. (2) (5) (8) (11) (77) Uluwehiokama Biofuels Corp. (1) (4) (12) (149) (347) 99,276 99,986 76,589 79,446 91,975 ASB consolidated 58,637 59,843 58,456 21,767 17,827 HEI and other (19,255) (21,599) (21,510) (18,202) (19,524) Consolidated HEI $138,658 $138,230 $113,535 $83,011 $90,278 Diluted earnings per common share $1.42 $1.44 $1.21 $0.91 $1.07 Return on average common equity by company (simple average) Electric utilities HECO 7.6% 6.4% 6.1% 6.7% 7.6% HELCO 5.9 9.7 6.5 6.8 9.3 MECO 5.4 7.7 4.0 4.7 8.4 6.9 7.3 5.8 6.4 8.0 ASB consolidated 11.9 12.2 11.9 4.5 3.3 Consolidated HEI 8.9% 9.2% 7.8% 5.9% 6.8% NON-GAAP (CORE) EARNINGS AND RETURN ON AVERAGE COMMON EQUITY 1 Hawaiian Electric Industries, Inc. and Subsidiaries Unaudited Years ended December 31 2012 2011 2010 2009 2008 (dollars in millions, except per share amounts) Core net income (loss) Electric utility $123.7 $105.7 $76.6 $79.4 $92.0 Bank $58.6 $59.8 $58.5 $41.1 $53.4 Other $(19.3) $(21.6) $(21.5) $(18.2) $(19.5) Consolidated HEI $163.1 $143.9 $113.5 $102.3 $125.9 Core diluted earnings per common share $1.68 $1.50 $1.21 $1.12 $1.49 Adjusted return on average common equity (simple average) Electric utility 8.6% 7.7% 5.8% 6.4% 8.0% Bank 11.9 12.2 11.9 8.5 10.0 Consolidated HEI 10.4% 9.6% 7.8% 7.2% 9.5% Note: Columns may not foot due to rounding 1 See the reconciliation of GAAP to non-GAAP measures in the Appendix. 8 |
SELECTED DATA Hawaiian Electric Company, Inc. and Subsidiaries Unaudited Years ended December 31 2012 2011 2010 2009 2008 (in thousands) CAPITAL STRUCTURE 1 Short-term borrowings $- $- $- $- $41,550 Long-term debt, net, including current portion 1,147,872 1,058,070 1,057,942 1,057,815 904,501 Preferred stock 34,293 34,293 34,293 34,293 34,293 Common stock equity 2 1,472,136 1,402,841 1,334,155 1,303,165 1,185,599 $2,654,301 $2,495,204 $2,426,390 $2,395,273 $2,165,943 CAPITAL STRUCTURE RATIOS (%) 1 Short-term borrowings - - - - 1.9 Long-term debt, net, including current portion 43.2 42.4 43.6 44.2 41.8 Preferred stock 1.3 1.4 1.4 1.4 1.6 Common stock equity 55.5 56.2 55.0 54.4 54.7 100.0 100.0 100.0 100.0 100.0 KEY FINANCIAL RATIOS (%) Ratio of earnings to fixed charges (SEC method) 3.37 3.52 2.88 2.99 3.48 Authorized return on rate base 3 HECO 8.11 8.16 8.16 8.66 8.66 HELCO 8.31 8.33 8.33 9.14 9.14 MECO 8.15 8.67 8.67 8.83 8.83 Earned rate-making return on simple average rate base 4 HECO 8.15 6.83 5.93 6.12 7.05 HELCO 6.99 8.78 5.86 5.70 7.21 MECO 5.95 7.07 4.86 4.99 7.03 Authorized return on simple average common equity 3 HECO 10.00 10.00 10.00 7 10.70 10.70 HELCO 10.00 10.70 10.70 11.50 11.50 MECO 10.00 10.70 10.70 10.94 10.94 Earned rate-making return on simple average common equity 5 HECO 10.56 8.03 6.15 7.02 8.07 HELCO 7.79 10.85 6.24 6.89 9.39 MECO 6.69 8.10 3.90 4.76 8.54 Book return on simple average common equity 6 HECO 7.57 6.43 6.08 6.74 7.60 HELCO 5.90 9.68 6.51 6.84 9.31 MECO 5.44 7.73 4.00 4.69 8.41 RATE BASE (in millions, simple average) HECO $1,532 8 $1,401 $1,406 $1,276 $1,178 HELCO 454 8 453 458 417 369 MECO 403 8 385 382 386 387 $2,389 $2,239 $2,246 $2,079 $1,934 DEPRECIATION AND AFUDC (%) Composite annual depreciation rate 3.1 3.2 3.5 3.8 3.8 Accumulated depreciation as percent of gross plant 1 36.7 37.5 38.4 37.9 38.0 Weighted-average AFUDC rate 7.6 8.0 8.1 8.1 8.1 1 At December 31 2 Certain reclassifications have been made to prior years' financial statements to conform to the 2012 presentation, which did not affect previously reported results of operations. 3 Reflects latest final decision and order as of the end of the respective years. The return on rate base used by the PUC for purposes of the most recent interim decision and order in MECO's rate case was 7.91%. 4 Based on recorded income and average rate base, both adjusted for items not included in determining electric rates. 5 Beginning in 2011, based on recorded income and average common equity supporting rate base, both adjusted for items not included in determining electric rates. 6 Based on recorded net income divided by average common equity, simple average method. 7 Represents the authorized return from the 2009 test year final D&O effective March 1, 2011. 8 The 12/31/12 rate base amounts for HECO, HELCO and MECO were $1,605, $456 and $414, respectively. 9 |
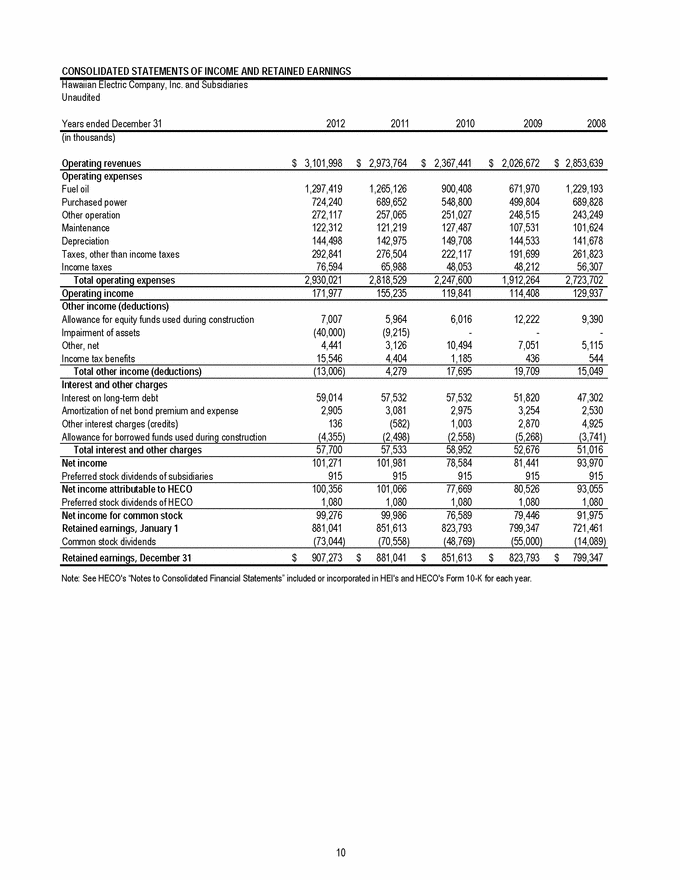
CONSOLIDATED STATEMENTS OF INCOME AND RETAINED EARNINGS Hawaiian Electric Company, Inc. and Subsidiaries Unaudited Years ended December 31 2012 2011 2010 2009 2008 (in thousands) Operating revenues $3,101,998 $2,973,764 $2,367,441 $2,026,672 $2,853,639 Operating expenses Fuel oil 1,297,419 1,265,126 900,408 671,970 1,229,193 Purchased power 724,240 689,652 548,800 499,804 689,828 Other operation 272,117 257,065 251,027 248,515 243,249 Maintenance 122,312 121,219 127,487 107,531 101,624 Depreciation 144,498 142,975 149,708 144,533 141,678 Taxes, other than income taxes 292,841 276,504 222,117 191,699 261,823 Income taxes 76,594 65,988 48,053 48,212 56,307 Total operating expenses 2,930,021 2,818,529 2,247,600 1,912,264 2,723,702 Operating income 171,977 155,235 119,841 114,408 129,937 Other income (deductions) Allowance for equity funds used during construction 7,007 5,964 6,016 12,222 9,390 Impairment of assets (40,000) (9,215) - - - Other, net 4,441 3,126 10,494 7,051 5,115 Income tax benefits 15,546 4,404 1,185 436 544 Total other income (deductions) (13,006) 4,279 17,695 19,709 15,049 Interest and other charges Interest on long-term debt 59,014 57,532 57,532 51,820 47,302 Amortization of net bond premium and expense 2,905 3,081 2,975 3,254 2,530 Other interest charges (credits) 136 (582) 1,003 2,870 4,925 Allowance for borrowed funds used during construction (4,355) (2,498) (2,558) (5,268) (3,741) Total interest and other charges 57,700 57,533 58,952 52,676 51,016 Net income 101,271 101,981 78,584 81,441 93,970 Preferred stock dividends of subsidiaries 915 915 915 915 915 Net income attributable to HECO 100,356 101,066 77,669 80,526 93,055 Preferred stock dividends of HECO 1,080 1,080 1,080 1,080 1,080 Net income for common stock 99,276 99,986 76,589 79,446 91,975 Retained earnings, January 1 881,041 851,613 823,793 799,347 721,461 Common stock dividends (73,044) (70,558) (48,769) (55,000) (14,089) Retained earnings, December 31 $907,273 #VALUE! $881,041 #VALUE! $851,613 $- $823,793 $- $799,347 Note: See HECO's “Notes to Consolidated Financial Statements” included or incorporated in HEI's and HECO's Form 10-K for each year. 10 | |
|
|
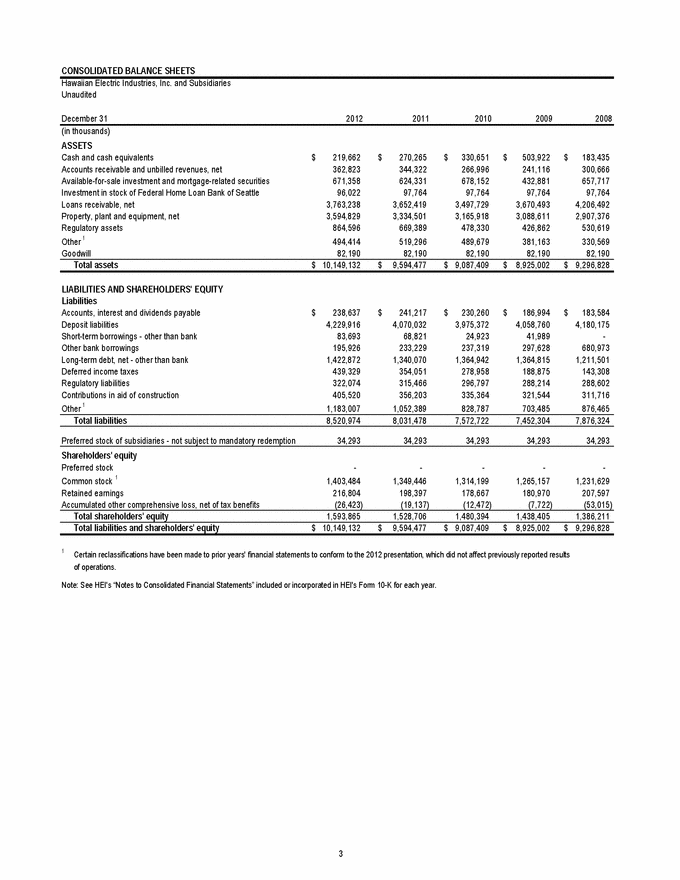
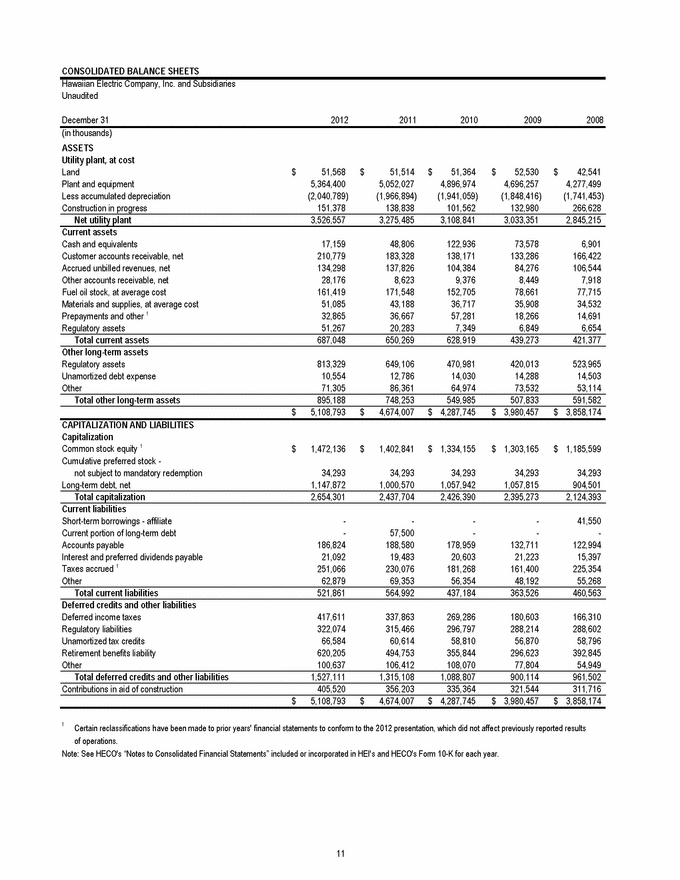
CONSOLIDATED BALANCE SHEETS Hawaiian Electric Company, Inc. and Subsidiaries Unaudited December 31 2012 2011 2010 2009 2008 (in thousands) ASSETS Utility plant, at cost Land $51,568 $51,514 $51,364 $52,530 $42,541 Plant and equipment 5,364,400 5,052,027 4,896,974 4,696,257 4,277,499 Less accumulated depreciation (2,040,789) (1,966,894) (1,941,059) (1,848,416) (1,741,453) Construction in progress 151,378 138,838 101,562 132,980 266,628 Net utility plant 3,526,557 3,275,485 3,108,841 3,033,351 2,845,215 Current assets Cash and equivalents 17,159 48,806 122,936 73,578 6,901 Customer accounts receivable, net 210,779 183,328 138,171 133,286 166,422 Accrued unbilled revenues, net 134,298 137,826 104,384 84,276 106,544 Other accounts receivable, net 28,176 8,623 9,376 8,449 7,918 Fuel oil stock, at average cost 161,419 171,548 152,705 78,661 77,715 Materials and supplies, at average cost 51,085 43,188 36,717 35,908 34,532 Prepayments and other 1 32,865 36,667 57,281 18,266 14,691 Regulatory assets 51,267 20,283 7,349 6,849 6,654 Total current assets 687,048 650,269 628,919 439,273 421,377 Other long-term assets Regulatory assets 813,329 649,106 470,981 420,013 523,965 Unamortized debt expense 10,554 12,786 14,030 14,288 14,503 Other 71,305 86,361 64,974 73,532 53,114 Total other long-term assets 895,188 748,253 549,985 507,833 591,582 $5,108,793 $4,674,007 $4,287,745 $3,980,457 $3,858,174 CAPITALIZATION AND LIABILITIES Capitalization Common stock equity 1 $1,472,136 $1,402,841 $1,334,155 $1,303,165 $1,185,599 Cumulative preferred stock - not subject to mandatory redemption 34,293 34,293 34,293 34,293 34,293 Long-term debt, net 1,147,872 1,000,570 1,057,942 1,057,815 904,501 Total capitalization 2,654,301 2,437,704 2,426,390 2,395,273 2,124,393 Current liabilities Short-term borrowings - affiliate - - - - 41,550 Current portion of long-term debt - 57,500 - - - Accounts payable 186,824 188,580 178,959 132,711 122,994 Interest and preferred dividends payable 21,092 19,483 20,603 21,223 15,397 Taxes accrued 1 251,066 230,076 181,268 161,400 225,354 Other 62,879 69,353 56,354 48,192 55,268 Total current liabilities 521,861 564,992 437,184 363,526 460,563 Deferred credits and other liabilities Deferred income taxes 417,611 337,863 269,286 180,603 166,310 Regulatory liabilities 322,074 315,466 296,797 288,214 288,602 Unamortized tax credits 66,584 60,614 58,810 56,870 58,796 Retirement benefits liability 620,205 494,753 355,844 296,623 392,845 Other 100,637 106,412 108,070 77,804 54,949 Total deferred credits and other liabilities 1,527,111 1,315,108 1,088,807 900,114 961,502 Contributions in aid of construction 405,520 356,203 335,364 321,544 311,716 $5,108,793 $4,674,007 $4,287,745 $3,980,457 $3,858,174 1 Certain reclassifications have been made to prior years' financial statements to conform to the 2012 presentation, which did not affect previously reported results of operations. Note: See HECO's “Notes to Consolidated Financial Statements” included or incorporated in HEI's and HECO's Form 10-K for each year. 11 | |
|
|
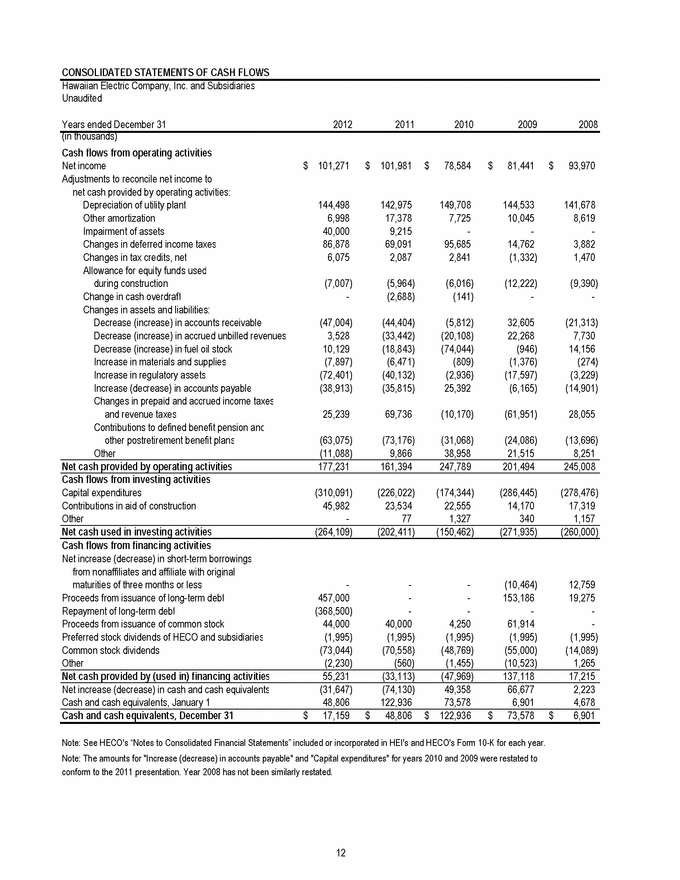
CONSOLIDATED STATEMENTS OF CASH FLOWS Hawaiian Electric Company, Inc. and Subsidiaries Unaudited Years ended December 31 2012 2011 2010 2009 2008 (in thousands) Cash flows from operating activities Net income $101,271 $101,981 $78,584 $81,441 $93,970 Adjustments to reconcile net income to net cash provided by operating activities: Depreciation of utility plant 144,498 142,975 149,708 144,533 141,678 Other amortization 6,998 17,378 7,725 10,045 8,619 Impairment of assets 40,000 9,215 - - - Changes in deferred income taxes 86,878 69,091 95,685 14,762 3,882 Changes in tax credits, net 6,075 2,087 2,841 (1,332) 1,470 Allowance for equity funds used during construction (7,007) (5,964) (6,016) (12,222) (9,390) Change in cash overdraft - (2,688) (141) - - Changes in assets and liabilities: Decrease (increase) in accounts receivable (47,004) (44,404) (5,812) 32,605 (21,313) Decrease (increase) in accrued unbilled revenues 3,528 (33,442) (20,108) 22,268 7,730 Decrease (increase) in fuel oil stock 10,129 (18,843) (74,044) (946) 14,156 Increase in materials and supplies (7,897) (6,471) (809) (1,376) (274) Increase in regulatory assets (72,401) (40,132) (2,936) (17,597) (3,229) Increase (decrease) in accounts payable (38,913) (35,815) 25,392 (6,165) (14,901) Changes in prepaid and accrued income taxes and revenue taxes 25,239 69,736 (10,170) (61,951) 28,055 Contributions to defined benefit pension and other postretirement benefit plans (63,075) (73,176) (31,068) (24,086) (13,696) Other (11,088) 9,866 38,958 21,515 8,251 Net cash provided by operating activities 177,231 161,394 247,789 201,494 245,008 Cash flows from investing activities Capital expenditures (310,091) (226,022) (174,344) (286,445) (278,476) Contributions in aid of construction 45,982 23,534 22,555 14,170 17,319 Other - 77 1,327 340 1,157 Net cash used in investing activities (264,109) (202,411) (150,462) (271,935) (260,000) Cash flows from financing activities Net increase (decrease) in short-term borrowings from nonaffiliates and affiliate with original maturities of three months or less - - - (10,464) 12,759 Proceeds from issuance of long-term debt 457,000 - - 153,186 19,275 Repayment of long-term debt (368,500) - - - - Proceeds from issuance of common stock 44,000 40,000 4,250 61,914 - Preferred stock dividends of HECO and subsidiaries (1,995) (1,995) (1,995) (1,995) (1,995) Common stock dividends (73,044) (70,558) (48,769) (55,000) (14,089) Other (2,230) (560) (1,455) (10,523) 1,265 Net cash provided by (used in) financing activities 55,231 (33,113) (47,969) 137,118 17,215 Net increase (decrease) in cash and cash equivalents (31,647) (74,130) 49,358 66,677 2,223 Cash and cash equivalents, January 1 48,806 122,936 73,578 6,901 4,678 Cash and cash equivalents, December 31 $17,159 $48,806 $122,936 $73,578 $6,901 Note: See HECO's “Notes to Consolidated Financial Statements” included or incorporated in HEI's and HECO's Form 10-K for each year. Note: The amounts for "Increase (decrease) in accounts payable" and "Capital expenditures" for years 2010 and 2009 were restated to conform to the 2011 presentation. Year 2008 has not been similarly restated. 12 |
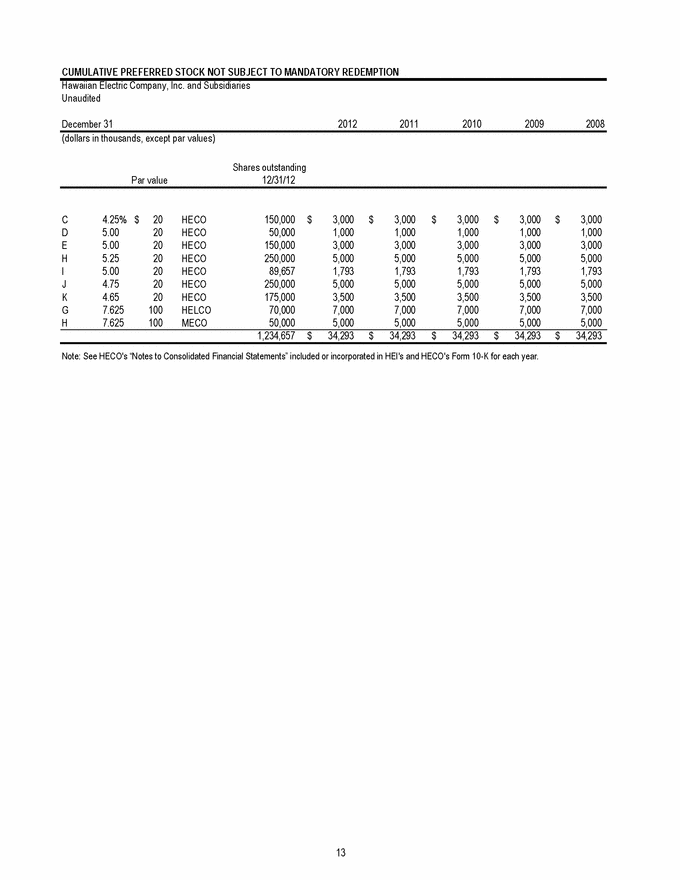
CUMULATIVE PREFERRED STOCK NOT SUBJECT TO MANDATORY REDEMPTION Hawaiian Electric Company, Inc. and Subsidiaries Unaudited December 31 2012 2011 2010 2009 2008 (dollars in thousands, except par values) Shares outstanding Par value 12/31/12 C 4.25% $20 HECO 150,000 $3,000 $3,000 $3,000 $3,000 $3,000 D 5.00 20 HECO 50,000 1,000 1,000 1,000 1,000 1,000 E 5.00 20 HECO 150,000 3,000 3,000 3,000 3,000 3,000 H 5.25 20 HECO 250,000 5,000 5,000 5,000 5,000 5,000 I 5.00 20 HECO 89,657 1,793 1,793 1,793 1,793 1,793 J 4.75 20 HECO 250,000 5,000 5,000 5,000 5,000 5,000 K 4.65 20 HECO 175,000 3,500 3,500 3,500 3,500 3,500 G 7.625 100 HELCO 70,000 7,000 7,000 7,000 7,000 7,000 H 7.625 100 MECO 50,000 5,000 5,000 5,000 5,000 5,000 1,234,657 $34,293 $34,293 $34,293 $34,293 $34,293 Note: See HECO's “Notes to Consolidated Financial Statements” included or incorporated in HEI's and HECO's Form 10-K for each year. 13 |
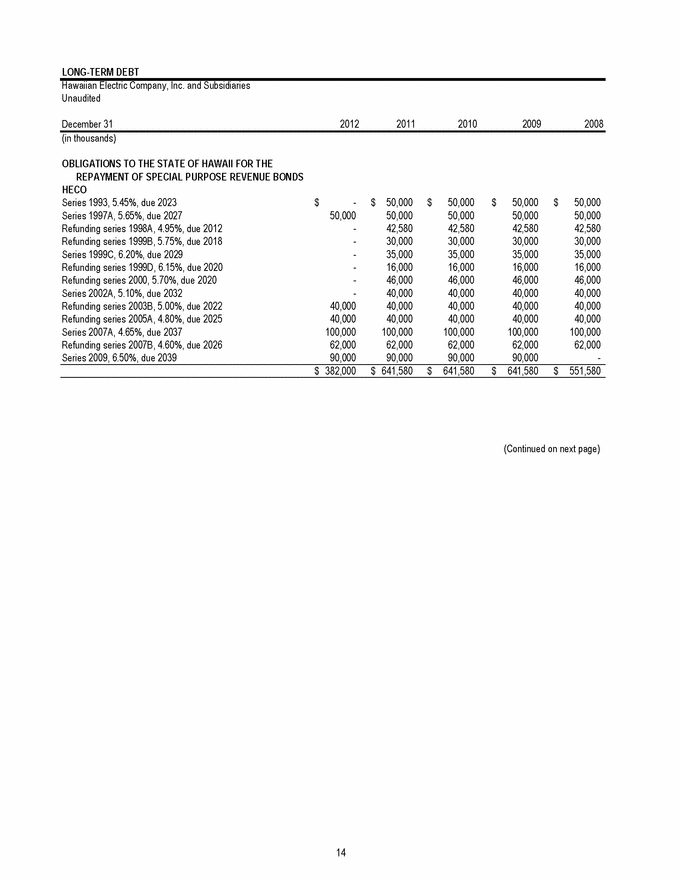
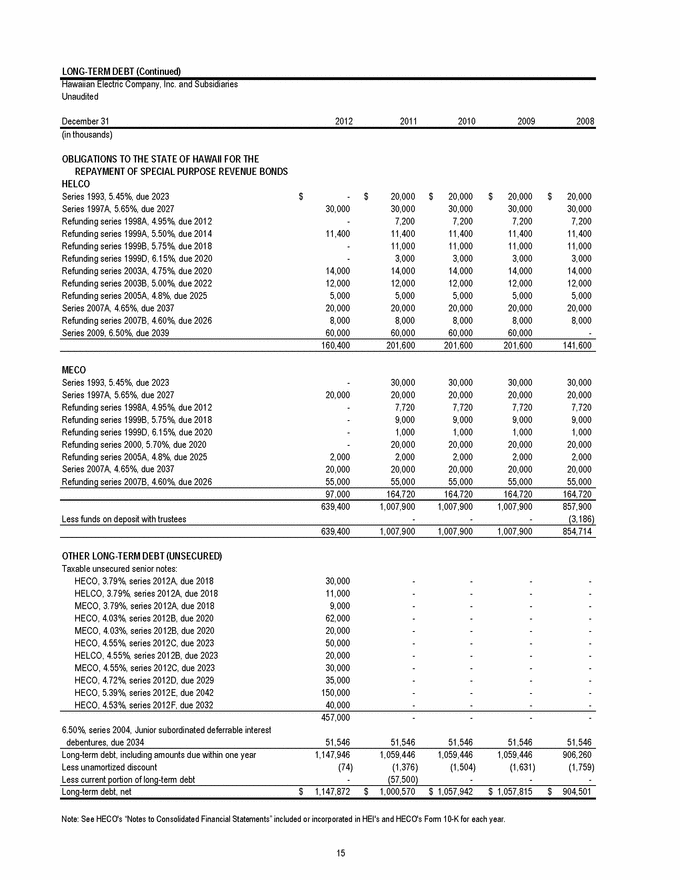
LONG-TERM DEBT Hawaiian Electric Company, Inc. and Subsidiaries Unaudited December 31 2012 2011 2010 2009 2008 (in thousands) OBLIGATIONS TO THE STATE OF HAWAII FOR THE REPAYMENT OF SPECIAL PURPOSE REVENUE BONDS HECO Series 1993, 5.45%, due 2023 $- $50,000 $50,000 $50,000 $50,000 Series 1997A, 5.65%, due 2027 50,000 50,000 50,000 50,000 50,000 Refunding series 1998A, 4.95%, due 2012 - 42,580 42,580 42,580 42,580 Refunding series 1999B, 5.75%, due 2018 - 30,000 30,000 30,000 30,000 Series 1999C, 6.20%, due 2029 - 35,000 35,000 35,000 35,000 Refunding series 1999D, 6.15%, due 2020 - 16,000 16,000 16,000 16,000 Refunding series 2000, 5.70%, due 2020 - 46,000 46,000 46,000 46,000 Series 2002A, 5.10%, due 2032 - 40,000 40,000 40,000 40,000 Refunding series 2003B, 5.00%, due 2022 40,000 40,000 40,000 40,000 40,000 Refunding series 2005A, 4.80%, due 2025 40,000 40,000 40,000 40,000 40,000 Series 2007A, 4.65%, due 2037 100,000 100,000 100,000 100,000 100,000 Refunding series 2007B, 4.60%, due 2026 62,000 62,000 62,000 62,000 62,000 Series 2009, 6.50%, due 2039 90,000 90,000 90,000 90,000 - $382,000 $641,580 $641,580 $641,580 $551,580 (Continued on next page) 14 |
LONG-TERM DEBT (Continued) Hawaiian Electric Company, Inc. and Subsidiaries Unaudited December 31 2012 2011 2010 2009 2008 (in thousands) OBLIGATIONS TO THE STATE OF HAWAII FOR THE REPAYMENT OF SPECIAL PURPOSE REVENUE BONDS HELCO Series 1993, 5.45%, due 2023 $- $20,000 $20,000 $20,000 $20,000 Series 1997A, 5.65%, due 2027 30,000 30,000 30,000 30,000 30,000 Refunding series 1998A, 4.95%, due 2012 - 7,200 7,200 7,200 7,200 Refunding series 1999A, 5.50%, due 2014 11,400 11,400 11,400 11,400 11,400 Refunding series 1999B, 5.75%, due 2018 - 11,000 11,000 11,000 11,000 Refunding series 1999D, 6.15%, due 2020 - 3,000 3,000 3,000 3,000 Refunding series 2003A, 4.75%, due 2020 14,000 14,000 14,000 14,000 14,000 Refunding series 2003B, 5.00%, due 2022 12,000 12,000 12,000 12,000 12,000 Refunding series 2005A, 4.8%, due 2025 5,000 5,000 5,000 5,000 5,000 Series 2007A, 4.65%, due 2037 20,000 20,000 20,000 20,000 20,000 Refunding series 2007B, 4.60%, due 2026 8,000 8,000 8,000 8,000 8,000 Series 2009, 6.50%, due 2039 60,000 60,000 60,000 60,000 - 160,400 201,600 201,600 201,600 141,600 MECO Series 1993, 5.45%, due 2023 - 30,000 30,000 30,000 30,000 Series 1997A, 5.65%, due 2027 20,000 20,000 20,000 20,000 20,000 Refunding series 1998A, 4.95%, due 2012 - 7,720 7,720 7,720 7,720 Refunding series 1999B, 5.75%, due 2018 - 9,000 9,000 9,000 9,000 Refunding series 1999D, 6.15%, due 2020 - 1,000 1,000 1,000 1,000 Refunding series 2000, 5.70%, due 2020 - 20,000 20,000 20,000 20,000 Refunding series 2005A, 4.8%, due 2025 2,000 2,000 2,000 2,000 2,000 Series 2007A, 4.65%, due 2037 20,000 20,000 20,000 20,000 20,000 Refunding series 2007B, 4.60%, due 2026 55,000 55,000 55,000 55,000 55,000 97,000 164,720 164,720 164,720 164,720 639,400 1,007,900 1,007,900 1,007,900 857,900 Less funds on deposit with trustees - - - (3,186) 639,400 1,007,900 1,007,900 1,007,900 854,714 OTHER LONG-TERM DEBT (UNSECURED) Taxable unsecured senior notes: HECO, 3.79%, series 2012A, due 2018 30,000 - - - - HELCO, 3.79%, series 2012A, due 2018 11,000 - - - - MECO, 3.79%, series 2012A, due 2018 9,000 - - - - HECO, 4.03%, series 2012B, due 2020 62,000 - - - - MECO, 4.03%, series 2012B, due 2020 20,000 - - - - HECO, 4.55%, series 2012C, due 2023 50,000 - - - - HELCO, 4.55%, series 2012B, due 2023 20,000 - - - - MECO, 4.55%, series 2012C, due 2023 30,000 - - - - HECO, 4.72%, series 2012D, due 2029 35,000 - - - - HECO, 5.39%, series 2012E, due 2042 150,000 - - - - HECO, 4.53%, series 2012F, due 2032 40,000 - - - - 457,000 - - - - - - - - 6.50%, series 2004, Junior subordinated deferrable interest debentures, due 2034 51,546 51,546 51,546 51,546 51,546 Long-term debt, including amounts due within one year 1,147,946 - 1,059,446 - 1,059,446 - 1,059,446 - 906,260 Less unamortized discount (74) (1,376) (1,504) (1,631) (1,759) Less current portion of long-term debt - (57,500) - - - Long-term debt, net $1,147,872 $1,000,570 $1,057,942 $1,057,815 $904,501 Note: See HECO's “Notes to Consolidated Financial Statements” included or incorporated in HEI's and HECO's Form 10-K for each year. 15 |
CUSTOMER, SALES AND REVENUE DATA Hawaiian Electric Company, Inc. and Subsidiaries Unaudited Years ended December 31 2012 2011 2010 2009 2008 SERVICE AREA Service area (square miles) 5,815 5,766 5,766 5,766 5,766 Service area population (estimated, in thousands) n/a 1,307 1,293 1,231 1,224 CUSTOMER ACCOUNTS 1 Residential 392,025 390,133 388,307 385,886 383,042 Commercial 54,005 53,904 54,374 54,527 55,243 Large light and power 577 567 548 558 543 Other 1,636 1,625 1,627 1,613 1,583 448,243 446,229 444,856 442,584 440,411 CUSTOMER ACCOUNTS BY COMPANY 1 HECO 297,529 296,800 296,422 295,282 293,740 HELCO 81,792 81,199 80,695 79,813 79,606 MECO 68,922 68,230 67,739 67,489 67,065 Consolidated 448,243 446,229 444,856 442,584 440,411 KILOWATTHOUR SALES (millions) Residential 2,582 2,770 2,830 2,893 2,925 Commercial 3,074 3,204 3,185 3,222 3,326 Large light and power 3,500 3,503 3,513 3,525 3,633 Other 50 50 51 50 52 9,206 9,527 9,579 9,690 9,936 KILOWATTHOUR SALES MIX (%) Residential 28.1 29.1 29.5 29.9 29.4 Commercial 33.4 33.6 33.3 33.2 33.5 Large light and power 38.0 36.8 36.7 36.4 36.6 Other 0.5 0.5 0.5 0.5 0.5 100.0 100.0 100.0 100.0 100.0 KILOWATTHOUR SALES BY COMPANY (millions) HECO 6,976 7,242 7,277 7,378 7,556 HELCO 1,085 1,104 1,110 1,120 1,141 MECO 1,145 1,181 1,192 1,192 1,239 Consolidated 9,206 9,527 9,579 9,690 9,936 KILOWATTHOUR SALES GROWTH BY COMPANY (%) HECO (3.7) (0.5) (1.4) (2.4) (1.6) HELCO (1.7) (0.5) (0.9) (1.8) (1.9) MECO (3.1) (0.9) (0.1) (3.8) (3.2) Consolidated (3.4) (0.5) (1.1) (2.5) (1.8) 1 At December 31 16 |
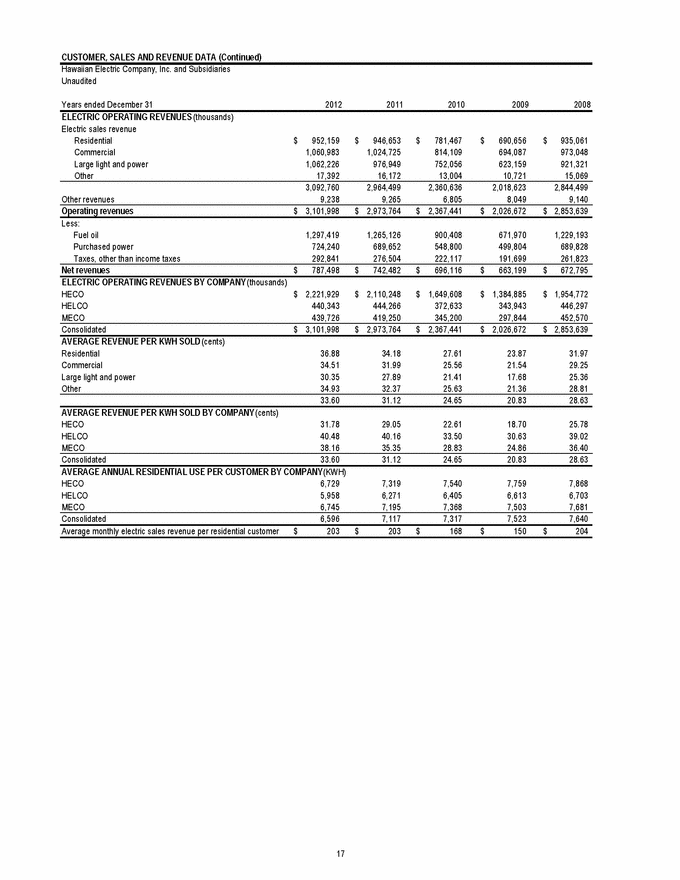
CUSTOMER, SALES AND REVENUE DATA (Continued) Hawaiian Electric Company, Inc. and Subsidiaries Unaudited Years ended December 31 2012 2011 2010 2009 2008 ELECTRIC OPERATING REVENUES (thousands) Electric sales revenue Residential $952,159 $946,653 $781,467 $690,656 $935,061 Commercial 1,060,983 1,024,725 814,109 694,087 973,048 Large light and power 1,062,226 976,949 752,056 623,159 921,321 Other 17,392 16,172 13,004 10,721 15,069 3,092,760 2,964,499 2,360,636 2,018,623 2,844,499 Other revenues 9,238 9,265 6,805 8,049 9,140 Operating revenues $3,101,998 $2,973,764 $2,367,441 $2,026,672 $2,853,639 Less: Fuel oil 1,297,419 1,265,126 900,408 671,970 1,229,193 Purchased power 724,240 689,652 548,800 499,804 689,828 Taxes, other than income taxes 292,841 276,504 222,117 191,699 261,823 Net revenues $787,498 $742,482 $696,116 $663,199 $672,795 ELECTRIC OPERATING REVENUES BY COMPANY (thousands) HECO $2,221,929 $2,110,248 $1,649,608 $1,384,885 $1,954,772 HELCO 440,343 444,266 372,633 343,943 446,297 MECO 439,726 419,250 345,200 297,844 452,570 Consolidated $3,101,998 $2,973,764 $2,367,441 $2,026,672 $2,853,639 AVERAGE REVENUE PER KWH SOLD (cents) Residential 36.88 34.18 27.61 23.87 31.97 Commercial 34.51 31.99 25.56 21.54 29.25 Large light and power 30.35 27.89 21.41 17.68 25.36 Other 34.93 32.37 25.63 21.36 28.81 33.60 31.12 24.65 20.83 28.63 AVERAGE REVENUE PER KWH SOLD BY COMPANY (cents) HECO 31.78 29.05 22.61 18.70 25.78 HELCO 40.48 40.16 33.50 30.63 39.02 MECO 38.16 35.35 28.83 24.86 36.40 Consolidated 33.60 31.12 24.65 20.83 28.63 AVERAGE ANNUAL RESIDENTIAL USE PER CUSTOMER BY COMPANY (KWH) HECO 6,729 7,319 7,540 7,759 7,868 HELCO 5,958 6,271 6,405 6,613 6,703 MECO 6,745 7,195 7,368 7,503 7,681 Consolidated 6,596 7,117 7,317 7,523 7,640 Average monthly electric sales revenue per residential customer $203 $203 $168 $150 $204 17 |
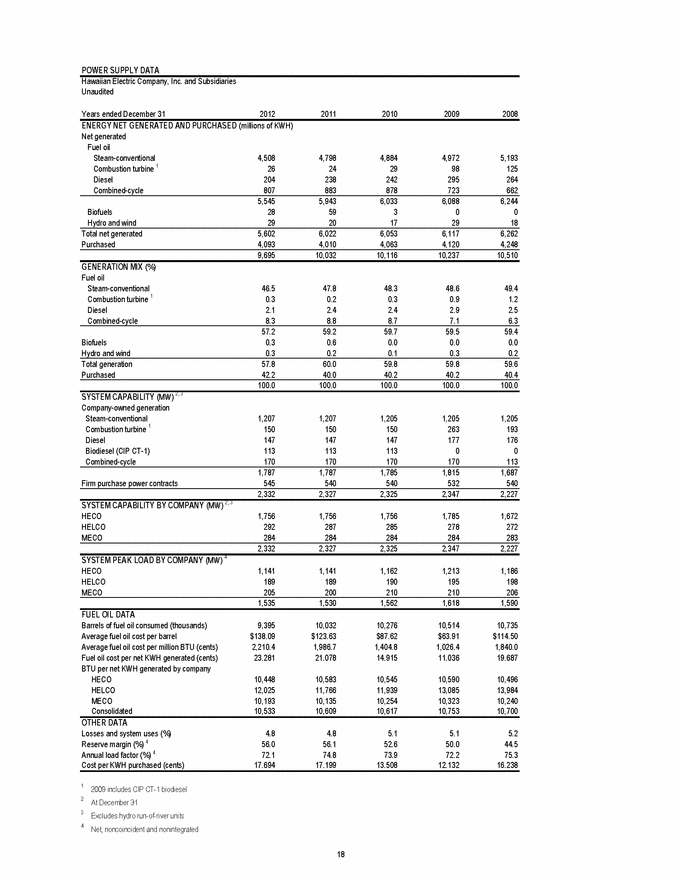
POWER SUPPLY DATA Hawaiian Electric Company, Inc. and Subsidiaries Unaudited Years ended December 31 2012 2011 2010 2009 2008 ENERGY NET GENERATED AND PURCHASED (millions of KWH) Net generated Fuel oil Steam-conventional 4,508 4,798 4,884 4,972 5,193 Combustion turbine 1 26 24 29 98 125 Diesel 204 238 242 295 264 Combined-cycle 807 883 878 723 662 5,545 5,943 6,033 6,088 6,244 Biofuels 28 59 3 0 0 Hydro and wind 29 20 17 29 18 Total net generated 5,602 6,022 6,053 6,117 6,262 Purchased 4,093 4,010 4,063 4,120 4,248 9,695 10,032 10,116 10,237 10,510 GENERATION MIX (%) Fuel oil Steam-conventional 46.5 47.8 48.3 48.6 49.4 Combustion turbine 1 0.3 0.2 0.3 0.9 1.2 Diesel 2.1 2.4 2.4 2.9 2.5 Combined-cycle 8.3 8.8 8.7 7.1 6.3 57.2 59.2 59.7 59.5 59.4 Biofuels 0.3 0.6 0.0 0.0 0.0 Hydro and wind 0.3 0.2 0.1 0.3 0.2 Total generation 57.8 60.0 59.8 59.8 59.6 Purchased 42.2 40.0 40.2 40.2 40.4 100.0 100.0 100.0 100.0 100.0 SYSTEM CAPABILITY (MW) 2, 3 Company-owned generation Steam-conventional 1,207 1,207 1,205 1,205 1,205 Combustion turbine 1 150 150 150 263 193 Diesel 147 147 147 177 176 Biodiesel (CIP CT-1) 113 113 113 0 0 Combined-cycle 170 170 170 170 113 1,787 1,787 1,785 1,815 1,687 Firm purchase power contracts 545 540 540 532 540 2,332 2,327 2,325 2,347 2,227 SYSTEM CAPABILITY BY COMPANY (MW) 2, 3 HECO 1,756 1,756 1,756 1,785 1,672 HELCO 292 287 285 278 272 MECO 284 284 284 284 283 2,332 2,327 2,325 2,347 2,227 SYSTEM PEAK LOAD BY COMPANY (MW) 4 HECO 1,141 1,141 1,162 1,213 1,186 HELCO 189 189 190 195 198 MECO 205 200 210 210 206 1,535 1,530 1,562 1,618 1,590 FUEL OIL DATA Barrels of fuel oil consumed (thousands) 9,395 10,032 10,276 10,514 10,735 Average fuel oil cost per barrel $138.09 $123.63 $87.62 $63.91 $114.50 Average fuel oil cost per million BTU (cents) 2,210.4 1,986.7 1,404.8 1,026.4 1,840.0 Fuel oil cost per net KWH generated (cents) 23.281 21.078 14.915 11.036 19.687 BTU per net KWH generated by company HECO 10,448 10,583 10,545 10,590 10,496 HELCO 12,025 11,766 11,939 13,085 13,984 MECO 10,193 10,135 10,254 10,323 10,240 Consolidated 10,533 10,609 10,617 10,753 10,700 OTHER DATA Losses and system uses (%) 4.8 4.8 5.1 5.1 5.2 Reserve margin (%) 4 56.0 56.1 52.6 50.0 44.5 Annual load factor (%) 4 72.1 74.8 73.9 72.2 75.3 Cost per KWH purchased (cents) 17.694 17.199 13.508 12.132 16.238 1 2009 includes CIP CT-1 biodiesel 2 At December 31 3 Excludes hydro run-of-river units 4 Net; noncoincident and nonintegrated 18 |
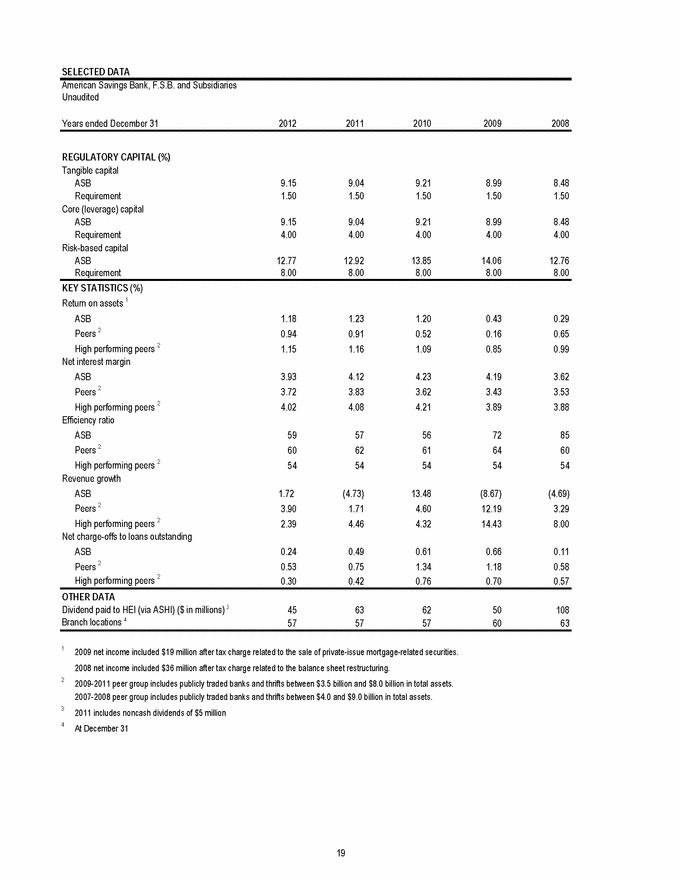
SELECTED DATA American Savings Bank, F.S.B. and Subsidiaries Unaudited Years ended December 31 2012 2011 2010 2009 2008 REGULATORY CAPITAL (%) Tangible capital ASB 9.15 9.04 9.21 8.99 8.48 Requirement 1.50 1.50 1.50 1.50 1.50 Core (leverage) capital ASB 9.15 9.04 9.21 8.99 8.48 Requirement 4.00 4.00 4.00 4.00 4.00 Risk-based capital ASB 12.77 12.92 13.85 14.06 12.76 Requirement 8.00 8.00 8.00 8.00 8.00 KEY STATISTICS (%) Return on assets 1 ASB 1.18 1.23 1.20 0.43 0.29 Peers 2 0.94 0.91 0.52 0.16 0.65 High performing peers 2 1.15 1.16 1.09 0.85 0.99 Net interest margin ASB 3.93 4.12 4.23 4.19 3.62 Peers 2 3.72 3.83 3.62 3.43 3.53 High performing peers 2 4.02 4.08 4.21 3.89 3.88 Efficiency ratio ASB 59 57 56 72 85 Peers 2 60 62 61 64 60 High performing peers 2 54 54 54 54 54 Revenue growth ASB 1.72 (4.73) 13.48 (8.67) (4.69) Peers 2 3.90 1.71 4.60 12.19 3.29 High performing peers 2 2.39 4.46 4.32 14.43 8.00 Net charge-offs to loans outstanding ASB 0.24 0.49 0.61 0.66 0.11 Peers 2 0.53 0.75 1.34 1.18 0.58 High performing peers 2 0.30 0.42 0.76 0.70 0.57 OTHER DATA Dividend paid to HEI (via ASHI) ($ in millions) 3 45 63 62 50 108 Branch locations 4 57 57 57 60 63 1 2009 net income included $19 million after tax charge related to the sale of private-issue mortgage-related securities. 2008 net income included $36 million after tax charge related to the balance sheet restructuring. 2 2009-2011 peer group includes publicly traded banks and thrifts between $3.5 billion and $8.0 billion in total assets. 2007-2008 peer group includes publicly traded banks and thrifts between $4.0 and $9.0 billion in total assets. 3 2011 includes noncash dividends of $5 million 4 At December 31 19 |
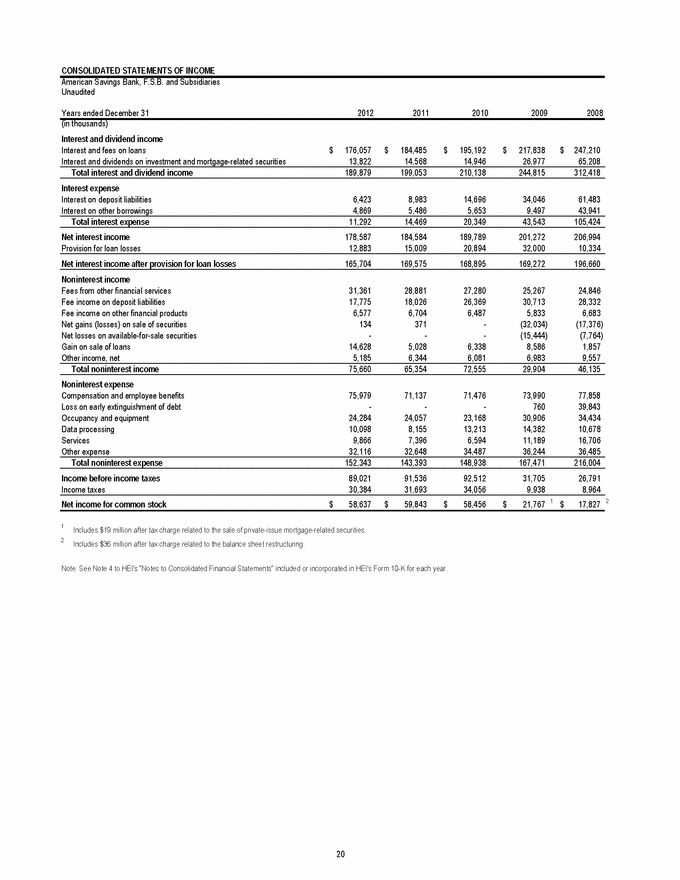
CONSOLIDATED STATEMENTS OF INCOME American Savings Bank, F.S.B. and Subsidiaries Unaudited Years ended December 31 2012 2011 2010 2009 2008 (in thousands) Interest and dividend income Interest and fees on loans $176,057 $184,485 $195,192 $217,838 $247,210 Interest and dividends on investment and mortgage-related securities 13,822 14,568 14,946 26,977 65,208 Total interest and dividend income 189,879 199,053 210,138 244,815 312,418 Interest expense Interest on deposit liabilities 6,423 8,983 14,696 34,046 61,483 Interest on other borrowings 4,869 5,486 5,653 9,497 43,941 Total interest expense 11,292 14,469 20,349 43,543 105,424 Net interest income 178,587 184,584 189,789 201,272 206,994 Provision for loan losses 12,883 15,009 20,894 32,000 10,334 Net interest income after provision for loan losses 165,704 169,575 168,895 169,272 196,660 Noninterest income Fees from other financial services 31,361 28,881 27,280 25,267 24,846 Fee income on deposit liabilities 17,775 18,026 26,369 30,713 28,332 Fee income on other financial products 6,577 6,704 6,487 5,833 6,683 Net gains (losses) on sale of securities 134 371 - (32,034) (17,376) Net losses on available-for-sale securities - - - (15,444) (7,764) Gain on sale of loans 14,628 5,028 6,338 8,586 1,857 Other income, net 5,185 6,344 6,081 6,983 9,557 Total noninterest income 75,660 65,354 72,555 29,904 46,135 Noninterest expense Compensation and employee benefits 75,979 71,137 71,476 73,990 77,858 Loss on early extinguishment of debt - - - 760 39,843 Occupancy and equipment 24,284 24,057 23,168 30,906 34,434 Data processing 10,098 8,155 13,213 14,382 10,678 Services 9,866 7,396 6,594 11,189 16,706 Other expense 32,116 32,648 34,487 36,244 36,485 Total noninterest expense 152,343 143,393 148,938 167,471 216,004 Income before income taxes 89,021 91,536 92,512 31,705 26,791 Income taxes 30,384 31,693 34,056 9,938 8,964 Net income for common stock $58,637 $59,843 $58,456 $21,767 1 $17,827 2 1 Includes $19 million after tax charge related to the sale of private-issue mortgage-related securities. 2 Includes $36 million after tax charge related to the balance sheet restructuring. Note: See Note 4 to HEI's “Notes to Consolidated Financial Statements” included or incorporated in HEI's Form 10-K for each year. 20 |
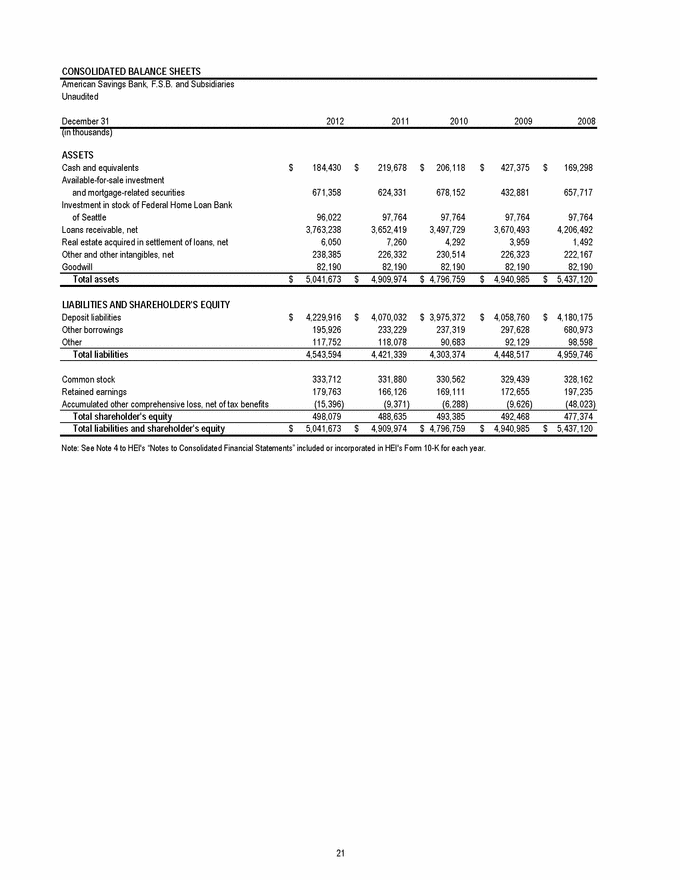
CONSOLIDATED BALANCE SHEETS American Savings Bank, F.S.B. and Subsidiaries Unaudited December 31 2012 2011 2010 2009 2008 (in thousands) ASSETS Cash and equivalents $184,430 $219,678 $206,118 $427,375 $169,298 Available-for-sale investment and mortgage-related securities 671,358 624,331 678,152 432,881 657,717 Investment in stock of Federal Home Loan Bank of Seattle 96,022 97,764 97,764 97,764 97,764 Loans receivable, net 3,763,238 3,652,419 3,497,729 3,670,493 4,206,492 Real estate acquired in settlement of loans, net 6,050 7,260 4,292 3,959 1,492 Other and other intangibles, net 238,385 226,332 230,514 226,323 222,167 Goodwill 82,190 82,190 82,190 82,190 82,190 Total assets $5,041,673 $4,909,974 $4,796,759 $4,940,985 $5,437,120 LIABILITIES AND SHAREHOLDER'S EQUITY Deposit liabilities $4,229,916 $4,070,032 $3,975,372 $4,058,760 $4,180,175 Other borrowings 195,926 233,229 237,319 297,628 680,973 Other 117,752 118,078 90,683 92,129 98,598 Total liabilities 4,543,594 4,421,339 4,303,374 4,448,517 4,959,746 Common stock 333,712 331,880 330,562 329,439 328,162 Retained earnings 179,763 166,126 169,111 172,655 197,235 Accumulated other comprehensive loss, net of tax benefits (15,396) (9,371) (6,288) (9,626) (48,023) Total shareholder's equity 498,079 488,635 493,385 492,468 477,374 Total liabilities and shareholder's equity $5,041,673 $4,909,974 $4,796,759 $4,940,985 $5,437,120 Note: See Note 4 to HEI's “Notes to Consolidated Financial Statements” included or incorporated in HEI's Form 10-K for each year. 21 |
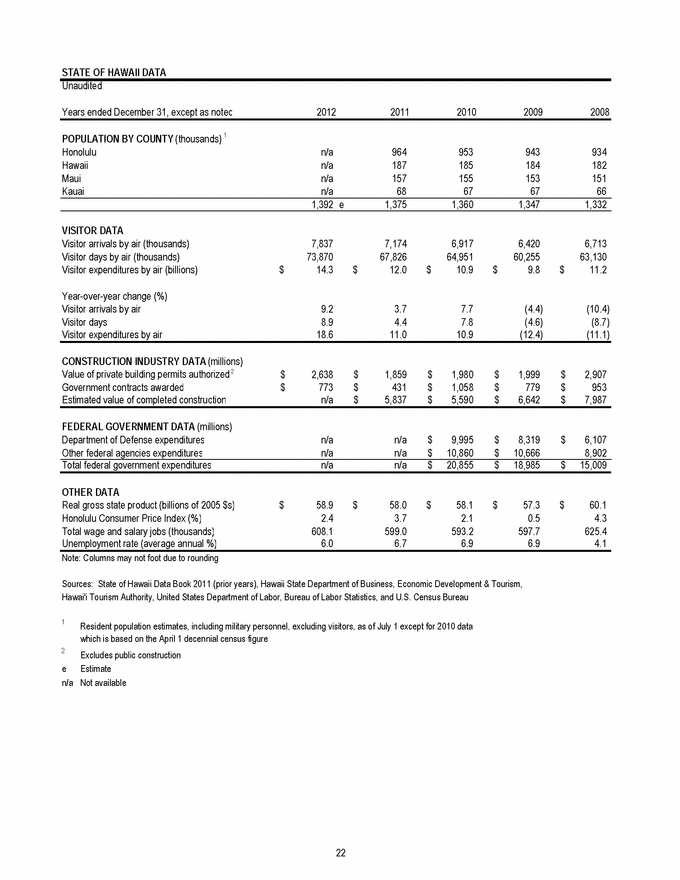
STATE OF HAWAII DATA Unaudited Years ended December 31, except as noted 2012 2011 2010 2009 2008 POPULATION BY COUNTY (thousands) 1 Honolulu n/a 964 953 943 934 Hawaii n/a 187 185 184 182 Maui n/a 157 155 153 151 Kauai n/a 68 67 67 66 1,392 e 1,375 1,360 1,347 1,332 VISITOR DATA Visitor arrivals by air (thousands) 7,837 7,174 6,917 6,420 6,713 Visitor days by air (thousands) 73,870 67,826 64,951 60,255 63,130 Visitor expenditures by air (billions) $14.3 $12.0 $10.9 $9.8 $11.2 Year-over-year change (%) Visitor arrivals by air 9.2 3.7 7.7 (4.4) (10.4) Visitor days 8.9 4.4 7.8 (4.6) (8.7) Visitor expenditures by air 18.6 11.0 10.9 (12.4) (11.1) CONSTRUCTION INDUSTRY DATA (millions) Value of private building permits authorized 2 $2,638 $1,859 $1,980 $1,999 $2,907 Government contracts awarded $773 $431 $1,058 $779 $953 Estimated value of completed construction n/a $5,837 $5,590 $6,642 $7,987 FEDERAL GOVERNMENT DATA (millions) Department of Defense expenditures n/a n/a $9,995 $8,319 $6,107 Other federal agencies expenditures n/a n/a $10,860 $10,666 8,902 Total federal government expenditures n/a n/a $20,855 $18,985 $15,009 OTHER DATA Real gross state product (billions of 2005 $s) $58.9 $58.0 $58.1 $57.3 $60.1 Honolulu Consumer Price Index (%) 2.4 3.7 2.1 0.5 4.3 Total wage and salary jobs (thousands) 608.1 599.0 593.2 597.7 625.4 Unemployment rate (average annual %) 6.0 6.7 6.9 6.9 4.1 Note: Columns may not foot due to rounding Sources: State of Hawaii Data Book 2011 (prior years), Hawaii State Department of Business, Economic Development & Tourism, Hawai'i Tourism Authority, United States Department of Labor, Bureau of Labor Statistics, and U.S. Census Bureau 1 Resident population estimates, including military personnel, excluding visitors, as of July 1 except for 2010 data which is based on the April 1 decennial census figure 2 Excludes public construction e Estimate n/a Not available 22 | |
|
|
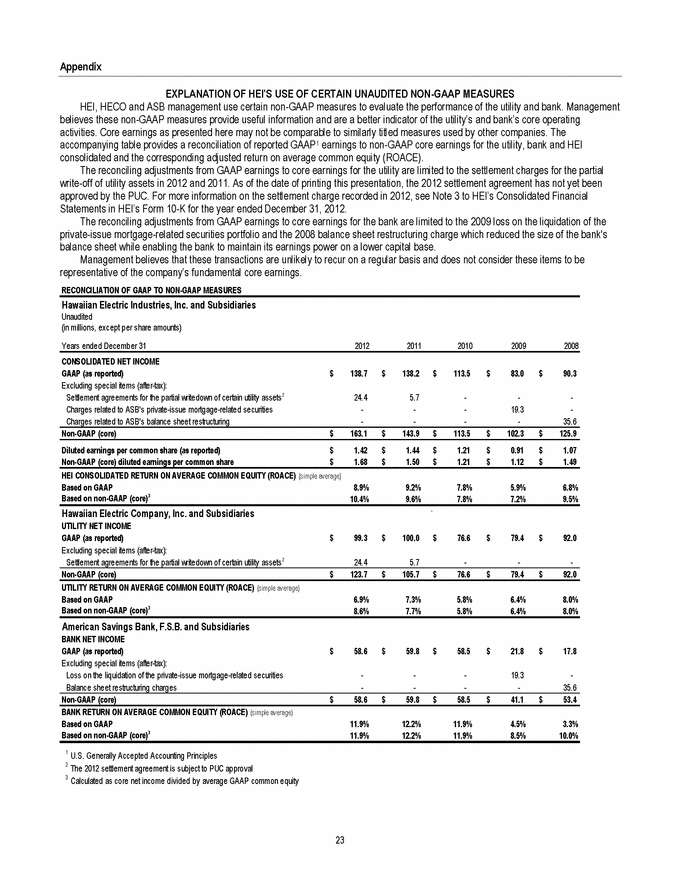
Appendix EXPLANATION OF HEI’S USE OF CERTAIN UNAUDITED NON-GAAP MEASURES HEI, HECO and ASB management use certain non-GAAP measures to evaluate the performance of the utility and bank. Management believes these non-GAAP measures provide useful information and are a better indicator of the utility’s and bank’s core operating activities. Core earnings as presented here may not be comparable to similarly titled measures used by other companies. The accompanying table provides a reconciliation of reported GAAP1 earnings to non-GAAP core earnings for the utility, bank and HEI consolidated and the corresponding adjusted return on average common equity (ROACE). The reconciling adjustments from GAAP earnings to core earnings for the utility are limited to the settlement charges for the partial write-off of utility assets in 2012 and 2011. As of the date of printing this presentation, the 2012 settlement agreement has not yet been approved by the PUC. For more information on the settlement charge recorded in 2012, see Note 3 to HEI’s Consolidated Financial Statements in HEI’s Form 10-K for the year ended December 31, 2012. The reconciling adjustments from GAAP earnings to core earnings for the bank are limited to the 2009 loss on the liquidation of the private-issue mortgage-related securities portfolio and the 2008 balance sheet restructuring charge which reduced the size of the bank's balance sheet while enabling the bank to maintain its earnings power on a lower capital base. Management believes that these transactions are unlikely to recur on a regular basis and does not consider these items to be representative of the company’s fundamental core earnings. RECONCILIATION OF GAAP TO NON-GAAP MEASURES Hawaiian Electric Industries, Inc. and Subsidiaries Unaudited (in millions, except per share amounts) Years ended December 31 2012 2011 2010 2009 2008 CONSOLIDATED NET INCOME GAAP (as reported) $ 138.7 $ 138.2 $ 113.5 $ 83.0 $ 90.3 Excluding special items (after-tax): Settlement agreements for the partial writedown of certain utility assets2 24.4 5.7 - - - Charges related to ASB's private-issue mortgage-related securities - - - 19.3 - Charges related to ASB's balance sheet restructuring - - - - 35.6 Non-GAAP (core) $ 163.1 $ 143.9 $ 113.5 $ 102.3 $ 125.9 Diluted earnings per common share (as reported) $ 1.42 $ 1.44 $ 1.21 $ 0.91 $ 1.07 Non-GAAP (core) diluted earnings per common share $ 1.68 $ 1.50 $ 1.21 $ 1.12 $ 1.49 HEI CONSOLIDATED RETURN ON AVERAGE COMMON EQUITY (ROACE) (simple average) Based on GAAP 8.9% 9.2% 7.8% 5.9% 6.8% Based on non-GAAP (core)3 10.4% 9.6% 7.8% 7.2% 9.5% Hawaiian Electric Company, Inc. and Subsidiaries ` UTILITY NET INCOME GAAP (as reported) $ 99.3 $ 100.0 $ 76.6 $ 79.4 $ 92.0 Excluding special items (after-tax): Settlement agreements for the partial writedown of certain utility assets2 24.4 5.7 - - - Non-GAAP (core) $ 123.7 $ 105.7 $ 76.6 $ 79.4 $ 92.0 UTILITY RETURN ON AVERAGE COMMON EQUITY (ROACE) (simple average) Based on GAAP 6.9% 7.3% 5.8% 6.4% 8.0% Based on non-GAAP (core)3 8.6% 7.7% 5.8% 6.4% 8.0% American Savings Bank, F.S.B. and Subsidiaries BANK NET INCOME GAAP (as reported) $ 58.6 $ 59.8 $ 58.5 $ 21.8 $ 17.8 Excluding special items (after-tax): Loss on the liquidation of the private-issue mortgage-related securities - - - 19.3 - Balance sheet restructuring charges - - - - 35.6 Non-GAAP (core) $ 58.6 $ 59.8 $ 58.5 $ 41.1 $ 53.4 BANK RETURN ON AVERAGE COMMON EQUITY (ROACE) (simple average) Based on GAAP 11.9% 12.2% 11.9% 4.5% 3.3% Based on non-GAAP (core)3 11.9% 12.2% 11.9% 8.5% 10.0% 1U.S. Generally Accepted Accounting Principles 2The 2012 settlement agreement is subject to PUC approval 3Calculated as core net income divided by average GAAP common equity 23 | |
|
|