|
FY12 Analyst Day May 24, 2012 Exhibit 99.2 |
|
2 Q4 FY12 Financial Highlights |
|
3 P&L Scorecard – Q4 FY12 (1) Excludes charges for productivity initiatives related to severance, asset write-offs and other implementation costs. (2) Excludes currency translation versus FY11 average rates as well as current year currency translation hedges. (U.S.$ MM) Change B/(W) Constant Excluding Special Items (1) FY12 FY11 Change Currency (2) Revenue $3,050 $2,889 5.6% 6.9% Gross Profit Margin 34.8% 36.3% (1.5) pp (1.4) pp Marketing $125 $117 (7.7%) (9.9%) Operating Income $414 $387 6.9% 8.7% Diluted EPS $0.81 $0.69 17.4% 20.3% Q4 A Strong Finish to the Year A Strong Finish to the Year |
|
4 Currency Dynamics – Q4 FY12 (U.S. $ MM) Q4 FY12 Constant Q4 Q4 Forex Currency FY11 Excluding Special Items (1) FY12 Impact Results (2) Results Revenue $3,050 $(39) $3,089 $2,889 Gross Profit Margin 34.8% (0.1)% 34.9% 36.3% Marketing $125 $(3) $128 $117 Operating Income $414 $(7) $421 $387 NPBT $343 $(10) $353 $321 Diluted EPS $0.81 $(0.02) $0.83 $0.69 (1) Excludes charges for productivity initiatives related to severance, asset write-offs and other implementation costs. (2) Excludes currency translation versus FY11 average rates as well as FY12 currency translation hedges. |
|
5 Special Items – Q4 FY12 (U.S.$ MM) Pre-Tax P&L Cost COGS SG&A OI Severance costs $18 $33 $51 Asset write-offs 19 0 19 Other implementation costs 22 21 43 Total Special Items $59 $54 $113 Special Items Impact ($0.27) Per Share Special Items Impact ($0.27) Per Share |
|
6 (U.S. $ MM) Index Constant Excluding Special Items (1) FY12 FY11 Change Currency (2) Net Sales $3,050 $2,889 106 107 Gross Profit 1,062 1,050 101 103 % of Net Sales 34.8% 36.3% Marketing 125 117 108 110 SG&A 522 546 96 97 Operating Income 414 387 107 109 Net Interest/Other Exp. (71) (66) 107 102 NPBT 343 321 107 110 Effective Tax Rate 23.2% 29.3% HJH Income $261 $224 117 120 Avg. Shares Outstanding 323 325 99 99 Diluted EPS $0.81 117 120 P&L – Q4 FY12 (1) Excludes charges for productivity initiatives related to severance, asset write-offs and other implementation costs. (2) Excludes currency translation versus FY11 average rates as well as current year currency translation hedges. Q4 0.69 $ |
|
7 Sales Drivers – Q4 FY12 (1) Volume plus price. FY12 results include the impact of two additional business days in Q4, which drove an estimated 3% additional volume in the quarter. Volume/Mix Price Acquis./Divest. Forex Total 1.5% 3.0% 2.4% (1.3%) 5.6% |
|
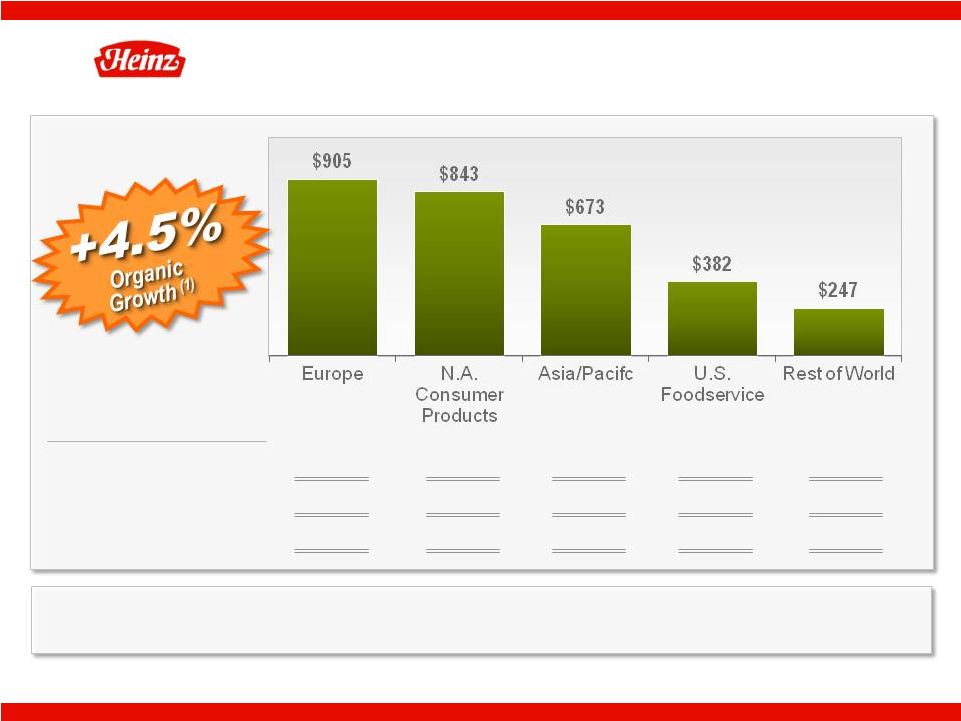
8 (U.S.$ MM) (1) Volume plus price (2) Excludes currency translation versus FY11 average rates. B/(W) vs Prior Year: Organic (1) 5.3% 0.4% 3.1% 3.5% 39.5% Constant Currency (2) 5.3% (1.8%) 3.1% 3.5% 115.0% Reported 1.2% (2.2%) 4.0% 3.5% 111.1% Net Sales by Segment – Q4 FY12 17.0% Organic Growth (1) in Emerging Markets 17.0% Organic Growth (1) in Emerging Markets |
|
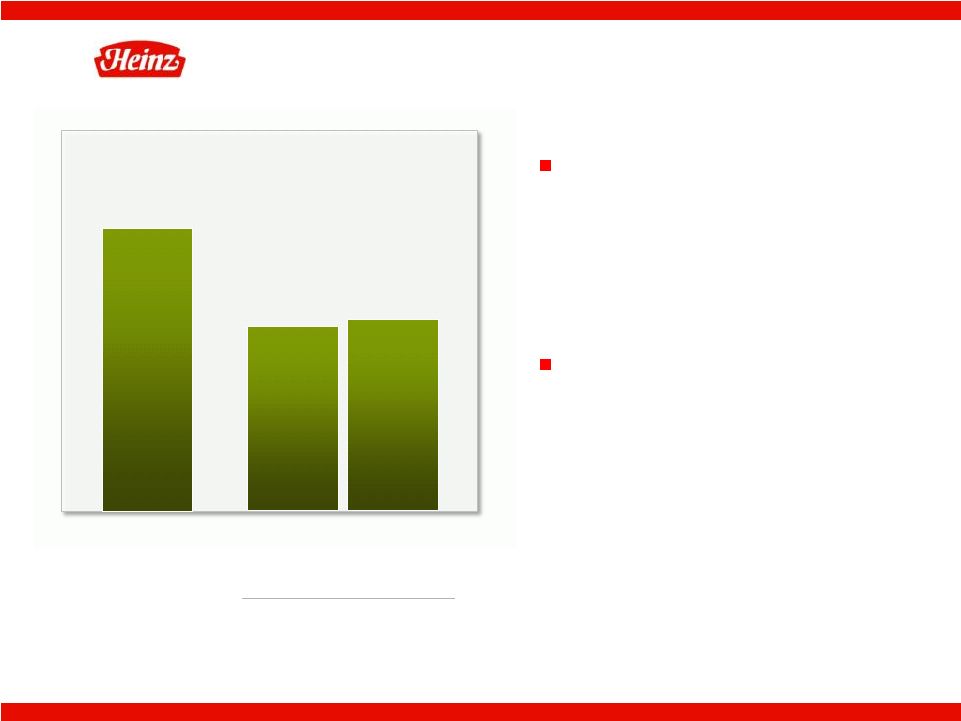
9 Gross Margin – Q4 FY12 (1) Excludes currency translation versus FY11 average rates. (2) Excludes charges for productivity initiatives related to severance, asset write-offs and other implementation costs. Favorable + Pricing + Productivity Unfavorable – Commodities – Product Mix FY11 Excluding Special Items (2) 36.3% FY12 FY12 – Constant Currency (1) 34.9% 34.8% |
|
10 Commodity Costs – Q4 FY12 Market Inflation of ~4% Sweeteners Fruits/ Vegetables Meat Packaging |
|
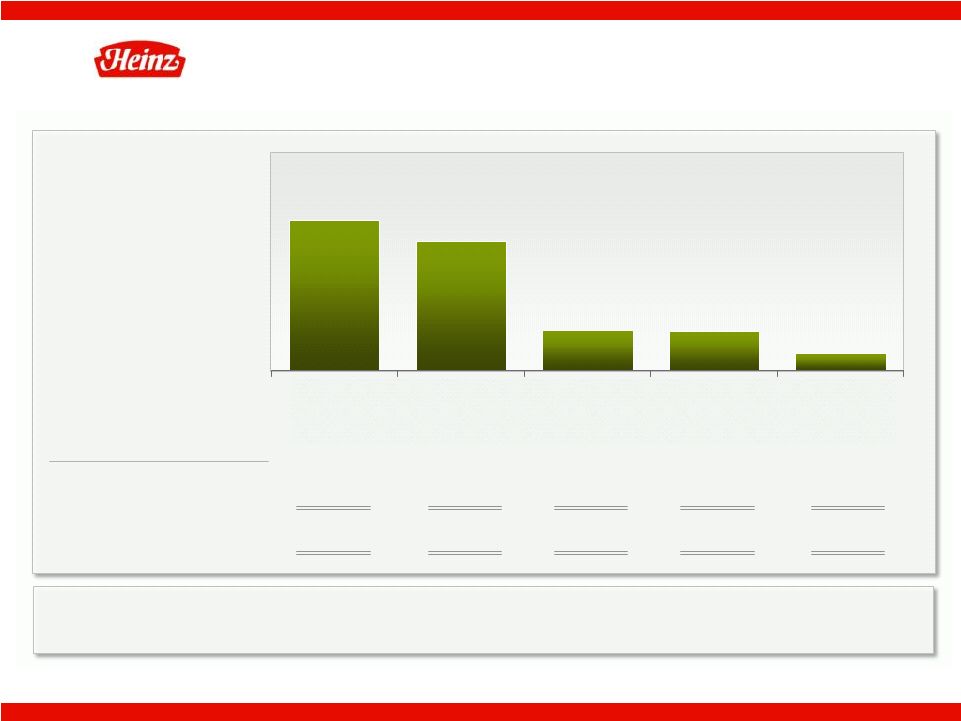
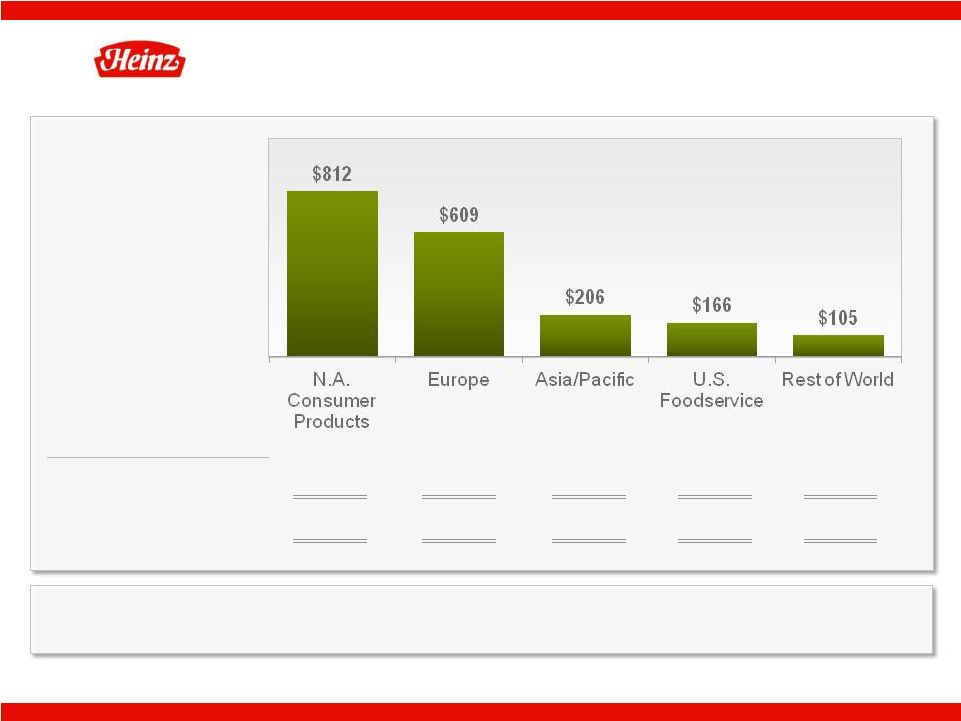
11 Operating Income by Segment – Q4 FY12 B/(W) vs. Prior Year: Constant Currency (1) (4.6%) 2.2% 38.4% 6.9% 34.0% Reported (5.0%) (1.0%) 38.4% 5.3% 33.5% (1) Excludes currency translation versus FY11 average rates. Note: All special items are reported in the Non-Operating segment. (U.S.$ MM) Constant Currency Operating Income Up 8.7% Constant Currency Operating Income Up 8.7% $192 $165 $52 $51 $22 N.A. Consumer Products Europe U.S. Foodservice Asia/Pacific Rest of World |
|
12 Balance Sheet Scorecard – Q4 FY12 (1) Calculated using a two point balance sheet average. (2) Excludes charges for productivity initiatives related to severance, asset write-offs and other implementation costs. (3) Cash from operations less capital expenditures net of proceeds from disposal of PP&E. (4) Excludes cash paid for productivity initiatives related to severance and other implementation costs and capital spending. (U.S.$ MM) Q4 Change FY12 FY11 B/(W) Capex (% of Revenue) 4.7% 4.9% 20 bps Cash Conversion Cycle (Days) (1)(2) 40 40 - Operating Free Cash Flow (3)(4) $667 $310 $357 |
|
13 (U.S.$ MM) Q4 Total Company Reported FY12 FY11 B/(W) Net Income $178 $227 ($49) Depreciation and Amortization 91 86 5 QOWC 423 75 349 Other Items 58 54 4 Cash Provided by Operating Activities 750 442 308 Capital Expenditures (144) (140) (4) Proceeds from Disposal of PP&E 3 8 (5) Operating Free Cash Flow $608 $310 $298 Acquisitions, net of divestitures $3 ($483) $486 Dividends ($154) ($146) ($9) Net Options Exercised 8 ($44) $52 Cash Flow – Q4 FY12 (1) Cash from operations less capital expenditures net of proceeds from disposal of PP&E. (2) Excludes cash paid for productivity initiatives related to severance and other implementation costs and capital spending. Operating Free Cash Flow (1) of $667 Excluding Special Items (2) Operating Free Cash Flow (1) of $667 Excluding Special Items (2) |
|
14 Full Year 2012 Financial Highlights |
|
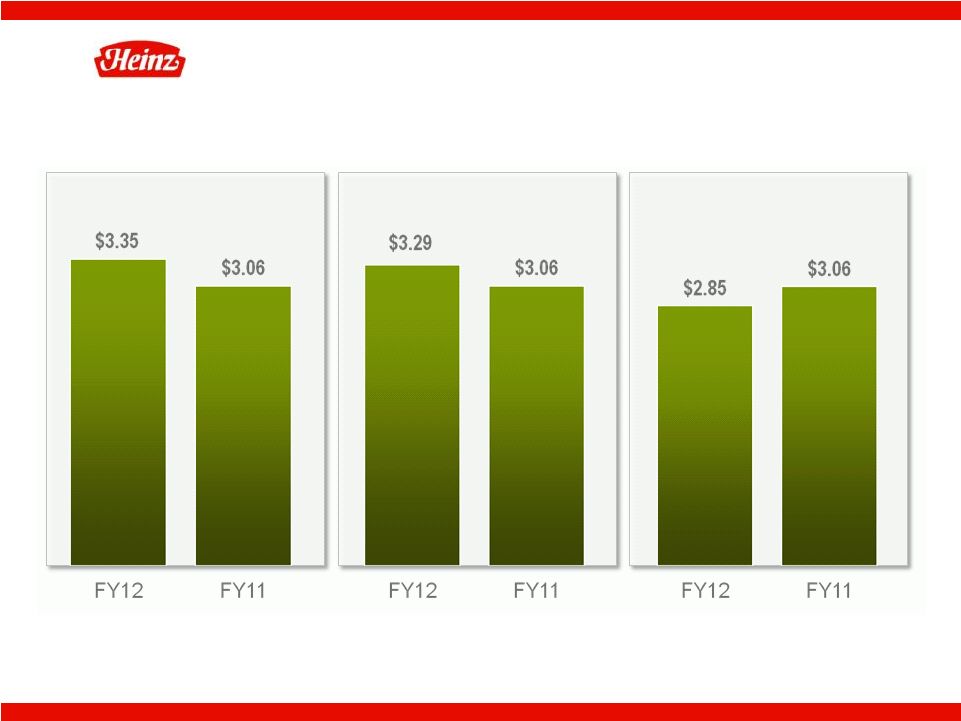
15 Full Year EPS Summary – FY12 (1) Excludes charges for productivity initiatives related to severance, asset write-offs and other implementation costs. (2) Excludes currency translation versus FY11 average rates as well as current year currency translation hedges. Excluding Special Items (1) Excluding Special Items (1) Reported Constant Currency (2) |
|
16 Full Year P&L Scorecard – FY12 (1) Excludes charges for productivity initiatives related to severance, asset write-offs and other implementation costs. (2) Excludes currency translation versus FY11 average rates as well as current year currency translation hedges. (U.S.$ MM) Change B/(W) Constant Excluding Special Items (1) FY12 FY11 Change Currency (2) Revenue $11,649 $10,707 8.8% 7.0% Gross Profit Margin 35.5% 36.9% (1.4) pp (1.3) pp Marketing $468 $427 (9.4%) (8.0%) Operating Income $1,675 $1,648 1.7% 0.3% Diluted EPS $3.35 $3.06 9.5% 7.5% YTD Overcame Industry Gross Margin Pressure While Investing in the Business Overcame Industry Gross Margin Pressure While Investing in the Business |
|
17 Currency Dynamics – FY12 (1) Excludes charges for productivity initiatives related to severance, asset write-offs and other implementation costs. (2) Excludes currency translation versus FY11 average rates as well as FY12 currency translation hedges. (U.S. $ MM) FY12 Constant Forex Currency FY11 Excluding Special Items (1) FY12 Impact Results (2) Results Revenue $11,649 $191 $11,459 $10,707 Gross Profit Margin 35.5% (0.1)% 35.6% 36.9% Marketing $468 $6 $462 $427 Operating Income $1,675 $22 $1,654 $1,648 NPBT $1,408 $30 $1,378 $1,374 Diluted EPS $3.35 $0.06 $3.29 $3.06 |
|
18 Full Year Special Items – FY12 (U.S.$ MM) Pre-Tax P&L Cost COGS SG&A OI Severance costs $44 $46 $90 Asset write-offs 58 1 59 Other implementation costs 38 37 75 Total Special Items $140 $84 $224 Special Items Impact ($0.50) Per Share Special Items Impact ($0.50) Per Share |
|
19 Full Year P&L - FY12 (1) Excludes charges for productivity initiatives related to severance, asset write-offs and other implementation costs. (2) Excludes currency translation versus FY11 average rates as well as current year currency translation hedges. (U.S. $ MM) Index Constant Excluding Special Items (1) FY12 FY11 Change Currency (2) Net Sales $11,649 $10,707 109 107 Gross Profit 4,139 3,953 105 103 % of Net Sales 35.5% 36.9% Marketing 468 427 109 108 SG&A 1,996 1,877 106 105 Operating Income 1,675 1,648 102 100 Net Interest/Other Exp. (268) (274) 98 101 NPBT 1,408 1,374 102 100 Effective Tax Rate 21.7% 26.8% HJH Income $1,086 $990 110 108 Avg. Shares Outstanding 323 323 100 100 Diluted EPS $3.35 $3.06 109 108 YTD |
|
20 Full Year Sales Drivers – FY12 (1) Volume plus price. FY12 results include the impact of two additional business days in Q4, which drove an estimated 0.8% additional volume for the year. Volume/Mix Price Acquis./Divest. Forex Total |
|
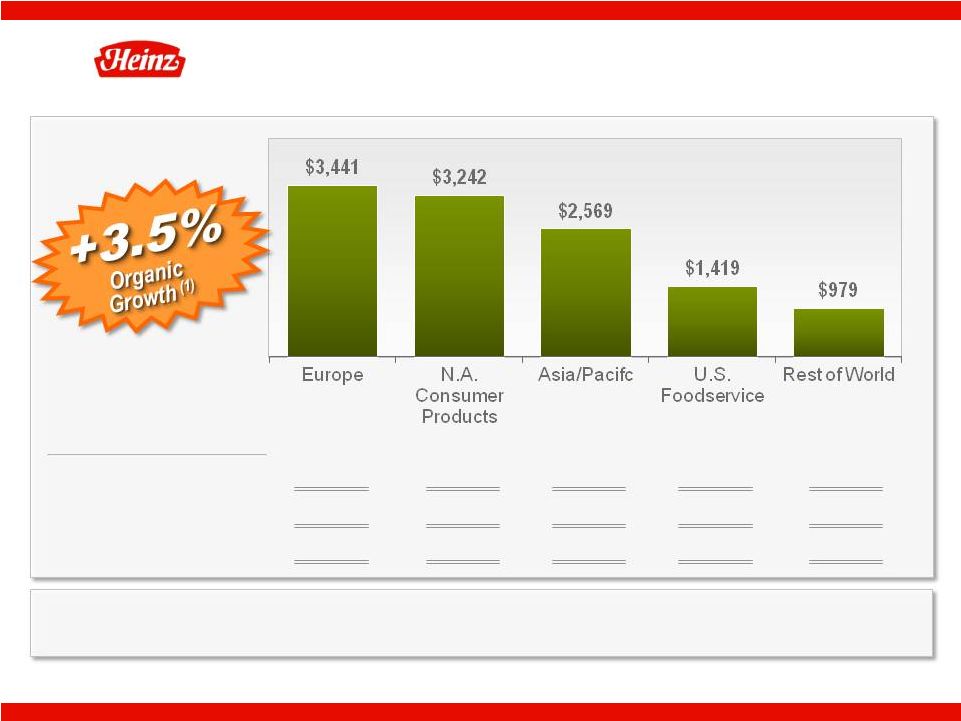
21 (U.S.$ MM) (1) Volume plus price. (2) Excludes currency translation versus FY11 average rates. B/(W) vs Prior Year: Organic (1) 4.3% 0.5% 2.2% 0.4% 33.4% Constant Currency (2) 4.3% (1.0%) 5.3% 0.4% 110.0% Reported 6.3% (0.7%) 10.7% 0.4% 108.3% Full Year Sales by Segment – FY12 16.4% Organic Growth (1) in Emerging Markets 16.4% Organic Growth (1) in Emerging Markets |
|
22 Full Year Gross Margin – FY12 (1) Excludes currency translation versus FY11 average rates. (2) Excludes charges for productivity initiatives related to severance, asset write-offs and other implementation costs. Favorable + Pricing + Productivity Unfavorable – Commodities – Product Mix – Acquisitions FY11 Excluding Special Items (2) 36.9% FY12 FY12 – Constant Currency (1) 35.6% 35.5% |
|
23 Full Year Commodity Costs – FY12 Sweeteners Resins Meat Dairy Sweeteners Resins Meat Dairy Market Inflation of ~7% |
|
24 (U.S.$ MM) Full Year Operating Income – FY12 (1) Excludes currency translation versus FY11 average rates. Note: All special items are reported in the Non-Operating segment. B/(W) vs. Prior Year: Constant Currency (1) (2.8%) 2.8% (10.6%) (5.5%) 97.5% Reported (2.5%) 4.8% (6.9%) (5.5%) 96.9% Emerging Markets Are Driving Company Profit Growth Emerging Markets Are Driving Company Profit Growth |
|
25 Full Year Balance Sheet Scorecard – FY12 (1) Calculated using a five point balance sheet average. (2) Cash from operations less capital expenditures net of proceeds from disposal of PP&E. (3) Total debt (long and short term) less cash and cash equivalents, restricted cash, short-term investments and hedge accounting adjustments. (4) EBITDA is H. J. Heinz Company Net Income before Interest, Taxes, Depreciation and Amortization. (5) After-tax ROIC is based on latest 12 month P&L and rolling 5-quarter average net invested capital. (6) Excludes charges for productivity initiatives related to severance, asset write-offs and other implementation costs. (7) Excludes cash paid for productivity initiatives related to severance and other implementation costs and capital spending. (U.S.$ MM) YTD Change FY12 FY11 B/(W) Capex (% of Revenue) 3.6% 3.1% (50) bps Cash Conversion Cycle (Days) (1)(6) 42 42 0 days Operating Free Cash Flow (2)(7) $1,206 $1,261 ($55) Net Debt (3) / EBITDA (4)(6) 1.8x 1.9x 0.1x After-Tax ROIC (5)(6) 19.2% 19.3% (10) bps FY12 ROIC Would Be 20.4% Excluding Quero and Foodstar FY12 ROIC Would Be 20.4% Excluding Quero and Foodstar |
|
26 Full Year Working Capital and Debt – FY12 (1) Excludes hedge accounting adjustments (2) FY12 includes $49 million of restricted cash. FY11 includes $10 million of restricted cash and $60 million of short-term investments. (3) Excludes charges for productivity initiatives related to severance, asset write-offs and other implementation costs. End of Period Dollars 5 Point Average (3) Better / Better / (U.S.$ MM) FY12 FY11 (Worse) FY12 FY11 (Worse) Trade Receivables $816 $1,039 $223 28 28 - Inventories 1,329 1,452 122 73 72 (1) Trade Payables 1,202 1,338 (135) 59 58 1 QOWC/CCC $943 $1,153 $210 42 42 - Debt Short-Term $247 $1,535 $1,288 Long-Term (1) 4,652 2,928 (1,724) Less: Cash (2) 1,379 794 585 Net Debt $3,519 $3,668 $150 |
|
27 (U.S.$ MM) Full Year Total Company Reported FY12 FY11 B/(W) Net Income $940 $1,006 ($66) Depreciation and Amortization 343 299 44 QOWC 160 61 99 Other Items 50 218 (168) Cash Provided by Operating Activities 1,493 1,584 (91) Capital Expenditures (419) (336) (83) Proceeds from Disposal of PP&E 10 13 (3) Operating Free Cash Flow $1,084 $1,261 ($177) Acquisitions, net of divestitures $1 ($616) $617 Dividends ($619) ($580) ($39) Net Purchase of Treasury Stock ($119) $85 ($204) Full Year Cash Flow – FY12 (1) Cash from operations less capital expenditures net of proceeds from disposal of PP&E. (2) Excludes cash paid for productivity initiatives related to severance and other implementation costs and capital spending. Operating Free Cash Flow (1) of $1,206 Excluding Special Items (2) Operating Free Cash Flow (1) of $1,206 Excluding Special Items (2) |
|
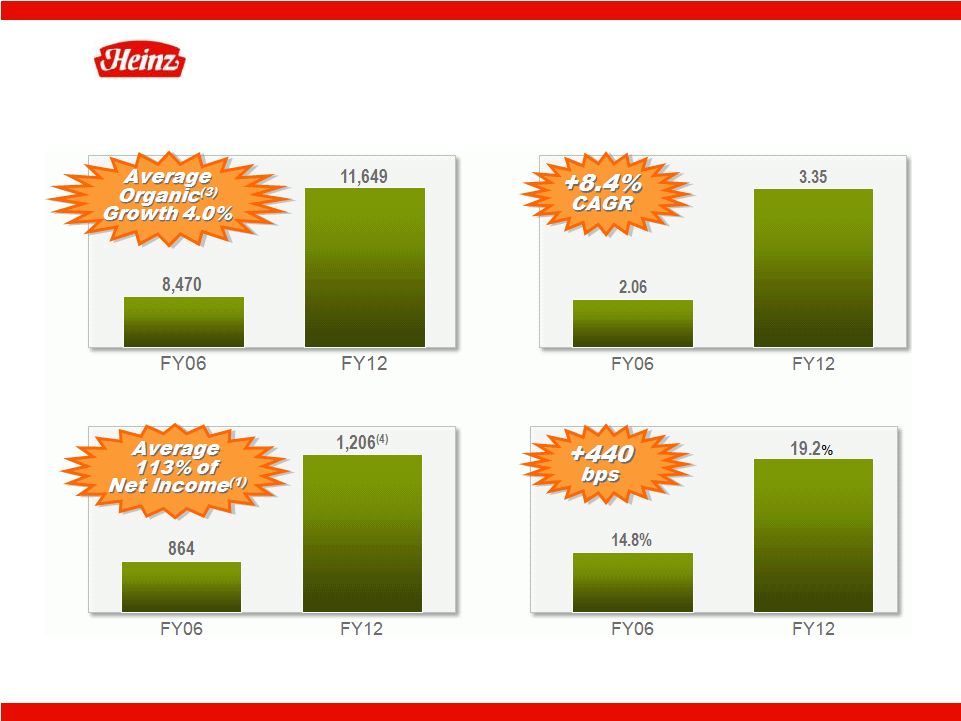
28 (1) Amounts are continuing operations, FY06 and FY12 Net Income and EPS excludes special items. (2) Operating Free Cash Flow is cash from operations less capital expenditures net of proceeds from disposal of PP&E. (3) Volume plus price. (4) Excludes cash paid for productivity initiatives related to severance and other implementation costs and capital spending. Sales (1) - $MM EPS (1) Operating Free Cash Flow (2) - $MM After-Tax ROIC Historical Growth Summary – Reported Results ex Special Items |
H. J. Heinz Company and Subsidiaries
Non-GAAP Performance Ratios
The Company reports its financial results in accordance with accounting principles generally accepted in the United States of America (“GAAP”). However, management believes that certain non-GAAP performance measures and ratios, used in managing the business, may provide users of this financial information with additional meaningful comparisons between current results and results in prior periods. Non-GAAP financial measures should be viewed in addition to, and not as an alternative for, the Company’s reported results prepared in accordance with GAAP. The following tables provide the calculations of the non-GAAP performance ratios in this presentation.
H. J. Heinz Company
Sales Variance Analysis
The following table illustrates the components of the change in net sales versus the prior year.
| | | | | | | | | | | | | | | | | | | | | | | | | | | | |
| | | 2006* | | | 2007* | | | 2008 | | | 2009 | | | 2010 | | | 2011 | | | 2012** | |
Total Heinz (Continuing Operations): | | | | | | | | | | | | | | | | | | | | | | | | | | | | |
Volume | | | 3.9 | % | | | 0.8 | % | | | 3.9 | % | | | (1.1 | %) | | | (1.3 | %) | | | 0.7 | % | | | (0.3 | %) |
Price | | | (0.1 | %) | | | 2.2 | % | | | 3.5 | % | | | 7.1 | % | | | 3.4 | % | | | 1.2 | % | | | 3.8 | % |
Acquisition | | | 5.0 | % | | | 1.3 | % | | | 0.7 | % | | | 2.0 | % | | | 2.3 | % | | | 0.6 | % | | | 4.0 | % |
Divestiture | | | (1.2 | %) | | | (3.1 | %) | | | (0.8 | %) | | | (0.1 | %) | | | (0.1 | %) | | | 0.0 | % | | | (0.5 | %) |
Exchange | | | (1.4 | %) | | | 2.8 | % | | | 5.2 | % | | | (6.6 | %) | | | 0.5 | % | | | (0.5 | %) | | | 1.8 | % |
| | | | | | | | | | | | | | | | | | | | | | | | | | | | |
Total Change in Net Sales | | | 6.1 | % | | | 3.9 | % | | | 12.3 | % | | | 1.3 | % | | | 4.8 | % | | | 2.0 | % | | | 8.8 | % |
| | | | | | | | | | | | | | | | | | | | | | | | | | | | |
Total Organic Growth (a) | | | 3.8 | % | | | 3.0 | % | | | 7.4 | % | | | 6.0 | % | | | 2.1 | % | | | 1.9 | % | | | 3.5 | % |
| | | | | | | | | | | | | | | | | | | | | | | | | | | | |
| (a) | Organic sales growth is a non-GAAP measure that excludes the impact of foreign currency exchange rates and acquisitions/divestitures. |
| * | Fiscal 2007 had one less week than Fiscal 2006 |
| ** | Fiscal 2012 had 2 extra business days than Fiscal 2011 |
(Totals may not add due to rounding)
H. J. Heinz Company
Sales Variance Analysis
The following table illustrates the components of the change in net sales versus the prior year for each of the five reported business segments.
| | | | | | | | | | | | | | | | | | | | | | | | | | | | | | | | | | | | | | | | |
| | | Fourth Quarter Ended April 29, 2012 | |
| | | Volume | | | + | | Price | | | = | | Organic
Sales Growth (a) | | | + | | Acquisitions/
Divestitures | | | = | | Constant
Currency (b) | | | + | | Foreign
Exchange | | | = | | Total Net
Sales
Change | |
Segment: | | | | | | | | | | | | | | | | | | | | | | | | | | | | | | | | | | | | | | | | |
North American Consumer Products | | | (1.7 | %) | | | | | 2.1 | % | | | | | 0.4 | % | | | | | (2.2 | %) | | | | | (1.8 | %) | | | | | (0.4 | %) | | | | | (2.2 | %) |
Europe | | | 1.6 | % | | | | | 3.7 | % | | | | | 5.3 | % | | | | | 0.0 | % | | | | | 5.3 | % | | | | | (4.1 | %) | | | | | 1.2 | % |
Asia/Pacific | | | 1.1 | % | | | | | 2.0 | % | | | | | 3.1 | % | | | | | 0.0 | % | | | | | 3.1 | % | | | | | 0.9 | % | | | | | 4.0 | % |
U.S. Foodservice | | | 1.2 | % | | | | | 2.3 | % | | | | | 3.5 | % | | | | | 0.0 | % | | | | | 3.5 | % | | | | | 0.0 | % | | | | | 3.5 | % |
Rest of World | | | 27.7 | % | | | | | 11.8 | % | | | | | 39.5 | % | | | | | 75.5 | % | | | | | 115.0 | % | | | | | (3.9 | %) | | | | | 111.1 | % |
Consolidated Totals | | | 1.5 | % | | | | | 3.0 | % | | | | | 4.5 | % | | | | | 2.4 | % | | | | | 6.9 | % | | | | | (1.3 | %) | | | | | 5.6 | % |
| |
| | | Fiscal Year Ended April 29, 2012 | |
| | | Volume | | | + | | Price | | | = | | Organic
Sales Growth (a) | | | + | | Acquisitions/
Divestitures | | | = | | Constant
Currency (b) | | | + | | Foreign
Exchange | | | = | | Total Net
Sales
Change | |
Segment: | | | | | | | | | | | | | | | | | | | | | | | | | | | | | | | | | | | | | | | | |
North American Consumer Products | | | (2.3 | %) | | | | | 2.8 | % | | | | | 0.5 | % | | | | | (1.6 | %) | | | | | (1.0 | %) | | | | | 0.3 | % | | | | | (0.7 | %) |
Europe | | | 0.6 | % | | | | | 3.7 | % | | | | | 4.3 | % | | | | | 0.0 | % | | | | | 4.3 | % | | | | | 1.9 | % | | | | | 6.3 | % |
Asia/Pacific | | | (0.3 | %) | | | | | 2.5 | % | | | | | 2.2 | % | | | | | 3.1 | % | | | | | 5.3 | % | | | | | 5.4 | % | | | | | 10.7 | % |
U.S. Foodservice | | | (2.2 | %) | | | | | 2.6 | % | | | | | 0.4 | % | | | | | 0.0 | % | | | | | 0.4 | % | | | | | 0.0 | % | | | | | 0.4 | % |
Rest of World | | | 11.9 | % | | | | | 21.5 | % | | | | | 33.4 | % | | | | | 76.6 | % | | | | | 110.0 | % | | | | | (1.7 | %) | | | | | 108.3 | % |
Consolidated Totals | | | (0.3 | %) | | | | | 3.8 | % | | | | | 3.5 | % | | | | | 3.5 | % | | | | | 7.0 | % | | | | | 1.8 | % | | | | | 8.8 | % |
The following represents other organic sales growth and constant currency sales growth figures in this presentation:
| | | | | | | | | | | | | | | | | | | | | | |
| | | Fourth Quarter Ended April 29, 2012 | |
| | | Organic
Sales Growth (a) | | | + | | Acquisitions/
Divestitures | | | + | | Foreign
Exchange | | | = | | Total Net
Sales
Change | |
Q4 FY12 Emerging Markets | | | 17.0 | % | | | | | 18.2 | % | | | | | (4.5 | %) | | | | | 30.7 | % |
| |
| | | Fiscal Year Ended April 29, 2012 | |
| | | Organic
Sales Growth (a) | | | + | | Acquisitions/
Divestitures | | | + | | Foreign
Exchange | | | = | | Total Net
Sales
Change | |
FY12 Emerging Markets | | | 16.4 | % | | | | | 24.9 | % | | | | | (0.4 | %) | | | | | 40.9 | % |
FY12 Top 15 Brands | | | 5.0 | % | | | | | 5.6 | % | | | | | 1.7 | % | | | | | 12.3 | % |
| (a) | Organic sales growth is a non-GAAP measure that excludes the impact of foreign currency translation and acquisitions/divestitures. |
| (b) | Constant currency sales growth is a non-GAAP measure that excludes the impact of foreign currency translation. |
(Totals may not add due to rounding)
H. J. Heinz Company
Continuing Operations, Excluding Special Items
| | | | |
| | | 2006 | |
Earnings per share from continuing operations attributable to H.J. Heinz Company- Reported | | $ | 1.25 | |
Separation, downsizing and integration | | | 0.28 | |
Net loss on disposals & impairments | | | 0.14 | |
Asset impairment charges for cost and equity investments | | | 0.31 | |
American jobs creation act | | | 0.07 | |
| | | | |
Earnings per share from continuing operations attributable to H.J. Heinz Company excluding special items | | $ | 2.06 | |
| | | | |
(Totals may not add due to rounding)
H. J. Heinz Company
QTD Results Excluding Charges for Productivity Initiatives
The following tables reconcile the Company’s reported results to results excluding charges for productivity initiatives in the current year in this presentation.
| | | | | | | | | | | | |
| (amounts in thousands, except per share data) | | Fourth Quarter Ended April 29, 2012 | |
| | | A
Reported
Results | | | B
Charges for
Productivity
Initiatives | | | C=A-B
Results Excluding
Charges for
Productivity Initiatives (1) | |
Net Sales | | $ | 3,049,589 | | | | — | | | $ | 3,049,589 | |
Gross Profit | | $ | 1,003,277 | | | ($ | 58,748 | ) | | $ | 1,062,025 | |
Gross Profit Margin | | | 32.9 | % | | | (1.9 | %) | | | 34.8 | % |
Marketing | | $ | 125,476 | | | | — | | | $ | 125,476 | |
SG&A | | $ | 576,387 | | | $ | 53,962 | | | $ | 522,425 | |
Operating Income | | $ | 301,414 | | | ($ | 112,710 | ) | | $ | 414,124 | |
Net Interest/Other Expenses | | ($ | 70,810 | ) | | | — | | | ($ | 70,810 | ) |
NPBT | | $ | 230,604 | | | ($ | 112,710 | ) | | $ | 343,314 | |
Effective tax rate | | | 23.0 | % | | | 23.6 | % | | | 23.2 | % |
H.J. Heinz Company Net Income | | $ | 175,342 | | | ($ | 86,123 | ) | | $ | 261,465 | |
Diluted EPS | | $ | 0.54 | | | ($ | 0.27 | ) | | $ | 0.81 | |
Cash Conversion Cycle | | | 39 | | | | (1 | ) | | | 40 | |
| | | | | | | | |
| (amounts in thousands, except per share data) | | Fourth Quarter Ended
April 27, 2011 | | | Change in Results
Excluding Charges for
Productivity Initiatives (1) | |
| | | Reported
Results | | |
Net Sales | | $ | 2,888,790 | | | | 5.6 | % |
Gross Profit | | $ | 1,049,643 | | | | 1.2 | % |
Gross Profit Margin | | | 36.3 | % | | | (1.5 | )pp |
Marketing | | $ | 116,511 | | | | 7.7 | % |
SG&A | | $ | 545,854 | | | | (4.3 | %) |
Operating Income | | $ | 387,278 | | | | 6.9 | % |
Net Interest/Other Expense | | ($ | 66,445 | ) | | | 6.6 | % |
NPBT | | $ | 320,833 | | | | 7.0 | % |
H.J. Heinz Company Net Income | | $ | 223,863 | | | | 16.8 | % |
Diluted EPS | | $ | 0.69 | | | | 17.4 | % |
| (1) | Excludes charges associated with targeted workforce reductions, asset write-offs associated with factory closures and other implementation costs in order to increase manufacturing effectiveness and accelerate productivity on a global scale. Other implementation costs primarily include professional fees, contract termination and relocation costs for the establishment of a European supply chain hub in the Netherlands and to improve global manufacturing efficiencies. |
(Totals may not add due to rounding)
H. J. Heinz Company
YTD Results Excluding Charges for Productivity Initiatives
The following tables reconcile the Company’s reported results to results excluding charges for productivity initiatives in the current year in this presentation.
| | | | | | | | | | | | |
| (amounts in thousands, except per share data) | | Fiscal Year Ended April 29, 2012 | |
| | | A
Reported
Results | | | B
Charges for
Productivity
Initiatives | | | C=A-B
Results Excluding
Charges for
Productivity Initiatives (1) | |
Net Sales | | $ | 11,649,079 | | | | — | | | $ | 11,649,079 | |
Gross Profit | | $ | 3,999,530 | | | ($ | 139,830 | ) | | $ | 4,139,360 | |
Gross Profit Margin | | | 34.3 | % | | | (1.2 | %) | | | 35.5 | % |
Marketing | | $ | 467,595 | | | | — | | | $ | 467,595 | |
SG&A | | $ | 2,080,767 | | | $ | 84,487 | | | $ | 1,996,280 | |
Operating Income | | $ | 1,451,168 | | | ($ | 224,317 | ) | | $ | 1,675,485 | |
Net Interest/Other Expenses | | ($ | 267,725 | ) | | | — | | | ($ | 267,725 | ) |
NPBT | | $ | 1,183,443 | | | ($ | 224,317 | ) | | $ | 1,407,760 | |
Provision for income taxes | | $ | 243,535 | | | ($ | 61,444 | ) | | $ | 304,979 | |
Effective tax rate | | | 20.6 | % | | | 27.4 | % | | | 21.7 | % |
H.J. Heinz Company Net Income | | $ | 923,159 | | | ($ | 162,874 | ) | | $ | 1,086,033 | |
Diluted EPS | | $ | 2.85 | | | ($ | 0.50 | ) | | $ | 3.35 | |
Trade Receivables (Days) | | | 28 | | | | — | | | | 28 | |
Inventories (Days) | | | 71 | | | | (2 | ) | | | 73 | |
Trade Payables (Days) | | | 58 | | | | (1 | ) | | | 59 | |
Cash Conversion Cycle | | | 42 | | | | — | | | | 42 | |
After-Tax ROIC | | | 16.8 | % | | | (2.4 | %) | | | 19.2 | % |
| | | | | | | | |
| | |
| (amounts in thousands, except per share data) | | Fiscal Year Ended
April 27, 2011 | | | Change in Results
Excluding Charges for
Productivity Initiatives (1) | |
| | | Reported Results | | |
Net Sales | | $ | 10,706,588 | | | | 8.8 | % |
Gross Profit | | $ | 3,952,540 | | | | 4.7 | % |
Gross Profit Margin | | | 36.9 | % | | | (1.4 | ) pp |
Marketing | | $ | 427,264 | | | | 9.4 | % |
SG&A | | $ | 1,877,086 | | | | 6.3 | % |
Operating Income | | $ | 1,648,190 | | | | 1.7 | % |
Net Interest/Other Expense | | ($ | 274,021 | ) | | | (2.3 | %) |
NPBT | | $ | 1,374,169 | | | | 2.4 | % |
H.J. Heinz Company Net Income | | $ | 989,510 | | | | 9.8 | % |
Diluted EPS | | $ | 3.06 | | | | 9.5 | % |
| (1) | Excludes charges associated with targeted workforce reductions, asset write-offs associated with factory closures and other implementation costs in order to increase manufacturing effectiveness and accelerate productivity on a global scale. Other implementation costs primarily include professional fees, contract termination and relocation costs for the establishment of a European supply chain hub in the Netherlands and to improve global manufacturing efficiencies. |
(Totals may not add due to rounding)
H. J. Heinz Company
QTD Constant Currency Results
The following tables reconcile the Company’s results excluding charges for productivity initiatives to constant currency results for the current period in this presentation.
| | | | | | | | | | | | | | | | |
| (amounts in thousands, except per share data) | | Fourth Quarter Ended April 29, 2012 | |
| | | A
Results Excluding
Charges for
Productivity Initiatives (1) | | | B
Currency
Translation | | | C
Currency
Translation
Hedges | | | D=A-B-C
Constant Currency
Results (2) | |
Net Sales | | $ | 3,049,589 | | | ($ | 38,921 | ) | | | NA | | | $ | 3,088,510 | |
Gross Profit | | $ | 1,062,025 | | | ($ | 15,034 | ) | | | NA | | | $ | 1,077,059 | |
Gross Profit Margin | | | 34.8 | % | | | (0.1 | %) | | | NA | | | | 34.9 | % |
Marketing | | $ | 125,476 | | | ($ | 2,605 | ) | | | NA | | | $ | 128,081 | |
SG&A | | $ | 522,425 | | | ($ | 5,482 | ) | | | NA | | | $ | 527,907 | |
Operating Income | | $ | 414,124 | | | ($ | 6,947 | ) | | | NA | | | $ | 421,071 | |
Net Interest/Other Expenses | | ($ | 70,810 | ) | | ($ | 163 | ) | | ($ | 2,592 | ) | | ($ | 68,055 | ) |
NPBT | | $ | 343,314 | | | ($ | 7,111 | ) | | ($ | 2,592 | ) | | $ | 353,017 | |
H.J. Heinz Company Net Income | | $ | 261,465 | | | ($ | 5,788 | ) | | ($ | 1,588 | ) | | $ | 268,841 | |
Diluted EPS | | $ | 0.81 | | | ($ | 0.02 | ) | | $ | 0.00 | | | $ | 0.83 | |
Segment Operating Income: | | | | | | | | | | | | | | | | |
N.A. Consumer Products | | $ | 192,100 | | | ($ | 799 | ) | | | NA | | | $ | 192,899 | |
Europe | | $ | 165,223 | | | ($ | 5,282 | ) | | | NA | | | $ | 170,505 | |
Asia Pacific | | $ | 51,049 | | | ($ | 795 | ) | | | NA | | | $ | 51,844 | |
US Foodservice | | $ | 52,002 | | | | — | | | | NA | | | $ | 52,002 | |
Rest of World | | $ | 22,302 | | | ($ | 71 | ) | | | NA | | | $ | 22,373 | |
| | | | | | | | |
| (amounts in thousands, except per share data) | | Fourth Quarter Ended April 27,
2011 | | | | |
| | | Reported Results | | | Constant Currency
Change (3) | |
Net Sales | | $ | 2,888,790 | | | | 6.9 | % |
Gross Profit | | $ | 1,049,643 | | | | 2.6 | % |
Gross Profit Margin | | | 36.3 | % | | | (1.4 | ) pp |
Marketing | | $ | 116,511 | | | | 9.9 | % |
SG&A | | $ | 545,854 | | | | (3.3 | %) |
Operating Income | | $ | 387,278 | | | | 8.7 | % |
Net Interest/Other Expense | | ($ | 66,445 | ) | | | 2.4 | % |
NPBT | | $ | 320,833 | | | | 10.0 | % |
H.J. Heinz Company Net Income | | $ | 223,863 | | | | 20.1 | % |
Diluted EPS | | $ | 0.69 | | | | 20.3 | % |
Segment Operating Income: | | | | | | | | |
N.A. Consumer Products | | $ | 202,233 | | | | (4.6 | %) |
Europe | | $ | 166,866 | | | | 2.2 | % |
Asia Pacific | | $ | 48,493 | | | | 6.9 | % |
US Foodservice | | $ | 37,584 | | | | 38.4 | % |
Rest of World | | $ | 16,702 | | | | 34.0 | % |
| (1) | See separate reconciliation and explanation of these figures compared to the reported amounts. |
| (2) | Excludes currency translation versus FY11 average rates as well as current year currency translation hedges. |
| (3) | Change is calculated by taking Q4 FY12 constant currency results versus the Q4 FY11 reported results. |
(Totals may not add due to rounding)
H. J. Heinz Company
YTD Constant Currency Results
The following tables reconcile the Company’s results excluding charges for productivity initiatives to constant currency results for the current period in this presentation.
| | | | | | | | | | | | | | | | |
| (amounts in thousands, except per share data) | | Fiscal Year Ended April 29, 2012 | |
| | | A
Results Excluding
Charges for
Productivity Initiatives (1) | | | B
Currency
Translation | | | C
Currency
Translation
Hedges | | | D=A-B-C
Constant Currency
Results (2) | |
Net Sales | | $ | 11,649,079 | | | $ | 190,543 | | | | NA | | | $ | 11,458,536 | |
Gross Profit | | $ | 4,139,360 | | | $ | 59,335 | | | | NA | | | $ | 4,080,025 | |
Gross Profit Margin | | | 35.5 | % | | | (0.1 | %) | | | NA | | | | 35.6 | % |
Marketing | | $ | 467,595 | | | $ | 5,985 | | | | NA | | | $ | 461,610 | |
SG&A | | $ | 1,996,280 | | | $ | 31,548 | | | | NA | | | $ | 1,964,732 | |
Operating Income | | $ | 1,675,485 | | | $ | 21,802 | | | | NA | | | $ | 1,653,683 | |
Net Interest/Other Expenses | | ($ | 267,725 | ) | | ($ | 776 | ) | | $ | 8,815 | | | ($ | 275,764 | ) |
NPBT | | $ | 1,407,760 | | | $ | 21,026 | | | $ | 8,815 | | | $ | 1,377,919 | |
H.J. Heinz Company Net Income | | $ | 1,086,033 | | | $ | 14,965 | | | $ | 5,399 | | | $ | 1,065,669 | |
Diluted EPS | | $ | 3.35 | | | $ | 0.05 | | | $ | 0.02 | | | $ | 3.29 | |
Segment Operating Income: | | | | | | | | | | | | | | | | |
N.A. Consumer Products | | $ | 812,056 | | | $ | 2,569 | | | | NA | | | $ | 809,487 | |
Europe | | $ | 608,829 | | | $ | 11,269 | | | | NA | | | $ | 597,560 | |
Asia Pacific | | $ | 206,306 | | | $ | 8,315 | | | | NA | | | $ | 197,991 | |
US Foodservice | | $ | 166,298 | | | | — | | | | NA | | | $ | 166,298 | |
Rest of World | | $ | 105,080 | | | ($ | 351 | ) | | | NA | | | $ | 105,431 | |
| | | | | | | | |
| (amounts in thousands, except per share data) | | Fiscal Year Ended April 27,
2011 | | | | |
| | | Reported Results | | | Constant Currency
Change (3) | |
Net Sales | | $ | 10,706,588 | | | | 7.0 | % |
Gross Profit | | $ | 3,952,540 | | | | 3.2 | % |
Gross Profit Margin | | | 36.9 | % | | | (1.3 | )pp |
Marketing | | $ | 427,264 | | | | 8.0 | % |
SG&A | | $ | 1,877,086 | | | | 4.7 | % |
Operating Income | | $ | 1,648,190 | | | | 0.3 | % |
Net Interest/Other Expense | | ($ | 274,021 | ) | | | 0.6 | % |
NPBT | | $ | 1,374,169 | | | | 0.3 | % |
H.J. Heinz Company Net Income | | $ | 989,510 | | | | 7.7 | % |
Diluted EPS | | $ | 3.06 | | | | 7.5 | % |
Segment Operating Income: | | | | | | | | |
N.A. Consumer Products | | $ | 832,719 | | | | (2.8 | %) |
Europe | | $ | 581,148 | | | | 2.8 | % |
Asia Pacific | | $ | 221,580 | | | | (10.6 | %) |
US Foodservice | | $ | 175,977 | | | | (5.5 | %) |
Rest of World | | $ | 53,371 | | | | 97.5 | % |
| (1) | See separate reconciliation and explanation of these figures compared to the reported amounts. |
| (2) | Excludes currency translation versus FY11 average rates as well as current year currency translation hedges. |
| (3) | Change is calculated by taking FY12 constant currency results versus the FY11 reported results. |
(Totals may not add due to rounding)
H. J. Heinz Company
Operating Free Cash Flow
| | | | | | | | | | | | | | | | | | | | | | | | | | | | | | | | | | | | |
| Total Company | | | | | | | | | | | | | | | | | Fourth Quarter Ended | | | Fiscal Year Ended | |
| (amounts in millions) | | Fiscal Year Ended | | | April 29, 2012
FY 2012 | | | April 27, 2011
FY 2011 | | | April 29, 2012
FY 2012 | | | April 27, 2011
FY 2011 | |
| | | FY 2006 (2)(3) | | | FY 2007 (3) | | | FY 2008 (3) | | | FY 2009 (3) | | | FY 2010 (3) | | | | | |
Cash provided by operating activities | | $ | 1,075.0 | | | $ | 1,062.3 | | | $ | 1,188.3 | | | $ | 1,166.9 | | | $ | 1,262.2 | | | $ | 749.6 | | | $ | 442.1 | | | $ | 1,493.1 | | | $ | 1,583.6 | |
Capital expenditures | | | (230.6 | ) | | | (244.6 | ) | | | (301.6 | ) | | | (292.1 | ) | | | (277.6 | ) | | | (144.2 | ) | | | (140.4 | ) | | | (418.7 | ) | | | (335.6 | ) |
Proceeds from disposals of property, plant and equipment | | | 19.4 | | | | 60.7 | | | | 8.5 | | | | 5.4 | | | | 96.5 | | | | 2.9 | | | | 8.2 | | | | 9.8 | | | | 13.2 | |
| | | | | | | | | | | | | | | | | | | | | | | | | | | | | | | | | | | | |
Operating Free Cash Flow | | $ | 863.8 | | | $ | 878.4 | | | $ | 895.2 | | | $ | 880.2 | | | $ | 1,081.1 | | | $ | 608.3 | | | $ | 309.9 | | | $ | 1,084.2 | | | $ | 1,261.2 | |
| | | | | | | | | | | | | | | | | | | | | | | | | | | | | | | | | | | | |
Cash for productivity initiatives (1) | | | | | | | | | | | | | | | | | | | | | | $ | (59.3 | ) | | | | | | $ | (121.9 | ) | | | | |
| | | | | | | | | | | | | | | | | | | | | | | | | | | | | | | | | | | | |
Operating Free Cash Flow excluding special items | | | | | | | | | | | | | | | | | | | | | | $ | 667.6 | | | | | | | $ | 1,206.1 | | | | | |
| | | | | | | | | | | | | | | | | | | | | | | | | | | | | | | | | | | | |
| (1) | Cash paid for productivity initiatives related to severance and other implementation costs and capital spending. Other implementation costs primarily include professional fees, contract termination and relocation costs for the establishment of a European supply chain hub in the Netherlands and to improve global manufacturing efficiencies. |
| (2) | Includes amounts from the European seafood and Tegel® poultry businesses that were discontinued in Fiscal 2006. |
| (3) | Includes amounts from the Kabobs business that was discontinued in the second quarter of Fiscal 2010 and the U.K. private label frozen desserts and Appetizers And businesses which were discontinued in the third quarter of Fiscal 2010. |
(Totals may not add due to rounding)
H.J. Heinz Company
Net Debt Calculation
| | | | | | | | |
(In Millions) | | April 29, 2012
FY 2012 | | | April 27, 2011
FY 2011 | |
Short-term debt | | $ | 46.5 | | | $ | 87.8 | |
Long-term debt, including current portion | | | 4,980.2 | | | | 4,525.3 | |
| | | | | | | | |
Total debt | | | 5,026.7 | | | | 4,613.1 | |
Less: | | | | | | | | |
Hedge accounting adjustments | | | (128.4 | ) | | | (150.5 | ) |
Cash and cash equivalents | | | (1,330.4 | ) | | | (724.3 | ) |
Short-term investments | | | — | | | | (60.1 | ) |
Restricted cash | | | (49.0 | ) | | | (9.7 | ) |
| | | | | | | | |
Net Debt | | $ | 3,518.8 | | | $ | 3,668.3 | |
| | | | | | | | |
(Totals may not add due to rounding)
H.J. Heinz Company
EBITDA and Net Debt/EBITDA
| | | | | | | | |
(In Millions) | | April 29, 2012
FY 2012 | | | April 27, 2011
FY 2011 | |
Net income attributable to H.J. Heinz Company excluding charges for productivity initiatives (1) | | $ | 1,086.0 | | | $ | 989.5 | |
Less: | | | | | | | | |
Interest income | | | (34.6 | ) | | | (22.6 | ) |
Add: | | | | | | | | |
Provision from income taxes excluding charges for productivity initiatives (1) | | | 305.0 | | | | 368.2 | |
Interest expense | | | 294.1 | | | | 275.4 | |
Depreciation | | | 295.7 | | | | 255.2 | |
Amortization | | | 47.1 | | | | 43.4 | |
| | | | | | | | |
EBITDA | | $ | 1,993.3 | | | $ | 1,909.2 | |
| | | | | | | | |
Annualized EBITDA | | | 1,993.3 | | | | 1,909.2 | |
Net Debt | | $ | 3,518.8 | | | $ | 3,668.3 | |
Net Debt/EBITDA | | | 1.8 | | | | 1.9 | |
| | | | | | | | |
| (1) | See separate reconciliation and explanation of these figures compared to the reported amounts. |
(Totals may not add due to rounding)