Exhibit 99.1

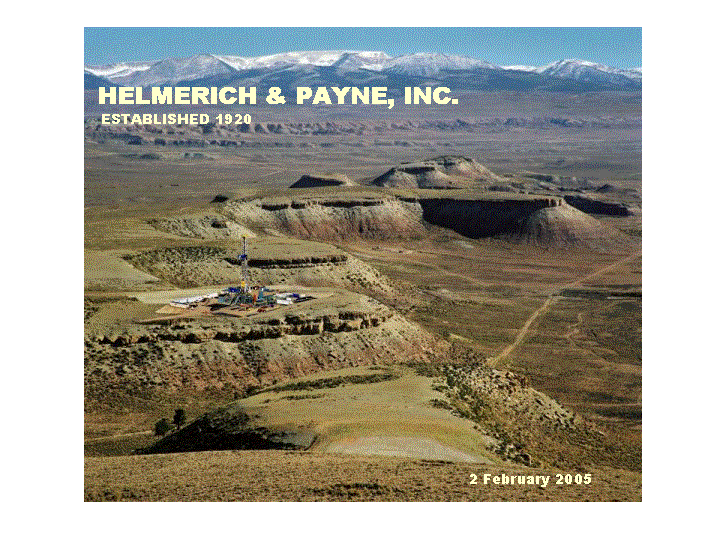
| December 2004 ESTABLISHED 1920 HELMERICH & PAYNE, INC. 2 February 2005 |

| The information contained within this presentation is forward looking and involves risks and uncertainties that could significantly impact expected results. A discussion of these risks and uncertainties is contained in the Company's Form 10-K filed with the Securities and Exchange Commission on December 13, 2004. |

| Rig Locations 101 U.S. Rigs 27 International Rigs 128 Total H&P Rigs 7 Management Contracts South America Venezuela 9/12 Colombia 2/2 Ecuador 8/8 Bolivia 0/3 Argentina 1/1 GOM 5/11 U.S. Land 84/90 California Equatorial Guinea Russia Hungary - Rig 168 (In Transit to U.S.) |

| 1997 1998 1999 2000 2001 2002 2003 2004 Rigs 18,000' + 15 15 15 16 18 22 22 21 Rigs 8 - 18,000' 15 21 25 23 31 44 61 69 Move from Deep to Mid-Depth Land Rigs |

| Newest Fleet In Industry Built or Upgraded February 2005 % of Fleet 1980 - 1989 16 12% 1990 - 1994 23 18% 1995 - 1999 38 30% 2000 - 2004 51 40% Total Rigs 128 100% Electric Rigs (SCR & AC) 93% Varco Top Drives 109 |

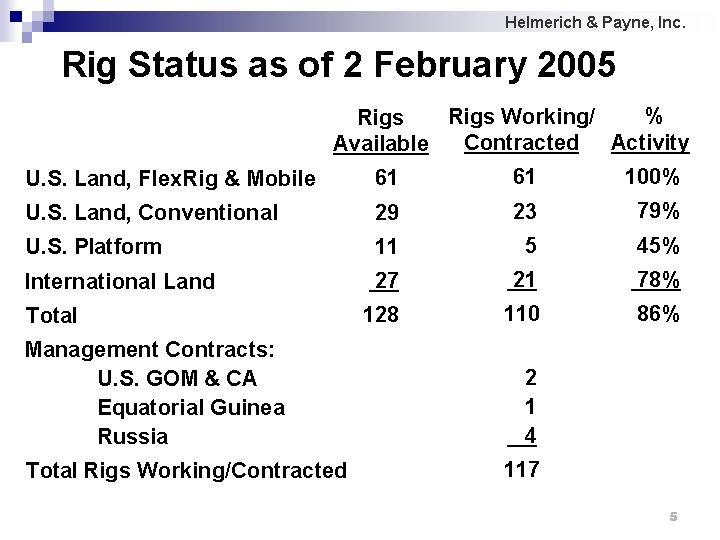
| Rigs Available 61 29 11 27 128 Rigs Working/ Contracted 61 23 5 21 110 % Activity 100% 79% 45% 78% 86% U.S. Land, FlexRig & Mobile U.S. Land, Conventional U.S. Platform International Land Total Management Contracts: U.S. GOM & CA Equatorial Guinea Russia Total Rigs Working/Contracted Rig Status as of 2 February 2005 2 1 4 117 |

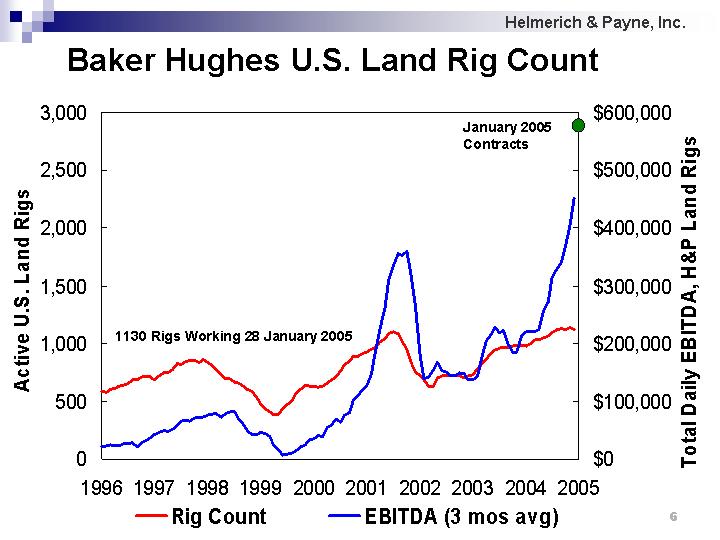
| 1996 1997 1998 1999 2000 2001 2002 2003 2004 Rig Count 585 583 606 614 629 643 655 682 682 708 714 714 689 719 745 748 778 830 818 842 858 856 835 861 836 811 772 726 696 692 670 656 635 606 587 531 479 432 410 387 395 435 468 510 573 608 639 635 635 627 634 659 689 715 763 819 848 886 893 920 929 952 974 1014 1041 1085 1100 1082 1026 955 847 761 721 682 634 628 702 720 720 719 722 722 706 720 727 781 819 864 916 943 959 966 967 980 991 988 983 1001 1030 EBITDA (3 mos avg) 21672 22697 24795 23152 23154 26157 27263 29043 21751 28228 31812 37819 42653 45866 50576 47182 52090 59632 65372 67306 66317 70693 73006 73381 76473 77513 77820 72916 79049 82462 81741 69846 61025 50010 43016 41935 46725 45103 39858 22643 15558 7309 9240 10456 14874 20881 25037 34037 36013 41622 39793 54905 58278 68856 64096 75973 80862 100711 110529 121765 126430 148355 184713 226154 260274 310431 334294 355311 351836 359959 323262 265302 177679 139395 141796 155548 166680 152648 150851 143378 143909 149367 147487 136522 136610 144423 172368 204778 216052 227453 219053 221942 198579 184485 184892 214259 220382 219967 220459 Baker Hughes U.S. Land Rig Count January 2005 Contracts 1130 Rigs Working 28 January 2005 |

| U.S. Land Cash Flow Margin |

| FlexRig3 32 rigs 30 months in field 21 months average rig age FlexRig3 Project Return Estimates 4000 5000 6000 7000 8000 9000 10000 11000 Actual 12 mos. FY2004 Avg. Dayrate* $11,560 CoCR, No Tax CoCR, Fully Taxed Actual 1st Qtr FY2005 Avg. Dayrate $13,570 ROI, Fully Taxed Actual Feb.1, 2005 Avg. Dayrate $15,580 Projected Avg. Dayrate $18,000 20,400 operating days 99% activity 32nd rig spud on May 2004 * Note: Average Dayrate values are different and usually lower than the corresponding Average Rig Revenue per Day values. |

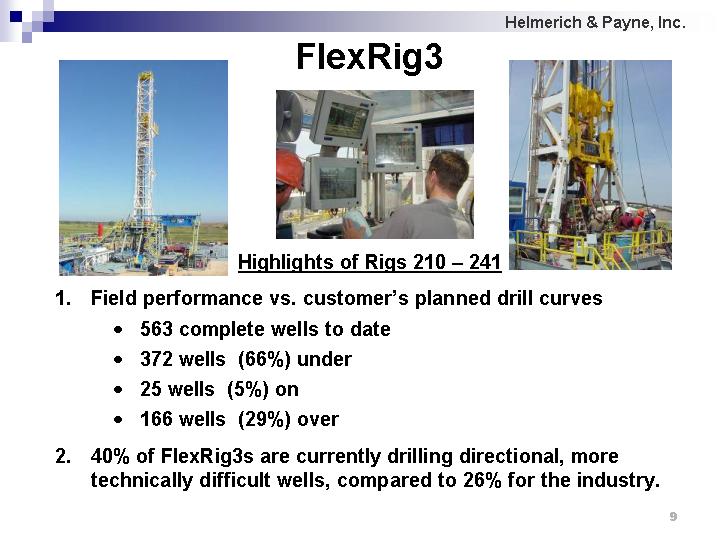
| FlexRig3 Highlights of Rigs 210 - 241 1. Field performance vs. customer's planned drill curves ? 563 complete wells to date ? 372 wells (66%) under ? 25 wells (5%) on ? 166 wells (29%) over 2. 40% of FlexRig3s are currently drilling directional, more technically difficult wells, compared to 26% for the industry. |

| FlexRig3 H&P Rig 241 - Wyoming |