Exhibit 99.1
| Helmerich & Payne, Inc. Goldman Sachs Global Energy Conference January 8-9, 2014 |

| Statements within this presentation are “forward-looking statements” within the meaning of the Securities Act of 1933 and the Securities Exchange Act of 1934, and are based on current expectations and assumptions that are subject to risks and uncertainties. All statements other than statements of historical facts included in this release, including, without limitation, statements regarding the registrant’s future financial position, business strategy, budgets, projected costs and plans and objectives of management for future operations, are forward-looking statements. For information regarding risks and uncertainties associated with the Company’s business, please refer to the “Risk Factors” and “Management’s Discussion & Analysis of Financial Condition and Results of Operations” sections of the Company’s SEC filings, including but not limited to, its annual report on Form 10-K and quarterly reports on Form 10-Q. As a result of these factors, Helmerich & Payne, Inc.’s actual results may differ materially from those indicated or implied by such forward-looking statements. We undertake no duty to update or revise our forward-looking statements based on changes in internal estimates, expectations or otherwise, except as required by law. Forward-looking Statements |
| A Quick Primer on Helmerich & Payne U.S. land drilling market share leader Focused on innovation and returns on capital Leader in ongoing industry land rig replacement cycle Most modern and capable land drilling fleet Strong balance sheet |
| Announcing Eight Additional New Builds Eight incremental FlexRigs with multi-year term contracts with one customer in the U.S. Since the beginning of fiscal 2014, we have now announced term contracts for 26 new FlexRigs with seven customers in the U.S. As of January 8, 2014, eight of the 26 announced FlexRigs have already been delivered. Once the remaining rigs are completed, the Company’s global fleet is expected to include 327 FlexRigs. |
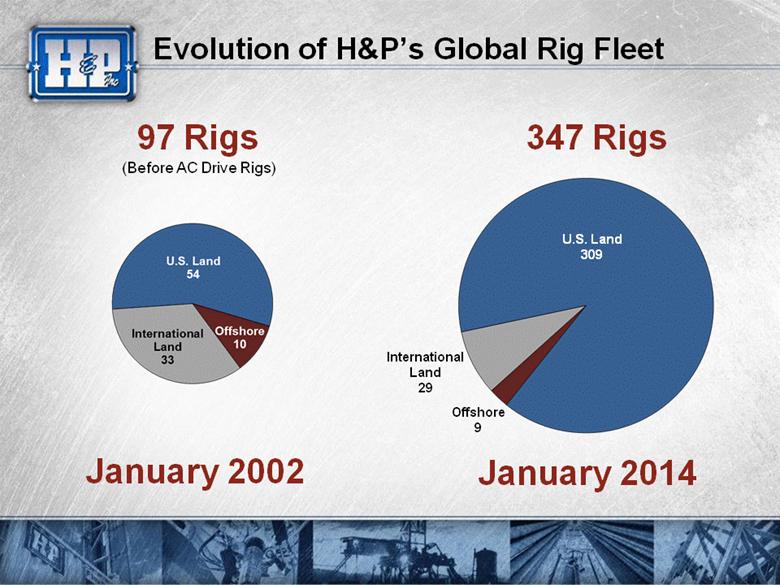
| H&P’s Global Rig Fleet * Estimates include existing rigs and announced new build commitments |
| Evolution of H&P’s Global Rig Fleet International Land 29 Offshore 9 January 2002 U.S. Land 309 97 Rigs 347 Rigs (Before AC Drive Rigs) January 2014 |
| H&P Activity as of January 8, 2014 Rigs Working/ Contracted 264 264 0 8 23 295 Rigs Available 309 276 33 9 29 347 18 1 366 % Contracted 85% 96% 0% 89% 79% 85% U.S. Land AC Drive FlexRigs SCR Fleet Offshore International Land Total FlexRig Construction Other AC Construction Total Fleet (1) (2) Includes announced new build commitments under term contracts. Includes an announced 3,000 horsepower AC new build under term contract with international delivery expected in Spring 2014. |
| H&P’s U.S. Land Fleet Activity (1) (1) Includes completed new builds pending delivery and not generating revenue days. |
| H&P’s New Build Program Continues H&P plans to continue a build cadence of two rigs per month through the rest of the fiscal year. We have the flexibility to increase our production cadence depending on market demand. We believe that this approach will continue to reward shareholders. |
| H&P Global Fleet Under Term Contract Segment Q2 Q3 Q4 Q1 Q2 Q3 Q4 FY14 FY14 FY14 FY15 FY15 FY15 FY15 U.S. Land 148.3 139.4 130.7 113.4 97.3 76.6 61.2 International Land 13.8 13.1 13.0 11.3 9.2 7.8 6.3 Offshore 3.0 2.5 1.9 1.0 1.0 1.0 1.0 Total 165.1 155.0 145.6 125.7 107.5 85.4 68.4 Number of Rigs Already Under Long-Term Contracts (Estimated Quarterly Average, Including Announced New Builds - as of 1/8/14) |
| Overall U.S. Land Market Trends Firm spot market pricing Relatively stable active rig count, with AC drive rigs capturing incremental market share from less capable rigs Continued customer focus on drilling efficiency, technology and safety Differentiated performance delivers tangible value and will be rewarded accordingly Conversations with customers for additional new build orders continue |
| Changes in Lower 48 U.S. Land Rig Count * PDS’ active rig count includes both PDS and Grey Wolf rigs. |
| As of December 2013 (~1,680 Active Rigs in U.S. Land By Power Type) The Replacement Cycle Continues As of October 2008 (Peak) (~1,900 Active Rigs in U.S. Land By Power Type) Note: The above estimates corresponding to rig activity are derived from multiple sources including Rig Data, Smith Bits, and corporate filings. Additionally, the drawworks capacity of each land rig included in the above analysis was greater than 600 horsepower. Certain assumptions were made on approximately 5% of the active rigs that were not readily identified. |
| High-Grading is Accelerating Note: The above estimates corresponding to rig activity are derived from multiple sources including Rig Data, Smith Bits, and corporate filings. Additionally, the drawworks capacity of each land rig included in the above analysis was greater than 600 horsepower. Certain assumptions were made on approximately 5% of the active rigs that were not readily identified. As of December 2012 (~1,610 Active Rigs in U.S. Land By Power Type) As of December 2013 (~1,680 Active Rigs in U.S. Land By Power Type) |
| AC Rigs Continue to Gain Market Share Note: The above estimates corresponding to rig activity are derived from multiple sources including Rig Data, Smith Bits, and corporate filings. Additionally, the drawworks capacity of each land rig included in the above analysis was greater than 600 horsepower. Certain assumptions were made on approximately 5% of the active rigs that were not readily identified. |
| H&P’s Lead in U.S. Land AC Drive Rigs Note: The above estimates corresponding to U.S. lower 48 AC Drive fleets are derived from Rig Data and corporate filings. |
| Unconventional Plays Shaping Landscape Well Complexity is increasing: Horizontal and directional wells make up over 75% of wells drilled in the U.S. Extended reach laterals progressively longer Multi-well pad drilling gaining acceptance in more areas A factory approach to drilling wells is required This all creates an expanding level of demand for FlexRigs |
| Increasing Focus on More Difficult Drilling |
| Note: The above estimates corresponding to horizontal and directional rig activity by power type are derived from multiple sources including Rig Data, Smith Bits, and corporate filings. Additionally, the drawworks capacity of each land rig included in the above analysis was greater than 600 horsepower. Certain assumptions were made on approximately 5% of the active rigs that were not readily identified. U.S. Land Horizontal and Directional Activity |
| Unconventional Drilling Growth in Permian Note: The above estimates are derived from Rig Data. Additionally, the drawworks capacity of each land rig included in the above analysis was greater than 600 horsepower. |
| (282 H&P Contracted Land Rigs as of 1/8/14*) Leading U.S. Unconventional Driller * Includes 18 announced new FlexRigs with customer commitments scheduled for delivery in calendar 2014. |
| H&P Continues to Capture Market Share As of October 2008 (Peak) (~1,900 Active Rigs in U.S. Land) As of December 2013 (~1,680 Active Rigs in U.S. Land) Note: The above estimates corresponding to market share are derived from Rig Data. PDS’s market share includes both PDS and Grey Wolf rigs. Additionally, the drawworks capacity of each land rig included in the above analysis was greater than 600 horsepower. |
| The FlexRig Difference: Key Advantages Increased drilling productivity and reliability Variable frequency (AC) drives with increased precision and measurability Computerized electronic driller that more precisely controls weight on bit, rotation and pressure Designed to move quickly from well to well Accelerated well programs and NPV gains A significantly enhanced and safer workplace Minimized impact to the environment Total well cost savings even at premium dayrates H&P’s FlexRig Advantage |
| Performance is Not Only About Better Rigs Our competitive advantage is also about: People Safety Experience Training Culture Support Structure Processes Organizational Network Maintenance Supply Chain |

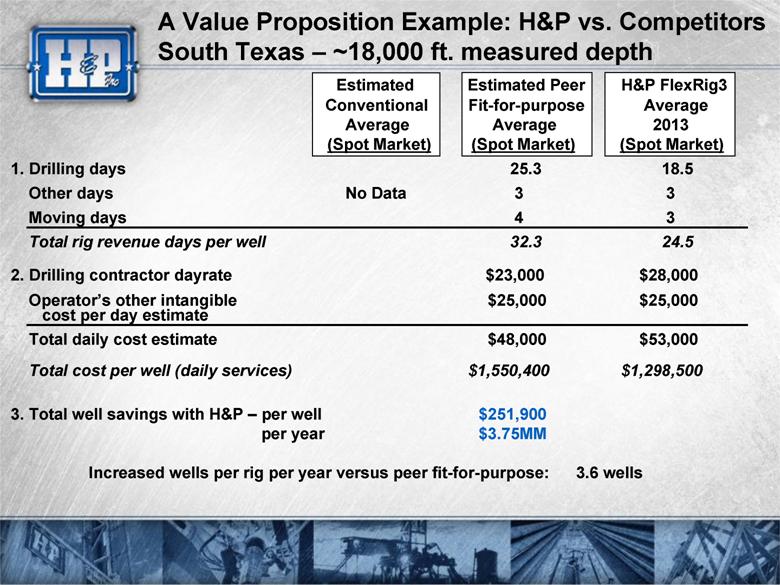
| A Value Proposition Example: H&P vs. Competitors South Texas – ~18,000 ft. measured depth Estimated Estimated Peer H&P FlexRig3 Conventional Fit-for-purpose Average Average Average 2013 (Spot Market) (Spot Market) (Spot Market) 1. Drilling days 25.3 18.5 Other days No Data 3 3 Moving days 4 3 Total rig revenue days per well 32.3 24.5 2. Drilling contractor dayrate $23,000 $28,000 Operator’s other intangible $25,000 $25,000 cost per day estimate Total daily cost estimate $48,000 $53,000 Total cost per well (daily services) $1,550,400 $1,298,500 3. Total well savings with H&P – per well $251,900 per year $3.75MM Increased wells per rig per year versus peer fit-for-purpose: 3.6 wells |
| FlexRigs Delivering Drilling Efficiencies We have approximately 1,300 rig years of AC Drive FlexRig drilling experience. Drilled over 52 million feet in 2012 Drilled in excess of 61 million feet in 2013 Improved our footage per day by 23% between 2011 and 2012 Footage per day has increased approximately 14% in 2013 |
| FlexRigs Leading in Pad Drilling Efforts AC Drive FlexRigs lead in pad drilling efforts in U.S. Land FlexRig3 first pad application in 2004 FlexRig4 was the first bi-directional land drilling design FlexRig5 is the latest generation of bi-directional, long lateral pad drilling rig We have drilled over 6,700 wells on approximately 1,350 pads |
| H&P’s Pad Capable Fleet Approximately 50% of H&P’s U.S. Land active fleet, all of which are AC drive rigs, are equipped with hydraulic pad systems. Our pad capable fleet is fully utilized. In addition, we continue to add new pad capable FlexRigs and have customer interest in additional pad drilling system upgrades for existing FlexRigs. |
| U.S. Land Safety Performance (2005 – Nov 2013) OSHA Recordable Injury Incidence Rates IADC w/o H&P = 1.79 H&P = 0.77 H&P MANHOURS = 18.0 MM MANHOURS WORKED (MM) INJURIES PER 200,000 MANHOURS Delivering Safety – H&P vs. Industry (IADC) |
| U.S. Land Average Daywork Margins(1) (1) Does not include the impact of early contract termination revenue. |
| Record Profits During Industry Slowdown ** NBR’s operating income corresponds to its U.S. Lower 48, U.S. Offshore, and Alaska business units. * PTEN’s operating income includes drilling operations in Canada. |
| Return on Equity * Including gains from the sale of investment securities and discontinued operations, H&P's corresponding ROE resulted in 17.8%. ** The corresponding ROE values for the selected companies exclude certain extraordinary, non-recurring charges. |
| Current Dividend Yields Source: Thomson Financial. Yields calculated as of market close on January 6, 2014. |
| Ten-Year Relative Shareholder Return Source: Thomson Financial as of January 6, 2014 |
| Land Drilling Market Valuations Source: Thomson Financial as of January 6, 2014. |
| End of Document |