
1
Third-Quarter Fiscal 2008 Earnings
July 24, 2008
July 24, 2008
James J. O'Brien, Chairman and Chief Executive Officer
Lamar M. Chambers, Sr. Vice President and Chief Financial Officer
Samuel J. Mitchell, Vice President and President, Ashland Consumer Markets
Eric N. Boni, Director, Investor Relations
Filed by Ashland Inc.
Pursuant to Rule 425
Under the Securities of 1933
Subject Company
Hercules Incorporated
Commission File Number 1-00496

2
Forward-Looking Statements
This presentation contains forward-looking statements, within the meaning of Section 27A of the Securities Act of 1933 and
Section 21E of the Securities Exchange Act of 1934. These statements include those made with respect to Ashland’s operating
performance and Ashland’s acquisition of Hercules Inc. These expectations are based upon a number of assumptions, including
those mentioned within this presentation. Performance estimates are also based upon internal forecasts and analyses of current
and future market conditions and trends, management plans and strategies, weather, operating efficiencies and economic
conditions, such as prices, supply and demand, cost of raw materials, and legal proceedings and claims (including
environmental and asbestos matters). These risks and uncertainties may cause actual operating results to differ materially from
those stated, projected or implied. Such risks and uncertainties with respect to Ashland’s acquisition of Hercules include the
possibility that the benefits anticipated from the Hercules transaction will not be fully realized; the possibility the transaction
may not close, including as a result of failure to obtain the approval of Hercules stockholders; the possibility that financing may
not be available on the terms committed; and other risks that are described in filings made by Ashland with the Securities and
Exchange Commission (SEC) in connection with the proposed transaction. Although Ashland believes its expectations are
based on reasonable assumptions, it cannot assure the expectations reflected herein will be achieved. This forward-looking
information may prove to be inaccurate and actual results may differ significantly from those anticipated if one or more of the
underlying assumptions or expectations proves to be inaccurate or is unrealized or if other unexpected conditions or events
occur. Other factors, uncertainties and risks affecting Ashland are contained in Ashland's periodic filings made with the SEC,
including its Form 10-K for the fiscal year ended Sept. 30, 2007, and Forms 10-Q for the quarters ended Dec. 31, 2007, and March
31, 2008, which are available on Ashland’s Investor Relations website at www.ashland.com/investors or the SEC’s website at
www.sec.gov. Ashland undertakes no obligation to subsequently update or revise the forward-looking statements made in this
presentation to reflect events or circumstances after the date of this presentation.
ADDITIONAL INFORMATION
In connection with the proposed transaction, Ashland and Hercules will be filing documents with the SEC, including the filing by
Ashland of a registration statement on Form S-4, and the filing by Hercules of a related preliminary and definitive proxy
statement/prospectus. Investors and security holders are urged to read the registration statement on Form S-4 and the related
preliminary and definitive proxy/prospectus when they become available because they will contain important information about
the proposed transaction. Investors and security holders may obtain free copies of these documents (when they are available)
and other documents filed with the SEC at the SEC’s web site at www.sec.gov and by contacting Ashland Investor Relations at
(859) 815-4454 or Hercules Investor Relations at (302) 594-7151. Investors and security holders may obtain free copies of the
documents filed with the SEC on Ashland’s Investor Relations website at www.ashland.com/investors or Hercules’ website at
www.herc.com or the SEC’s website at www.sec.gov.

3
Agenda
· 2008 fiscal third-quarter results and
fourth-quarter outlook
fourth-quarter outlook
· Cost structure efficiency update
· Hercules update
· Questions

4
(a) When adjusted for key items in 2007 as noted on Slide 6 of this presentation.
(b) Operating income, plus depreciation and amortization.
Fiscal Third Quarter 2008
Highlights
Highlights
· Operating income, excluding prior-year key items(a),
increased 19 percent over June 2007 quarter
increased 19 percent over June 2007 quarter
· Difficult demand and raw materials cost environment
· Operating income, as reported, compared
with June 2007 quarter:
with June 2007 quarter:
– Ashland Performance Materials down 44 percent
– Valvoline down 6 percent
– Ashland Water Technologies more than doubled
– Ashland Distribution up 70 percent
· EBITDA(b) increased by 3 percent to $121 million
· Continued reductions in operating-segment trade working
capital as a percent of sales
capital as a percent of sales
(in millions, except change)
* When adjusted for key items in 2007 as noted on Slide 6 of this presentation, operating income
percentage for the June 2007 quarter was 3.7 percent.
percentage for the June 2007 quarter was 3.7 percent.
Fiscal Third Quarter 2008
Preliminary Financial Results
Preliminary Financial Results
Fiscal Third Quarter
Key Items Affecting Operating
Income Comparisons
Key Items Affecting Operating
Income Comparisons
7
Factors Impacting Operating Income
($ millions)
5.6
1.1
Q3 2007
Volume/
Mix
Mix
Q3 2008
Currency
Translation
Translation
Margin
(2.1)
90.7
86.8
SG&A
Expenses
Expenses
(10.4)
1.9
Other
Q3 FY 2007 versus Q3 FY 2008
8
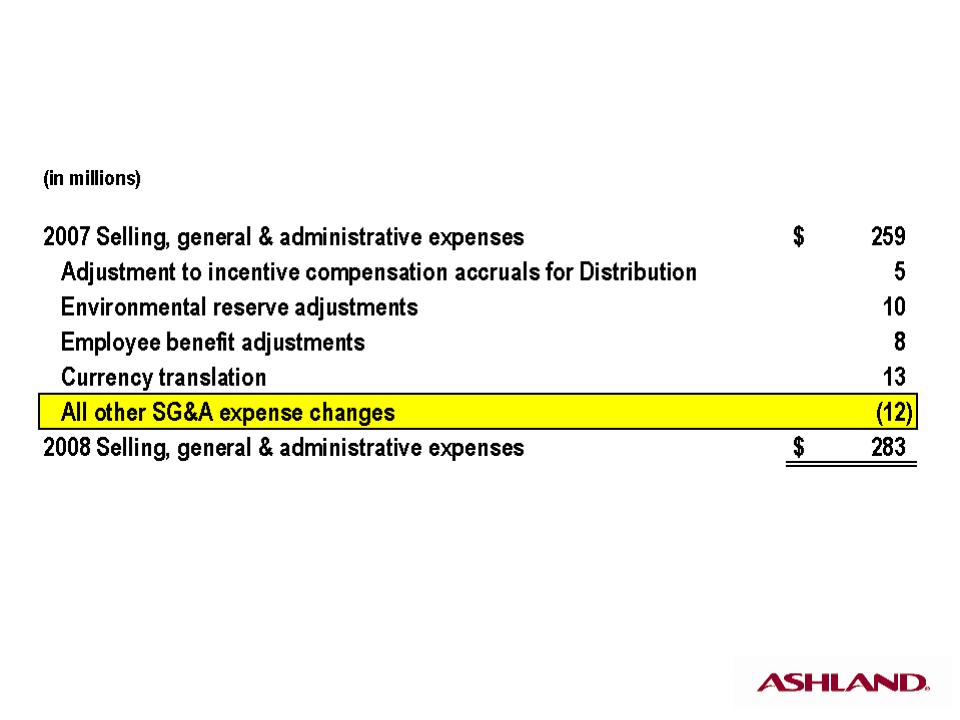
· All other selling, general and administrative expenses
declined $12 million, or 5 percent, versus 2007
declined $12 million, or 5 percent, versus 2007
Fiscal Third Quarter
Factors Impacting SG&A Variance
2008 vs. 2007
Factors Impacting SG&A Variance
2008 vs. 2007

Fiscal Third Quarter 2008
Preliminary Diluted Earnings Per Share
Preliminary Diluted Earnings Per Share
Fiscal Third Quarter 2008
Components of Preliminary EPS
Components of Preliminary EPS

(a) Excludes changes resulting from operations acquired or sold.
(b) Operating income, plus depreciation and amortization.
Fiscal Third Quarter 2008
Operating Cash Flows
Operating Cash Flows
Operating Segment
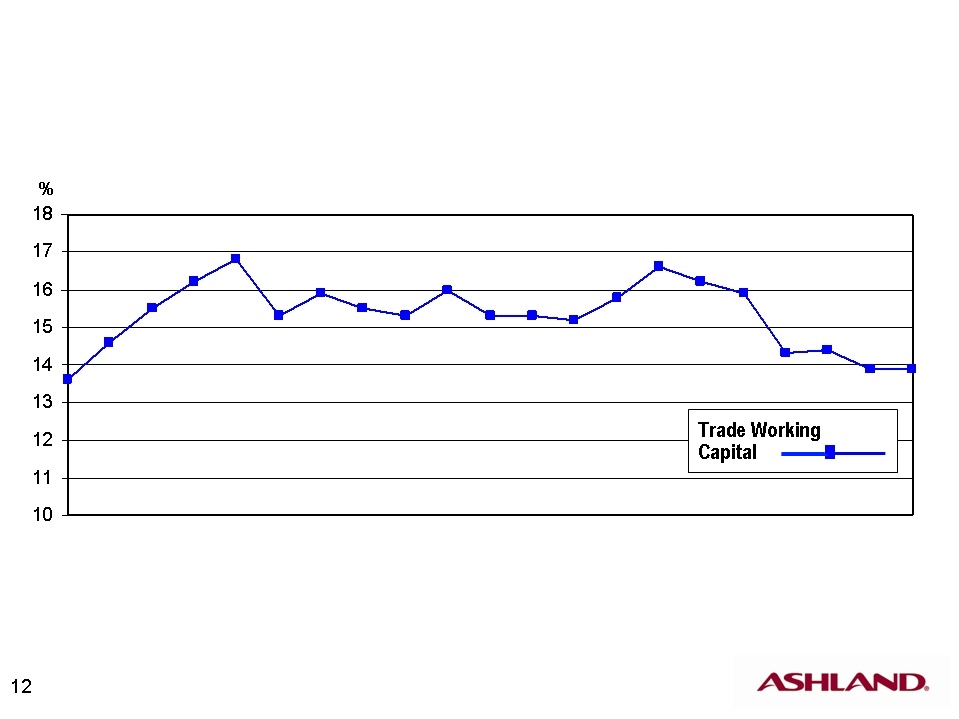
Trade Working Capital
Trade Working Capital
Operating Segments - Accounts Receivable, Inventories Excluding LIFO Reserve,
and Trade and Other Payables, Net, as a % of Trailing Three Months' Sales, Annualized*
* Excludes acquisitions made in June 2008 quarter.
Oct.
'06
'06
Dec.
'06
'06
March
'07
'07
June
'07
'07
Sept.
'07
'07
Dec.
'07
'07
March
'08
'08
June
'08
'08
(in millions, except percentages)
2008
Sales & Operating Revenues
2007
Pounds/Day
Gross Profit as a % of Sales
· Continued softness in North American residential construction
and transportation markets
and transportation markets
· Good growth in Asia and Brazil
· Europe also shows growth over prior year
Quarter Ended June 30,
Selling, General & Admin. Costs
Fav./(Unfav.)
Operating Income
Fiscal Third Quarter 2008
Performance Materials
Performance Materials
14
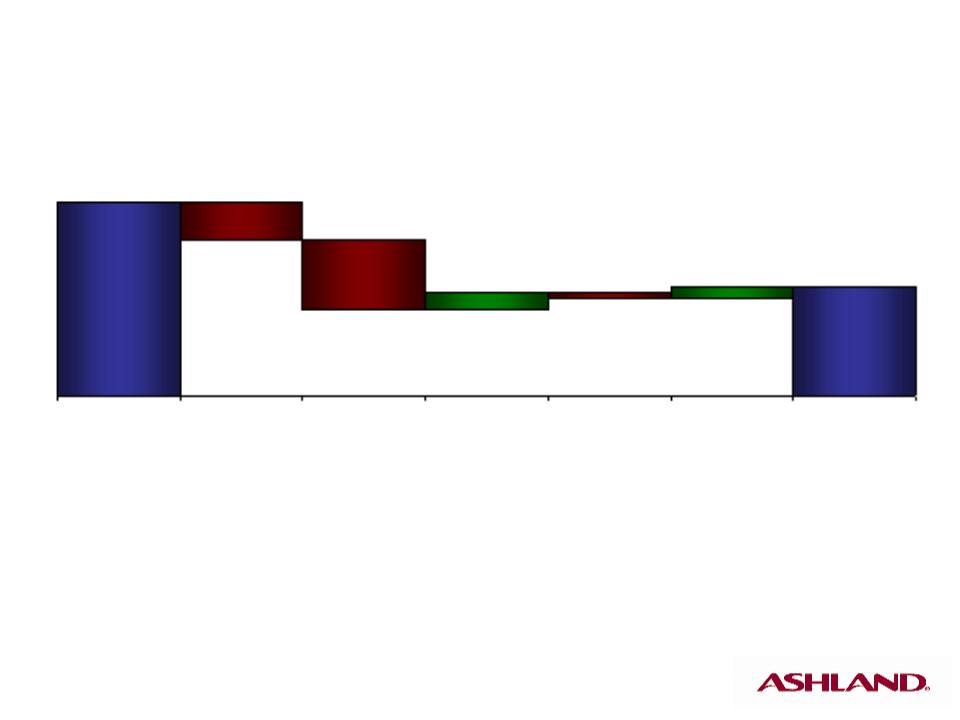
Performance Materials
Factors Impacting Operating Income
Factors Impacting Operating Income
($ millions)
3.1
(6.4)
Q3 2007
Volume/
Mix
Mix
Q3 2008
Currency
Translation
Translation
Margin
(12.1)
33.3
18.8
SG&A
Expenses
Expenses
(0.9)
Other
1.8
· Margin decline largely due to unrecovered raw material cost
increases in Composite Polymers
increases in Composite Polymers
Q3 FY 2007 versus Q3 FY 2008
(in millions, except percentages)
2008
Sales & Operating Revenues
Operating Income
2007
Pounds/Day
Gross Profit as a % of Sales
· Average unit selling price prices increased 14 percent,
while unit gross profit increased 24 percent
while unit gross profit increased 24 percent
· Selling, general and administrative expenses, excluding
one-time adjustments in 2007 and currency translation,
increased only 3 percent
one-time adjustments in 2007 and currency translation,
increased only 3 percent
Quarter Ended June 30,
Selling, General & Admin. Costs
Fav./(Unfav.)
Fiscal Third Quarter 2008
Distribution
Distribution
16
Distribution
Factors Impacting Operating Income
Factors Impacting Operating Income
($ millions)
17.8
Q3 2007
Currency
Translation
Translation
Margin
Q3 2008
Volume/
Mix
Mix
SG&A
Expenses
Expenses
(3.2)
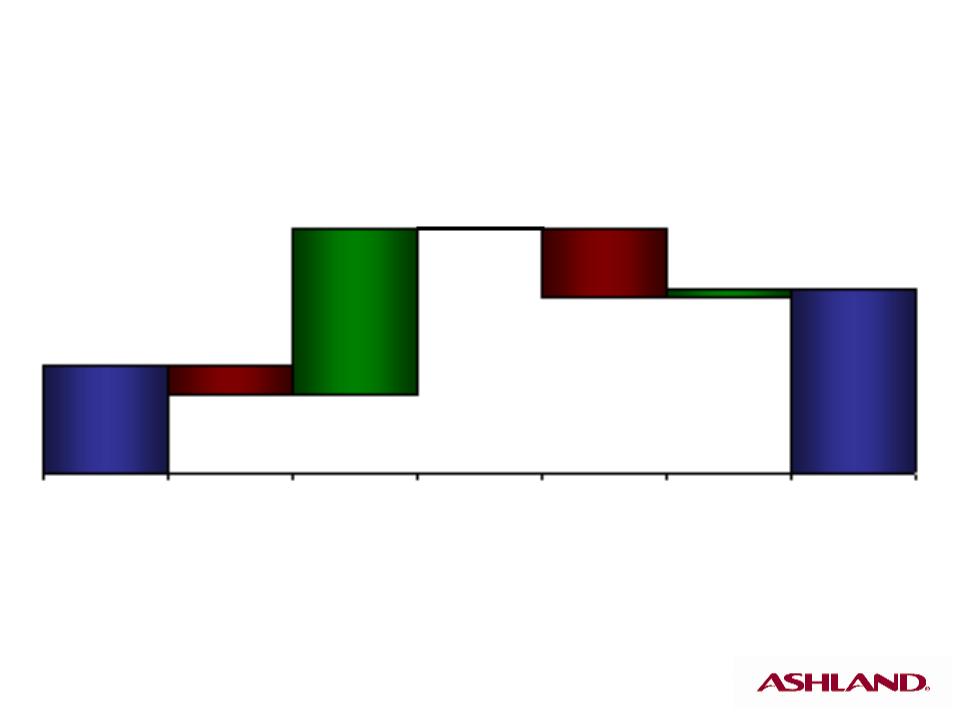
11.6
0.6
Other
(7.2)
0.1
19.7
Q3 FY 2007 versus Q3 FY 2008
$MM
N. American
plastics
contract
terminated*
plastics
contract
terminated*
* First full quarter of impact.
Distribution
Operating Income Trend
Operating Income Trend
(in millions, except percentages)
· Excluding currency translation and other adjustments for
comparability:
comparability:
– Sales increased 9 percent
– SG&A expenses increased 0.5 percent
2008
Sales & Operating Revenues
Operating Income
2007
Fav./(Unfav.)
Gross Profit as a % of Sales
Quarter Ended June 30,
Selling, General & Admin. Costs
Fiscal Third Quarter 2008
Water Technologies
Water Technologies
19
Water Technologies
Factors Impacting Operating Income
Factors Impacting Operating Income
($ millions)
1.5
8.7
Q3 2007
Sales/Mix
Q3 2008
Currency
Translation
Translation
Margin
(2.2)
6.0
12.5
SG&A
Expenses
Expenses
(1.5)
Other
0.0
Q3 FY 2007 versus Q3 FY 2008
· Have experienced solid organic revenue growth
· Beginning to see benefits of cost structure
changes/discipline
changes/discipline
· Still feeling pressure of raw material increases
on margins
on margins

20
Water Technologies
Action Items
Action Items
· Fix operating issues
– Reduced negative impact of invoice accuracy issue
· Improve pricing process
– Announced price increases in June
· Reduce cost structure
– Annualized run-rate savings of $8 million
– $1 million benefit to Q3 earnings
· Improve supply chain
– Renegotiated major raw material contracts
with $3.5 million savings
with $3.5 million savings
· Align rewards and metrics
– Incentive plans for leadership now mirror other Ashland plans
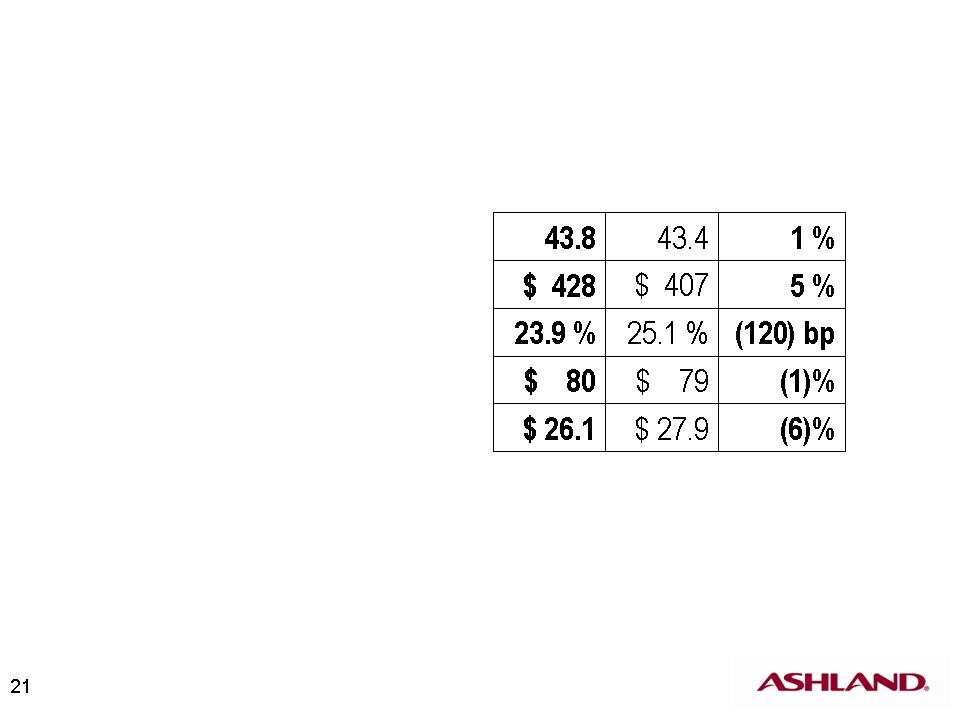
(in millions, except percentages)
· Operating income decreased in installer and Do-It-Yourself channels
· Operating income increased in all other channels
2008
Sales & Operating Revenues
Operating Income
2007
Lubricant Gallons
Gross Profit as a % of Sales
Quarter Ended June 30,
Selling, General & Admin. Costs
Fav./(Unfav.)
Fiscal Third Quarter 2008
Valvoline
Valvoline
22
($ millions)
· Margin decrease driven by higher raw material costs
· SG&A decreased due primarily to lower advertising and travel and
entertainment costs
entertainment costs
Q3 2007
Volume/
Mix
Mix
Q3 2008
Currency
Translation
Translation
Margin
SG&A
Expenses
Expenses
Q3 FY 2007 versus Q3 FY 2008
27.9
2.0
(5.6)
0.9
1.4
26.1
(0.5)
Other
Valvoline
Operating Income Performance Factors
Operating Income Performance Factors

23
Valvoline
Current Market Conditions
Current Market Conditions
· Significant increases in raw material costs
– Base oil increases announced May through July
of approximately 36 percent
of approximately 36 percent
– Additives increases announced May and July
of approximately 28 percent
of approximately 28 percent
· Base oil market remains fairly tight
despite increases in global Group II production
despite increases in global Group II production
· Lubricant demand in U.S. market
below our long-term forecast
below our long-term forecast
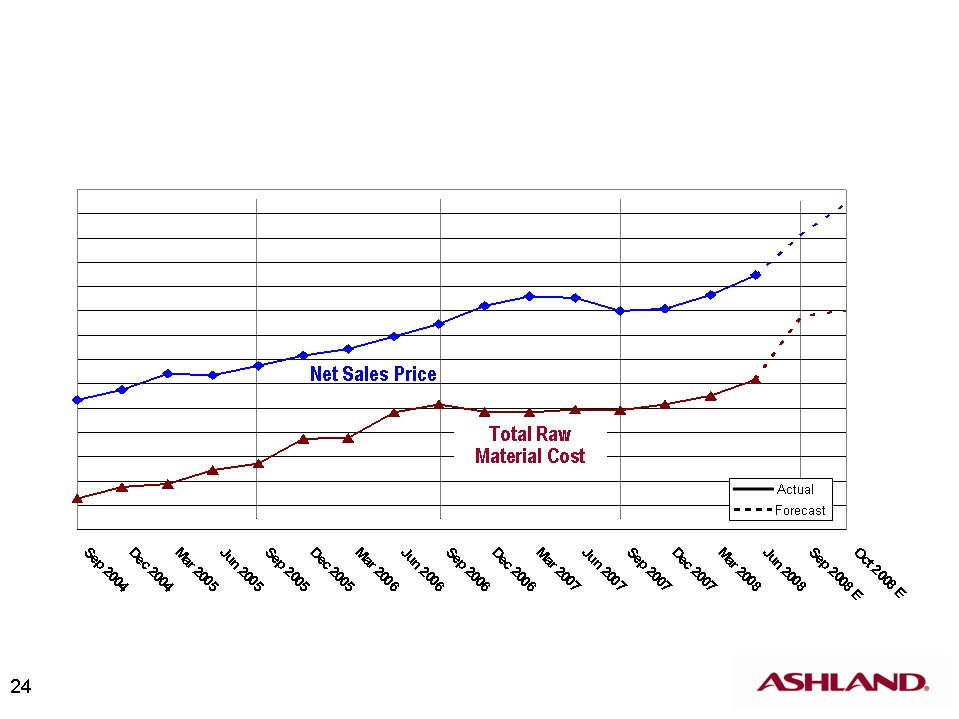
$/gal
Valvoline U.S. Branded Lubricants Line of Business
Valvoline
Price vs. Cost Increases
Price vs. Cost Increases

Progress on cost structure efficiency
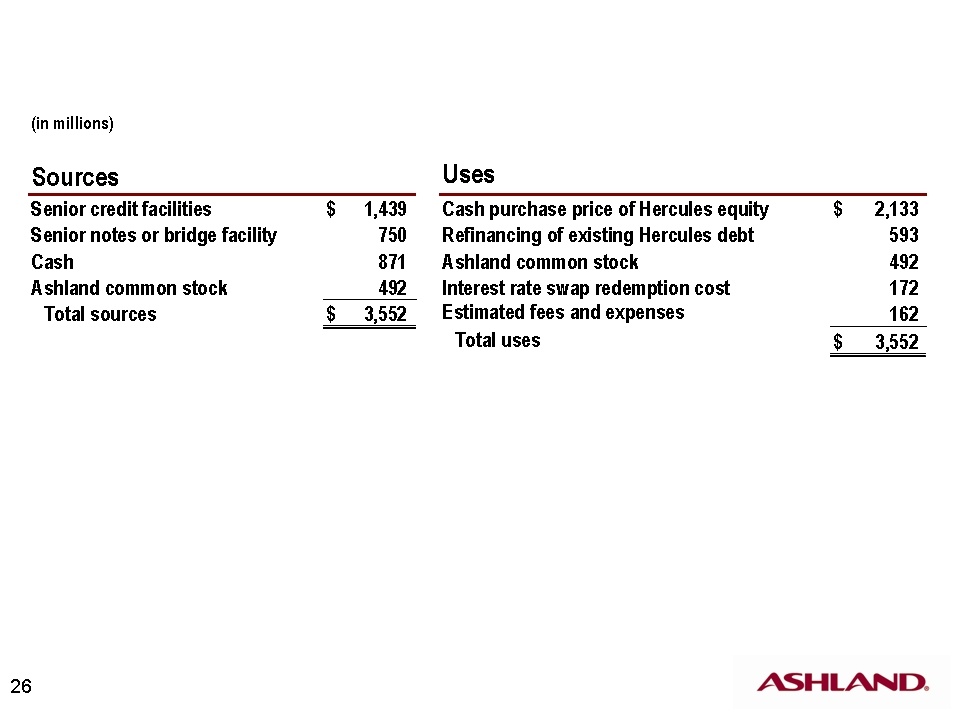
· Ashland common stock based on exchange rate of 0.093 share
for each share of Hercules and consideration will fluctuate
for each share of Hercules and consideration will fluctuate
· Blended interest expense of approximately 7.25 percent to 7.50 percent
· Cash includes Ashland's and Hercules' cash on hand at closing
and Hercules' option proceeds
and Hercules' option proceeds
· Estimated fees include debt initiation, legal, and investment banker fees
Source: Ashland Inc. Form 425 filing dated July 14, 2008
Hercules Update
Estimated Sources and Uses of Funds
Estimated Sources and Uses of Funds

27
Hercules Update
Additional Transaction Details
Additional Transaction Details
· Internal rate of return (IRR) comfortably exceeds
estimated weighted-average cost of capital (WACC)
of 8.5 percent to 9.0 percent
estimated weighted-average cost of capital (WACC)
of 8.5 percent to 9.0 percent
· Implied transaction multiple at lower end of range
for comparable transactions
for comparable transactions
· Transaction to result in $120 million (current estimate)
of annual transactional depreciation and amortization
of annual transactional depreciation and amortization
– Estimated ongoing diluted EPS impact
of approximately $1 per share
– Excluding transactional D&A, acquisition expected to be
significantly accretive to EPS in Year 1
significantly accretive to EPS in Year 1

28
Hercules Update
Additional Transaction Details
Additional Transaction Details
· $175 to $200 million estimated gross interest
expense in Year 1
expense in Year 1
– Ashland interest income significantly reduced
· Ashland common stock outstanding increases
to approximately 75 million shares
to approximately 75 million shares
· Due to Hercules' foreign tax credit carryover,
combined entity expected to benefit from
lower effective cash tax rate first five years
following close
combined entity expected to benefit from
lower effective cash tax rate first five years
following close

29
Sales/Mktg.
Manufacturing
Purchasing
~2 5%
Manufacturing
Purchasing
~2 5%
Sales/Mktg.
Manufacturing
Purchasing
~2 5%
Manufacturing
Purchasing
~2 5%
G&A
~75%
~75%
G&A
~75%
~75%
· Integration team to target
$30 million to $70 million
additional synergies, including:
$30 million to $70 million
additional synergies, including:
– Ashland Water Technologies
and Hercules Paper
Technologies & Ventures
commercial efficiencies
and Hercules Paper
Technologies & Ventures
commercial efficiencies
– Additional supply chain and
back office savings
back office savings
– Cross-selling of Ashland Water
products to paper customers
products to paper customers
Hercules Update
Synergies and Integration Costs
Synergies and Integration Costs
· $50 million initial estimate
– Basis for acquisition economics
– Run-rate savings by Year 3
– Estimated phasing (run rate)
· Year 1: 60 percent
· Year 2: 90 percent
· Year 3: 100 percent
· Estimated one-time integration
costs of $55 million to $60 million
costs of $55 million to $60 million

30
Hercules Update
Merger Agreement and Financing
Commitment Summary
Merger Agreement and Financing
Commitment Summary
· Merger agreement and financing commitments
filed July 14, 2008
filed July 14, 2008
· Financing commitment
– Reverse break-up fee
· Conditions precedent to closing include:
– Form S-4 declared effective by SEC
– HSR/EU approvals under antitrust laws
– Hercules shareholder approval (2/3rds vote)
– True and correct representations and warranties

31
Hercules Update
Anticipated Timing
Anticipated Timing
· Late July: HSR filing
· Early August: Form S-4 filing with SEC
· Late September: S-4 declared effective by SEC
· Late October/early November:
Hercules shareholder meeting
Hercules shareholder meeting
· Closing intended within five days after
shareholder approval
shareholder approval

32
Questions?
ASHLAND Q3 2008 Earnings Conference Call
July 24, 2008
CORPORATE PARTICIPANTS
| ▪ | Eric Boni | Ashland Inc. |
| Director, IR | ||
| ▪ | Jim O'Brien | Ashland Inc. |
| Chairman and CEO | ||
| ▪ | Lamar Chambers | Ashland Inc. |
| SVP and CFO | ||
| ▪ | Sam Mitchell | Ashland Inc. |
| VP and President, Ashland Consumer Markets |
CONFERENCE CALL PARTICIPANTS
| ▪ | Jeff Zekauskas | JPMorgan |
| Analyst | ||
| ▪ | Laurence Alexander | Jefferies & Co. |
| Analyst | ||
| ▪ | Rob Felice (ph) | Bellian Company |
| Analyst | ||
| ▪ | Steve Velgot | Susquehanna Financial Group |
| Analyst | ||
| ▪ | Mike Sison | Key Banc Capital Markets |
| Analyst |
PRESENTATION
Operator: Good day, ladies and gentlemen, and welcome to the third quarter 2008 Ashland earnings conference call. My name is Eric and I will be your audio coordinator for today. Now, at this time all participants are in listen-only mode. We will facilitate a question and answer session towards the end of the conference.
(OPERATOR INSTRUCTIONS)
(OPERATOR INSTRUCTIONS)
I would know like to turn your presentation over to Mr. Eric Boni, Director of Investor Relations for Ashland. Please proceed.
Eric Boni - Ashland - Director, IR - - Thank you, Eric. Good morning and welcome to Ashland's third quarter fiscal 2008 conference call and web cast. We released our third quarter results at 8:00 eastern daylight time today. These results are preliminary until we file our 10-Q in August.
Our speakers here today are Jim O'Brien, Ashland's Chairman and Chief Executive Officer; Lamar Chambers, Senior Vice President and CFO; and Sam Mitchell, President of Ashland Consumer Markets.
On slide 2 we provide our cautionary language regarding forward-looking statements. Statements made during the course of this presentation that constitute forward-looking statements, as that term is defined in relevant securities law. Ashland believes its expectations regarding it's operating performance and the Hercules transaction are based on reasonable assumptions, but cannot assure those expectations will be achieved. Therefore, any forward-looking statements may prove to be inaccurate. You will also see the mandatory additional information we must provide in connection with the proposed acquisition of Hercules.
Please turn to slide 3. Before we get started, I will give you an outline of the call. First we will review Ashland's overall results and then get into the specifics of our businesses including a more in depth review of Valvoline by Sam Mitchell. We will then discuss our progress on cost structure initiatives and conclude our prepared remarks with an update on the Hercules transaction. After that we will take your questions.
Let's go to our third quarter highlights on slide 4. Ashland's overall results for our 2008 third fiscal quarter were solid, with operating income increasing 19% on an apples to apples basis, versus the June 2007 quarter which included certain key items I'll talk about shortly. In aggregate, Ashland's volume was down several percentage points and we experienced approximately $80 million of raw material cost increases during the quarter. We will discuss our plans to recover these costs later in the presentation.
In light of the difficult economic environment, we are encouraged by our performance in the quarter. Ashland Performance Materials was most affected by these macro-economic factors and reported a 44% decline in operating income. Valvoline's results were also affected by rapidly rising raw material costs which outpaced price increases leading to a 6% decline in operating income versus the year ago quarter. On a sequential basis, Valvoline's operating income did improve over March quarter earnings, benefiting from the traditionally strong summer driving season. Ashland Water Technologies improved its results for the June quarter, although they were enhanced by certain items that are unlikely to repeat going forward. We are encouraged by Ashland Distribution's performance in the quarter as its continued focus on margin improvement led to a 70% increase in operating income versus the June 2007 quarter.
Quarter just ended also marked the third consecutive quarter in which distribution increased its income sequentially. It is particularly worth noting that we increased our EBITDA by 3%, versus a year ago quarter, to $121 million. Also, our focus on working capital continues to show results. We achieved an additional 46 basis point reduction sequentially in our operating segment trade working capital as a percentage of sales, excluding the effective acquisitions.
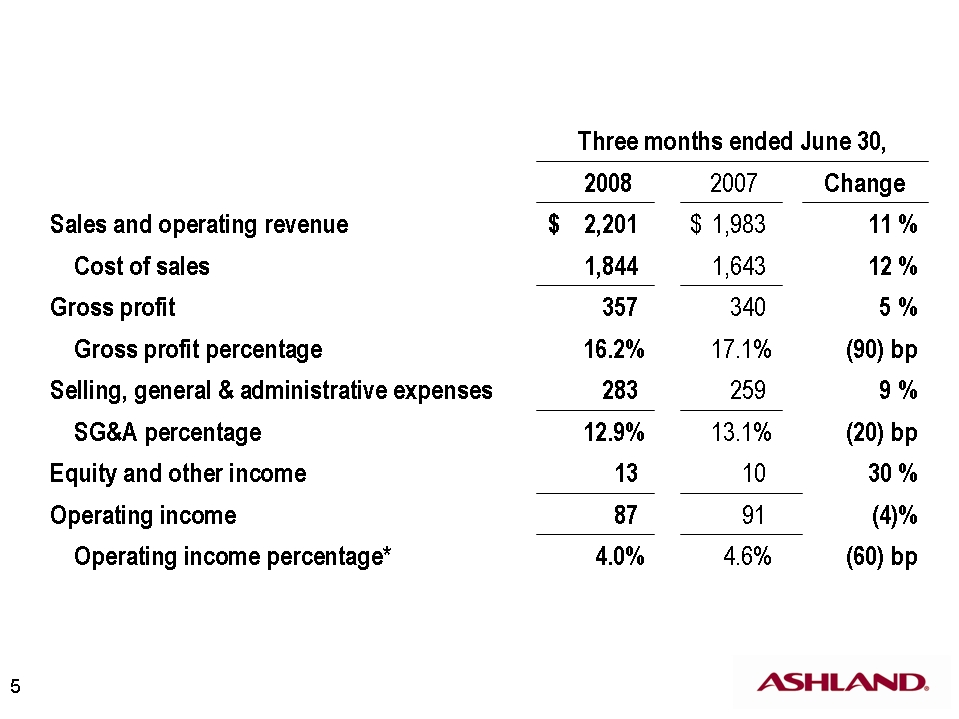
Now let's turn to the financial results on slide 5. Revenues increased 11% to $2.2 billion in the third quarter of 2008 driven by significant price increases versus the year ago quarter. Four percentage points of the increase were attributable to currency translation. Cost of sales increased at a slightly faster pace, going up 12%. Gross profit dollars increased by $17 million, or 5%, although our gross profit percentage was down 90 basis points. Selling, general and administrative expenses grew 9%, versus the 11% increase in sales, resulting in a 20 basis point reduction in SG&A as a percentage of sales. Approximately five percentage points of this increase were due to currency translation. We will discuss the increase in SG&A in more depth shortly.
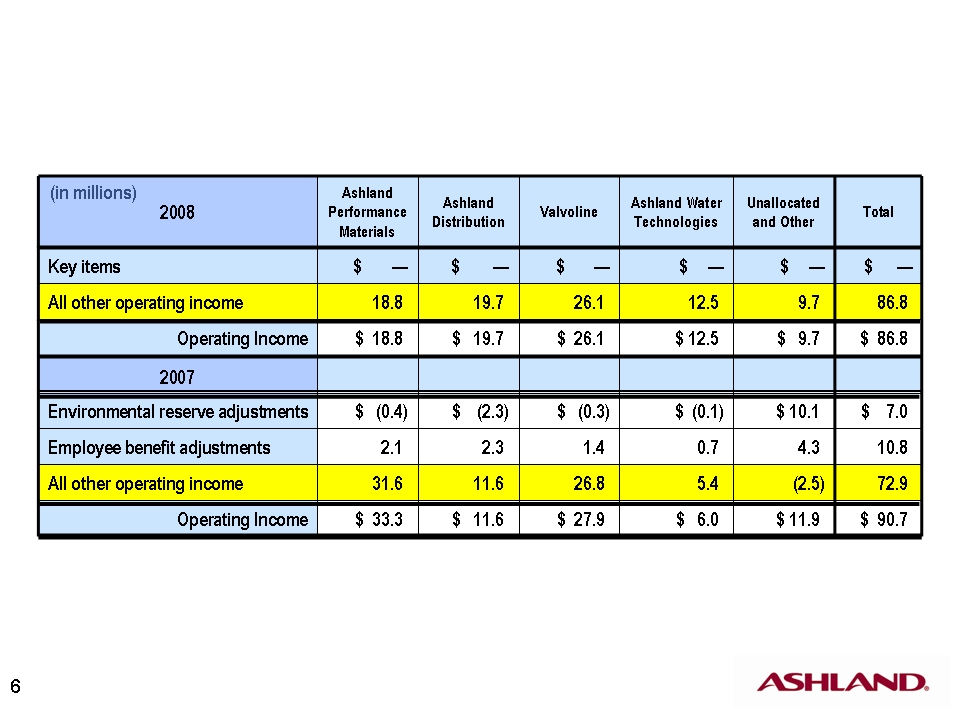
Our reported operating income declined 4% versus year ago quarter, but as I mentioned earlier, when key items in the June 2007 quarter are excluded, operating income increased 19%. Please turn to slide 6 to see the key items affecting our operating income. This chart summarizes our operating income by segment, versus the same quarter last year, and shows the impact of key items on operating income. In 2007, each of our businesses was impacted to some degree by unusually large environmental reserve and employee benefit income adjustments. The yellow "all other operating income" line for 2007, therefore, represents our underlying performance. While we also had these types of items in 2008, they were at historical levels and do not warrant specific adjustment and thus the "all other operating income" and "operating income" lines are identical. On a comparable basis, "all other operating income" increased by $13.9 million, or 19%, versus the year ago June quarter, with a combined $15.2 million improvement in Distribution and Water Technologies as well as a $12.2 million improvement in our "unallocated and other" line, more than offsetting the $12.8 million decline in Performance Materials. We will discuss the operating income performance of each of our businesses in detail later.
Let's move to slide 7 to look at Ashland's income bridge. Operating income declined by nearly $4 million to $86.8 million in the June 2008 quarter, as compared with the year ago quarter. Currency translation contributed positively to the quarter by $5.6 million. Volume had a $1.1 million positive impact to earnings as increases in Water and Valvoline businesses offset volume declines in Performance Materials and Distribution. Similarly, significant margin increases in Distribution were offset by margin declines in our other businesses. SG&A increased by $10.4 million, excluding currency impacts.
Let's turn to slide 8 for more detail on the SG&A. Reported 2008 third quarter SG&A increased by $24 million, versus the same prior year quarter on an as reported basis. $5 million of this increase was attributable to adjustments to incentive accruals in the Ashland Distribution business. Additionally, certain portions of the environmental reserve and employee benefit adjustments noted on slide 6 were included in the SG&A line and total $18 million. When taken into account with the $13 million in currency translation, all other SG&A expenses declined by $12 million, or about 5%, versus the year ago quarter.
Now please turn to slide 9 for a review of our preliminary earnings per share chart. Looking at this chart, you will see that net interest and other financing income for the third quarter declined by $4 million. This primarily reflects lower interest rate on Ashland cash and securities. Income taxes increased by $12 million, giving us an effective tax rate of 29.4% in the June 2008 quarter, versus 15% in the 2007 quarter. The tax rate for both periods included the net favorable effect of adjustments to the estimated annual tax expense. In the unusually low 15% effective tax rate in the year ago quarter also reflected favorable developments with respect to settlements of certain tax matters. Discontinued operations in both periods include net favorable adjustments to asbestos reserves, primarily to related insurance receivables, of $6 million in 2008 and $16 million in 2007, as well as other smaller items. On a reported basis, our earnings per share from continuing operations amounted to $1.03 as compared with $1.35 in the year earlier quarter.
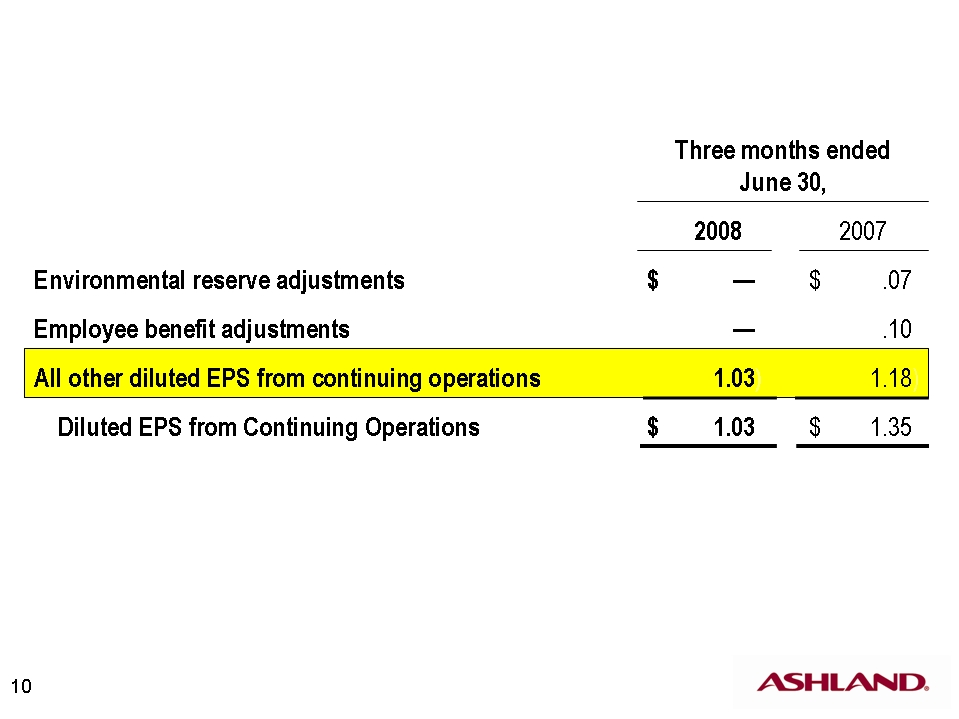
Let's go to slide 10 to see our EPS on an adjusted basis. When the previously mentioned key items are excluded from the prior period, our diluted earnings per share from continuing operations for the June 2008 quarter were $1.03 as compared with $1.18 in the June 2007 quarter.
Let's turn to slide 11 for a review of our cash flows. Ashland generated positive operating cash flows after capital expenditures of $75 million in the June 2008 quarter, an increase of $20 million, or 36%, versus the prior year quarter. This brings total year-to-date cash generated to $216 million, versus a use of cash of $94 million through nine months last year. This dramatic increase of more than $300 million is a direct result of our increased focus on working capital management throughout the company. EBITDA for the June 2008 quarter increased by $4 million, or 3%, over the year ago quarter.
Please turn to slide 12 for a more in-depth look at our trade working capital. Our internal benchmark of operating segment trade working capital to sales decreased sequentially by nearly one half of 1% of annualized sales in the June quarter, excluding the impact of working capital added through acquisitions. We continue to make progress on managing inventories, reducing them by an additional 61 basis points, versus the end of the March quarter. All of our businesses contributed to this improvement with Water Technologies' especially note-worthy reduction of more than 350 basis points in one quarter. We are starting to realize a reduction in our account receivable as a percentage of sales in all of our businesses, most notably in the Valvoline organization. However, we have not achieved the hoped for progress in increasing our payables as a percentage of sales. We are continuing to focus on ways to improve this metric.
Overall, we are pleased with our progress and look forward to achieving further reductions in the working capital requirements of our businesses.
Now I'd like to turn the presentation over to Lamar Chambers to discuss the performances of our businesses. Lamar.
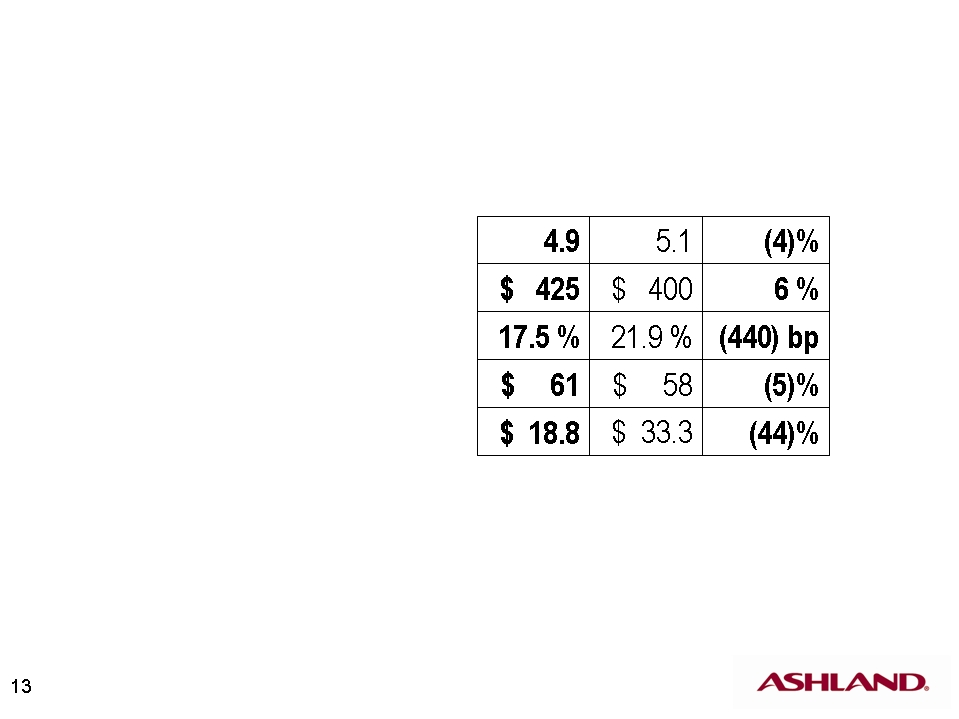
Lamar Chambers - Ashland - SVP and CFO - Thank you, Eric, and good morning, everyone. Let's turn to slide 13 to look at the results of our Ashland Performance Materials business. Volume per day declined 4% as compared with the year ago quarter, including a greater than 10% reduction in volume in the Americas, primarily in our Composite Polymers business. As you're well aware, the US residential construction and transportation markets continue to struggle, impacting volumes in our larger market. Sales of larger vehicles, such as SUVs and pickup trucks, disproportionately affect Performance Materials, particularly the Composite Polymers unit. The precipitous drop-off in large vehicle sales has had a real impact on our recent performance.
That said, we continue to experience significant growth in Asia, with a nearly 30% increase in volume versus the prior year. Asia now represents nearly 9% of total volume. We also continue to achieve some volume growth in Europe, albeit at reduced levels, primarily the result of strong growth in our Casting Solutions unit.
Additionally, our premium business, such as our [Duricane] and Hetron Resins, which are sold into markets such as infrastructure and energy, continues to generate strong margins and provides some underlying stability for our profitability.
Sales and operating revenues increased by 6% to $425 million, as currency translation and price increases helped offset reduced volume. The lag in achieving price increases is the primary cause of our reduction in gross profit percentage. We've also been targeting lower-margin business to help recover some of the volume lost, due to our customers' reduced production, which is also contributing to the gross profit percentage reduction.
Selling, general and administrative increased 5%, versus the year ago quarter, but when adjusted for foreign currency translation, SG&A increased by only approximately 1%, a direct result of severance charges related to our cost structure efficiency initiatives. Overall, operating income fell by 44%, primarily result of reduced margins. Increases in Casting Solutions income were offset by significant reductions in our Composite Polymers unit.
Now, let's go to slide 14 to review the components of our change in operating income for Performance Materials. Volume reductions accounted for roughly $6 million of the operating income decline in the quarter. Margin pressures in the quarter were more pronounced and accounted for $12 million of the decline and operating income, as compared with the June 2007 quarter. As raw material costs have increased, we have only been able to recover approximately 80% of the increases, thus far. However, we have announced price increases for July and August, but do not expect to fully recover the raw material increases until about the end of the September quarter. As a result of these factors and the normal seasonality of the business, we expect Performance Materials' operating income to be down significantly, versus the June 2008 quarter. We do, however, expect some upside earnings potential from the significant cost structure improvements underway, which we will discuss further in a few minutes.
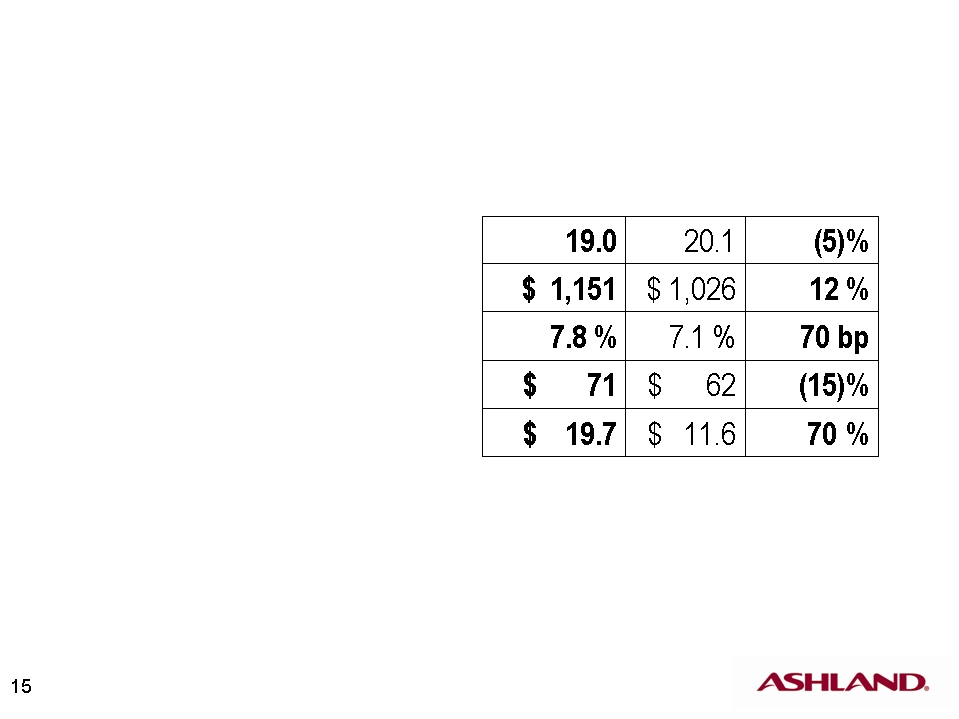
Let's turn to slide 15 for a look at our Distribution business. Distribution's volume per day declined 5%, versus the year ago quarter. Note that this is the first quarter that we do not have an impact on the quarter over quarter comparisons from the terminated DOW Plastics contract in North America. Meanwhile, sales increased by 12% to nearly $1.2 billion. Gross profit is significantly improved, both on percentage basis and in absolute dollars, and was a primary contributor to the 70% improvement in operating income. While SG&A increased by 15% over the 2007 quarter, as we noted previously, the prior year was unusually low due to adjustments to incentive accruals. Excluding those adjustments and the effect of currency translations, SG&A increased only 3%.
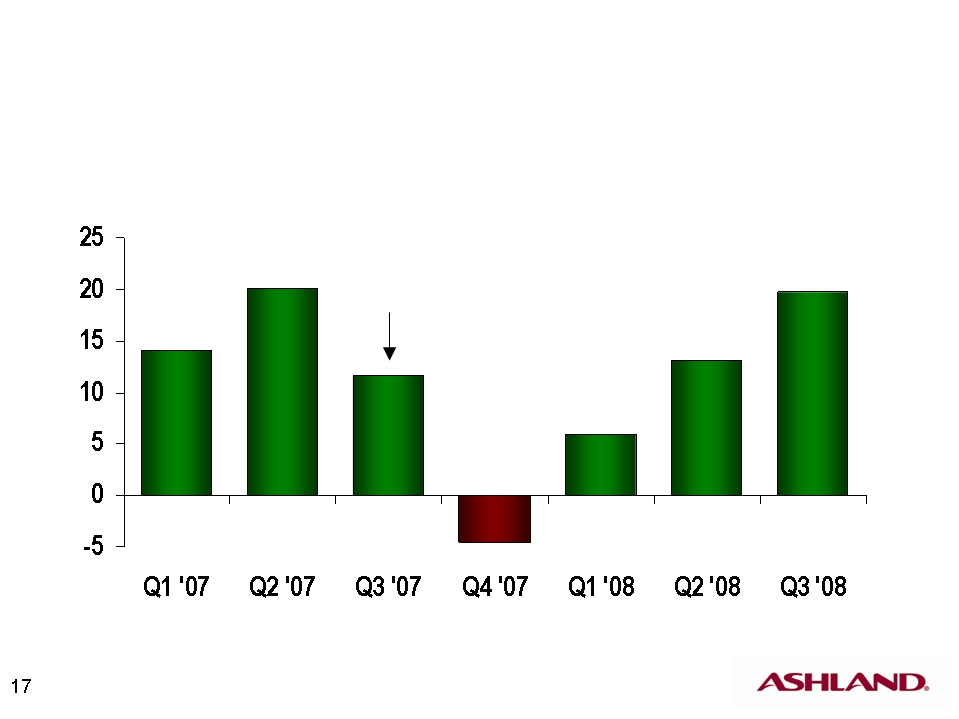
Let's turn to Distribution's income on slide 16. The margin improvement that you see here was broad-based with all of our US business units and Distribution contributing to the increase. Let's take a look at the trends. In Distribution's recent operating income performance, as you can see on slide 17, the June quarter represents the third consecutive quarter of operating income improvement and we have fully recovered from the impact of the terminated North American plastic supply contract. The business has demonstrated its ability to quickly recover product cost increases. Our new pricing process, which focuses on a more disciplined, centralized price-book approach to cost recovery, is helping to drive these improvements. We are counting on further improvements in this area to help us achieve our targeted 3% operating income margins for Distribution.
While we are reasonably pleased with Distribution's results for the June quarter, considering the difficult market conditions, we recognize that there is more to do, and continue to focus on improving this business's margins, and reducing working capital requirements. Distribution's fourth quarter performance will continue to be affected by weakness in North American industrial output. That said, we expect to significantly improve our results, verses the weak fourth quarter last year, although it is unlikely that we will achieve another sequential quarterly increase due primarily to seasonality.
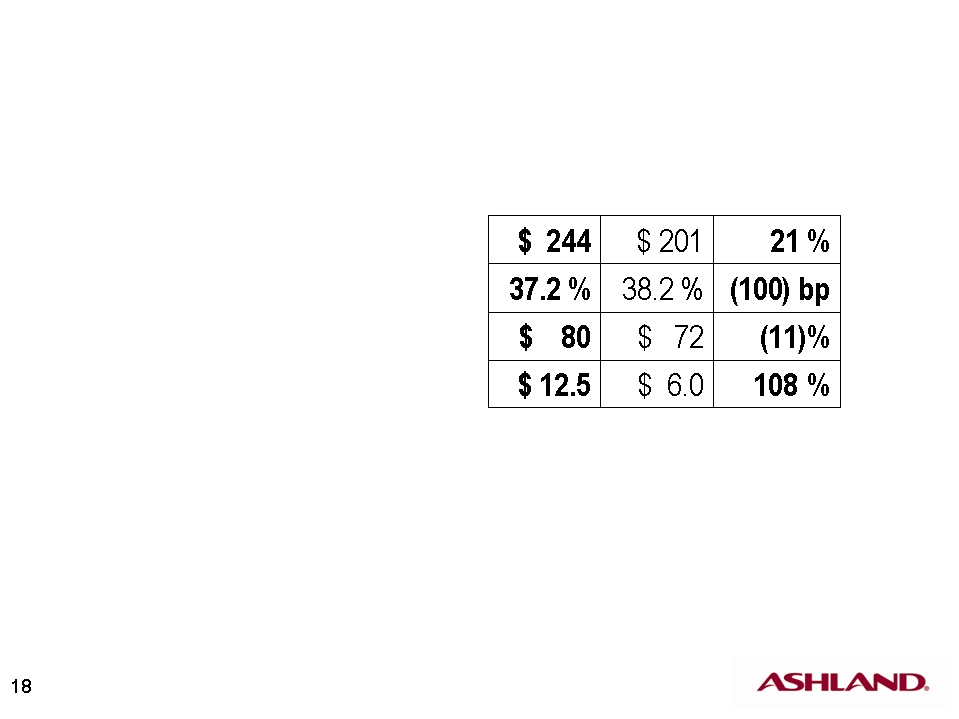
With that, let's turn to slide 18 and our Water Technologies business. Sales and operating revenues increased by 21%, or approximately 9%, excluding the impact of foreign currency translation and a transfer of certain sales from Performance Materials to Water Technologies. Water Technologies more than doubled operating income to $12.5 million in the June 2008 quarter, which benefited by $5 million from the completion of certain large sales contracts and from favorable adjustments estimated liabilities. These items are not expected to repeat going forward. While SG&A was unfavorable by $8 million to the previous year quarter, when adjusted for comparability, SG&A increased by only one half of 1%.
Please turn to slide 19 to look at the factors impacting Water Technologies' operating income. Continued strong organic revenue growth drove the operating income increase in the quarter. We were also starting to realize benefits of our cost structures initiatives, as SG&A had only $1.5 million negative impact on the operating income comparison. As you may recall in the second quarter, SG&A expenses were a negative $9.4 million on the comparable income bridge.
The business continues to feel raw material cost pressure, particularly on its hydrocarbon-based inputs. Our price increases announced in June should fully offset raw material cost increases announced for the fourth quarter, and we should be able to start increasing gross profit percentage closer to historical levels.
Please turn to slide 20 for an update on the action items to improve profitability that we talked about in our March quarter conference call. As you will recall, we discussed five specific action items to improve the profitability of Water Technologies. We have made good progress in the quarter. The first item was to fix certain operating issues concerning invoice accuracy and the sales of products manufactured in Germany and sold to customers and affiliates outside the European Union. We experienced an improvement in invoice accuracy during the quarter, with a $600,000 expense reduction, compared with the March quarter. We have also begun selling and sourcing products in local geographies, where financially viable, to reduce the impact profitability of currency swings.
We have experienced some improvement in our pricing process and are currently implementing our June increases of 10% to 30%, depending on the product line. We reduced our cost structure by $8 million on annualized run rate-basis. This includes the termination of consulting arrangements related to our business redesign work, reductions in travel and entertainment, and the elimination of 11 sales positions in the Americas through attrition. These positions will not be replaced. All of these cost structure reductions produced $1 million in additional income in the June quarter. We were able to renegotiate several raw material contracts during the quarter as well, which should produce an annualized run-rate savings of approximately $3.5 million.
Finally, we have restructured the incentive plans for Water Technologies' leadership to aline with those of our other businesses. We continue to press forward with these action items and our commitment to making these improvements is not altered by the pending Hercules transaction.
With that, I'll turn the proceedings over to Sam Mitchell, President of our Valvoline business. Sam.
Sam Mitchell - Ashland - VP and President, Ashland Consumer Markets - Thank you Lamar. I appreciate the opportunity to update everyone on the Valvoline business. Looking at slide 21, we increased lubricant volume by 1% over the prior year quarter. We believe the overall market declined more than 4% during the same period. Our comparatively strong performance is a result of growth in our large national account business, in our Do-It-For-Me -- or DIFM -- channel and strong marketing plan execution in our DIY channel.
Sales and operating revenues have increased 5%, primarily from price increases. Gross profit as a percent of sales declined by 120 basis points, the result of both higher selling price and lower unit margin, as raw material cost climb rapidly throughout the quarter. Business in both our DIY and DIFM installer channels experienced margin declines due to the lag effect of pricing increase implementation, following the impact of cost increases. The other channel within our DIFM market is our Valvoline Instant Oil Change unit which grew operating income by 3%. (inaudible) our businesses posted solid results in a challenging environment, generating $26 million of operating income in the quarter, a 6% decline versus the prior year quarter.
Let's look at slide 22. The operating income decline in the quarter was a result of margin decreases given by the time-lag between our receipt of raw material cost increases and the full implementation of price increases into the marketplace. Meanwhile, our international business continues to be a solid contributor to results, with operating income up 31% for the quarter and 113% for the first nine months.
Please turn to slide 23 for some insight into current market conditions. Valvoline continues to be greatly impacted by the volatile crude oil markets. The announced base oil cost increases between May and July have totaled approximately 36%, on a product that sold for about $4 a gallon at the beginning of the period. Additives, likewise, have increased significantly, and the market has announced two increases totaling 28% to take effect during the fourth quarter. Meanwhile, supplies of base oil remain fairly tight, despite increases in global group two production as group one capacity closures have shifted demand to group two supplies. Against these cost issues, we are also experiencing lower demand on a short-term basis versus our long-term expectation of flat to slightly declining lubricant demand. Demand will likely remain weak in the calendar year 2009.
Please turn to slide 24. This chart shows the change in Valvoline's total US branded raw material cost through June 2008 as shown on the bottom solid red line. The top solid blue line is a change in net sales price. The gap between these two lines essentially represents our unit gross profit margin. The vast portion of these lines represents our estimates for the next few months. The narrowing and widening of the gap between the two lines shows the impact on margins of raw material costs.
During fiscal 2006, rapid run ups in cost squeezed margins, while in fiscal 2007 our costs stabilized, enabling our price increases to catch up with cost and leading to a record year. It is important to note that while the impact of raw material cost increases can be felt within weeks, it can take two to three months to fully implement price increases in some markets, due to competitive pressures and promotional commitments. Similar to 2006, we are experiencing the negative effects of this timing-lag in the implementation of price increases in fiscal 2008. This will particularly effect our fourth quarter where you can see the sharp rising cost is not fully recovered by pricing during the quarter. Specifically, we have announced price increases for the US market in June and July that will be effective with customers in August and September. We expect these increases should enable us to offset the cost increases, allowing margins to return to more normalized levels during the early part of fiscal 2009.
All that said, despite the negative impact we are projecting in the fourth quarter and the challenging market conditions, we have a strong brand and we are confident in our plans to deliver earnings growth in 2009.
I'll now turn the call over to Jim O'Brien who will provide an update on cost structure initiatives.
Jim O'Brien - Ashland - Chairman and CEO - Thanks, Sam. You will note on slide 25 that, as we discussed this spring, we are focused on achieving cost structure efficiency throughout Ashland. Our target was to reduce cost by $14 million by the end of fiscal 2008 on an annualized run rate basis, and by $40 million by year end fiscal 2009, also on run rate basis. In addition, we announced that we are targeting another $25 million of year-end 2009 run rate savings through changes in our business models in Performance Materials and Water Technologies. We are significantly ahead of plan in achieving our run rate annualized cost savings of $40 million. Through the June quarter, we have achieved run rate savings of $22 million, primarily in our Water Technologies and Performance Material business, and we expect to have run rate savings well in excess of $40 million by the beginning of the December quarter.
I've asked Lamar to provide more detail on the proposed Hercules acquisition before we take your questions. So Lamar.
Lamar Chambers - Ashland - SVP and CFO - Thank you, Jim. As we have been out talking about the Hercules transaction, we have heard a number of recurring questions. I hope to provide you with some of the answers in the next few slides. The chart on slide 26 provides the estimated sources and uses of funds for the Hercules transaction. The plan to utilize about $1.4 billion of senior credit facilities, $750 million of notes, $900 million of cash on hand, and $500 million of new Ashland stock to fund the transaction. The sources table presumes we will continue to hold our $275 million of student loan option rate securities. To the extent we are able to liquidate these securities, our need for debt financing will, of course, be reduced.
That said, when the transaction is complete, we expect to have $2.4 to $2.5 billion of debt, including $2.2 billion of new debt and $215 million assumed debt from Hercules, along with some or all of Hercules's relatively small amount of foreign debt. The $215 million represents 6.5% junior subordinated deferable interest divestures, due 2029. Hercules's other debt is expected to be retired at closing. We expect the debt to trailing EBITDA ratio to be 3.2 to 3.3 times, immediately upon close.
You will note on the usage side of the table that $172 million will be set aside to retire a cross currency swap arrangement that Hercules has maintained. We plan to pursue our options with these swaps and will consider maintaining some or all of them post closing, but for purposes of conservatism we have assumed that we will use funds to close these instruments out at the time of closing.
The current expected blended interest rate is 7.25% to 7.5%. Of course the credit markets continue to move and rates will not be locked in until the syndication of the credit facilities is complete. For your modeling purposes, you may want to consider a range of 7.25% up to 8% or 8.25%.
Now let's take a look at additional details of the transaction economics on slide 27. The Hercules acquisition is expected to generate significant shareholder value based upon our estimated internal rate of return. When the final book evaluation for each asset acquired -- while the final book valuation for each asset acquired often requires up to a year after closing to determine, our preliminary analysis of the amount of the increase annualized amortization and depreciation, due to purchase accounting, is approximately $120 million for the first several years after the transaction. Of course DNA will scale down after the useful life of each asset is surpassed. We are anticipating an asset write up of amortizable and tangible assets and property plant and equipment of approximately $1.6 to $2.0 billion. Further details on the transaction are covered on slide 28.
Based upon the debt levels that we showed on slide 26 and, assuming weighted average interest rate of 7.25% to 8% or so, initial total gross interest expense is forecast to be $175 to $200 million. Ashland's interest income will be, of course,substantially reduced since we will be using the large majority of existing Ashland and Hercules cash for the acquisition.
As a part of the transaction, we will issue approximately 10.5 million new shares of Ashland common stock. Thus increasing Ashland's shares outstanding to approximately 75 million.
Regarding an expected tax rate, due to Hercules foreign tax credit carryover, Ashland should benefit from a lower effective tax cash rate during the first five years or so following the acquisition. Specifically, it should be less than the low 30s that we have provided as long term guidance for Ashland's tax rate.
Now let's turn to slide 29 to discuss expected synergies and integration cost associated with the acquisition. We announced in our July 11th call regarding the Hercules acquisition that we expect $50 million of synergies to result from the transaction. In discussing synergies, we're choosing to focus on those we have direct visibility into at this time. Approximately 75% of the estimated $50 million of synergies that we have initially identified are in the area of general and administrative expenses. We included no potential revenue synergies in our figure. We expect to achieve at least 60% of the synergies on a run rate basis by the end of the first year after closing of the transaction.
We expect the integration team to uncover additional opportunities, both on the revenue and savings sides, as well as to identify opportunities to accelerate the realization of synergies. In total, the integration team is targeting an additional $30 million to $70 million of synergies beyond our initial estimate. Likely areas for these additional synergies would include efficiency opportunities within the commercial organization of the combined Hercules Paper and Ashland Water businesses and additional supply chain savings. Revenue synergies are likely to be identified in several areas, most notably selling the Ashland Water products, such as retention aids, to paper companies with which Hercules already has a strong relationship. All of these savings are in addition to the $65 million of cost structure efficiencies from our existing businesses that Jim mentioned previously. So taken altogether, we're targeting combined savings of synergies of $145 million to $185 million from Ashland and Hercules as compared with their recent individual performances.
Please turn to slide 30 for a discussion of the Merger Agreement and Financing Commitments. The Merger Agreement was signed July 10 and the Merger Agreement and Financing Commitment documents were filed with the SEC on July 14th. We have had a lot of questions about the financing-out for Ashland. First, let me just emphasize that both Ashland and Hercules look forward to closing the transaction. However, with regard to financing, the basic principle is if Ashland cannot obtain the funds, we cannot be required to close.
We're very happy to be working with Bank of America and Scotia Bank, two of our long-term relationship banks, in obtaining the debt financing for the transaction. The debt commitments are in place until December 31st. If closing were to occur after December 31st, we would attempt to obtain financing on comparable terms, first with these banks or, if unavailable, from other sources. If we don't obtain financing, we don't have to close, but we would have to pay a $77.5 million reverse breakup fee and the agreement would terminate. Ashland would have no other obligations or payments other than the reverse breakup.
There are several standard conditions precedent to closing which are shown on the slide. The SEC will need to declare effective before (inaudible) that Ashland will be filing. While we don't anticipate any issues, we will closely monitor the progress and timing of this process. With respect to antitrust approvals, we do not believe we should have any issues. The portions of the business that, even in the broadest sense, could be considered overlap are very small and the reality is that Ashland and Hercules are not competitors in the marketplace. The transaction does require a two thirds approval from the Hercules shareholders. As is standard, there are material adverse change clauses in affect, but there is not a general market-out.
Let's turn to slide 31 to review the anticipated timing of the transaction. We will make our HSR filing within the next few days and plan to make the EU filing in mid-August. We will also have a Canadian filing and are investigating several other jurisdictions where a filing may be required. We plan to file the S-4 with the SEC in early August, anticipate that the SEC will complete its review by late September. We also are in anticipating antitrust reviews to be completed in a similar timeframe. We currently anticipate that the Hercules special shareholder meeting to vote on the transaction would occur in late October or early November, with closing occurring five days following shareholder approval.
Jim?
Jim O'Brien - Ashland - Chairman and CEO - Thanks, Lamar. I appreciate you going through the details of the Hercules transaction. I know that it's a fair amount of technicalities, but I also know that many of our investors and analysts are interested in these items. So all that said, let me be clear - we plan and we want to close this transaction. We look forward to the combination of Ashland and Hercules and the new opportunities that it presents.
With that, let's go to the next slide and we will take your questions on our third quarter performance or the transaction.
QUESTION AND ANSWER
Operator
(OPERATOR INSTRUCTIONS) Your first question comes from the line of Laurence Alexander with Jefferies. Please proceed.
Laurence Alexander - Jefferies & Co. - Analyst - Good morning.
Jim O'Brien - Ashland - Chairman and CEO - Good morning, Laurence.
Laurence Alexander - Jefferies & Co. - Analyst - I guess, first of all, on the Water business - can you give a little bit more granularity on the sequential head-winds that will be faced in Q4?
Jim O'Brien - Ashland - Chairman and CEO - As we look at the fourth quarter, the primary focus has been on the pricing model, getting the prices into our customers, and look at the segmentation so that we can get as much price as possible. So, we would continue to work that particular issue.
As far as the redesign, we will continue to execute the decisions that have been made around staffing, the size of the business, organization, all that will hopefully be fairly complete through the quarter and I do not want much to spill over into the new fiscal year that will start October 1st. So, the head-winds, as you saw in the business, the business is doing very well on their volumes. They're executing well at the customer sites. So I think the biggest challenge the business has is getting their pricing. And I think they have a good process now, and they have good visibility, and the achievement of that, and the management is taking control of that situation so that they can measure it and monitor and assure that we're getting it.
Laurence Alexander - Jefferies & Co. - Analyst - And I guess, secondly, with respect to the Hercules assets - I think the last conference call discussed the core assets, but what's your view on the JVs, particularly FiberVision?
Jim O'Brien - Ashland - Chairman and CEO - You know, the FiberVision JV had its purpose and they're trying to achieve a certain result and I would -- my discussions with Craig, I would support what they have done and I would support their strategy going forward of how to resolve that.
Laurence Alexander - Jefferies & Co. - Analyst - Okay. So no change in terms of longer term objectives?
Jim O'Brien - Ashland - Chairman and CEO - No.
Laurence Alexander - Jefferies & Co. - Analyst - Okay. And finally on Distribution - given the environment that we're in now, what's -- how aggressively do you think you can drive margin expansion in 2009 and 2010?
Jim O'Brien - Ashland - Chairman and CEO - The environment that's out there today, as far as pricing, is fairly robust, let's say. Everybody understands that the crude situation is strong and volatile, and that the petrochemical producers and, especially the companies that are selling commodities, were under great stress and that they are accepting, to a great degree, the cost increases that are coming through. The challenge, next quarter, will be as crude kind of settles out, not only do we cover the actual cost but can you recover more margin? And that is what they have to work on the next quarter and I would anticipate that we will continue to raise prices and the challenge will be to get that additional margin above the cost, to get a margin that's more appropriate for returns of the business. And we think that that's going to take some stability in the marketplace to achieve that, and -- but in the meantime the -- we plan to, at a minimum, get the cost through so that we recover the total cost of the inputs.
Laurence Alexander - Jefferies & Co. - Analyst - Thank you.
Jim O'Brien - Ashland - Chairman and CEO - Thanks.
Operator - - Your next question comes from the line of Jeff Zekauskas with J.P. Morgan. Please proceed.
Jeff Zekauskas - JP Morgan - Analyst - Hi, good morning.
Jim O'Brien - Ashland - Chairman and CEO - Morning Jeff.
Jeff Zekauskas - JP Morgan - Analyst - In your corporate other income, I think the numbers for the first three quarters go something like this - positive three, positive one, and then positive ten for this quarter. How did you do that? And what's the right ongoing number?
Lamar Chambers - Ashland - SVP and CFO - That's a somewhat difficult portion of our segment breakdown, to predict, as you might imagine being the unallocated category of our corporate expense. It includes a variety of costs related to matters like incentive approvals, legacy environmental issues, a host of our support functions. So we do have certainly a challenge predicting that from period to period. Our basic philosophy is to try to achieve break-even level results there through the allocations that we charge to our commercial operating segments.
If we look at the quarter, you can see that SG&A, overall, for Ashland was down about $12 million. And most of that difference did show up in our "unallocated and other" line. And that difference, in the quarter over quarter comparison, was a combination of reduced resource group expenses, where we have been able to trim back our ongoing cost of supporting the businesses through belt tightening and staffing reductions, we have been focusing on over the last year or so, frankly. And we added some unusually favorable effects for incentive compensation and deferred compensation costs in the quarter. So, looking forward we would expect that line to be more in the range of zero, which is our philosophy.
Jeff Zekauskas - JP Morgan - Analyst - Secondly, the Water business also has had income volatility and that I think in Q1 you were $5 million, in two it was negative $2 million. This quarter it was positive $12 million? What's, sort of, the normal run rate right now of the Water business going forward?
Lamar Chambers - Ashland - SVP and CFO - As we mentioned in the discussion earlier, we believe about 45 million of the $12 million in earnings for the quarter for Water was nonrecurring items - contracts that got closed out that had abnormal positive effect on the earnings, plus some adjustments to accruals for various liabilities, when we add those items up, about $5 million of that $12 would be abnormal levels of earnings. So I think you could take that off the top.
Going the other direction, though, as Jim mentioned in his discussion around our cost structure and the expense reduction initiatives, we are seeing significant progress made quickly in that business and we believe we're at about an $8 million run rate on those expense reduction initiatives for the Water business itself. So that's kind of counter-balancing that looking forward.
Jim O'Brien - Ashland - Chairman and CEO - Jeff, I think we have kind of turned the corner on our Water business as far as all the initiatives we have been talking about for some time. In the second quarter, we had production issues because of how we handled poly(inaudible) being produced in Europe and being shipped around the world. We changed our process there, as far as sourcing, from various parts we arranged other contracts, and I think we have gotten that fairly settled out. So we're not taking the currency hits of moving production out of Europe through the rest of the markets that we serve. So that was a big improvement that really hurt us in the second quarter. So that's been fixed.
The other was our pricing issue. We have been really focusing on our pricing processes and getting our pricing right. And I think this quarter is the first one that we can fully accurately report that we have actually made progress and it's starting to show up in our results. I think that's a change that should be sustainable going forward. And as Lamar just talked about, we're just now getting some benefit of the restructuring and cost reductions, which will continue to be ongoing, but we have already made some changes there, and that's starting to show up.
So in our Water business, I think, for the first time in some time, I can report that we have positive momentum built in this business. And it certainly hadn't felt that way for some time. And I know that you, personally, have challenged us in our reporting on that, but I think that's the big change. We actually have some momentum built in the business and that's around pricing, cost structure, and getting our production right around the world as far as currency issues.
Jeff Zekauskas - JP Morgan - Analyst - That's helpful. Just lastly, you know, it sounds like the fourth quarter is a little -- is weaker than the third on a sequential basis. Is the EBIT likely to look more like the first quarter or the second quarter? Sort of, what's the order of magnitude of weakness you expect in Q4?
Jim O'Brien - Ashland - Chairman and CEO - I think the guides we're trying to give you in our talk, the language we have used, is the third quarter reflects the price increases and the changes in the business that reflected crude until the last big run up in the last really four or five weeks. So what we're facing through the fourth quarter, is the magnitude of pricing that has to be taken to the marketplace is going to take us probably two to three months to fully recover that. So what we're trying to communicate in the fourth quarter is that's what's going to take place. So if you had to make a choice between one of the quarters, I would take the first quarter.
Jeff Zekauskas - JP Morgan - Analyst - Okay, thank you very much.
Operator - - Your next question comes from the line of [Robert Felice] with the [Bellian Company]. Please proceed.
Robert Felice - Bellian Company - Analyst - Hi guys, just a couple quick questions. First, I wanted to follow up on the Water business. You've talked about near-term goal of getting that business to an 8% EBIT margin and you just mentioned that you think you have turned a corner there in terms of some of the initiatives. What kind of underlying run rate EBIT margin do you think that business is at?
Jim O'Brien - Ashland - Chairman and CEO - Today? Well you know I think it's constantly changing month to month. I think as we continue to get our pricing up, continue to get our cost down, I'm hopeful that we're going see continued improvement. What we have communicated in presentations in the last several quarters and months, is our initial objectives to get at the 8%. That would be a threshold that I would hope, on a run rate basis, we would be able to achieve by the end of this year, even. Then the forecast would be as we continue to improve that business, and I'm hopeful that once we combine it with Hercules's business here sometime in the fourth calendar quarter, we should improve it even more.
I think there's actually additional change that can be made to the business with the size and scale that Hercules brings and, I'll leave that up to Paul Raymond as he gets into it after we close and we start setting objectives for him going forward as far as the integration team, I would expect more. So a minimum of 8 and then I think it goes to double digit into the future. But yet we still have to have, I think, the initiatives and the combination with Hercules to achieve that. But I think it's something that can be achieved because it's cost reductions, organization, and it's positioning. And I think we will have the pricing model in place to understand how to price and get price, so I'm much more encouraged today than I have been for sometime.
Robert Felice - Bellian Company - Analyst - Well, I guess what I'm wondering is, in light of the momentum you say you're building there, should we expect the path to 8% to be linear or should we expect a step-change in the margin structure in the coming quarters?
Jim O'Brien - Ashland - Chairman and CEO - I think what you see is kind of a linear movement on the cost improvement because that's something that's taking place month to month. But on the pricing, I think pricing is more of a step-change, because pricing is something you get, it's a lift and you get it pretty much all in the same period. So I would see pricing as a step-change move and cost more of a linear improvement.
Robert Felice - Bellian Company - Analyst - So opportunity, as we look to the next fiscal year, to see some kind of larger step-change kind of improvement in margins?
Jim O'Brien - Ashland - Chairman and CEO - That would be my expectation, yes.
Robert Felice - Bellian Company - Analyst - Okay. And then flipping over to Valvoline - in light of the weak end-market demand there, I was hoping you can delve a little deeper into competitive support or competitive activity in the marketplace around pricing.
Jim O'Brien - Ashland - Chairman and CEO - I'll speak first, then turn it over to Sam, he can give you more detail. The thing that's interesting about that market, it's been a market that's been declining for the last 15 years. It's accelerated through periods like this as people start changing their behaviors on number of oil changes, but it shifts between markets - it goes from DIFM to DIY back to DIFM. And you also have weakness in several of the players, which are losing share. As Sam pointed out, we gained 1% growth in a market that we believe declined by 4%. So, you know, Sam won't say this, but I will, but I fully expect them to maintain their volumes through this period because they can take it from others. They have demonstrated that they have achieved that. So I have confidence they will continue to proceed.
So with that I'll let Sam give the details how he's going to do that. Sam you can give some description on how to do that.
Sam Mitchell - Ashland - VP and President, Ashland Consumer Markets - Just a couple more comments then on the marketplace. Certainly the market that Jim spoke of that's declining is the Do-It-Yourself market as consumers gradually shift over to the Do-It-For-Me market year after year. So we see that relatively good pricing discipline in the marketplace, competitors have been passing through price increases relative to cost. Not so much including margin, but definitely recovering cost. But it's a very competitive market as some of the weaker brands try to salvage their business, so there's quite a bit of promotional spend. So, to be effective in growing the business and maintaining our business in a declining market, and we have got to keep a close eye on the promotional spends there and the promotional support for the brand. I'm real pleased with our progress, working with our key customers and continuing to drive that business.
On the Do-It-For-Me side of the marketplace, there's a broader range of competitors. Again, fairly good price discipline as far as recovering cost, difficult to recover margins. The Do-It-For-Me market has been a relatively flat market over time, a little bit of increase over time too, as we see that shift from DIY to the Do-It-For-Me side.
In this marketplace though, we do believe it's declining, that the 2008 market, we have seen some pretty significant declines, particularly with car dealers as car dealers have been selling fewer cars they have also seen less traffic in their bays, so that's definitely impacted their market. A number of our other installers that we provide product to and we track closely have certainly reported weaknesses. So as we track the Do-It-For-Me market, it's largely driven by -- the overall demand is driven by how much people drive and we have seen reports from Department of Transportation that, with the higher gas prices, that people have cut back on miles driven in the 3% to 4% range. So we do expect that to continue through 2008, into 2009. But we believe that's more of a short-term effect as consumers adjust to higher gas prices and we would expect, longer term, that DIFM market to stabilize.
Robert Felice - Bellian Company - Analyst - So it doesn't sound like, if I'm understanding correctly, that you think there's, in light of the weak end-market demand, that there's any change in the timeframe in which you would normally close your price cost gap?
Sam Mitchell - Ashland - VP and President, Ashland Consumer Markets - It's been pretty consistent in our work with both retailers and the DIY market and our distributors and installer customers in the Do-It-For-Me market that that timeframe for implementing price increases has been pretty consistent.
Robert Felice - Bellian Company - Analyst - Okay. Then I guess, lastly, Jim, I was hoping you can give us an update or progress report on how your SAP implementation is going. How that's progressed sequentially?
Jim O'Brien - Ashland - Chairman and CEO - Sure. The SAP project, for the most part, through the operations is complete. We just launched China last month and they came through that very well. Their inventories were off I think $2.10 and the receivables off $1.10, and they took a collection to pay the company back, because of their culture they don't want to have any variance. I thought that was kind of interesting. So they did a great job, it went well.
So the operations are through it. And what we're starting to see as benefit now through this work, it's really helping us with our pricing models, because without this I think one instance across the world, SAP, we would have a much more difficult time getting our pricing through and, more importantly, understanding what we were getting. So I think that's been a huge benefit by having it. Also the working capital change we have experienced this year has been, I think, helped by having the information systems we have in place now, that we get much more transparency on a daily basis - it's managed more on a daily basis. So we're starting to see, I think, benefits the actual results coming back there. So it was a big investment and one I think that's now starting to pay off for us in how we manage the company. So it's behind us and now we're starting to use it to our benefit.
Robert Felice - Bellian Company - Analyst - All right, great. Thanks for taking my questions and good luck in the fourth.
Jim O'Brien - Ashland - Chairman and CEO - Thank you.
Operator - - Your next question comes from Mike Sison with Key Banc. Please proceed.
Mike Sison - Key Banc Capital Markets - Analyst - Hey, good morning guys.
Jim O'Brien - Ashland - Chairman and CEO - Morning, Mike.
Mike Sison - Key Banc Capital Markets - Analyst - In terms of the fourth quarter, the delta between what might occur versus the third and the fourth, in terms of operating income, sounds like it's going to be down, obviously. Is the delta largely going to be the squeeze in raw materials?
Jim O'Brien - Ashland - Chairman and CEO - The delta is specifically just the timing that it takes, it takes such a large chunk of cost increase and move it through the market.
Mike Sison - Key Banc Capital Markets - Analyst - Right.
Jim O'Brien - Ashland - Chairman and CEO - So the decrease that we're going to experience is not because of any other particular change in the market, it's just the process that it takes to get our customers to accept the price, take the price, and then to start paying us at that level.
Mike Sison - Key Banc Capital Markets - Analyst - Right. So the delta to would come back in the first quarter?
Jim O'Brien - Ashland - Chairman and CEO - That's right. So the whole point is -- I think what the third quarter demonstrated, is that we do get it.
Mike Sison - Key Banc Capital Markets - Analyst - Right.
Jim O'Brien - Ashland - Chairman and CEO - And it does show up in your earnings and it does show up in your performance. But, everybody has talked about this, it's almost old news now, the slug of cost everybody announced three or four weeks ago, but the fourth quarter is going to be the timeframe by which you have to actually execute it. What we're trying to communicate is we will get it, we're confident we're going to get it because the pricing's going through, it's being supported. All that is not the difficulty, it's just the time-lag of getting it in, getting it priced and having it show up on your books. So as you look at it month to month, it will get better as each week goes by. But it's going to be pretty ugly in the first couple months of that quarter because you're not getting it in those months.
Mike Sison - Key Banc Capital Markets - Analyst - Right. And for the fourth quarter, do you have a number or sort of a sense you can share with us in terms of what the cost you have to recover is? In total?
Jim O'Brien - Ashland - Chairman and CEO - In total? Maybe Eric has that.
Eric Boni - Ashland - Director, IR - - Yeah. As we look at what happened in the third quarter, we talked about the raw material increases of roughly $80 million or so that we -- that came through. As we look at this quarter, certainly oil has started to come off a little bit and we will have to see exactly how that impacts some of the potential announced increases in August and September, but there certainly, at least at a macro level, seems to be some momentum which would suggest the number would not be that order of magnitude for the fourth quarter.
Mike Sison - Key Banc Capital Markets - Analyst - It would not be as big?
Eric Boni - Ashland - Director, IR - - It would not as big as $80 million.
Mike Sison - Key Banc Capital Markets - Analyst - I got you, okay. Then, Sam, I'm curious -- you're certainly outperforming the market in Valvoline on a volume basis - congrats there - but when I take a look at 2006, when you had a difficult year, it was largely due to the inability to get pricing and the margins for the industry sort of got squeezed. And I wonder if your market share gains might cause backlash, if you will, and maybe just could you sort of answer if -- is profitability really driven by the volumes or is it really driven by sort of the margins out there that the industry can attain?
Sam Mitchell - Ashland - VP and President, Ashland Consumer Markets - Mike, the big difference in our profitability in 2008 versus 2006 has a lot to do with the work we have done on our cost structure. We have driven a lot of supply chain efficiency and improved our cost structure quite a bit. The other big difference is in our Valvoline Instant Oil Change unit, which was really struggling in 2006. The profits are many times greater than what they were in 2006 and the current environment, and that business continues to grow for us as we report on a monthly basis. The international business is also performing much higher and so our portfolio business is just a lot stronger than it was in 2006 and then I'm also confident that as I look at our core business in the US, business with DIY retailers and independent installers, that we're making solid improvements in that business, but we still have a lot of opportunities to continue to improve that business in the years ahead.
Mike Sison - Key Banc Capital Markets - Analyst - So the business is certainly better on a structural basis than it was back then, allowing you to get better profitability near term?
Sam Mitchell - Ashland - VP and President, Ashland Consumer Markets - It's much better and that's why we're confident as we get these price increases through that we will be in good shape as we start the new fiscal year. And really expect to continue to grow the business.
Mike Sison - Key Banc Capital Markets - Analyst - Okay. Great, thanks guys.
Jim O'Brien - Ashland - Chairman and CEO - We have time for one more call.
Operator - - Your next question comes from the line of Steve Velgot with Susquehanna. Please proceed.
Steve Velgot - Susquehanna Financial Group - Analyst - Just a couple quick questions from me. In terms of looking at fiscal 2009, by your different businesses, where would you expect -- it sounds like in Water Technologies is probably where you have the greatest opportunity to expand margins, but if I were to just look year over year, where would you say you'd have the most difficulty in raising margins year over year?
Jim O'Brien - Ashland - Chairman and CEO - I would say that the areas that we will have probably the best chance will be in our Distribution business, our Water business. And I think Valvoline continues to perform as is. Probably the business that has the most difficulty, because it's been probably the biggest impact volume wise, has been our Composites business. I would say that that's going to require us to probably focus more and more internationally, both in Europe and in Asia, because as you look at the US marketplace, I don't foresee any recovery there in the near term, in the marine market or the automotive market or in the housing market. So, for that business to perform and get stronger, we're going to really focus on our European business and our Asian business and put broader objectives there and investments in those area.
Steve Velgot - Susquehanna Financial Group - Analyst - And then one other question about the deal and if there are issues where you are not able to close the deal by year end, I think you said you would need to try to secure similar financing and I take it that's at Ashland's discretion as to how similar the financing needs to be. Is that the case?
Jim O'Brien - Ashland - Chairman and CEO - Yes. I mean, that was the whole purpose of that particular clause was to give us the flexibility to find financing that we believe was comparable and that we would be able to run our returns off of and give our shareholders the type of returns, long term, based upon how we would finance it initially.
Steve Velgot - Susquehanna Financial Group - Analyst - Okay, thank you.
Jim O'Brien - Ashland - Chairman and CEO - Well, thanks everyone forever your interest and we look forward to speaking with you soon. Bye.
Operator - - Thank you for your participation in today's conference, this concludes our presentation. You may now disconnect and have a good day.
Forward-Looking Statements
This presentation contains forward-looking statements, within the meaning of Section 27A of the Securities Act of 1933 and Section 21E of the Securities Exchange Act of 1934. These statements include those made with respect to Ashland’s operating performance and Ashland’s acquisition of Hercules Inc. These expectations are based upon a number of assumptions, including those mentioned within this presentation. Performance estimates are also based upon internal forecasts and analyses of current and future market conditions and trends, management plans and strategies, weather, operating efficiencies and economic conditions, such as prices, supply and demand, cost of raw materials, and legal proceedings and claims (including environmental and asbestos matters). These risks and uncertainties may cause actual operating results to differ materially from those stated, projected or implied. Such risks and uncertainties with respect to Ashland’s acquisition of Hercules include the possibility that the benefits anticipated from the Hercules transaction will not be fully realized; the possibility the transaction may not close, including as a result of failure to obtain the approval of Hercules stockholders; the possibility that financing may not be available on the terms committed; and other risks that are described in filings made by Ashland with the Securities and Exchange Commission (SEC) in connection with the proposed transaction. Although Ashland believes its expectations are based on reasonable assumptions, it cannot assure the expectations reflected herein will be achieved. This forward-looking information may prove to be inaccurate and actual results may differ significantly from those anticipated if one or more of the underlying assumptions or expectations proves to be inaccurate or is unrealized or if other unexpected conditions or events occur. Other factors, uncertainties and risks affecting Ashland are contained in Ashland's periodic filings made with the SEC, including its Form 10-K for the fiscal year ended Sept. 30, 2007 and Forms 10-Q for the quarters ended December 31, 2007 and March 31, 2008, which are available on Ashland’s Investor Relations website at www.ashland.com/investors or the SEC’s website at www.sec.gov. Ashland undertakes no obligation to subsequently update or revise the forward-looking statements made in this presentation to reflect events or circumstances after the date of this presentation.
.
.
ADDITIONAL INFORMATION
In connection with the proposed transaction, Ashland and Hercules will be filing documents with the SEC, including the filing by Ashland of a registration statement on Form S-4, and the filing by Hercules of a related preliminary and definitive proxy statement/prospectus. Investors and security holders are urged to read the registration statement on Form S-4 and the related preliminary and definitive proxy/prospectus when they become available because they will contain important information about the proposed transaction. Investors and security holders may obtain free copies of these documents (when they are available) and other documents filed with the SEC at the SEC’s web site at www.sec.gov and by contacting Ashland Investor Relations at (859) 815-4454 or Hercules Investor Relations at (302) 594-7151. Investors and security holders may obtain free copies of the documents filed with the SEC on Ashland’s Investor Relations website at www.ashland.com/investors or Hercules’ website at www.herc.com or the SEC’s website at www.sec.gov.