BRUCE FUND, INC.
Management’s Discussion and Analysis
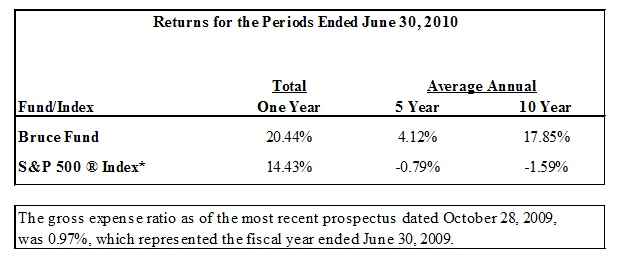
The Bruce Fund (the “Fund”) shares produced a total return of 20.44% for the year ended June 30, 2010, compared to a total return of 14.43% for the S&P 500 Index for the same period. Stock markets bounced sharply in the period and the Fund edged the broader stock averages. The Government bonds more recently aided the Fund’s performance as well as a few equity investments which gained in the period. The Fund’s current equity investments are in smaller more speculative companies, where the volatility has been acute. The Fund’s purchases of straight corporate bonds also added to the Fund’s performance in the period.
Our outlook for the economy in the near term is not promising. A double dip back into a slow or no growth environment is probable and our focus in the Fund will continue to be defensive. Areas of interest include some speculative high yield corporate bonds and some convertible bonds. We will not ignore common stocks as there are always good investments created by the markets, but at the moment they are scarce. The bonds as well as the stocks in the portfolio encompass significant investment risks, which are again outlined in the prospectus.
Shareholders are invited to use the toll-free number (800) 872-7823 to obtain any Fund information (including the proxy voting record), or can visit www.thebrucefund.com, to obtain the same.
Investment Results
The performance quoted represents past performance, which does not guarantee future results. The investment return and principal value of an investment will fluctuate so that an investor’s shares, when redeemed, may be worth more or less than their original cost. The returns shown do not reflect deduction of taxes that a shareholder would pay on Fund distributions or the redemption of Fund shares. Current performance of the Fund may be lower or higher than the performance quoted. The Fund’s investment objectives, risks, charges and expenses must be consid ered carefully before investing. Performance data current to the most recent month end may be obtained by calling 1-800-872-7823.
* The Index is an unmanaged benchmark that assumes reinvestment of all distributions and excludes the effect of taxes and fees. The S&P 500 ® Index is a widely recognized unmanaged index of equity prices and is representative of a broader market and range of securities than is found in the Fund’s portfolio. Individuals cannot invest directly in the Index; however, an individual can invest in exchange-traded funds or other investment vehicles that attempt to track the performance of a benchmark index.
The Fund’s investment objectives, risks, charges and expenses must be considered carefully before investing. The prospectus contains this and other important information about the investment company and may be obtained by calling the same number as above. Please read it carefully before investing.
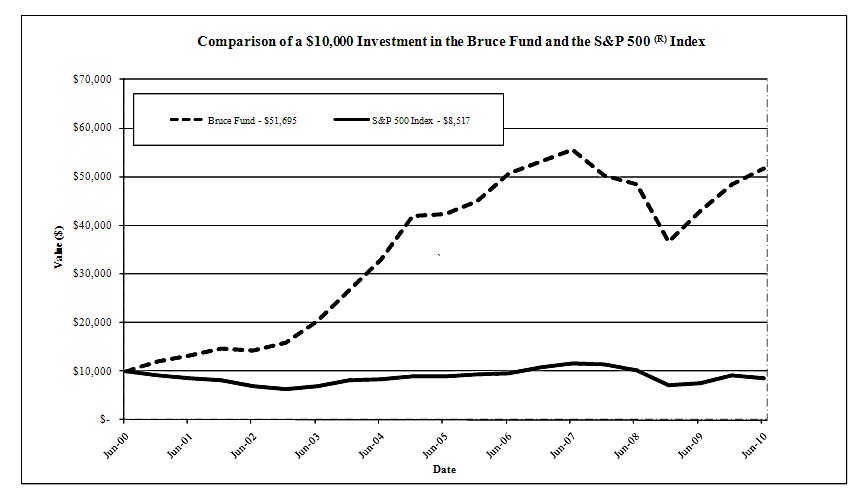
The chart above assumes an initial investment of $10,000 made on June 30, 2000 and held through June 30, 2010. THE FUND’S RETURN REPRESENTS PAST PERFORMANCE AND DOES NOT GUARANTEE FUTURE RESULTS. The returns shown do not reflect deduction of taxes that a shareholder would pay on Fund distributions or the redemption of Fund shares. Investment returns and principal values will fluctuate so that your shares, when redeemed, may be worth more or less than their original purchase price.
Current performance may be lower or higher than the performance data quoted. For more information on the Bruce Fund, and to obtain performance data current to the most recent month end, please call 1-800-872-7823. Investing in the Fund involves certain risks that are discussed in the Fund’s prospectus. Please read the prospectus carefully before you invest or send money.
FUND HOLDINGS – (Unaudited)
1As a percent of net assets.
Availability of Portfolio Schedule
The Fund files its complete schedule of portfolio holdings with the Securities and Exchange Commission (“SEC”) for the first and third quarters of each fiscal year on Form N-Q. The Fund’s Form N-Qs are available at the SEC’s website at www.sec.gov. The Fund’s Form N-Qs are also available by calling the Fund at (800) 872-7823. The Fund’s Form N-Qs may be reviewed and copied at the Public Reference Room in Washington DC. Information on the operation of the Public Reference Room may be obtained by calling 1-800-SEC-0330.
ABOUT YOUR FUND’S EXPENSES – (Unaudited)
As a shareholder of the Fund, you incur ongoing costs, including management fees and other Fund expenses. This example is intended to help you understand your ongoing costs (in dollars) of investing in the Fund and to compare these costs with the ongoing costs of investing in other mutual funds.
The example is based on an investment of $1,000 invested at the beginning of the period (January 1, 2010) and held for the entire period (through June 30, 2010).
Actual Expenses
The first line of the table below provides information about actual account values and actual expenses. You may use the information in this line, together with the amount you invested, to estimate the expenses that you paid over the period. Simply divide your account value by $1,000 (for example, an $8,600 account value divided by $1,000 = $8.60), then multiply the result by the number in the first line under the heading entitled “Expenses Paid During Period” to estimate the expenses you paid on your account during this period.
Hypothetical Example for Comparison Purposes
The second line of the table below provides information about hypothetical account values and hypothetical expenses based on the Fund’s actual expense ratio and an assumed rate of return of 5% per year before expenses, which is not the Fund’s actual return. The hypothetical account values and expenses may not be used to estimate the actual ending account balance or expenses you paid for the period. You may use this information to compare the ongoing costs of investing in the Fund and other funds. To do so, compare this 5% hypothetical example with the 5% hypothetical examples that appear in the shareholder reports of the other funds.
Please note that the expenses shown in the table are meant to highlight your ongoing costs only and do not reflect any transactional costs, such as redemption fees. Therefore, the second line of the table is useful in comparing ongoing costs only, and will not help you determine the relative total costs of owning different funds. In addition, if these transactional costs were included, your costs would have been higher.
Bruce Fund | Beginning Account Value January 1, 2010 | Ending Account Value June 30, 2010 | Expenses Paid During Period* January 1 – June 30, 2010 |
Actual | $1,000.00 | $1,068.33 | $4.34 |
Hypothetical** | $1,000.00 | $1,020.60 | $4.24 |
* Expenses are equal to the Fund’s annualized expense ratio of 0.85%, multiplied by the average account value over the period, multiplied by 181/365 (to reflect the partial year period).
** Assumes a 5% return before expenses.
| BRUCE FUND, INC. |
| SCHEDULE OF INVESTMENTS |
| June 30, 2010 |
| | | | | |
| COMMON STOCKS - (38.03%) | | | | |
| No. of Shares | | Issue | | | Cost | | Fair Value |
| | | Automotive/Transportation (3.07%) | | | |
| | 122,900 | | (a) | AMERCO | | $ 7,210,065 | | $ 6,765,645 |
| | | | | | | | | | |
| | | | Business Services (0.45%) | | | |
| | 130,000 | | (a) | Internet Capital Group, Inc. | 1,016,211 | | 988,000 |
| | | | | | | | | | |
| | | | Chemicals (1.31%) | | | | |
| | 720,270 | | (a) | Omega Protein Corp. | 3,659,385 | | 2,888,283 |
| | | | | | | | | | |
| | | | Consumer Products (7.69%) | | | |
| | 1,663,656 | | (a) | Alanco Technologies, Inc. | 3,609,525 | | 359,350 |
| | 313,900 | | (a) | American Italian Pasta Co. - Class A | 1,302,443 | | 16,595,893 |
| | | | | | | | 4,911,968 | | 16,955,243 |
| | | | | | | | | | |
| | | | Electric Services (4.24%) | | | |
| | 294,849 | | (a) | Calpine Corp. | | 3,720,342 | | 3,750,479 |
| | 20,000 | | | Integrys Energy Group, Inc. | 463,954 | | 874,800 |
| | 50,000 | | | NextEra Energy, Inc. | 2,345,410 | | 2,438,000 |
| | 50,000 | | | Pepco Holdings, Inc. | 554,830 | | 784,000 |
| | 50,000 | | | Unisource Energy Corp. | 1,476,415 | | 1,509,000 |
| | | | | | | | 8,560,951 | | 9,356,279 |
| | | | | | | | | | |
| | | | Energy/Energy Services (2.03%) | | | |
| | 80,000 | | (a) | Arena Resources, Inc. | 709,600 | | 2,552,000 |
| | 100,000 | | (a) | ATP Oil & Gas Corp. | 4,024,839 | | 1,059,000 |
| | 156,919 | | (a) | Double Eagle Petroleum Co. | 3,182,328 | | 666,906 |
| | 80,000 | | (a) | Hercules Offshore, Inc. | 2,461,778 | | 194,400 |
| | | | | | | | 10,378,545 | | 4,472,306 |
| | | | | | | | | | |
| | | | Guided Missiles & Space Vehicles & Parts (0.60%) | | | |
| | 1,070,073 | | (a) | Astrotech Corp. | 3,406,771 | | 1,326,890 |
| | | | | | | | | | |
| | | | Health Services (5.92%) | | | | |
| | 597,347 | | | America Service Group, Inc. | 6,866,334 | | 10,274,368 |
| | 726,509 | | (a) | EDAP TMS S.A. (ADR) | 5,376,680 | | 1,692,766 |
| | 182,300 | | (a) | Health Grades, Inc. | 156,028 | | 1,093,800 |
| | | | | | | | 12,399,042 | | 13,060,934 |
| | | | | | | | | | |
| | | | Manufacturing (5.24%) | | | | |
| | 1,581,500 | | | AirBoss of America Corp. (Canadian) | 5,441,626 | | 8,557,498 |
| | 300,000 | | | Titan International, Inc. | 2,539,767 | | 2,991,000 |
| | | | | | | | 7,981,393 | | 11,548,498 |
| | | | | | | | | | |
| | | | Mineral Exploration (2.37%) | | | |
| | 5,825,100 | | (a) | Admiral Bay Resources, Inc. | 4,153,315 | | 27,359 |
| | 280,000 | | | Kinross Gold Corp. | 2,749,745 | | 4,785,200 |
| | 199,270 | | (a) | Solitario Exploration & Royalty Corp. (Canadian) | 347,555 | | 426,438 |
| | | | | | | | 7,250,615 | | 5,238,997 |
| | | | | | | | | | |
| | | | Pharmaceutical/Drug Delivery (2.72%) | | | |
| | 631,746 | | (a) | Durect Corp. | | 2,244,259 | | 1,535,143 |
| | 130,000 | | (a) | Elan Corp., plc (ADR) | 851,573 | | 585,000 |
| | 50,000 | | | Merck & Co., Inc. | 2,130,679 | | 1,748,500 |
| | 150,000 | | | Pfizer, Inc. | | 3,890,679 | | 2,139,000 |
| | | | | | | | 9,117,190 | | 6,007,643 |
*See accompanying notes which are an integral part of these financial statements.
| BRUCE FUND, INC. |
| SCHEDULE OF INVESTMENTS - continued |
| June 30, 2010 |
| | | | | | | | | |
| | | | | | | | | |
| COMMON STOCKS - (38.03%) - continued | | | |
| No. of Shares | | Issue | | | Cost | | Fair Value |
| | | Property-Casualty Insurance (2.39%) | | | |
| | 50,000 | | | Allstate Corp./The | $ 1,386,090 | | $ 1,436,500 |
| | 211,502 | | (a) | GAINSCO, Inc. | 5,685,629 | | 1,469,939 |
| | 45,000 | | | RLI Corp. | | 2,225,358 | | 2,362,950 |
| | | | | | | | 9,297,077 | | 5,269,389 |
| | | | | | | | | | |
| | | | | | Total Common Stocks | 85,189,213 | | 83,878,107 |
| | | | | | | | | | |
| CONVERTIBLE PREFERRED/PREFERRED STOCKS (2.38%) | | | |
| | | | | | | | | | |
| | | | Convertible Preferred Stocks (1.48%) | | | |
| | 10,000 | | | AES Trust III 6.75% | 331,030 | | 435,625 |
| | 46,000 | | (c) | ATP Oil & Gas Preferred, 8.00% | 3,817,480 | | 2,823,250 |
| | | | . | | | | 4,148,510 | | 3,258,875 |
| | | | | | | | | | |
| | | | Preferred Stocks (0.90%) | | | |
| | 80,000 | | | AMERCO Series A, 8.50% | 1,491,145 | | 1,996,000 |
| | | | | | | | | | |
| | | | | | Total Convertible Preferred/Preferred Stocks | 5,639,655 | | 5,254,875 |
| | | | | | | | | | |
| BONDS - (55.99%) | | | | | | |
| Principal | | | Issue | | | | | |
| | | | U.S. Government (16.23%) | | | |
| $ | 30,000,000 | | | U.S. Treasury "Strips", 0.00% due 8-15-2028 | 12,087,677 | | 14,664,300 |
| | 30,000,000 | | | U.S. Treasury "Strips", 0.00% due 8-15-2029 | 12,144,030 | | 14,017,350 |
| | 20,000,000 | | | U.S. Treasury "Strips", 0.00% due 2-15-2036 | 6,195,544 | | 7,126,920 |
| | | | | | | | 30,427,251 | | 35,808,570 |
| | | | | | | | | | |
| | | | U.S. Municipal (0.00%) | | | | |
| | 1,000,000 | | (a)(b) | Indianapolis Airport Authority 6.50% due 11-15-2031 | 166,972 | | 1,270 |
| | | | | | | | | | |
| | | | U.S. Corporate (16.56%) | | | | |
| | 3,000,000 | | | ATP Oil & Gas Corp., 11.875% due 5-1-2015 | 2,199,960 | | 2,190,000 |
| | 4,000,000 | | | Constellation Energy Group 7.60% due 4-1-2032 | 3,511,081 | | 4,832,476 |
| | 6,000,000 | | | Energy XXI Gulf Coast, Inc. 10.00% due 6-15-2013 | 3,377,355 | | 5,955,000 |
| | 1,500,000 | | (c) | Land O' Lakes Capital Trust I 7.45% due 3-15-2028 | 971,265 | | 1,297,500 |
| | 3,000,000 | | | McMoRan Exploration Co. 11.875% due 11-15-2014 | 2,358,409 | | 3,075,000 |
| | 5,000,000 | | | Mirant Americas Gen, 9.125% due 5-01-2031 | 3,712,087 | | 4,625,000 |
| | 1,000,000 | | | ONEOK, Inc. 6.00% due 6-15-2035 | 739,904 | | 945,806 |
| | 2,000,000 | | | Viropharma, Inc., 2.00% due 3-15-2017 | 1,599,420 | | 1,727,500 |
| | 2,000,000 | | (c) | W & T Offshore, Inc. 8.25% due 6-15-2014 | 1,506,806 | | 1,810,000 |
| | 2,000,000 | | | Whiting Petroleum Corp., 7.00%, due 2-1-2014 | 1,484,678 | | 2,050,000 |
| | 7,300,000 | | (c) | XM Satellite Radio, Inc. 13.00% due 8-1-2013 | 3,071,636 | | 8,011,750 |
| | | | | | | | 24,532,601 | | 36,520,032 |
| | | | | | | | | | |
| | | | U.S. Corporate Convertibles (22.38%) | | | |
| | 10,179,000 | | (e) | Antigenics, Inc. 5.25% due 2-1-2025 | 6,138,978 | | 6,412,770 |
| | 3,000,000 | | | BPZ Resources Conv., 6.50% due 3-1-2015 | 2,947,506 | | 2,670,000 |
| | 4,389,000 | | (c) | C&D Technologies, Inc. 5.25% due 11-1-2025 | 3,944,336 | | 3,105,217 |
| | 2,250,000 | | | C&D Technologies, Inc. 5.25% due 11-1-2025 | 2,178,894 | | 1,591,875 |
| | 5,755,000 | | | C&D Technologies, Inc. 5.50% due 11-15-2026 | 3,990,693 | | 4,496,094 |
| | 1,000,000 | | (e) | Cell Genesys, Inc. 3.125% due 11-1-2011 | 893,636 | | 567,500 |
| | 1,550,000 | | (e) | Cell Genesys, Inc. 3.125% due 5-1-2013 | 1,392,396 | | 744,000 |
| | 2,500,000 | | | Cell Therapeutics, Inc. 4.00% due 7-1-2010 | 2,500,000 | | 2,500,000 |
| | 5,250,000 | | (c)(e) | Cell Therapeutics, Inc. 5.75% due 12-15-2011 | 5,006,210 | | 3,780,000 |
| | 14,887,000 | | (b)(e) | deCODE Genetics, Inc. 3.50% due 4-15-2011 | 8,638,613 | | 297,740 |
| | 6,600,000 | | | Endeavor International Corp. 6.00% due 1-15-2012 | 6,407,917 | | 5,907,000 |
| | 3,000,000 | | | Flotek Industries, Inc. 5.25% due 2-15-2028 | 803,037 | | 1,938,750 |
| | 1,000,000 | | | Human Genome Sciences, Inc. 2.25% due 10-15-2011 | 965,136 | | 1,580,000 |
| | 3,000,000 | | (c) | Isis Pharmaceuticals, Inc. 2.625% due 2-15-2027 | 2,775,663 | | 2,838,750 |
| | 1,060,000 | | | Isis Pharmaceuticals, Inc. 2.625% due 2-15-2027 | 1,052,495 | | 1,003,025 |
| | 8,400,000 | | | Mankind Corp. 3.75% due 12-15-2013 | 5,437,824 | | 5,113,500 |
| | 2,700,000 | | (b)(e) | Midway Games, Inc. 6.00% due 9-30-2025 | 2,532,792 | | 381,375 |
| | 1,762,892 | | (b) | Oscient Pharmaceuticals 12.50% due 1-15-2011 | 3,125,297 | | 167,475 |
| | 1,000,000 | | (c) | Titan International, 5.625% due 1-15-2017 | 990,000 | | 1,188,750 |
| | 2,000,000 | | | Unisource Energy Corp, 4.500% due 3-1-2035 | 1,970,000 | | 1,930,000 |
| | 7,000,000 | | (b)(c) | Vion Pharmaceuticals, Inc. 7.75% due 2-15-2012 | 6,785,890 | | 910,000 |
| | 1,920,000 | | (b) | Vion Pharmaceuticals, Inc. 7.75% due 2-15-2012 | 1,002,023 | | 249,600 |
| | | | | | | | 71,479,336 | | 49,373,421 |
| | | | Corporate Convertibles - France (0.82%) | | | |
| | | | | | | | | | |
| | 2,000,000 | | (c)(e) | EDAP TMS S.A. 9.00% due 10-30-2012 | 2,000,000 | | 1,800,000 |
| | | | | | | | | | |
| | | | | | | | | | |
| | | | | | Total Bonds | 126,606,160 | | 123,503,293 |
*See accompanying notes which are an integral part of these financial statements.
| BRUCE FUND, INC. |
| SCHEDULE OF INVESTMENTS - continued |
| June 30, 2010 |
| | | | | | | | | |
| | | | | | | | | |
| WARRANTS - (0.04%) | | | | | |
| No. of Shares | | Issue | | | Cost | | Fair Value |
| | 5,160 | | (a)(e) | Charter Communications, Inc., expires 11-30-2014 | $ 20,640 | | $ 20,640 |
| | 168,000 | | (a)(e) | EDAP, Inc., expires 10-30-2013 | - | | 63,000 |
| | | | | | Total Warrants | 20,640 | | 83,640 |
| | | | | | | | | | |
| RIGHTS - (0.01%) | | | | | | |
| | | | | | | | | | |
| | 200,000 | | (a)(e)(f) | Calpine Corp. Escrow Retirement Rights | - | | 20,000 |
| | | | | | | | | | |
| MONEY MARKET - (2.69%) | | | | |
| | | | | | | | | | |
| | 5,930,309 | | (d) | Fidelity Institutional Money Market Treasury Only - Class I, 0.01% | 5,930,309 | | 5,930,309 |
| | | | | | Total Money Market | 5,930,309 | | 5,930,309 |
| | | | | | | | | | |
| | | | | | | | | | |
| | | | | | Total Investments (99.14%) | $ 225,385,977 | | $ 218,670,224 |
| | | | | | | | | | |
| | | | | | Other assets less liabilities (0.86%) | | 1,896,842 |
| | | | | | | | | | |
| | | | | | TOTAL NET ASSETS (100.00%) | | | $ 220,567,066 |
| | | | | | | | | | |
| | | | (a) | Non-cash income producing security. | | | |
| | | | (b) | In default. | | | | |
| | | | (c) | Private Placement and restricted security under Rule 144A of the Securities Act of 1933. |
| | | | (d) | Variable rate securities; the money market rate shown represents the rate at June 30, 2010. |
| | | | (e) | This security is currently valued according to the fair value procedures approved by the Board of Directors. |
| | | | (f) | This security has no expiration date, it will convert to common stock at a future date. |
*See accompanying notes which are an integral part of these financial statements.
| BRUCE FUND, INC. | | | |
| Statement of Assets and Liabilities | | | |
| June 30, 2010 | | | |
| | | | |
| | | | |
| | | | |
| Assets | | | |
| Investments in securities, at market value (cost $225,385,977) | | $ | 218,670,224 | |
| Interest receivable | | | 1,658,338 | |
| Receivable for investments sold | | | 287 | |
| Dividends receivable | | | 154,290 | |
| Receivable for Fund shares sold | | | 514,325 | |
| Prepaid expenses | | | 16,429 | |
| Total Assets | | | 221,013,893 | |
| | | | | |
| Liabilities | | | | |
| Payable for investments purchased | | | 231,508 | |
| Payable for Fund shares redeemed | | | 40,733 | |
| Accrued advisory fees | | | 104,413 | |
| Other accrued expenses | | | 70,173 | |
| Total Liabilities | | | 446,827 | |
| | | | | |
| Net Assets | | $ | 220,567,066 | |
| | | | | |
| Net Assets consist of: | | | | |
| Capital stock (666,719 shares of $1 par value | | | | |
| capital stock issued and outstanding) | | $ | 666,719 | |
| Paid in capital | | | 249,188,257 | |
| Accumulated undistributed net investment income | | | 6,476,855 | |
| Accumulated net realized (loss) on investments | | | (29,049,012 | ) |
| Net unrealized depreciation on investments | | | (6,715,753 | ) |
| | | | | |
| Net Assets | | $ | 220,567,066 | |
| | | | | |
| Shares outstanding: 2,000,000 shares authorized | | | 666,719 | |
| | | | | |
| Net asset value, offering and redemption price per share | | $ | 330.82 | |
*See accompanying notes which are an integral part of these financial statements.
| BRUCE FUND, INC. | | | |
| Statement of Operations | | | |
| For the fiscal year ended June 30, 2010 | | | |
| | | | |
| | | | |
| Investment Income | | | |
| Interest income | | $ | 10,245,278 | |
| Dividend income (Net of foreign withholding taxes of $30,739) | | | 1,030,455 | |
| Total Income | | | 11,275,733 | |
| | | | | |
| Expenses | | | | |
| Investment adviser fee | | | 1,231,681 | |
| Transfer agent expense | | | 245,137 | |
| Administration expense | | | 169,870 | |
| Report printing expense | | | 47,831 | |
| Fund accounting expense | | | 62,060 | |
| Postage expense | | | 15,509 | |
| Audit expense | | | 28,985 | |
| Registration expense | | | 23,257 | |
| Custodian expense | | | 23,016 | |
| Trustee expense | | | 3,000 | |
| Insurance expense | | | 497 | |
| Miscellaneous expense | | | 24 | |
| Total Expenses | | | 1,850,867 | |
| Net Investment Income | | | 9,424,866 | |
| | | | | |
| | | | | |
| Realized & Unrealized Gain (Loss) | | | | |
| Net realized gain (loss) on investment securities | | | (21,665,197 | ) |
| Change in unrealized appreciation (depreciation) | | | | |
| on investment securities | | | 50,053,076 | |
| Net realized and unrealized gain (loss) on investment securities | | | 28,387,879 | |
| Net increase (decrease) in net assets resulting from operations | | $ | 37,812,745 | |
BRUCE FUND, INC.
NOTES TO THE FINANCIAL STATEMENTS
JUNE 30, 2010
NOTE A - ORGANIZATION
Bruce Fund, Inc. (the “Fund”) is a Maryland corporation incorporated on June 20, 1967. The Fund’s only business during the past five years has been as an investment company. The name of the Fund was changed to Bruce Fund, Inc., in October 1983. The Fund is an open end, diversified, management investment company and the Fund’s primary investment objective is long-term capital appreciation. The investment adviser to the Fund is Bruce and Co., Inc. (the “Adviser”).
NOTE B - SUMMARY OF SIGNIFICANT ACCOUNTING POLICIES
Estimates – The preparation of financial statements in conformity with accounting principles generally accepted in the United States of America requires management to make estimates and assumptions that affect the reported amounts of assets and liabilities and disclosure of contingent assets and liabilities at the date of the financial statements and the reported amounts of increases and decreases in net assets from operations during the reporting period. Actual results could differ from those estimates. The following is a summary of significant accounting policies followed by the Fund in the preparation of its financial statements.
Securities Valuation – All investments in securities are recorded at their estimated fair value as described in Note C.
Federal Income Taxes – The Fund makes no provision for federal income or excise tax. The Fund intends to qualify each year as a regulated investment company (“RIC”) under subchapter M of the Internal Revenue Code of 1986, as amended, by complying with the requirements applicable to RICs and by distributing substantially all of its taxable income. The Fund also intends to distribute sufficient net investment income and net capital gains, if any, so that it will not be subject to excise tax on undistributed income and gains. If the required amount of net investment income or gains is not distributed, the Fund could incur a tax expense.
As of and during the period ended June 30, 2010, the Fund did not have a liability for any unrecognized tax benefits. The Fund recognizes interest and penalties, if any, related to unrecognized tax benefits as income tax expense in the statement of operations. During the period, the Fund did not incur any interest or penalties. The Fund is subject to examination by U.S. federal tax authorities for tax year 2006.
Security Transactions and Related Income - The Fund follows industry practice and records security transactions on the trade date. The specific identification method is used for determining gains or losses for financial statements and income tax purposes. Dividend income is recorded on the ex-dividend date and interest income is recorded on an accrual basis. Discounts and premiums on securities purchased are amortized or accreted using the effective interest method. Withholding taxes on foreign dividends have been provided for in accordance with the Fund’s understanding of the applicable country’s tax rules and rates.
Dividends and Distributions – The Fund intends to distribute substantially all of its net investment income as dividends to its shareholders on at least an annual basis. The Fund intends to distribute its net realized long-term capital gains and its net realized short-term capital gains at least once a year. Distributions to shareholders, which are determined in accordance with income tax regulations, are recorded on the ex-dividend date. The treatment for financial reporting purposes of distributions made to shareholders during the year from net investment income or net realized capital gains may differ from their ultimate treatment for federal income tax purposes. These differences are caused primarily by differences in the timing of the recognition of certain components of income, expenses or realized capital gain for federal income tax purposes. Where such differences are permanent in nature, they are reclassified in the components of the net assets based on their ultimate characterization for federal income tax purposes. Any such reclassifications will have no effect on net assets, results of operations or net asset values per share of the Fund.
BRUCE FUND, INC.
NOTES TO THE FINANCIAL STATEMENTS – continued
JUNE 30, 2010
NOTE B - SUMMARY OF SIGNIFICANT ACCOUNTING POLICIES – continued
Subsequent Events – In accordance with accounting principles generally accepted in the United States of America (“GAAP”), management has evaluated subsequent events through the date these financial statements were issued and determined there were no material subsequent events, except as otherwise noted in these notes.
NOTE C. SUMMARY OF SECURITIES VALUATION AND FAIR VALUE MEASUREMENTS
In accordance with Accounting Standards Codification 820, “Fair Value Measurements and Disclosures” (“ASC 820”), fair value is defined as the price that the trust would receive upon selling an investment in a orderly transaction to an independent buyer in the principal or most advantageous market of the investment. ASC 820 established a three-tier hierarchy to maximize the use of the observable market data and minimize the use of unobservable inputs and to establish classification of the fair value measurements for disclosure purposes. Inputs refer broadly to the assumptions that market participants would use in pricing the asset or liability, including the technique or pricing model used to measure fair value and the risk inherent in the inputs to the valuation technique. Inputs may be observable or unobservabl e. Observable inputs are inputs that reflect the assumptions market participants would use in pricing the asset or liability, developed based on market data obtained from sources independent of the reporting entity. Unobservable inputs are inputs that reflect the reporting entity’s own assumptions about the assumptions market participants would use in pricing the asset or liability, developed based on the best information available in the circumstances. The three-tier hierarchy of inputs is summarized in the three broad levels. Level 1 which represents quoted prices in active markets for identical investments. Level 2 which represents fair value based on other significant observable inputs (including quoted prices for similar investments, interest
rates, prepayment speeds, credit risks, etc.). Level 3 which represents fair value based on significant unobservable inputs (including the trust’s own assumptions in determining the fair value of investments). At the Inception Date, all of the trust’s investments are classified as Level 2 as the securities are transacted through a dealer network.
Fair value is defined as the price that a Fund would receive upon selling an investment in a timely transaction to an independent buyer in the principal or most advantageous market of the investment. GAAP establishes a three-tier hierarchy to maximize the use of observable market data and minimize the use of unobservable inputs and to establish classification of fair value measurements for disclosure purposes.
Inputs refer broadly to the assumptions that market participants would use in pricing the asset or liability, including assumptions about risk (the risk inherent in a particular valuation technique used to measure fair value such as pricing model and/or the risk inherent in the inputs to the valuation technique). Inputs may be observable or unobservable. Observable inputs are inputs that reflect the assumptions market participants would use in pricing the asset or liability developed based on market data obtained from sources independent of the reporting entity. Unobservable inputs are inputs that reflect the reporting entity’s own assumptions about the assumptions market participants would use in pricing the asset or liability developed based on the best information available in the circumstances.
Various inputs are used in determining the value of the Fund’s investments. These inputs are summarized in the three broad levels listed below.
| · | Level 1 – quoted prices in active markets for identical securities |
| · | Level 2 – other significant observable inputs (including, but not limited to, quoted prices for an identical security in an inactive market, quoted prices for similar securities, interest rates, prepayment speeds, credit risk, etc.) |
| · | Level 3 – significant unobservable inputs (including the Fund’s own assumptions in determining fair value of investments based on the best information available) |
The inputs used to measure fair value may fall into different levels of the fair value hierarchy. In such cases, for disclosure purposes, the level in the fair value hierarchy within which the fair value measurement falls in its entirety, is determined based on the lowest level input that is significant to the fair value measurement in its entirety.
Equity securities, including common stocks, American depositary receipts, warrants, and rights, are generally valued by using market quotations, but may be valued on the basis of
BRUCE FUND, INC.
NOTES TO THE FINANCIAL STATEMENTS - continued
JUNE 30, 2010
NOTE C. SUMMARY OF Securities Valuation and Fair Value Measurements – continued
prices furnished by a pricing service when the Adviser believes such prices more accurately reflect the fair value of such securities. Securities that are traded on any stock exchange are generally valued by the pricing service at the last quoted sale price. Lacking a last sale price, an exchange traded security is generally valued by the pricing service at its last bid price. Securities traded in the NASDAQ over-the-counter market are generally valued by the pricing service at the NASDAQ Official Closing Price. When using the market quotations or close prices provided by the pricing service and when the market is considered active, the security will be classified as a Level 1 security. Sometimes, an equity security owned by the Fund will be valued by the pricing service with factors other th an market quotations or when the market is considered inactive. When this happens, the security will be classified as a Level 2 security. When market quotations are not readily available, when the Adviser determines that the market quotation or the price provided by the pricing service does not accurately reflect the current fair value, or when restricted or illiquid securities are being valued, such securities are valued as determined in good faith by the Adviser, in conformity with guidelines adopted by and subject to review by the Board. These securities will be categorized as Level 3 securities.
Investments in mutual funds, including money market mutual funds, are generally priced at the ending net asset value (NAV) provided by the service agent of the funds. These securities will be categorized as Level 1 securities.
Fixed income securities, including convertible preferred stocks, preferred stocks, U.S. government securities, municipal bonds, corporate bonds, and corporate convertible bonds, are valued using market quotations in an active market, will be categorized as Level 1 securities. However, they may be valued on the basis of prices furnished by a pricing service when the Adviser believes such prices more accurately reflect the fair value of such securities. A pricing service utilizes electronic data processing techniques based on yield spreads relating to securities with similar characteristics to determine prices for normal institutional-size trading units of debt securities without regard to sale or bid prices. These securities will generally be categorized as Level 2 securities. If the Adviser decides that a price provided by the pricing service does not accurately reflect the fair value of the securities, when prices are not readily available from a pricing service, or when restricted or illiquid securities are being valued, securities are valued at fair value as determined in good faith by the Adviser, in conformity with guidelines adopted by and subject to review of the Board. These securities will be categorized as Level 3 securities. The ability of issuers of debt securities held by the Fund to meet their obligations may be affected by economic and political developments in a specific country or region.
Short-term investments in fixed income securities, (those with maturities of less than 60 days when acquired, or which subsequently are within 60 days of maturity), are valued by using the amortized cost method of valuation, which the Board has determined will represent fair value. These securities will be classified as Level 2 securities.
BRUCE FUND, INC.
NOTES TO THE FINANCIAL STATEMENTS - continued
JUNE 30, 2010
NOTE C. SUMMARY OF SECURITIES VALUATION AND FAIR VALUE MEASUREMENTS – continued
The following is a summary of the inputs used to value the Fund’s assets as of June 30, 2010:
| | | | | | Valuation Inputs | | | | | | | |
| Assets | | Level 1 - Quoted Prices in Active Markets | | | Level 2 - Other Significant Observable Inputs | | | Level 3 - Significant Unobservable Inputs | | | Total | |
| | | | | | | | | | | | | |
| Common Stocks * | | $ | 81,600,341 | | | $ | - | | | $ | - | | | $ | 81,600,341 | |
| | | | | | | | | | | | | | | | | |
| American Depositary Receipts* | | | 2,277,766 | | | | | | | | - | | | | 2,277,766 | |
| Convertible Preferred Securities | | | - | | | | 2,431,625 | | | | - | | | | 2,431,625 | |
| | | | | | | | | | | | | | | | | |
| Restricted Convertible Preferred Securities | | | - | | | | 2,823,250 | | | | - | | | | 2,823,250 | |
| U.S. Government Bonds | | | - | | | | 35,808,570 | | | | - | | | | 35,808,570 | |
| | | | | | | | | | | | | | | | | |
| Municipal Bonds | | | - | | | | 1,270 | | | | - | | | | 1,270 | |
| | | | | | | | | | | | | | | | | |
| Corporate Bonds | | | - | | | | 25,400,782 | | | | - | | | | 25,400,782 | |
| | | | | | | | | | | | | | | | | |
| Restricted Corporate Bonds | | | - | | | | 11,119,250 | | | | - | | | | 11,119,250 | |
| | | | | | | | | | | | | | | | | |
| Corporate Convertible Bonds | | | - | | | | 29,147,319 | | | | 8,403,385 | | | | 37,550,704 | |
| | | | | | | | | | | | | | | | | |
| Restricted Corporate Convertible Bonds | | | - | | | | 8,042,717 | | | | 5,580,000 | | | | 13,622,717 | |
| | | | | | | | | | | | | | | | | |
| Warrants | | | - | | | | - | | | | 83,640 | | | | 83,640 | |
| | | | | | | | | | | | | | | | | |
| Rights | | | - | | | | - | | | | 20,000 | | | | 20,000 | |
| | | | | | | | | | | | | | | | | |
| Money Market | | | 5,930,309 | | | | - | | | | - | | | | 5,930,309 | |
| | | | | | | | | | | | | | | | | |
| Total | | $ | 89,808,416 | | | $ | 114,774,783 | | | $ | 14,087,025 | | | $ | 218,670,224 | |
| *Refer to the Schedule of Investments for industry classifications. | | | | | | | | | |
In the absence of a listed price quote, or a supplied price quote which is deemed to be unrepresentative of the actual market price, the Adviser shall use any or all of the following criteria to value Level 3 securities:
| · | Price given by pricing service |
| · | Last quoted bid & asked price |
| · | Third party bid & asked price |
| · | Indicated opening range |
BRUCE FUND, INC.
NOTES TO THE FINANCIAL STATEMENTS - continued
JUNE 30, 2010
NOTE C. SUMMARY OF SECURITIES VALUATION AND FAIR VALUE MEASUREMENTS – continued
Following is a reconciliation of assets in which significant unobservable inputs (Level 3) were used in determining fair value for the Fund:
| | | Balance as of June 30, 2009 | | | Realized gain (loss) | | | Amortization / Accretion | | | Change in unrealized appreciation (depreciation) | | | Net purchases (sales) | | | Transfers in and/or out of Level 3 | | | Balance as of June 30, 2010 | |
| | | | | | | | | | | | | | | | | | | | | | |
| Convertible Corporate Bonds | | $ | 8,970,785 | | | $ | (136,600 | ) | | $ | 101,989 | | | $ | 48,909 | | | $ | 570,937 | | | $ | (1,152,635 | ) | | $ | 8,403,385 | |
| | | | | | | | | | | | | | | | | | | | | | | | | | | | | |
| Restricted Convertible Corporate Bonds | | | 5,865,000 | | | | - | | | | 149,791 | | | | 816,209 | | | | | | | | (1,251,000 | ) | | | 5,580,000 | |
| | | | | | | | | | | | | | | | | | | | | | | | | | | | | |
| Warrants | | | 46,680 | | | | | | | | | | | | 16,320 | | | | | | | | 20,640 | | | | 83,640 | |
| | | | | | | | | | | | | | | | | | | | | | | | | | | | | |
| Rights | | | 20,000 | | | | - | | | | | | | | - | | | | - | | | | - | | | | 20,000 | |
| | | | | | | | | | | | | | | | | | | | | | | | | | | | | |
| Total | | $ | 14,902,465 | | | $ | (136,600 | ) | | $ | 251,780 | | | $ | 881,438 | | | $ | 570,937 | | | $ | (2,382,995 | ) | | $ | 14,087,025 | |
The total change in unrealized appreciation (depreciation) included in the Statement of Changes in Net Assetsattributable to Level 3 investments still held at June 30, 2010 was ($ 9,470,774).
| | | Total Change in Unrealized Appreciation (Depreciation) | |
| | | | |
| Convertible Corporate Bonds | | $ | (9,236,983 | ) |
| | | | | |
| Restricted Convertible Corporate Bonds | | | (254,791 | ) |
| | | | | |
| Warrants | | | 21,000 | |
| | | | | |
| Rights | | | - | |
| | | | | |
| Total | | $ | (9,470,774 | ) |
BRUCE FUND, INC.
NOTES TO THE FINANCIAL STATEMENTS - continued
JUNE 30, 2010
NOTE D - PURCHASES AND SALES OF SECURITIES
For the fiscal year ended June 30, 2010, purchases and sales of securities, other than short-term investments and short-term U.S. Government obligations were as follows:
| | | Purchases | | | Sales | |
| U.S. Government Obligations | | $ | - | | | $ | - | |
| Other | | | 36,501,932 | | | | 21,971,047 | |
At June 30, 2010, the net unrealized depreciation on investments for tax purposes was as follows:
| Gross Appreciation | | $ | 49,009,198 | |
| Gross (Depreciation) | | | (75,186,282 | ) |
| | | | | |
| Net (Depreciation) | | | | |
| on Investments | | $ | (26,177,084 | ) |
At June 30, 2010, the aggregate cost of securities for federal income tax purposes was $244,847,308
NOTE E - RELATED PARTIES
Bruce and Co., an Illinois corporation, is the investment adviser of the Fund and furnishes investment advice. In addition, it provides office space and facilities and pays the cost of all prospectuses and financial reports (other than those mailed to current shareholders). Compensation to the Adviser for its services under the Investment Advisory Contract is paid monthly based on the following:
| Annual Percentage Fee | Applied to Average Net Assets of Fund |
| 1.00% | Up to $20,000,000; plus |
| 0.60% | $20,000,000 to $100,000,000; plus |
| 0.50% | over $100,000,000. |
At June 30, 2010, Robert B. Bruce was the beneficial owner of 16,358 Fund shares, R. Jeffrey Bruce was the beneficial owner of 5,526 Fund shares, Robert DeBartolo was the beneficial owner of 171 Fund shares, and W. Martin Johnson was the beneficial owner of 4 Fund shares. Robert B. Bruce, Robert DeBartolo, and W. Martin Johnson are directors of the Fund; both Robert B. Bruce and R. Jeffrey Bruce are officers of the Fund and are officers, directors and owners of the Adviser.
BRUCE FUND, INC.
NOTES TO THE FINANCIAL STATEMENTS - continued
JUNE 30, 2010
NOTE F - DIVIDEND DISTRIBUTION
On December 21, 2009, the Fund paid a dividend from net investment income of $12.3318 per share or $7,993,838 for shareholders of record on December 18, 2009.
The tax character of distributions paid during fiscal years 2010 and 2009 was as follows:
| | | 2010 | | | 2009 | |
| Distributions paid from: | | | | | | |
| Ordinary Income | | $ | 7,993,838 | | | $ | 7,692,453 | |
| Short-Term Capital Gain | | | - | | | | - | |
| Long-Term Capital Gain | | | - | | | | 2,723,394 | |
| | | | | | | | | |
| | | $ | 7,993,838 | | | $ | 10,415,847 | |
At June 30, 2010, the components of distributable earnings (accumulated losses) on a tax basis were as follows:
| Undistributed Ordinary Income | | $ | 6,514,830 | |
| Capital Loses Carryforward | | | (9,837,977 | ) |
| Unrealized Depreciation | | | (26,177,084 | ) |
| | | | | |
| | | $ | (29,500,231 | ) |
At June 30, 2010, the difference between book basis and tax basis unrealized appreciation (depreciation) is attributable to the deferral of post-October losses in the amount of $19,461,332.
NOTE G - CAPITAL LOSS CARRYFORWARD
At June 30, 2010, the Fund has available for federal tax purposes an unused capital loss carryforward of $9,837,977 which is available for offset against future taxable net capital gains. This loss carryforward expires on June 30, 2017 through June 30, 2018 as shown in the table below. To the extent these carryforwards are used to offset future capital gains, it is probable that the amount, which is offset, will not be distributed to shareholders.
| | | | | |
| | | | | |
| Amount | | | Expires June 30, | |
| | | | | |
| $ | 1,832,182 | | | | 2017 | |
| | 8,005,795 | | | | 2018 | |
NOTE H - RESTRICTED SECURITIES
The Fund has acquired several securities, the sale of which is restricted, through private placements. At June 30, 2010, the aggregate market value of such securities amounted to $27,565,217 or 12.50% of the Fund’s net assets. 80% of the restricted securities are valued using quoted market prices. The other 20% are valued according to fair value procedures approved by the Board of Directors. It is possible that the estimated value may differ significantly from the amount that might ultimately be realized in the near term, and the difference could be material.
BRUCE FUND, INC.
NOTES TO THE FINANCIAL STATEMENTS - continued
JUNE 30, 2010
NOTE I - FEDERAL TAX INFORMATION
The form 1099-DIV you receive in January 2011 will show the tax status of all distributions paid to your account in the calendar year 2010. Shareholders are advised to consult their own tax adviser with respect to the tax consequences of their investment in the Fund. As required by the Internal Revenue Code regulations, shareholders must be notified within 60 days of the Fund’s fiscal year end regarding the status of qualified dividend income for individuals and the dividends received deduction for corporations.
Qualified Dividend Income. The Fund designates 13.42% of the dividends paid as qualified dividend income eligible for the reduced rate of 15% pursuant to the Internal Revenue Code.
Dividend Received Deduction. Corporate shareholders are generally entitled to take the dividends received deduction on the portion of the Fund’s dividend distribution that qualifies under tax law. For the Fund’s fiscal 2010 ordinary income dividends, 13.42% qualifies for the corporate dividends received deduction.
Directors and Officers
The Fund is managed by its officers and directors. It has no advisory board, and no standing committees of the board of directors. Directors serve until the successor of each shall have been duly elected and shall have qualified. Independent Directors constitute a majority of the board.
The following table provides information regarding the Independent Directors:
| Name, Address*, (Age), Position with Fund**, Term of Position with Fund | Principal Occupation During Past 5 Years and Other Directorships |
Ward M. Johnson (73) Independent Director, December 1985 to present | 2002 to present - Real Estate Sales, Landings Co. |
Robert DeBartolo (50) Independent Director, March 2007 to present | 2009 to present – Senior Director, Goble and Associates 2008 to 2009 – Vice President, Client Engagements, Cadient Group 2000 to 2008 – Managing Director, Executive Vice President, Corbett Accel Healthcare Group, Omnicom |
* The address for each director is 20 North Wacker Drive, Suite 2414, Chicago, Illinois 60606.
** The Fund consists of one series. The Fund is not part of a Fund Complex.
The following table provides information regarding each Director who is an “interested person” of the Fund, as defined in the 1940 Act, and each officer of the Fund.
| Name, Address*, (Age), Position with Fund,** Term of Position with Fund | Principal Occupation During Past 5 Years and Other Directorships |
Robert B. Bruce*** (78) Chairman, Director, President, and Treasurer, 1983 to present; Chief Compliance Officer, 2004 to present | l974 to present - principal, Bruce and Co. (investment adviser); l982 to present - Chairman of Board of Directors, Treasurer, Professional Life & Casualty Company (life insurance issuer), previously Assistant Treasurer. |
R. Jeffrey Bruce*** (50) Vice President and Secretary, 1983 to present | 1983 to present – analyst/manager, Bruce and Co. (investment adviser); 1993 to present – Director, Professional Life & Casualty Company (life insurance issuer) |
* The address for each of the directors and officers is 20 North Wacker Drive, Suite 2414, Chicago, Illinois 60606.
** The Fund consists of one series. The Fund is not part of a Fund Complex.
*** Mr. Robert Bruce and Mr. Jeffrey Bruce are “interested” persons because they are officers, directors, and owners of the Adviser. Robert Bruce is the father of Jeffrey Bruce.
The Fund’s Statement of Additional Information (“SAI”) includes information about the directors and is available, without charge, upon request. You may call toll-free (800) 872-7823 to request a copy of the SAI or to make shareholder inquiries.
PROXY VOTING
A description of the policies and procedures that the Fund uses to determine how to vote proxies relating to portfolio securities and information regarding how the Fund voted those proxies during the most recent twelve month period ended June 30 are available without charge upon request by (1) calling the Fund at (800) 872-7823 and (2) from Fund documents filed with the Securities and Exchange Commission ("SEC") on the SEC's website at www.sec.gov.
BRUCE FUND
OFFICERS AND
DIRECTORS
Robert B. Bruce
President and Treasurer
R. Jeffrey Bruce
Vice President and Secretary
Robert DeBartolo
Director
W. Martin Johnson
Director
Investment Adviser
Bruce and Co., Inc.
Chicago, Illinois
Custodian
Huntington National Bank
Columbus, Ohio
Transfer Agent
Unified Fund Services, Inc.
Indianapolis, Indiana
Counsel
Thomas P. Ward
Lake Forest, Illinois
Independent Registered Public Accounting Firm
Grant Thornton LLP
Chicago, Illinois
This report is intended only for the information of shareholders or those who have received the Fund’s prospectus which contains information about the Fund’s management fees and expenses. Please read the prospectus carefully before investing.
Item 2. Code of Ethics.
(a) As of the end of the period covered by this report, the registrant has adopted a code of ethics that applies to the registrant's principal executive officer, principal financial officer, principal accounting officer or controller, or persons performing similar functions, regardless of whether these individuals are employed by the registrant or a third party.
(b) For purposes of this item, “code of ethics” means written standards that are reasonably designed to deter wrongdoing and to promote:
| | (1) | Honest and ethical conduct, including the ethical handling of actual or apparent conflicts of interest between personal and professional relationships; |
| | (2) | Full, fair, accurate, timely, and understandable disclosure in reports and documents that a registrant files with, or submits to, the Commission and in other public communications made by the registrant; |
(3) Compliance with applicable governmental laws, rules, and regulations;
| | (4) | The prompt internal reporting of violations of the code to an appropriate person or persons identified in the code; and |
(5) Accountability for adherence to the code.
(c) Amendments: During the period covered by the report, there have not been any amendments to the provisions of the code of ethics.
(d) Waivers: During the period covered by the report, the registrant has not granted any express or implicit waivers from the provisions of the code of ethics.
(e) Posting: We do not intend to post the Code of Ethics for the Officers or any amendments or waivers on a website.
(f) Availability: The Code of Ethics for the Officers can be obtained, free of charge by calling the toll free number for the appropriate Fund.
Item 3. Audit Committee Financial Expert.
(a) The registrant’s board of directors has determined that the registrant does not have an audit financial expert. The directors determined that, although none of its members meet the technical definition of an audit expert, the group has sufficient financial expertise to adequately perform its duties.
| | Bruce Fund | Registrant |
| | FY 2010 | $ 29,458 |
| | FY 2009 | $ 26,320 |
| | Bruce Fund | Registrant | |
| | FY 2010 | $ 0 | |
| | FY 2009 | $ 0 | |
| | Nature of the fees: | | |
| | Bruce Fund | Registrant | |
| | FY 2010 | $ 5,250 | |
| | FY 2009 | $ 4,425 | |
| | Nature of the fees: | preparation of the 1120 RIC | |
| | Bruce Fund | Registrant | |
| | FY 2010 | $0 | |
| | FY 2009 | $0 | |
| | Nature of the fees: | | |
| (e) | (1) | Board Audit Policies |
The Board of Directors are responsible for the selection, retention or termination of auditors and, in connection therewith, to (i) evaluate the proposed fees and other compensation, if any, to be paid to the auditors, (ii) evaluate the independence of the auditors, (iii) receive the auditors’ specific representations as to their independence;
| | (2) | Percentages of Services Billed Pursuant to Waiver of Pre-Approved Requirement |
| Registrant |
| Audit-Related Fees: | 0% |
| Tax Fees: | 0 % |
| All Other Fees: | 0 % |
(f) During audit of registrant's financial statements for the most recent fiscal year, less than 50 percent of the hours expended on the principal accountant's engagement were attributed to work performed by persons other than the principal accountant's full-time, permanent employees.
(g) The aggregate non-audit fees billed by the registrant's accountant for services rendered to the registrant, and rendered to the registrant's investment adviser (not including any sub-adviser whose role is primarily portfolio management and is subcontracted with or overseen by another investment adviser), and any entity controlling, controlled by, or under common control with the adviser that provides ongoing services to the registrant:
(h) Not applicable. The auditor performed no services for the registrant’s investment adviser or any entity controlling, controlled by, or under common control with the investment adviser that provides ongoing services to the registrant.
Item 5. Audit Committee of Listed Companies. Not applicable.
Item 6. Schedule of Investments. Not applicable – schedule filed with Item 1.
Item 7. Disclosure of Proxy Voting Policies and Procedures for Closed-End Funds. Not applicable.
Item 8. Portfolio Managers of Closed-End Management Investment Companies. Not applicable.
Item 9. Purchases of Equity Securities by Closed-End Management Investment Company and Affiliated Purchasers. Not applicable.
Item 10. Submission of Matters to a Vote of Security Holders
The registrant has not adopted procedures by which shareholders may recommend nominees to the registrant’s board of directors.
Item 11. Controls and Procedures.
(a) Based on an evaluation of the registrant’s disclosure controls and procedures as of a date within 90 days of the filing date of this Form N-CSR, disclosure controls and procedures are reasonably designed to ensure that the information required in filings on Forms N-CSR is recorded, processed, summarized, and reported on a timely basis.
(b) There were no significant changes in the registrant’s internal control over financial reporting that occurred during the registrant’s second fiscal quarter of the period covered by this report that has materially affected, or is reasonably likely to materially affect, the registrant’s internal control over financial reporting.
Item 12. Exhibits.
(a)(1) Code of ethics is filed herewith.
| (a)(2) | Certifications by the registrant's principal executive officer and principal financial officer, pursuant to Section 302 of the Sarbanes- Oxley Act of 2002 and required by Rule 30a-2under the Investment Company Act of 1940 are filed herewith. |
(a)(3) Not Applicable – there were no written solicitations to purchase securities under Rule 23c-1 during the period
| (b) | Certification pursuant to 18 U.S.C. Section 1350, as adopted pursuant to Section 906 of the Sarbanes-Oxley Act of 2002 is filed herewith. |
SIGNATURES
Pursuant to the requirements of the Securities Exchange Act of 1934 and the Investment Company Act of 1940, the registrant has duly caused this report to be signed on its behalf by the undersigned, thereunto duly authorized.
(Registrant) Bruce Fund, Inc.
By /s/ Robert B. Bruce
Robert B. Bruce, President
Date 09/08/10
Pursuant to the requirements of the Securities Exchange Act of 1934 and the Investment Company Act of 1940, this report has been signed below by the following persons on behalf of the registrant and in the capacities and on the dates indicated.
By /s/ Robert B. Bruce &# 160;
Robert B. Bruce, President
Date 09/08/10
By /s/ R. Jeffery Bruce
R. Jeffery Bruce, Principal Accounting Officer
Date 09/08/10