UNITED STATES
SECURITIES AND EXCHANGE COMMISSION
Washington, D.C. 20549
FORM N-CSR
CERTIFIED SHAREHOLDER REPORT OF REGISTERED MANAGEMENT
INVESTMENT COMPANIES
Investment Company Act file number 811-01528
Bruce Fund, Inc.
(Exact name of registrant as specified in charter)
20 North Wacker Drive, Suite 2414
Chicago, IL 60606
(Address of principal executive offices) (Zip code)
R. Jeffrey Bruce
Bruce and Co.
20 North Wacker Drive, Suite 2414
Chicago, IL 60606
(Name and address of agent for service)
Registrant’s telephone number, including area code: 312-236-9160
Date of fiscal year end: 06/30
Date of reporting period: 06/30/14
Form N-CSR is to be used by management investment companies to file reports with the Commission not later than 10 days after the transmission to stockholders of any report that is required to be transmitted to stockholders under Rule 30e-1 under the Investment Company Act of 1940 (17 CFR 270.30e-1). The Commission may use the information provided on Form N-CSR in its regulatory, disclosure review, inspection and policymaking roles.
A registrant is required to disclose the information specified by Form N-CSR, and the Commission will make this information public. A registrant is not required to respond to the collection of information contained in Form N-CSR unless the Form displays a currently valid Office of Management and Budget (“OMB”) control number. Please direct comments concerning the accuracy of the information collection burden estimate and any suggestions for reducing the burden to Secretary, Securities and Exchange Commission, 450 Fifth Street, NW, Washington, DC 20549-0609. The OMB has reviewed this collection of information under the clearance requirements of 44 U.S.C. § 3507.
Item 1. Reports to Stockholders.
2014
BRUCE FUND, INC.
ANNUAL
REPORT
Report to Shareholders
June 30, 2014
20 North Wacker Drive — Suite 2414 — Chicago, Illinois 60606 — (312) 236-9160
Management’s Discussion and Analysis (Unaudited)
The Bruce Fund (the “Fund”) shares produced a total return of 31.64% for the year ended June 30, 2014, compared to a total return of 24.61% for the S&P 500 Index for the same period. The Government bonds advanced in the period along with gains the Fund’s convertible bonds, common and preferred stocks which helped the Fund’s performance in the period. The Fund’s straight corporate bonds also gained as interest rates declined during the year.
We continue to believe that the economy is fragile and prone to weaker than expected activity. Government interventions and actions have embedded the financial markets with a high degree of risk and we believe caution is warranted. While longer term inflationary pressures are inevitable, currently we feel asset deflation remains a risk. Thus the Fund’s investment posture, our Treasury positions and cash, is still warranted.
Management continues to screen investment opportunities for their long-term capital appreciation potential versus the risks that investment might present. The bonds as well as the stocks in the portfolio encompass significant investment risks, which should be reviewed in the prospectus.
Shareholders are invited to use the toll-free number (800) 872-7823 to obtain any Fund information (including the proxy voting record), or can visit www.thebrucefund.com, to obtain the same.
1
Investment Results (Unaudited)
Returns for the Periods Ended June 30, 2014
| | | | | | | | | | | | |
| | | Cumulative | | | Average Annual | |
| Fund/Index | | 1 Year | | | 5 Year | | | 10 Year | |
Bruce Fund | | | 31.64% | | | | 17.69% | | | | 11.36% | |
S&P 500® Index* | | | 24.61% | | | | 18.83% | | | | 7.78% | |
The gross expense ratio as of the most recent prospectus dated October 28, 2013 was 0.78%,
which represented the fiscal year ended June 30, 2013. | |
The performance quoted represents past performance, which does not guarantee future results. The investment return and principal value of an investment will fluctuate so that an investor’s shares, when redeemed, may be worth more or less than their original cost. The returns shown do not reflect deduction of taxes that a shareholder would pay on Fund distributions or the redemption of Fund shares. Current performance of the Fund may be lower or higher than the performance quoted. The Fund’s investment objectives, risks, charges and expenses must be considered carefully before investing. Performance data current to the most recent month end may be obtained by calling 1-800-872-7823.
* The S&P 500® Index is an unmanaged benchmark that assumes reinvestment of all distributions and excludes the effect of taxes and fees. The Index is a widely recognized unmanaged index of equity prices and is representative of a broader market and range of securities than is found in the Fund’s portfolio. Individuals cannot invest directly in the Index; however, an individual can invest in exchange-traded funds or other investment vehicles that attempt to track the performance of a benchmark index.
The Fund’s investment objectives, risks, charges and expenses must be considered carefully before investing. The prospectus contains this and other important information about the investment company and may be obtained by calling the same number as above. Please read it carefully before investing.
The Fund is distributed by Unified Financial Securities, Inc. Member FINRA.
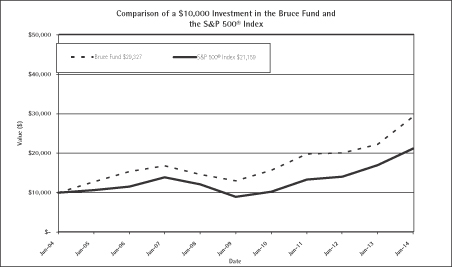
The chart above assumes an initial investment of $10,000 made on June 30, 2004 and held through June 30, 2014. THE FUND’S RETURN REPRESENTS PAST PERFORMANCE AND DOES NOT GUARANTEE FUTURE RESULTS. The returns shown do not reflect deduction of taxes that a shareholder would pay on Fund distributions or the redemption of Fund shares. Investment returns and principal values will fluctuate so that your shares, when redeemed, may be worth more or less than their original purchase price.
Current performance may be lower or higher than the performance data quoted. For more information on the Bruce Fund, and to obtain performance data current to the most recent month end, please call 1-800-872-7823. Investing in the Fund involves certain risks that are discussed in the Fund’s prospectus. Please read the prospectus carefully before you invest or send money.
The Fund is distributed by Unified Financial Securities, Inc. Member FINRA.
2
Fund Holdings (Unaudited)
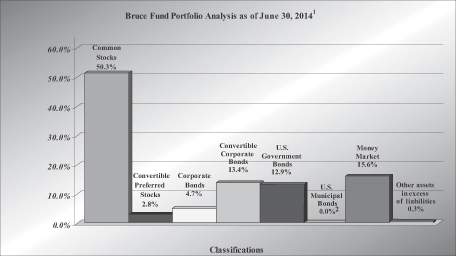
| 1 | | As a percent of net assets. |
| 2 | | Ratio rounds to less than 0.005%. |
Investment Objective
The investment objective of the Bruce Fund is long-term capital appreciation.
Availability of Portfolio Schedule
The Fund files its complete schedule of portfolio holdings with the Securities and Exchange Commission (“SEC”) for the first and third quarters of each fiscal year on Form N-Q. The Fund’s Form N-Qs are available at the SEC’s website www.sec.gov. The Fund’s Form N-Qs are also available by calling the Fund at (800) 872-7823. The Fund’s Form N-Qs may be reviewed and copied at the Public Reference Room in Washington D.C. Information on the operation of the Public Reference Room may be obtained by calling 1-800-SEC-0330.
3
Shareholder Expense Example (Unaudited)
As a shareholder of the Fund, you incur ongoing costs, including management fees and other Fund expenses. This example is intended to help you understand your ongoing costs (in dollars) of investing in the Fund and to compare these costs with the ongoing costs of investing in other mutual funds. The example is based on an investment of $1,000 invested at the beginning of the period (January 1, 2014) and held for the entire period (through June 30, 2014).
Actual Expenses
The first line of the table below provides information about actual account values and actual expenses. You may use the information in this line, together with the amount you invested, to estimate the expenses that you paid over the period. Simply divide your account value by $1,000 (for example, an $8,600 account value divided by $1,000 = $8.60), then multiply the result by the number in the first line under the heading entitled “Expenses Paid During the Period” to estimate the expenses you paid on your account during this period.
Hypothetical Example for Comparison Purposes
The second line of the table below provides information about hypothetical account values and hypothetical expenses based on the Fund’s actual expense ratio and an assumed rate of return of 5% per year before expenses, which is not the Fund’s actual return. The hypothetical account values and expenses may not be used to estimate the actual ending account balance or expenses you paid for the period. You may use this information to compare the ongoing costs of investing in the Fund and other funds. To do so, compare this 5% hypothetical example with the 5% hypothetical examples that appear in the shareholder reports of the other funds.
Please note that the expenses shown in the table are meant to highlight your ongoing costs only and do not reflect any transactional costs, such as redemption fees. Therefore, the second line of the table is useful in comparing ongoing costs only, and will not help you determine the relative total costs of owning different funds. In addition, if these transactional costs were included, your costs would have been higher.
| | | | | | | | | | | | |
| | | Beginning
Account
Value | | | Ending
Account
Value | | | Expenses
Paid During
Period* | |
| | | January 1, 2014 | | | June 30, 2014 | | | January 1 –
June 30, 2014 | |
Bruce Fund | | | | | | | | | | | | |
Actual | | $ | 1,000.00 | | | $ | 1,174.20 | | | $ | 3.72 | |
Hypothetical** | | $ | 1,000.00 | | | $ | 1,021.38 | | | $ | 3.45 | |
| * | | Expenses are equal to the Fund’s six month annualized expense ratio of 0.69%, multiplied by the average account value over the period, multiplied by 181/365 (to reflect the partial year period). |
| ** | | Assumes a 5% return before expenses. |
4
Schedule of Investments
June 30, 2014
| | | | | | | | |
| Shares | | | | | Value | |
| | COMMON STOCKS – 50.3% | | | | |
| | |
| | | | Consumer Discretionary 4.1% | | | | |
| | 1,835,100 | | | AirBoss of America Corp. | | $ | 15,833,059 | |
| | 75,000 | | | DIRECTV, Class A* | | | 6,375,750 | |
| | | | | | | | |
| | | | | | | 22,208,809 | |
| | | | | | | | |
| | | | Consumer Staples 4.3% | | | | |
| | 100,000 | | | Bunge Ltd. | | | 7,564,000 | |
| | 259,000 | | | Diamond Foods, Inc.* | | | 7,303,800 | |
| | 600,000 | | | Omega Protein Corp.* | | | 8,208,000 | |
| | | | | | | | |
| | | | | | | 23,075,800 | |
| | | | | | | | |
| | | | Energy 1.6% | | | | |
| | 291,255 | | | Admiral Bay Resources, Inc.(a)(b)* | | | 8,738 | |
| | 200,000 | | | C&J Energy Services, Inc.* | | | 6,756,000 | |
| | 156,919 | | | Escalera Resources Co.* | | | 413,482 | |
| | 182,168 | | | SandRidge Energy, Inc.* | | | 1,302,501 | |
| | | | | | | | |
| | | | | | | 8,480,721 | |
| | | | | | | | |
| | | | Financials 5.6% | | | | |
| | 250,000 | | | Allstate Corp./The | | | 14,680,000 | |
| | 211,502 | | | GAINSCO, Inc.* | | | 2,220,771 | |
| | 130,000 | | | ICG Group, Inc.* | | | 2,714,400 | |
| | 131,252 | | | Phoenix Companies, Inc./The* | | | 6,351,284 | |
| | 90,000 | | | RLI Corp. | | | 4,120,200 | |
| | | | | | | | |
| | | | | | | 30,086,655 | |
| | | | | | | | |
| | | | Health Care 8.1% | | | | |
| | 124,500 | | | Abbott Laboratories | | | 5,092,050 | |
| | 124,500 | | | AbbVie, Inc. | | | 7,026,780 | |
| | 155,677 | | | Agenus, Inc.* | | | 501,280 | |
| | 631,746 | | | Durect Corp.* | | | 1,149,778 | |
| | 1,113,694 | | | EDAP TMS S.A. ADR* | | | 5,546,196 | |
| | 200,000 | | | Merck & Co., Inc. | | | 11,570,000 | |
| | 9,926 | | | Perrigo Co. PLC | | | 1,446,814 | |
| | 350,000 | | | Pfizer, Inc. | | | 10,388,000 | |
| | 3,170 | | | Prothena Corp PLC* | | | 71,484 | |
| | 100,000 | | | Supernus Pharmaceuticals, Inc.* | | | 1,095,000 | |
| | | | | | | | |
| | | | | | | 43,887,382 | |
| | | | | | | | |
| | | | Industrials 13.1% | | | | |
| | 203,665 | | | AMERCO | | | 59,217,635 | |
| | 1,070,073 | | | Astrotech Corp.* | | | 3,402,832 | |
| | 425,000 | | | Titan International, Inc. | | | 7,148,500 | |
| | 25,300 | | | US Ecology, Inc. | | | 1,238,435 | |
| | | | | | | | |
| | | | | | | 71,007,402 | |
| | | | | | | | |
| | | | Information Technology 3.0% | | | | |
| | 90,000 | | | International Business Machines Corp. | | | 16,314,300 | |
| | | | | | | | |
See accompanying notes which are an integral part of the financial statements.
5
Schedule of Investments (continued)
June 30, 2014
| | | | | | | | |
Shares/
Principal
Amount | | | | | Value | |
| | COMMON STOCKS – (continued) | | | | |
| | |
| | | | Materials 5.3% | | | | |
| | 25,000 | | | Ashland, Inc. | | $ | 2,718,500 | |
| | 690,671 | | | Flotek Industries, Inc.* | | | 22,211,979 | |
| | 150,000 | | | Intrepid Potash, Inc.* | | | 2,514,000 | |
| | 280,000 | | | Kinross Gold Corp.* | | | 1,159,200 | |
| | 199,270 | | | Solitario Exploration & Royalty Corp.* | | | 263,036 | |
| | | | | | | | |
| | | | | | | 28,866,715 | |
| | | | | | | | |
| | | | Utilities 5.2% | | | | |
| | 296,212 | | | Calpine Corp.* | | | 7,052,808 | |
| | 20,000 | | | Integrys Energy Group, Inc. | | | 1,422,600 | |
| | 100,000 | | | NextEra Energy, Inc. | | | 10,248,000 | |
| | 50,000 | | | Pepco Holdings, Inc. | | | 1,374,000 | |
| | 136,212 | | | UNS Energy Corp. | | | 8,228,567 | |
| | | | | | | | |
| | | | | | | 28,325,975 | |
| | | | | | | | |
| | | | Total Common Stocks (Cost $153,502,046) | | | 272,253,759 | �� |
| | | | | | | | |
| |
| | CONVERTIBLE PREFERRED STOCKS – 2.8% | | | | |
| | |
| | | | Consumer Staples 0.5% | | | | |
| | 27,400 | | | Bunge Ltd., 4.875% | | | 2,848,230 | |
| | | | | | | | |
| | | | Energy 2.2% | | | | |
| | 181,500 | | | PetroQuest Energy, Inc., Series B, 6.875% | | | 8,285,475 | |
| | 29,200 | | | SandRidge Energy, Inc., 8.500% | | | 3,299,600 | |
| | | | | | | | |
| | | | | | | 11,585,075 | |
| | | | | | | | |
| | | | Utilities 0.1% | | | | |
| | 10,000 | | | AES Trust III, 6.750% | | | 522,500 | |
| | | | | | | | |
| | | | Total Convertible Preferred Stocks (Cost $12,277,136) | | | 14,955,805 | |
| | | | | | | | |
| |
| | CORPORATE BONDS – 4.7% | | | | |
| | |
| | | | Consumer Discretionary 0.3% | | | | |
| $ | 1,500,000 | | | Land O’Lakes Capital Trust I, 7.450%, 3/15/28(c) | | | 1,518,750 | |
| | | | | | | | |
| | | | Energy 1.0% | | | | |
| | 36,220,000 | | | ATP Oil & Gas Corp., 11.875%, 5/1/15(d) | | | 565,937 | |
| | 3,900,000 | | | Endeavour International Corp., 12.000%, 3/1/18 | | | 3,588,000 | |
| | 2,000,000 | | | Gevo, Inc., 7.500%, 7/1/22 | | | 1,348,750 | |
| | | | | | | | |
| | | | | | | 5,502,687 | |
| | | | | | | | |
| | | | Financials 1.3% | | | | |
| | 6,000,000 | | | Security Benefit Life Insurance Co., 7.450%, 10/1/33(b)(c) | | | 6,900,000 | |
| | | | | | | | |
| | | | Utilities 2.1% | | | | |
| | 4,000,000 | | | Constellation Energy Group, Inc., 7.600%, 4/1/32 | | | 5,347,640 | |
| | 5,000,000 | | | GenOn Americas Generation LLC, 9.125%, 5/1/31 | | | 5,162,500 | |
| | 1,000,000 | | | Oneok, Inc., 6.000%, 6/15/35 | | | 1,019,798 | |
| | | | | | | | |
| | | | | | | 11,529,938 | |
| | | | | | | | |
| | | | Total Corporate Bonds (Cost $27,799,595) | | | 25,451,375 | |
| | | | | | | | |
See accompanying notes which are an integral part of the financial statements.
6
Schedule of Investments (continued)
June 30, 2014
| | | | | | | | |
Shares/
Principal
Amount | | | | | Value | |
| | CONVERTIBLE CORPORATE BONDS – 13.4% | |
| | |
| | | | Consumer Discretionary 0.9% | | | | |
| $ | 2,500,000 | | | Sirius XM Radio, Inc., 7.000%, 12/1/14(c) | | $ | 4,760,937 | |
| | | | | | | | |
| | | | Energy 1.4% | | | | |
| | 3,000,000 | | | BPZ Resources, Inc., 6.500%, 3/1/15 | | | 3,073,125 | |
| | 8,150,000 | | | Endeavour International Corp., 5.500%, 7/15/16 | | | 4,156,500 | |
| | | | | | | | |
| | | | | | | 7,229,625 | |
| | | | | | | | |
| | | | Health Care 10.8% | | | | |
| | 13,188,165 | | | deCODE Genetics, Inc., 3.500%, 4/15/11(a)(b)(d) | | | 461,586 | |
| | 1,500,000 | | | InterMune, Inc., 5.000%, 3/1/15 | | | 3,559,687 | |
| | 4,500,000 | | | InterMune, Inc., 2.500%, 12/15/17 | | | 15,519,375 | |
| | 21,690,000 | | | MannKind Corp., 5.750%, 8/15/15 | | | 35,571,600 | |
| | 1,762,892 | | | Oscient Pharmaceuticals Corp., 12.500%, 1/15/11(a)(b)(d) | | | 35,258 | |
| | 1,500,000 | | | Supernus Pharmaceuticals, Inc., 7.500%, 5/1/19(c) | | | 3,271,875 | |
| | | | | | | | |
| | | | | | | 58,419,381 | |
| | | | | | | | |
| | | | Industrials 0.3% | | | | |
| | 1,000,000 | | | Titan International, Inc., 5.625%, 1/15/17(c) | | | 1,787,500 | |
| | | | | | | | |
| | | | Total Convertible Corporate Bonds (Cost $53,975,703) | | | 72,197,443 | |
| | | | | | | | |
| |
| | U.S. GOVERNMENT BONDS 12.9% | | | | |
| | 30,000,000 | | | U.S. Treasury “Strips”, 2.490%, 8/15/28(e) | | | 19,634,250 | |
| | 30,000,000 | | | U.S. Treasury “Strips”, 2.330%, 8/15/29(e) | | | 18,885,570 | |
| | 20,000,000 | | | U.S. Treasury “Strips”, 1.720%, 2/15/36(e) | | | 9,878,880 | |
| | 20,000,000 | | | U.S. Treasury “Strips”, 1.370%, 2/15/41(e) | | | 8,141,180 | |
| | 35,000,000 | | | U.S. Treasury “Strips”, 1.310%, 5/15/42(e) | | | 13,421,870 | |
| | | | | | | | |
| | | | Total U.S. Government Bonds (Cost $58,988,168) | | | 69,961,750 | |
| | | | | | | | |
| |
| | U.S. MUNICIPAL BONDS 0.0% | | | | |
| | 972,551 | | | Indianapolis Airport Authority, 6.500%, 11/15/31(a)(d) | | | 9,726 | |
| | | | | | | | |
| | | | Total U.S. Municipal Bonds (Cost $162,383) | | | 9,726 | |
| | | | | | | | |
| |
| | MONEY MARKET – 15.6% | | | | |
| | 84,267,710 | | | Fidelity Institutional Money Market Treasury Only – Class I, 0.010%(f) | | | 84,267,710 | |
| | | | | | | | |
| | | | Total Money Market (Cost $84,267,710) | | | 84,267,710 | |
| | | | | | | | |
| | | | Total Investments (Cost $390,972,741) 99.7% | | $ | 539,097,568 | |
| | | | | | | | |
| | | | Other Assets in Excess of Liabilities 0.3% | | | 1,713,743 | |
| | | | | | | | |
| | | | NET ASSETS 100.0% | | $ | 540,811,311 | |
| | | | | | | | |
| (b) | | Security is currently being valued according to the fair value procedures approved by the Board of Directors. |
| (c) | | Security exempt from registration under Rule 144A or Section 4(2) of the Securities Act of 1933. The security may be resold in transactions exempt from registration, normally to qualified institutional buyers. |
| (e) | | Rate disclosed is the effective rate as of June 30, 2014. |
| (f) | | Rate disclosed is the seven day yield as of June 30, 2014. |
| * | | Non-income producing security. |
| ADR | | – American Depositary Receipt |
See accompanying notes which are an integral part of the financial statements.
7
Statement of Assets and Liabilities
June 30, 2014
| | | | |
Assets: | | | | |
Investments in securities, at market value (cost $390,972,741) | | $ | 539,097,568 | |
Dividends receivable | | | 389,328 | |
Interest receivable | | | 1,375,051 | |
Receivable for Fund shares sold | | | 446,045 | |
Prepaid expenses and other assets | | | 13,517 | |
Total Assets | | | 541,321,509 | |
Liabilities: | | | | |
Payable for Fund shares redeemed | | | 72,193 | |
Accrued investment advisory fees | | | 231,265 | |
Other accrued expenses | | | 206,740 | |
Total Liabilities | | | 510,198 | |
Net Assets | | $ | 540,811,311 | |
Net Assets consist of: | | | | |
Capital stock (1,005,333 shares of $1 par value capital stock issued and outstanding) | | $ | 1,005,333 | |
Paid in capital | | | 388,529,408 | |
Accumulated undistributed net investment income | | | 5,444,139 | |
Accumulated net realized loss on investments | | | (2,292,901 | ) |
Net unrealized appreciation on investments | | | 148,125,332 | |
Net Assets | | $ | 540,811,311 | |
Shares outstanding: 2,000,000 shares authorized | | | 1,005,333 | |
Net asset value, offering and redemption price per share | | $ | 537.94 | |
See accompanying notes which are an integral part of the financial statements.
8
Statement of Operations
Year ended June 30, 2014
| | | | |
Investment Income | | | | |
Interest income | | $ | 8,292,911 | |
Dividends (Net of foreign taxes withheld of $55,509) | | | 4,105,901 | |
Total Investment Income | | | 12,398,812 | |
Expenses: | | | | |
Investment advisor fee | | | 2,393,520 | |
Transfer agent expense | | | 187,893 | |
Administration expense | | | 237,810 | |
Fund accounting expense | | | 87,072 | |
Report printing expense | | | 50,065 | |
Audit expense | | | 42,988 | |
Registration expense | | | 36,651 | |
Custodian expense | | | 39,324 | |
Postage expense | | | 17,892 | |
Trustee expense | | | 2,000 | |
Insurance expense | | | 1,729 | |
24f-2 fees | | | 4,239 | |
Total Expenses | | | 3,101,183 | |
Net Investment Income | | | 9,297,629 | |
Realized & Unrealized Gain (Loss) | | | | |
Net realized gain on investment securities | | | 11,821,539 | |
Change in unrealized appreciation on investment securities | | | 103,626,546 | |
Net realized and unrealized gain on investment securities | | | 115,448,085 | |
Net increase in net assets resulting from operations | | $ | 124,745,714 | |
See accompanying notes which are an integral part of the financial statements.
9
Statements of Changes in Net Assets
| | | | | | | | |
| | | Year Ended
June 30, 2014 | | | Year Ended
June 30, 2013 | |
Operations | | | | | | | | |
Net investment income | | $ | 9,297,629 | | | $ | 11,980,660 | |
Net realized gain (loss) on investment securities | | | 11,821,539 | | | | (3,666,525 | ) |
Change in unrealized appreciation on investment securities | | | 103,626,546 | | | | 29,170,057 | |
Net increase in net assets resulting from operations | | | 124,745,714 | | | | 37,484,192 | |
Distributions | | | | | | | | |
From net investment income | | | (10,537,361 | ) | | | (12,687,935 | ) |
Total distributions | | | (10,537,361 | ) | | | (12,687,935 | ) |
Capital Transactions | | | | | | | | |
Proceeds from shares sold | | | 60,516,260 | | | | 35,891,471 | |
Reinvestments of distributions | | | 9,773,475 | | | | 11,716,260 | |
Amount paid for shares redeemed | | | (30,437,423 | ) | | | (30,564,158 | ) |
Net increase in net assets resulting from capital transactions | | | 39,852,312 | | | | 17,043,573 | |
Total Increase in Net assets | | | 154,060,665 | | | | 41,839,830 | |
Net Assets | | | | | | | | |
Beginning of year | | | 386,750,646 | | | | 344,910,816 | |
End of year | | $ | 540,811,311 | | | $ | 386,750,646 | |
Accumulated undistributed net investment income included in net assets at end of period | | $ | 5,444,139 | | | $ | 6,684,798 | |
Share Transactions | | | | | | | | |
Shares sold | | | 126,492 | | | | 86,494 | |
Shares issued in reinvestment of distributions | | | 21,531 | | | | 29,836 | |
Shares redeemed | | | (66,053 | ) | | | (74,978 | ) |
Net increase in shares outstanding resulting from share transactions | | | 81,970 | | | | 41,352 | |
See accompanying notes which are an integral part of the financial statements.
10
Financial Highlights
Selected data for each share of capital stock outstanding through each year is presented below
| | | | | | | | | | | | | | | | | | | | |
| | | Fiscal Year Ended June 30, | |
| | | 2014 | | | 2013 | | | 2012 | | �� | 2011 | | | 2010 | |
Selected Per Share Data | |
Net asset value, beginning of year | | | $418.85 | | | | $391.05 | | | | $402.03 | | | | $330.82 | | | | $285.69 | |
| | | | | | | | | | | | | | | | | | | | |
| | | | | |
Income from investment operations: | | | | | | | | | | | | | | | | | | | | |
| | | | | |
Net investment income | | | 9.51 | | | | 13.57 | | | | 14.34 | | | | 14.62 | | | | 14.28 | |
| | | | | |
Net realized and unrealized gain (loss) | | | 120.91 | | | | 28.94 | | | | (10.81 | ) | | | 72.43 | | | | 43.18 | |
| | | | | | | | | | | | | | | | | | | | |
| | | | | |
Total from investment operations | | | 130.42 | | | | 42.51 | | | | 3.53 | | | | 87.05 | | | | 57.46 | |
| | | | | | | | | | | | | | | | | | | | |
| | | | | |
Less Distributions to Shareholders: | | | | | | | | | | | | | | | | | | | | |
| | | | | |
From net investment income | | | (11.33 | ) | | | (14.71 | ) | | | (14.51 | ) | | | (15.84 | ) | | | (12.33 | ) |
| | | | | |
From net realized gain | | | – | | | | – | | | | – | | | | – | | | | – | |
| | | | | | | | | | | | | | | | | | | | |
| | | | | |
Total distributions | | | (11.33 | ) | | | (14.71 | ) | | | (14.51 | ) | | | (15.84 | ) | | | (12.33 | ) |
| | | | | | | | | | | | | | | | | | | | |
Net asset value, end of year | | | $537.94 | | | | $418.85 | | | | $391.05 | | | | $402.03 | | | | $330.82 | |
| | | | | | | | | | | | | | | | | | | | |
| | | | | |
Total Return1 | | | 31.64 | % | | | 11.12 | % | | | 1.04 | % | | | 26.83 | % | | | 20.44 | % |
| | | | | | | | | | | | | | | | | | | | |
Ratios and Supplemental Data | | | | | | | | | | | | | | | | | |
Net assets, end of year ($ millions) | | | $540.81 | | | | $386.75 | | | | $344.91 | | | | $299.69 | | | | $220.57 | |
| | | | | |
Ratio of expenses to average net assets | | | 0.70 | % | | | 0.75 | % | | | 0.78 | % | | | 0.82 | % | | | 0.88 | % |
| | | | | |
Ratio of net investment income to average net assets | | | 2.10 | % | | | 3.29 | % | | | 3.95 | % | | | 4.07 | % | | | 4.48 | % |
| | | | | |
Portfolio turnover rate | | | 11 | % | | | 7 | % | | | 10 | % | | | 21 | % | | | 11 | % |
| 1 | | Total return in the above table represents the rate that the investor would have earned or lost on an investment in the Fund, assuming reinvestment of dividends. |
See accompanying notes which are an integral part of the financial statements.
11
Notes to the Financial Statements
June 30, 2014
NOTE A – ORGANIZATION
Bruce Fund, Inc. (the “Fund”) is a Maryland corporation incorporated on June 20, 1967. The Fund is an open end diversified management investment company and the Fund’s primary investment objective is long-term capital appreciation. The investment adviser to the Fund is Bruce and Co., Inc. (the “Adviser”).
NOTE B – SUMMARY OF SIGNIFICANT ACCOUNTING POLICIES
Basis of Preparation – The following is a summary of significant accounting policies followed by the Fund in preparation of their financial statements. These policies are in conformity with the generally accepted accounting principles in the United States of America (“GAAP”).
Estimates – The preparation of financial statements in conformity with GAAP requires management to make estimates and assumptions that affect the reported amounts of assets and liabilities and disclosure of contingent assets and liabilities at the date of the financial statements and the reported amounts of increases and decreases in net assets from operations during the reporting period. Actual results could differ from those estimates.
Securities Valuation – All investments in securities are recorded at their fair value as described in Note C.
Federal Income Taxes – The Fund makes no provision for federal income or excise tax. The Fund intends to qualify each year as a regulated investment company (“RIC”) under subchapter M of the Internal Revenue Code of 1986, as amended, by complying with the requirements applicable to RICs and by distributing substantially all of its taxable income. The Fund also intends to distribute sufficient net investment income and net capital gains, if any, so that it will not be subject to excise tax on undistributed income and gains. If the required amount of net investment income or gains is not distributed, the Fund could incur a tax expense.
As of and during the fiscal year ended June 30, 2014, the Fund did not have a liability for any unrecognized tax benefits. The Fund recognizes interest and penalties, if any, related to unrecognized tax benefits as income tax expense in the statement of operations. During the period, the Fund did not incur any interest or penalties. Management of the Fund has reviewed tax positions taken in tax years that remain subject to examination by all major tax jurisdictions, including federal (i.e., the last four tax year ends and the interim tax period since then, as applicable). Management believes that there is no tax liability resulting from unrecognized tax benefits related to uncertain tax positions taken.
Security Transactions and Related Income – Investment transactions are accounted for no later than the first calculation of the Net Asset Value (“NAV”) on the business day following the trade date. For financial reporting purposes, however, security transactions are accounted for on the trade date on the last business day of the reporting period. The specific identification method is used for determining gains or losses for financial statements and income tax purposes. Dividend income is recorded on the ex-dividend date and interest income is recorded on an accrual basis. Discounts and premiums on securities purchased are accreted or amortized using the effective interest method. Withholding taxes on foreign dividends have been provided for in accordance with the Fund’s understanding of the applicable country’s tax rules and rates. The ability of issuers of debt securities held by the Fund to meet their obligations may be affected by economic and political development in specific country or region.
12
Notes to the Financial Statements (continued)
June 30, 2014
Distributions – Distributions to shareholders, which are determined in accordance with income tax regulations, are recorded on the ex-dividend date. The Fund intends to distribute substantially all of its net investment income as dividends to its shareholders on at least an annual basis. The Fund intends to distribute its net realized long-term capital gains and its net realized short-term capital gains at least once a year. The treatment for financial reporting purposes of distributions made to shareholders during the year from net investment income or net realized capital gains may differ from their ultimate treatment for federal income tax purposes. These differences are caused primarily by differences in the timing of the recognition of certain components of income, expenses or realized capital gain for federal income tax purposes. Where such differences are permanent in nature, they are reclassified in the components of the net assets based on their ultimate characterization for federal income tax purposes. Any such reclassifications will have no effect on net assets, results of operations or net asset values per share of the Fund.
For the fiscal year ended June 30, 2014, the Fund made the following reclassifications to increase (decrease) the components of net assets:
| | | | | | | | |
| Paid in Capital | | Accumulated Undistributed
Net Investment Income | | | Accumulated Net
Realized Gain | |
$– | | $ | (927 | ) | | $ | 927 | |
Subsequent Events – In accordance with GAAP, management has evaluated subsequent events through the date these financial statements were issued. All subsequent events determined to be relevant and material to the financial statements as a whole have been accordingly disclosed.
NOTE C – SUMMARY OF SECURITIES VALUATION AND FAIR VALUE MEASUREMENTS
In accordance with Accounting Standards Codification 820, “Fair Value Measurements and Disclosures” (“ASC 820”), fair value is defined as the price that the Fund would receive upon selling an investment in an orderly transaction to an independent buyer in the principal or most advantageous market of the investment. ASC 820 established a three-tier hierarchy to maximize the use of the observable market data and minimize the use of unobservable inputs and to establish classification of the fair value measurements for disclosure purposes. Inputs refer broadly to the assumptions that market participants would use in pricing the asset or liability, including assumptions about risk (the risk inherent in a particular valuation technique used to measure fair value such as pricing model and/or the risk inherent in the inputs to the valuation technique). Inputs may be observable or unobservable. Observable inputs are inputs that reflect the assumptions market participants would use in pricing the asset or liability, developed based on market data obtained from sources independent of the reporting entity. Unobservable inputs are inputs that reflect the reporting entity’s own assumptions about the assumptions market participants would use in pricing the asset or liability, developed based on the best information available in the circumstances. The three-tier hierarchy of inputs is summarized in the three broad levels listed below:
| | • | | Level 1 – quoted prices in active markets for identical securities |
| | • | | Level 2 – other significant observable inputs (including, but not limited to, quoted prices for an identical security in an inactive market, quoted prices for similar securities, interest rates, prepayment speeds, credit risk, etc.) |
13
Notes to the Financial Statements (continued)
June 30, 2014
| | • | | Level 3 – significant unobservable inputs (including the Fund’s own assumptions in determining fair value of investments based on the best information available) |
The inputs used to measure fair value may fall into different levels of the fair value hierarchy. In such cases, for disclosure purposes, the level in the fair value hierarchy within which the fair value measurement falls in its entirety, is determined based on the lowest level input that is significant to the fair value measurement in its entirety.
Equity securities, including common stocks and American Depositary Receipts (ADR’s) are generally valued by using market quotations, but may be valued on the basis of prices furnished by a pricing service when the Adviser believes such prices more accurately reflect the fair value of such securities. Securities that are traded on any stock exchange are generally valued by the pricing service at the last quoted sale price. Lacking a last sale price, an exchange traded security is generally valued by the pricing service at its last bid price. Securities traded in the NASDAQ over-the-counter market are generally valued by the pricing service at the NASDAQ Official Closing Price. When using the market quotations or close prices provided by the pricing service and when the market is considered active, the security will be classified as a Level 1 security. Sometimes, an equity security owned by the Fund will be valued by the pricing service with factors other than market quotations or when the market is considered inactive. When this happens, the security will be classified as a Level 2 security.
When market quotations are not readily available, when the Adviser determines that the market quotation or the price provided by the pricing service does not accurately reflect the current fair value, or when restricted or illiquid securities are being valued, such securities are valued as determined in good faith by the Adviser, in conformity with guidelines adopted by and subject to review by the Board. These securities will be categorized as Level 3 securities.
Investments in mutual funds, including money market mutual funds, are generally priced at the ending NAV provided by the service agent of the funds. These securities will be categorized as Level 1 securities.
Fixed income securities, including convertible preferred stocks, corporate bonds, convertible corporate bonds, U.S. government bonds, and U.S. municipal bonds valued using market quotations in an active market, will be categorized as Level 1 securities. However, they may be valued on the basis of prices furnished by a pricing service when the Adviser believes such prices more accurately reflect the fair value of such securities. A pricing service uses various inputs and techniques, which include broker-dealer quotations, live trading levels, recently executed transactions in securities of the issuer or comparable issuers, and option adjusted spread models that include base curve and spread curve inputs. Adjustments to individual bonds can be applied to recognize trading differences compared to other bonds issued by the same issuer. The broker-dealer quotations received are supported by credit analysis of the issuer that takes into consideration credit quality assessments, daily trading activity, and the activity of the underlying equities, listed bonds and sector-specific trends. To the extent that these inputs are observable, the fixed income securities are categorized as Level 2 securities. If the Adviser decides that a price provided by the pricing service does not accurately reflect the fair value of the securities, when prices are not readily available from a pricing service, or when restricted or illiquid securities are being valued, securities are valued at fair value as determined in good faith by the Adviser, in conformity with
14
Notes to the Financial Statements (continued)
June 30, 2014
guidelines adopted by and subject to review of the Board. These securities will be categorized as Level 3 securities. The ability of issuers of debt securities held by the Fund to meet their obligations may be affected by economic and political developments in a specific country or region.
Short-term investments in fixed income securities, (those with maturities of less than 60 days when acquired, or which subsequently are within 60 days of maturity), are valued by using the amortized cost method of valuation, which the Board has determined will represent fair value. These securities will be classified as Level 2 securities.
The following is a summary of the inputs used to value the Fund’s investments as of June 30, 2014, based on the three levels defined above:
| | | | | | | | | | | | | | | | |
| | | Level 1 | | | Level 2 | | | Level 3 | | | Total | |
Common Stocks | | | | | | | | | | | | | | | | |
Consumer Discretionary | | $ | 22,208,809 | | | $ | – | | | $ | – | | | $ | 22,208,809 | |
Consumer Staples | | | 23,075,800 | | | | – | | | | – | | | | 23,075,800 | |
Energy | | | 8,471,983 | | | | – | | | | 8,738 | | | | 8,480,721 | |
Financials | | | 27,865,884 | | | | 2,220,771 | (a) | | | – | | | | 30,086,655 | |
Health Care | | | 43,887,382 | | | | – | | | | – | | | | 43,887,382 | |
Industrials | | | 71,007,402 | | | | – | | | | – | | | | 71,007,402 | |
Information Technology | | | 16,314,300 | | | | – | | | | – | | | | 16,314,300 | |
Materials | | | 28,866,715 | | | | – | | | | – | | | | 28,866,715 | |
Utilities | | | 28,325,975 | | | | – | | | | – | | | | 28,325,975 | |
Convertible Preferred Stocks(b) | | | | | | | | | | | | | | | | |
Consumer Staples | | | 2,848,230 | | | | – | | | | – | | | | 2,848,230 | |
Energy | | | 11,585,075 | | | | – | | | | – | | | | 11,585,075 | |
Utilities | | | 522,500 | | | | – | | | | – | | | | 522,500 | |
Corporate Bonds | | | | | | | | | | | | | | | | |
Consumer Discretionary | | | – | | | | 1,518,750 | | | | – | | | | 1,518,750 | |
Energy | | | – | | | | 5,502,687 | | | | – | | | | 5,502,687 | |
Financials | | | – | | | | – | | | | 6,900,000 | | | | 6,900,000 | |
Utilities | | | – | | | | 11,529,938 | | | | – | | | | 11,529,938 | |
Convertible Corporate Bonds | | | | | | | | | | | | | | | | |
Consumer Discretionary | | | – | | | | 4,760,937 | | | | – | | | | 4,760,937 | |
Energy | | | – | | | | 7,229,625 | | | | – | | | | 7,229,625 | |
Health Care | | | – | | | | 57,922,537 | | | | 496,844 | | | | 58,419,381 | |
Industrials | | | – | | | | 1,787,500 | | | | – | | | | 1,787,500 | |
U.S. Government Bonds | | | | | | | | | | | | | | | | |
U.S. Treasury Strips | | | – | | | | 69,961,750 | | | | – | | | | 69,961,750 | |
U.S. Municipal Bonds | | | – | | | | 9,726 | | | | – | | | | 9,726 | |
Money Market | | | 84,267,710 | | | | – | | | | – | | | | 84,267,710 | |
Total | | $ | 369,247,765 | | | $ | 162,444,221 | | | $ | 7,405,582 | | | $ | 539,097,568 | |
| (a) | | At the reporting period ended June 30, 2014, GAINSCO, Inc. common stock transferred from Level 1 to Level 2 from the previous reporting period due to lack of trading activity. |
| (b) | | At the reporting period June 30, 2014, all Convertible Preferred Stocks transferred from Level 2 to Level 1 from the previous reporting period due to an increase in trading activity. |
15
Notes to the Financial Statements (continued)
June 30, 2014
In the absence of a listed price quote, or a supplied price quote which is deemed to be unrepresentative of the actual market price, the Adviser shall use any or all of the following criteria to value Level 3 securities:
| | • | | Price given by pricing service |
| | • | | Last quoted bid & asked price |
| | • | | Third party bid & asked price |
| | • | | Indicated opening range |
The significant unobservable inputs that may be used in the fair value measurement of the Fund’s investments in common stock, corporate bonds and convertible corporate bonds for which market quotations are not readily available include: broker quotes, discounts from the most recent trade or “stale price” and estimates from trustees (in bankruptcies) on disbursements. A change in the assumption used for each of the inputs listed above may indicate a directionally similar change in the fair value of the investment.
The following provides quantitative information about the Fund’s significant Level 3 fair value measurements as of June 30, 2014:
| | | | | | | | | | |
| Quantitative Information about Significant Level 3 Fair Value Measurements |
| Asset Category | | Fair Value At
June 30, 2014 | | | Valuation
Techniques | | Unobservable Input(s) | | Range |
Corporate Bonds | | $ | 6,900,000 | | | Adjusted Broker Quotes | | Non-Binding Broker Quotes | | N/A |
Convertible Corporate Bonds | | $ | 496,844 | | | Adjusted Broker Quotes | | Non-Binding Broker Quotes | | N/A |
| | | | | | | | Discount for Lack of Marketability | | 1%–20% |
Following is a reconciliation of assets in which significant unobservable inputs (Level 3) were used in determining fair value for the Fund:
| | | | | | | | | | | | | | | | | | | | | | | | | | | | | | | | | | | | |
| | | Balance as
of June 30,
2013 | | | Realized
gain | | | Amortization/
Accretion | | | Change in
unrealized
Appreciation | | | Purchases | | | Sales | | | Transfer
in
Level 3*(a) | | | Transfer
out
Level 3*(b) | | | Balance as of
June 30,
2014 | |
Common Stock | | $ | 8,738 | | | $ | – | | | $ | – | | | $ | – | | | $ | – | | | $ | – | | | $ | – | | | $ | – | | | $ | 8,738 | |
Corporate Bonds | | | 6,390,000 | | | | – | | | | 10,454 | | | | 499,546 | | | | – | | | | – | | | | – | | | | – | | | | 6,900,000 | |
Convertible Corporate Bonds | | | 564,344 | | | | (2,058,722 | ) | | | – | | | | 2,051,101 | | | | – | | | | (59,879 | ) | | | – | | | | – | | | | 496,844 | |
Total | | $ | 6,963,082 | | | $ | (2,058,722 | ) | | $ | 10,454 | | | $ | 2,550,647 | | | $ | – | | | $ | (59,879 | ) | | $ | – | | | $ | – | | | $ | 7,405,582 | |
| * | | The amount of transfers in and/or out are reflected at the reporting period end. |
| (a) | | Transfers in relate primary to securities for which observable inputs became unavailable during the period. Therefore, the securities were valued at fair value by the Adviser, in conformity with guidelines adopted by and subject to review by the Board, and are categorized as Level 3 inputs as of June 30, 2014. |
| (b) | | Transfer out relate primary to securities for which observable inputs became available during the period, and as of June 30, 2014, the Fund was able to obtain quotes from its pricing service. These quotes represent Level 2 inputs, which is the level of the fair value hierarchy in which these securities are included as of June 30, 2014. |
16
Notes to the Financial Statements (continued)
June 30, 2014
The total change in unrealized appreciation included in the Statement of Operations attributable to Level 3 investments still held at June 30, 2014 was $499,546.
| | | | |
| | | Total Change in
Unrealized Appreciation | |
Corporate Bonds | | $ | 499,546 | |
Total | | $ | 499,546 | |
NOTE D – PURCHASES AND SALES OF SECURITIES
For the fiscal year ended June 30, 2014, cost of purchases and proceeds from maturities and sales of securities, other than short-term investments and short-term U.S. Government obligations were as follows:
| | | | | | | | |
| | | Purchases | | | Sales | |
U.S. Government Obligations | | $ | – | | | $ | – | |
Other | | | 42,255,243 | | | | 43,975,997 | |
NOTE E – RELATED PARTIES
Bruce & Co., Inc., an Illinois corporation, is the investment adviser of the Fund and furnishes investment advice. In addition, it provides office space and facilities and pays the cost of all prospectuses and financial reports (other than those mailed to current shareholders). Compensation to the Adviser for its services under the Investment Advisory Contract is paid monthly based on the following:
| | |
| Annual Percentage Fee | | Applied to Average Net Assets of Fund |
1.00% | | Up to $20,000,000; plus |
0.60% | | $20,000,000 to $100,000,000; plus |
0.50% | | over $100,000,000 |
At June 30, 2014, Robert B. Bruce was the beneficial owner of 16,491 Fund shares, R. Jeffrey Bruce was the beneficial owner of 7,429 Fund shares, Robert DeBartolo was the beneficial owner of 170 Fund shares, and W. Martin Johnson was the beneficial owner of 4 Fund shares. Robert B. Bruce, Robert DeBartolo, and W. Martin Johnson are directors of the Fund; both Robert B. Bruce and R. Jeffrey Bruce are officers of the Fund and are officers, directors and owners of the Adviser.
NOTE F – DISTRIBUTION TO SHAREHOLDERS
On December 20, 2013, the Fund paid a dividend from net investment income of $11.3336 per share or $10,537,361 for shareholders of record on December 19, 2013.
17
Notes to the Financial Statements (continued)
June 30, 2014
NOTE G – FEDERAL INCOME TAXES
At June 30, 2014, the breakdown of net unrealized appreciation and tax cost of investments for federal income tax purpose is as follows:
| | | | |
Gross Unrealized Appreciation | | $ | 184,820,774 | |
Gross Unrealized (Depreciation) | | | (36,750,922 | ) |
Net Unrealized Appreciation on | | | | |
Investments | | $ | 148,069,852 | |
Tax Cost | | $ | 391,028,222 | |
At June 30, 2014, the components of distributable earnings (accumulated losses) on a tax basis were as follows:
| | | | |
Undistributed Ordinary Income | | $ | 5,499,620 | |
Capital Loss Carryforwards | | | (2,292,901 | ) |
Unrealized Appreciation | | | 148,069,852 | |
Total | | $ | 151,276,571 | |
At June 30, 2014, the Fund has available for federal tax purposes an unused capital loss carryforward of $2,292,901, which is available for offset against future taxable net capital gains. This loss carryforward expires on June 30, 2019 as shown in the table below. To the extent these carryforwards are used to offset future capital gains, it is probable that the amount offset will not be distributed to shareholders.
| | | | | | |
| Amount | | | Expires June 30, | |
| | 2,292,901 | | | | 2019 | |
Capital losses generated during the fiscal year ended June 30, 2014 will be subject to the provisions of the Regulated Investment Company Modernization Act of 2010 (the “Act”). Effective for taxable years beginning after the enactment date of the Act (December 22, 2010), if capital losses are not reduced by capital gains during the fiscal year, the losses will be carried forward with no expiration and with the short-term or long-term character of the loss retained. Capital loss carryforwards generated in future years must be fully utilized before those capital loss carryforwards listed with the noted expiration dates above. As of June 30, 2014, the Fund did not have any post-enactment capital loss carryovers.
The tax character of distributions paid during fiscal years 2014 and 2013 was as follows:
| | | | | | | | |
| | | 2014 | | | 2013 | |
Distributions paid from: | | | | | | | | |
Ordinary Income | | $ | 10,537,361 | | | $ | 12,687,935 | |
18
Notes to the Financial Statements (continued)
June 30, 2014
NOTE H – RESTRICTED SECURITIES
The Fund has acquired several securities, the sale of which is restricted, through private placement. At June 30, 2014, the aggregate market value of such securities listed below amounted to $18,239,062 or 3% of the Fund’s net assets. 62% of the restricted securities are valued using quoted market prices, while the other 38% are valued according to fair value procedures approved by the Board of Directors. It is possible that the estimated value may differ significantly from the amount that might ultimately be realized in the near term, and the difference could be material.
The chart below shows the restricted securities held by the Fund as of June 30, 2014:
| | | | | | | | | | | | | | | | |
| Issuer Description | | Acquisition
Date | | | Principal
Amount | | | Cost | | | Value | |
Corporate Bonds | | | | | | | | | | | | | | | | |
Land O’ Lakes Capital Trust I, 7.450%, 3/15/28 | | | 1/23/09 | | | $ | 1,500,000 | | | $ | 1,015,287 | | | $ | 1,518,750 | |
Security Benefit Life Insurance Co., 7.450%, 10/1/33(a) | | | (b | ) | | | 6,000,000 | | | | 5,489,610 | | | | 6,900,000 | |
| | | | |
Convertible Corporate Bonds | | | | | | | | | | | | | | | | |
Sirius XM Radio, Inc., 7.000%, 12/1/14 | | | (c | ) | | | 2,500,000 | | | | 2,546,754 | | | | 4,760,937 | |
Supernus Pharmaceuticals, Inc., 7.500%, 5/1/19 | | | (d | ) | | | 1,500,000 | | | | 1,517,659 | | | | 3,271,875 | |
Titan International, Inc., 5.625%, 1/15/17 | | | 2/5/10 | | | | 1,000,000 | | | | 995,709 | | | | 1,787,500 | |
| (a) | | Security is currently being valued according to the fair value procedures approved by the Board of Directors. |
| (b) | | Purchased multiple taxlots beginning on 4/21/11. |
| (c) | | Purchased multiple taxlots beginning on 10/22/10. |
| (d) | | Purchased multiple taxlots beginning on 4/26/13. |
19
Report of Independent Registered Public Accounting Firm
Board of Directors and Shareholders
Bruce Fund, Inc.
We have audited the accompanying statement of assets and liabilities of Bruce Fund, Inc. (a Maryland corporation) (the “Fund”), including the schedule of investments, as of June 30, 2014, and the related statement of operations for the year then ended, the statements of changes in net assets for each of the two years in the period then ended, and the financial highlights for each of the five years in the period then ended. These financial statements and financial highlights are the responsibility of the Fund’s management. Our responsibility is to express an opinion on these financial statements and financial highlights based on our audits.
We conducted our audits in accordance with the standards of the Public Company Accounting Oversight Board (United States). Those standards require that we plan and perform the audit to obtain reasonable assurance about whether the financial statements and financial highlights are free of material misstatement. We were not engaged to perform an audit of the Fund’s internal control over financial reporting. Our audits included consideration of internal control over financial reporting as a basis for designing audit procedures that are appropriate in the circumstances, but not for the purpose of expressing an opinion on the effectiveness of the Fund’s internal control over financial reporting. Accordingly, we express no such opinion. An audit includes examining, on a test basis, evidence supporting the amounts and disclosures in the financial statements and financial highlights. An audit also includes assessing the accounting principles used and significant estimates made by management, as well as evaluating the overall financial statement presentation. Our procedures included confirmation of securities owned as of June 30, 2014, by correspondence with the custodians. We believe that our audits provide a reasonable basis for our opinion.
In our opinion, the financial statements and financial highlights referred to above present fairly, in all material respects, the financial position of Bruce Fund, Inc. as of June 30, 2014, the results of its operations for the year then ended, the changes in its net assets for each of the two years in the period then ended, and the financial highlights for each of the five years in the period then ended, in conformity with accounting principles generally accepted in the United States of America.

Chicago, Illinois
August 27, 2014
20
Directors and Officers (Unaudited)
The Fund is managed by its officers and directors. It has no advisory board, and no standing committees of the board of directors. Directors serve until the successor of each shall have been duly elected and shall have qualified. Independent Directors constitute a majority of the board.
The following table provides information regarding the Independent Directors:
| | | | |
| Name, Address*, (Age) | | Position with Fund**,
Term of Position
with Fund | | Principal Occupation During Past 5 Years
and Other Directorships |
| | |
| Ward M. Johnson (77) | | Independent Director, December 1985 to present | | 2002 to present – Real Estate Sales, Landings Co. |
| | |
| Robert DeBartolo (54) | | Independent Director, March 2007 to present | | 2011 to present – Director, Global Franchise Marketing, Novartis/Alcon 2009 to 2011 – Senior Director, Goble and Associates 2008 to 2009 – Vice President, Client Engagements, Cadient Group 2000 to 2008 – Managing Director, Executive Vice President, Corbett Accel Healthcare Group, Omnicom |
| * | | The address for each director is 20 North Wacker Drive, Suite 2414, Chicago, Illinois 60606. |
| ** | | The Fund consists of one series. The Fund is not part of a Fund Complex. |
The following table provides information regarding each Director who is an “interested person” of the Fund, as defined in the 1940 Act, and each officer of the Fund.
| | | | |
| Name, Address*, (Age) | | Position with Fund,**
Term of Position
with Fund | | Principal Occupation During Past 5 Years
and Other Directorships |
| | |
| Robert B. Bruce*** (82) | | Chairman, Director, President, and Treasurer, 1983 to present; Chief Compliance Officer, 2004 to present | | 1974 to present – principal, Bruce and Co. (investment adviser); 1982 to present – Chairman of Board of Directors, Treasurer, Professional Life & Casualty Company (life insurance issuer), previously Assistant Treasurer. |
| | |
| R. Jeffrey Bruce*** (54) | | Vice President and Secretary, 1983 to present | | 1983 to present – analyst/manager, Bruce and Co. (investment adviser); 1993 to present – Director, Professional Life & Casualty Company (life insurance issuer) |
| * | | The address for each of the directors and officers is 20 North Wacker Drive, Suite 2414, Chicago, Illinois 60606. |
| ** | | The Fund consists of one series. The Fund is not part of a Fund Complex. |
| *** | | Mr. Robert Bruce and Mr. Jeffrey Bruce are “interested” persons because they are officers, directors, and owners of the Adviser. Robert Bruce is the father of Jeffrey Bruce. |
The Fund’s Statement of Additional Information (“SAI”) includes information about the directors and is available, without charge, upon request. You may call toll-free (800) 872-7823 to request a copy of the SAI or to make shareholder inquiries.
21
Other Tax Information (Unaudited)
The form 1099-DIV you receive in January 2015 will show the tax status of all distributions paid to your account in the calendar year 2014. Shareholders are advised to consult their own tax adviser with respect to the tax consequences of their investment in the Fund. As required by the Internal Revenue Code regulations, shareholders must be notified within 60 days of the Fund’s fiscal year end regarding the status of qualified dividend income for individuals and the dividends received deduction for corporations.
Qualified Dividend Income. The Fund designates 39.53% of the dividends paid as qualified dividend income eligible for the reduced rate of 15% pursuant to the Internal Revenue Code.
Dividend Received Deduction. Corporate shareholders are generally entitled to take the dividends received deduction on the portion of the Fund’s dividend distribution that qualifies under tax law. For the Fund’s fiscal 2014 ordinary income dividends, 37.21% qualifies for the corporate dividends received deduction.
22
Privacy Policy
The following is a description of the Fund’s policies regarding disclosure of nonpublic personal information that you provide to the Fund or that the Fund collects from other sources. In the event that you hold shares of the Fund through a broker-dealer or other financial intermediary, the privacy policy of your financial intermediary would govern how your nonpublic personal information would be shared with unaffiliated third parties.
Categories of Information the Fund Collects. The Fund collects the following nonpublic personal information about you:
| | • | | Information the Fund receives from you on or in applications or other forms, correspondence, or conversations (such as your name, address, phone number, social security number, assets, income and date of birth); and |
| | • | | Information about your transactions with the Fund, or others (such as your account number and balance, payment history, parties to transactions, cost basis information, and other financial information). |
Categories of Information the Fund Discloses. The Fund does not disclose any nonpublic personal information about its current or former shareholders to unaffiliated third parties, except as required or permitted by law. The Fund is permitted by law to disclose all of the information it collects, as described above, to its service providers (such as the Fund’s custodian, administrator and transfer agent) to process your transactions and otherwise provide services to you.
Confidentiality and Security. The Fund restricts access to your nonpublic personal formation to those persons who require such information to provide products or services to you. The Fund maintains physical, electronic and procedural safeguards that comply with federal standards to guard your nonpublic personal information
Disposal of Information. The Fund, through its transfer agent, has taken steps to reasonably ensure that the privacy of your nonpublic personal information is maintained at all times, including in connection with the disposal of information that is no longer required to be maintained by the Fund. Such steps shall include whenever possible, shredding paper documents and records prior to disposal, requiring off-site storage vendors to shred documents maintained in such locations prior to disposal, and erasing and/or obliterating any data contained on electronic media in such a manner that the information can no longer be read or reconstructed.
23
Proxy Voting
A description of the policies and procedures that the Fund uses to determine how to vote proxies relating to portfolio securities and information regarding how the Fund voted those proxies during the most recent twelve month period ended June 30 are available without charge upon request by (1) calling the Fund at (800) 872-7823 and (2) from Fund documents filed with the Securities and Exchange Commission (“SEC”) on the SEC’s website at www.sec.gov.
BRUCE FUND
OFFICERS AND DIRECTORS
Robert B. Bruce
President and Treasurer
R. Jeffrey Bruce
Vice President and Secretary
Robert DeBartolo
Director
W. Martin Johnson
Director
Investment Adviser
Bruce and Co., Inc.
Chicago, Illinois
Custodian
Huntington National Bank
Columbus, Ohio
Administrator, Transfer Agent and
Fund Accountant
Huntington Asset Services, Inc.
Indianapolis, Indiana
Distributor
Unified Financial Securities, Inc.
2960 North Meridian Street, Suite 300
Indianapolis, Indiana 46208
Counsel
Klevatt & Associates
Chicago, Illinois
Independent Registered Public Accounting Firm
Grant Thornton LLP
Chicago, Illinois
This report is intended only for the information of shareholders or those who have received the Fund’s prospectus which contains information about the Fund’s management fees and expenses. Please read the prospectus carefully before investing.
Distributed by Unified Financial Securities, Inc.
Member FINRA/SIPC
Item 2. Code of Ethics.
(a) As of the end of the period covered by this report, the registrant has adopted a code of ethics that applies to the registrant’s principal executive officer, principal financial officer, principal accounting officer or controller, or persons performing similar functions, regardless of whether these individuals are employed by the registrant or a third party.
(b) For purposes of this item, “code of ethics” means written standards that are reasonably designed to deter wrongdoing and to promote:
| | (1) | Honest and ethical conduct, including the ethical handling of actual or apparent conflicts of interest between personal and professional relationships; |
| | (2) | Full, fair, accurate, timely, and understandable disclosure in reports and documents that a registrant files with, or submits to, the Commission and in other public communications made by the registrant; |
| | (3) | Compliance with applicable governmental laws, rules, and regulations; |
| | (4) | The prompt internal reporting of violations of the code to an appropriate person or persons identified in the code; and |
| | (5) | Accountability for adherence to the code. |
(c) Amendments: During the period covered by the report, there have not been any amendments to the provisions of the code of ethics.
(d) Waivers: During the period covered by the report, the registrant has not granted any express or implicit waivers from the provisions of the code of ethics.
| (e) | Posting: We do not intend to post the Code of Ethics for the Officers or any amendments or waivers on a website. |
(f) Availability: The Code of Ethics for the Officers can be obtained, free of charge by calling the toll free number for the appropriate Fund.
Item 3. Audit Committee Financial Expert.
| | (a) | The registrant’s board of directors has determined that the registrant does not have an audit financial expert. The directors determined that, although none of its members meet the technical definition of an audit expert, the group has sufficient financial expertise to adequately perform its duties. |
Item 4. Principal Accountant Fees and Services.
| | |
Bruce Fund | | |
FY 2014 | | $35,873 |
FY 2013 | | $32,500 |
| | | | |
Bruce Fund | | Registrant | | Adviser |
FY 2014 | | $0 | | $0 |
FY 2013 | | $0 | | $0 |
Nature of the fees:
| | |
Bruce Fund | | |
FY 2014 | | $3,308 |
FY 2013 | | $3,300 |
Nature of the fees: preparation of the 1120 RIC
| | | | | | | | |
Bruce Fund | | Registrant | | | Adviser | |
FY 2014 | | $ | 0 | | | $ | 0 | |
FY 2013 | | $ | 0 | | | $ | 0 | |
Nature of the fees:
| (e) | (1) Board Audit Policies |
The Board of Directors are responsible for the selection, retention or termination of auditors and, in connection therewith, to (i) evaluate the proposed fees and other compensation, if any, to be paid to the auditors, (ii) evaluate the independence of the auditors, (iii) receive the auditors’ specific representations as to their independence;
| | (2) Percentages | of Services Billed Pursuant to Waiver of Pre-Approved Requirement |
| | | | |
| | | Registrant | |
Audit-Related Fees: | | | 0 | % |
Tax Fees: | | | 0 | % |
All Other Fees: | | | 0 | % |
(f) During audit of registrant’s financial statements for the most recent fiscal year, less than 50 percent of the hours expended on the principal accountant’s engagement were attributed to work performed by persons other than the principal accountant’s full-time, permanent employees.
(g) The aggregate non-audit fees billed by the registrant’s accountant for services rendered to the registrant, and rendered to the registrant’s investment adviser (not including any sub-adviser whose role is primarily portfolio management and is subcontracted with or overseen by another investment adviser), and any entity controlling, controlled by, or under common control with the adviser that provides ongoing services to the registrant:
| | | | | | | | |
| | | Registrant | | | Adviser | |
FY 2014 | | $ | 0 | | | $ | 0 | |
FY 2013 | | $ | 0 | | | $ | 0 | |
(h) Not applicable. The auditor performed no services for the registrant’s investment adviser or any entity controlling, controlled by, or under common control with the investment adviser that provides ongoing services to the registrant.
Item 5. Audit Committee of Listed Companies. Not applicable.
Item 6. Schedule of Investments. Not applicable – schedule filed with Item 1.
Item 7. Disclosure of Proxy Voting Policies and Procedures for Closed-End Funds. Not applicable.
Item 8. Portfolio Managers of Closed-End Management Investment Companies. Not applicable.
Item 9. Purchases of Equity Securities by Closed-End Management Investment Company and Affiliated Purchasers. Not applicable.
Item 10. Submission of Matters to a Vote of Security Holders
The registrant has not adopted procedures by which shareholders may recommend nominees to the registrant’s board of directors.
Item 11. Controls and Procedures.
(a) Based on an evaluation of the registrant’s disclosure controls and procedures as of a date within 90 days of the filing date of this Form N-CSR, disclosure controls and procedures are reasonably designed to ensure that the information required in filings on Forms N-CSR is recorded, processed, summarized, and reported on a timely basis.
(b) There were no significant changes in the registrant’s internal control over financial reporting that occurred during the registrant’s second fiscal quarter of the period covered by this report that has materially affected, or is reasonably likely to materially affect, the registrant’s internal control over financial reporting.
Item 12. Exhibits.
(a)(1) Code of ethics is filed herewith.
(a)(2) Certifications by the registrant’s principal executive officer and principal financial officer, pursuant to Section 302 of the Sarbanes- Oxley Act of 2002 and required by Rule 30a-2under the Investment Company Act of 1940 are filed herewith.
(a)(3) Not Applicable – there were no written solicitations to purchase securities under Rule 23c-1 during the period
(b) Certification pursuant to 18 U.S.C. Section 1350, as adopted pursuant to Section 906 of the Sarbanes-Oxley Act of 2002 is filed herewith.
SIGNATURES
Pursuant to the requirements of the Securities Exchange Act of 1934 and the Investment Company Act of 1940, the registrant has duly caused this report to be signed on its behalf by the undersigned, thereunto duly authorized.
| | |
| (Registrant) | | Bruce Fund, Inc. |
| | |
| |
| By | | /s/ Robert B. Bruce |
| | Robert B. Bruce, President |
| |
| Date | | 9/2/14 |
Pursuant to the requirements of the Securities Exchange Act of 1934 and the Investment Company Act of 1940, this report has been signed below by the following persons on behalf of the registrant and in the capacities and on the dates indicated.
| | |
| |
| By | | /s/ Robert B. Bruce |
| | Robert B. Bruce, President |
| |
| Date | | 9/2/14 |
| | |
| |
| By | | /s/ R. Jeffery Bruce |
| | R. Jeffery Bruce, Principal Accounting Officer |
| |
| Date | | 9/2/14 |