Exhibit 99.1
| JP Morgan Annual High Yield Conference January 2007 |
| Forward-Looking Statements Certain statements contained in this presentation are "forward-looking statements" within the meaning of the Private Securities Litigation Reform Act of 1995, These statements give our current expectations or forecasts of future events and our future performance and do not relate directly to historical or current events or our historical or current performance. Most of these statements contain words that identify them as forwardlooking, such as "anticipate", "estimate", "expect", "project", "intend", "plan", "believe", "seek", "will", "may", "opportunity", "target" or other words that relate to future events, as opposed to past or current events. Forward-looking statements are based on the then-current expectations, forecasts and assumptions of our management and involve risks and uncertainties, some of which are outside of our control, that could cause actual outcomes and results to differ materially from current expectations. For some of the factors that could cause such differences, please see the section of our quarterly report on Form 10-Q for the period ended September 30, 2006 (our "Q3 10-Q"), entitled "Risk Factors" and the cautionary note regarding forward-looking statements appearing at the beginning of the section entitled "Management's Discussion and Analysis of Financial Condition and Results of Operations" in our Q3 10-Q. We cannot assure you that the assumptions made in preparing any of the forward-looking statements will prove accurate or that any projections will be realized. We expect that there will be differences between projected and actual results. These forward-looking statements speak only as of the date of this presentation, and we do not undertake any obligation to update or revise publicly any forward-looking statements, whether as a result of new information, future events or otherwise. We caution you not to place undue reliance on the forward-looking statements. All forward-looking statements attributable to us are expressly qualified in their entirely by the cautionary statements contained herein. |
| Key Definitions LTM Results for the twelve months ended September 30, 2006, for The Hertz Corporation EBITDA Earnings before interest expense, taxes, depreciation and amortization Corporate EBITDA Calculated as EBITDA - RAC Vehicle Interest Expense - RAC Vehicle Depreciation + Non-Cash Charges + Extraordinary, Unusual or Non-recurring Gains or Losses EBITA Earnings before interest expense, taxes and amortization Corporate Interest* Non-fleet interest expense, excluding non-cash items Adjusted Pre-tax Pre-tax Income before purchase accounting amortization, amortization of Income* deferred financing fees and debt discount and other non-cash charges Net Corporate Debt* Non-fleet debt less non-fleet cash Net Fleet Debt* Fleet debt (U.S. ABS, International Facility and Capital Leases) less fleet cash Pro Forma (PF) Reflects Pro Forma interest expense related to fleet financing structure put in place on 12/21/2005 as if it had been in place on 1/1/2005 * "EBITDA," "Corporate EBITDA," "EBITDA Regulation G. In conformity with Reg the non-GAAP measures discussed i generally accepted accounting principles," "Corporate Interest," "Adjusted Pre-tax Income" and "Net Corporate Debt" are non-GAAP measures within the meaning of Regulation G, information required to accompany the disclosure of non-GAAP financial measures, including a reconciliation of in this presentation to the most directly comparable financial measures calculated and presented in accordance with principles in the United States, appears at the end of this presentation on the slides relating to Non-GAAP Measures, |
| Key Investment Considerations Premier global brand Leading franchises in large, growing industries Superior business model and strategy with successful track record Multiple drivers of earnings growth Robust diversified revenue growth Significant productivity opportunities Strong cash flow to drive deleveraging Experienced management team with performance based incentives |
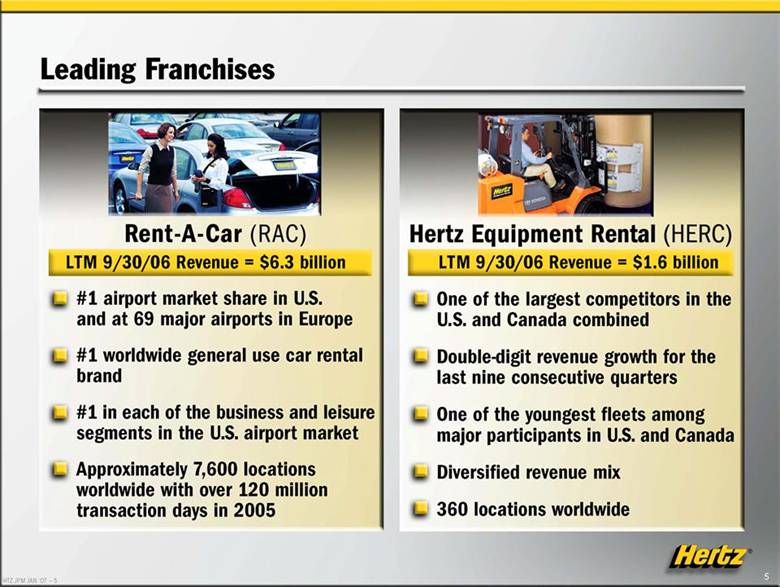
| Leading Franchises Rent-A-Car (RAC) LTM 9/30/06 Revenue = $6.3 billion #1 airport market share in U.S. and at 69 major airports in Europe #1 worldwide general use car rental brand #1 in each of the business and leisure segments in the U.S. airport market Approximately 7,600 locations worldwide with over 120 million transaction days in 2005Hertz Equipment Rental (HERC) LTM 9/30/06 Revenue = $1.6 billion One of the largest competitors in the U.S. and Canada combined Double-digit revenue growth for the last nine consecutive quarters One of the youngest fleets among major participants in U.S. and Canada Diversified revenue mix 360 locations worldwide |
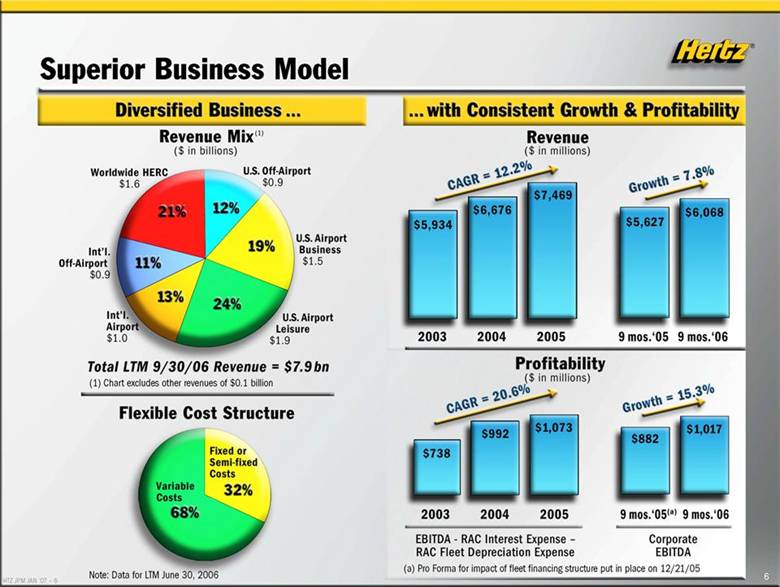
| Superior Business Model Diversified Business. with Consistent Growth & Profitability Revenue Mix (1) ($ in billions) Revenue ($ in millions) Total LTM 9/30/06 Revenue = $7.9 bn (1) Chart excludes other revenues of $0.1 billion Flexible Cost Structure Profitability ($ in millions) Note: Data for LTM June 30, 2006 EBITDA - RAC Interest Expense - RAC Fleet Depreciation Expense (a) Pro Forma for impact of fleet financing structure put in place on 12/21/05 Corporate EBITDA Worldwide HERC $1.6 U.S. Off-Airport $0.9 U.S. Airport Business $1.5 U.S. Airport Leisure $1.9 Int'l Airport $1.0 Int'l Off-Airport $0.9 21% 12% 19% 24% 13% 11% CAGR = 12.2% $5,934 $6,676 $7,469 Growth = 7.8% $5,627 $6,068 2003 2004 2005 9mos.'05 9mos.'06 Fixed or Semi-fixed Costs 32% Variable Costs 68% CAGR = 20.6% $738 $992 $1,073 Growth = 15.3% $882 $1,017 2003 2004 2005 9mos.'05 (a) 9mos.'06 |
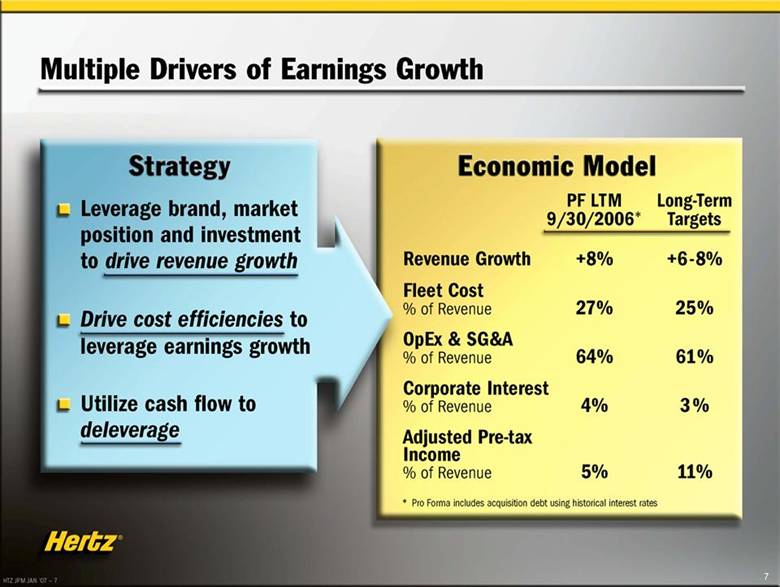
| Multiple Drivers of Earnings Growth Strategy Leverage brand, market position and investment to drive revenue growth Drive cost efficiencies to leverage earnings growth Utilize cash flow to deleverage Economic Model PF LTM Long-Term 9/30/2006* Targets Revenue Growth +8% +6-8% Fleet Cost % of Revenue 27% 25% OpEx & SG&A % of Revenue 64% 61% Corporate Interest % of Revenue 4% 3% Adjusted Pre-tax Income % of Revenue 5% 11% * Pro Forma includes acquisition debt using historical interest rates |
| Worldwide RAC |
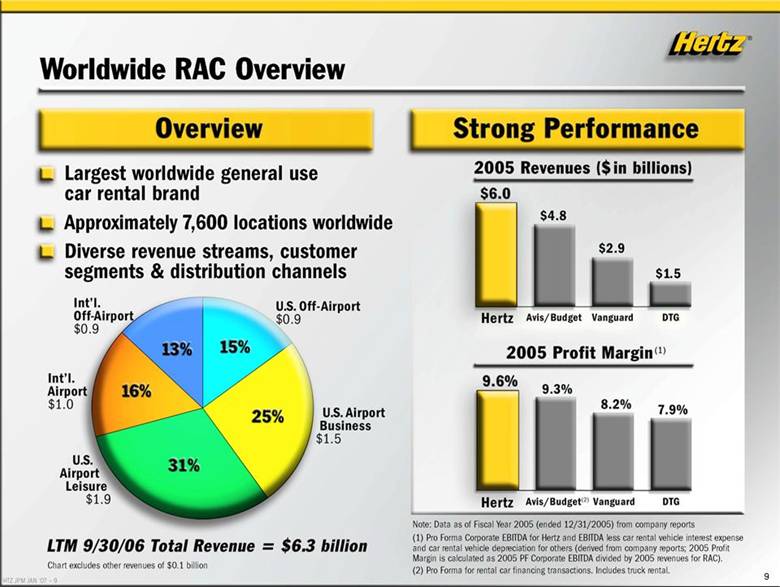
| Worldwide RAC Overview Overview Largest worldwide general use car rental brand Approximately 7,600 locations worldwide Diverse revenue streams, customer segments & distribution channels Strong Performance 2005 Revenues ($ in billions) 2005 Profit Margin (1) Note: Data as of Fiscal Year 2005 (ended 12/31/2005) from company reports (1) Pro Forma Corporate EBITDA for Hertz and EBITDA less car rental vehicle interest expense and car rental vehicle depreciation for others (derived from company reports; 2005 Profit Margin is calculated as 2005 PF Corporate EBITDA divided by 2005 revenues for RAC). (2) Pro Forma for rental car financing transactions. Includes truck rental. Int'l .Off-Airport $0.9 U.S. Off-Airport $0.9 U.S. Airport Business $1.5 U.S. Airport Leisure $1.9 Int'l. Airport $1.0 13% 15% 25% 31% 16% $6.0 $4.8 $2.9 $1.5 Hertz Avis/Budget Vanguard DTG 9.6% 9.3% 8.2% 7.9% Hertz Avis/Budget(2) Vanguard DTG LTM 9/30/06 Total Revenue = $6.3 billion Chart excludes other revenues of $0.1 billion |
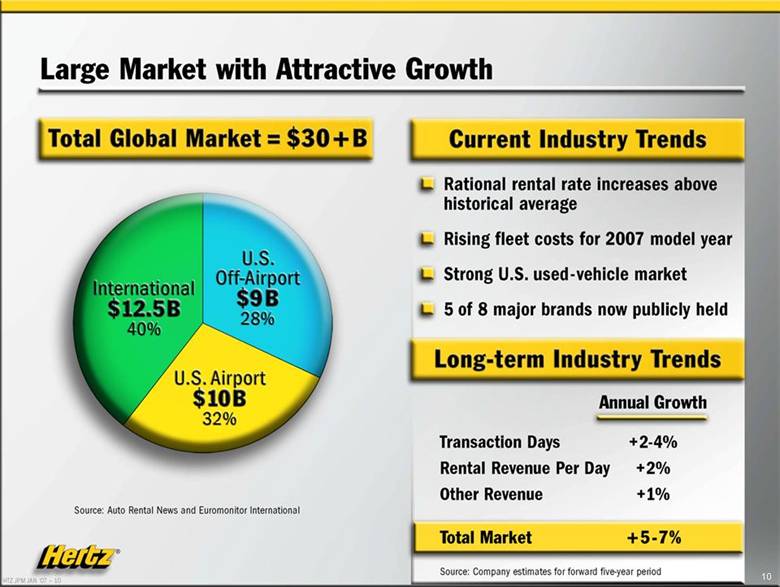
| Large Market with Attractive Growth Total Global Market = $30 + B Current Industry Trends Rational rental rate increases above historical average Rising fleet costs for 2007 model year Strong U.S. used-vehicle market 5 of 8 major brands now publicly held Long-term Industry Trends Annual Growth Transaction Days +2-4% Rental Revenue Per Day +2% Other Revenue +1% Total Market + 5-7% Source: Company estimates for forward five-year period International $12.5B 40% U.S. Off-Airport $9B 28% U.S. Airport $10B 32% Source: Auto Rental News and Euromonitor International |
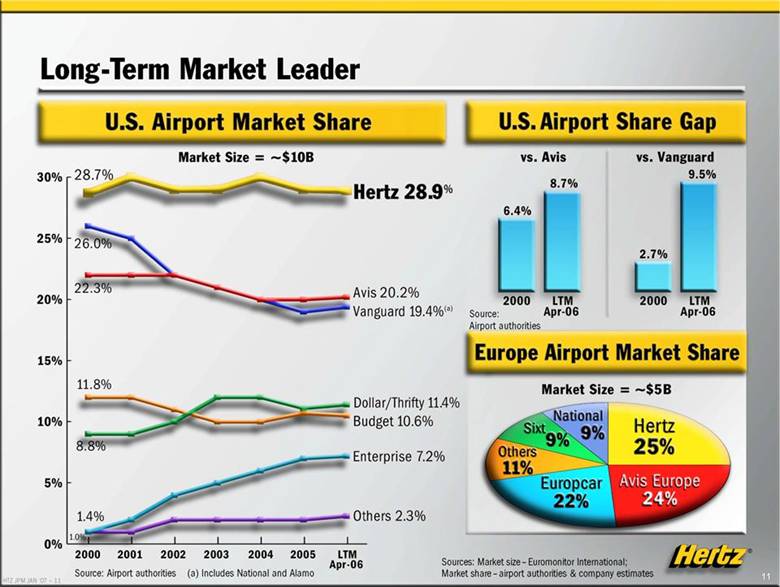
| Long-Term Market Leader U.S. Airport Market Share U.S. Airport Share Gap Europe Airport Market Share Source: Airport authorities (a) Includes National and Alamo Sources: Market size- Euromonitor International; Market share-airport authorities & company estimates Market Size = ~$10B 30% 28.7% Hertz 28.9% 25% 26.0% 22.3% Avis 20.2% Vanguard 19.4%(a) 20% 15% 11.8% Dollar/Thfifty 11.4% 10% 8.8% Budget10.6% 5% 1.4% Enterprise 7.2% 0% 1.0% Others 2.3% 2000 2001 2002 2003 2004 2005 LTM Apr-06 vs. Avis 6.4% 8.7% 2000 LTM Apr-06 vs. Vanguard 2.7% 9.5% 2000 LTM Apr-06 Source: Airport authorities Market Size = ~$5B Hertz 25% Avis Europe 24% Europcar 22% Others 11% Sixt 9% National 9% |
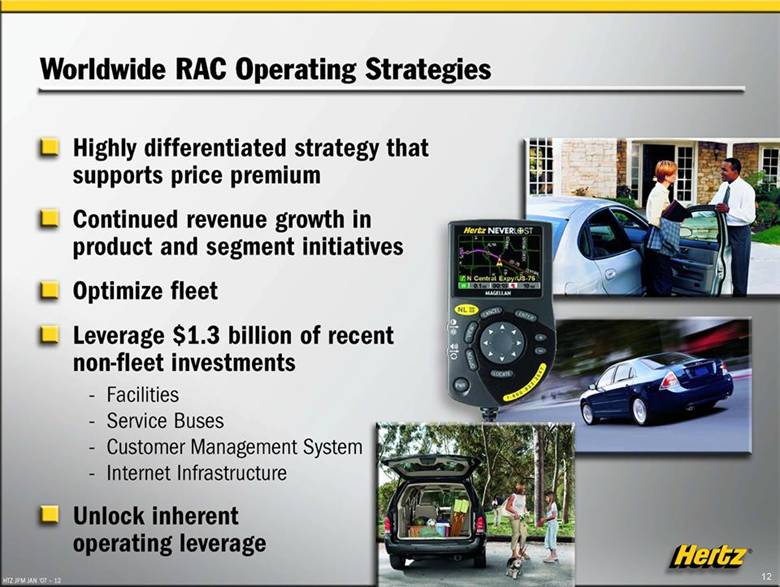
| Worldwide RAC Operating Strategies Highly differentiated strategy that supports price premium Continued revenue growth in product and segment initiatives Optimize fleet Leverage $1.3 billion of recent non-fleet investments Facilities Service Buses Customer Management System Internet Infrastructure Unlock inherent operating leverage |
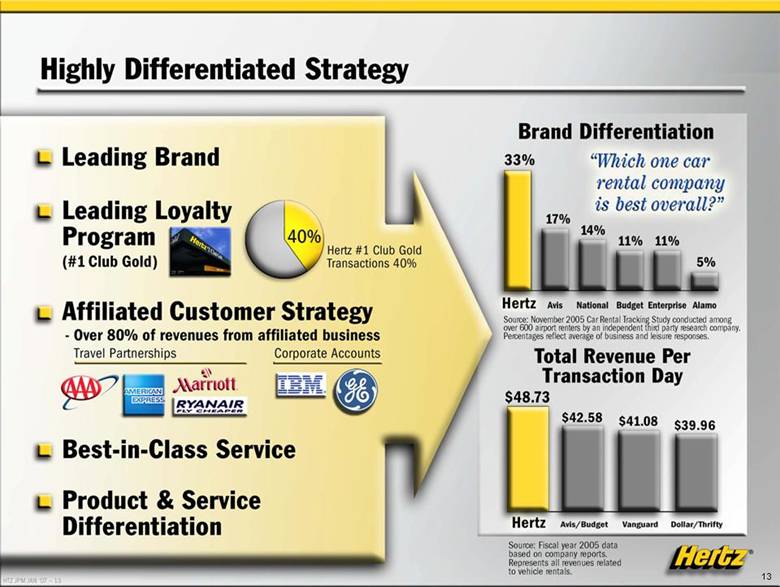
| Highly Differentiated Strategy Leading Brand Leading Loyalty Program (#1 Club Gold) Affiliated Customer Strategy - Over 80% of revenues from affiliated business Travel Partnerships Corporate Accounts Best-in-Class Service Product & Service Differentiation Brand Differentiation Source: November 2005 Car Rental Tracking Study conducted among over 600 airport renters by an independent third party research company. Percentages reflect average of business and leisure responses. Total Revenue Per Transaction Source: Fiscal year 2005 data based on company reports. Represents all revenues related to vehicle rentals.Day Hertz 33% Avis 17% National 14% Budget 11% Enterprise 11% Alamo 5% Hertz $48.73 Avis/Budget $42.58 Vanguard $41.08 Dollar/Thrifty $39.96 which one car rental company is best overall?" Hertz #1 Club Gold Transactions 40% |
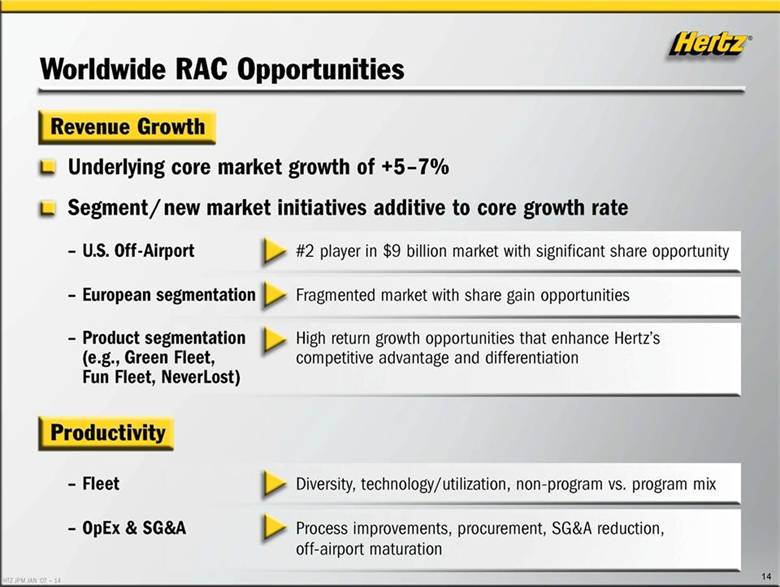
| Worldwide RAC Opportunities Revenue Growth Underlying core market growth of +5-7% Segment/ new market initiatives additive to core growth rate - U.S. Off-Airport #2 player in $9 billion market with significant share opportunity - European segmentation Fragmented market with share gain opportunities Product segmentation High return growth opportunities that enhance Hertz's (e.g., Green Fleet, competitive advantage and differentiation Fun Fleet, NeverLost) Productivity - Fleet Diversity, technology/utilization, non-program vs. program mix - OpEx & SG&A Process improvements, procurement, SG&A reduction, off-airport maturation |
��
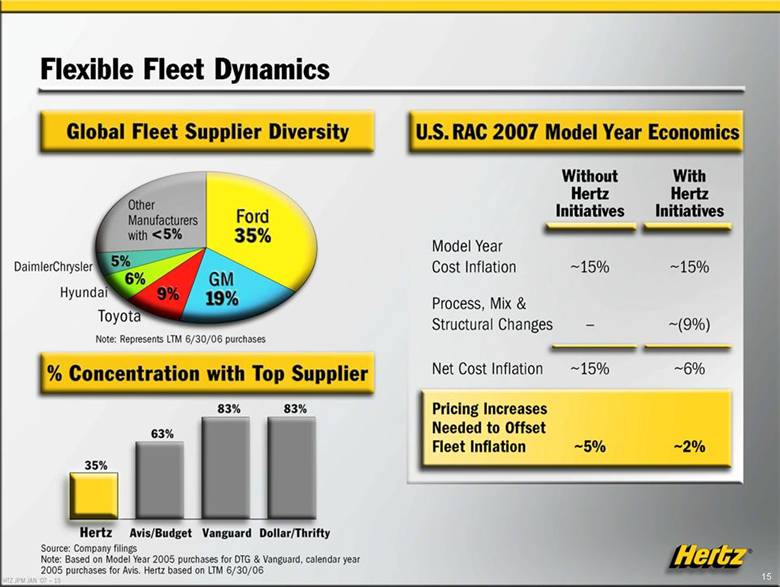
| Flexible Fleet Dynamics Global Fleet Supplier Diversity Other Manufacturers with <5% Ford 35% DaimlerChrysler 5% Hyundai 6% Toyota 9% GM 19% Note: Represents LTM 6/30/06 purchases % Concentration with Top Supplier Hertz 35% Avis/Budget 63% Vanguard 83% Dollar/Thrifty 83% U.S. RAC 2007 Model Year Economics Concentration with Top Supplier Without With Hertz Hertz Initiatives Initiatives -15% -15% Model Year Cost Inflation - -(9%) Process, Mix & Structural Changes Net Cost Inflation -15% -6% Pricing Increases Needed to Offset Fleet Inflation -5% -2% Source: Company filings Note: Based on Model Year 2005 purchases for DTG & Vanguard, calendar year 2005 purchases for Avis, Hertz based on LTM 6/30/06 |
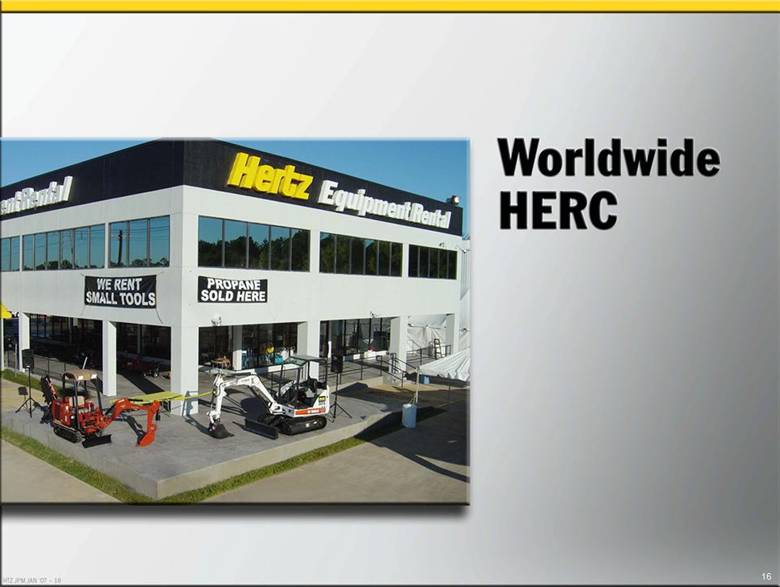
| Worldwide HERC |
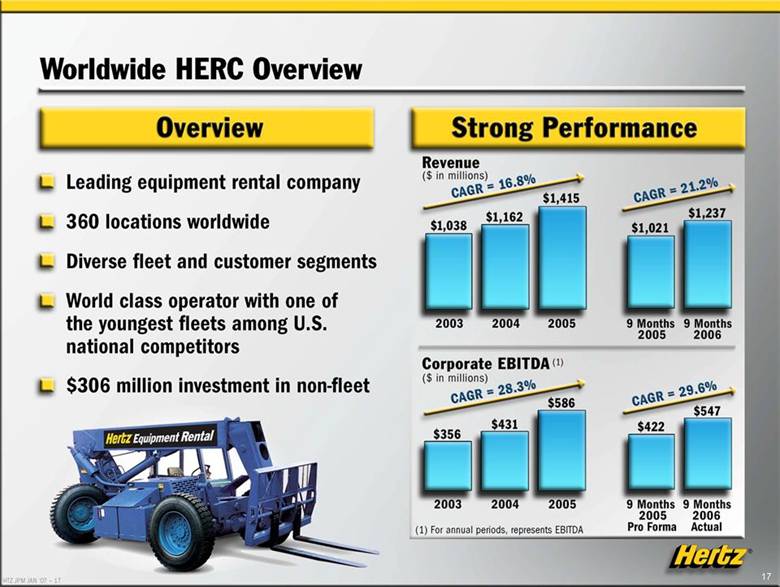
| Worldwide HERC Overview Overview Leading equipment rental company 360 locations worldwide Diverse fleet and customer segments World class operator with one of the youngest fleets among U.S. national competitors $306 million investment in non-fleet Strong Performance Revenue ($ in millions) CAGR = 16.8% Corporate EBITDA(1) ($ in millions) (1) For annual periods, represents EBITDA $1,038 $1,162 $1,415 2003 2004 2005 CAGR = 21.2% $1,021 $1,237 9 Months 2005 9 Months 2006 CAGR = 28.3% $356 $431 $586 2003 2004 2005 CAGR = 29.6% $422 $547 9 Months 2005 Pro Forma 9 Months 2006 Actual |
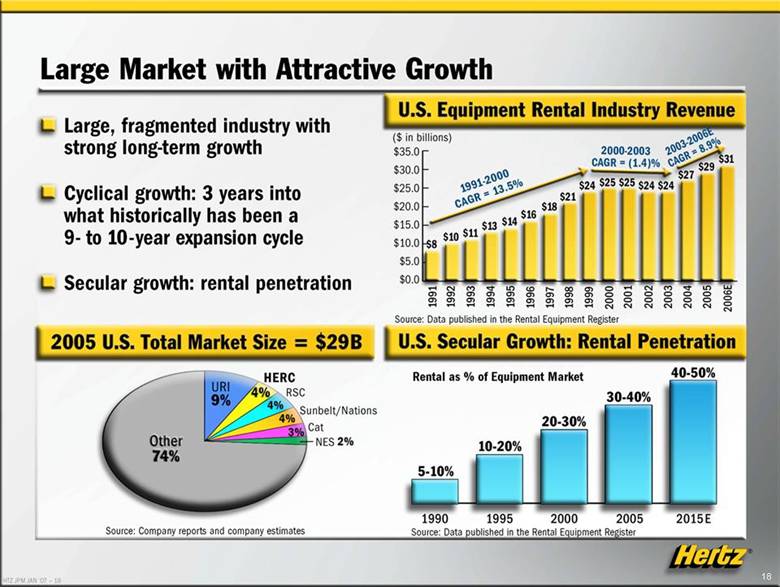
| Large Market with Attractive Growth Large, fragmented industry with strong long-term growth Cyclical growth: 3 years into what historically has been a 9- to 10-year expansion cycle Secular growth: rental penetration U.S. Equipment Rental Industry Revenue Source: Data published in the Rental Equipment Register 2005 U.S. Total Market Size = $29B U.S. Secular Growth: Rental Penetration Source: Company reports and company estimates Source: Data published in the Rental Equipment Register ($ in billions) $35.0 $30.0 $25.0 $20.0 $15.0 $10.0 $5.0 $0.0 $8 $10 $11 $13 $14 $16 $ 18 $21 $24 $25 $25 $24 $24 $27 $29 $31 1991-2000 CAGR = 13.5% 2000-2003 CAGR = (1.4)% 2003-2006E CAGR = 8.9% 1991 1992 1993 1994 1995 1996 1997 1998 1999 2000 2001 2002 2003 2004 2005 2006E 5-10% 10-20% 20-30% 30-40% 40-50% 1990 1995 2000 2005 2015E Rental as % of Equipment Market Other 74% URI 9% HERC 4% RSC 4% Sunbelt/Nations 4% Cat 3% NES 2% |
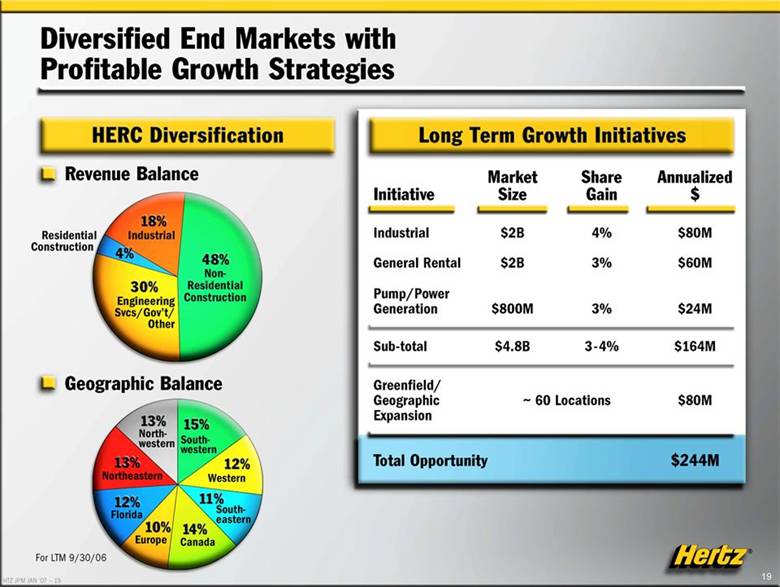
| Diversified End Markets with Profitable Growth Strategies HERC Diversification Long Term Growth Initiatives Revenue Balance Residential Construction 18% Industrial 4% 30% Engineering Svcs/Gov’t/Other 48% Non-Residential Construction Geographic Balance 13% North-western 13% Northeastern 12% Florida 10% Europe 14% Canada 11% South-eastern 12% Western 15% South-western Initiative Industrial General Rental Market Size $2B $2B Share Gain 4% 3% Sub-total $4.8B 3-4% Greenfield/ Geographic ~60 Locations $80M $60M $24M $164M $80M Expansion Total Opportunity |
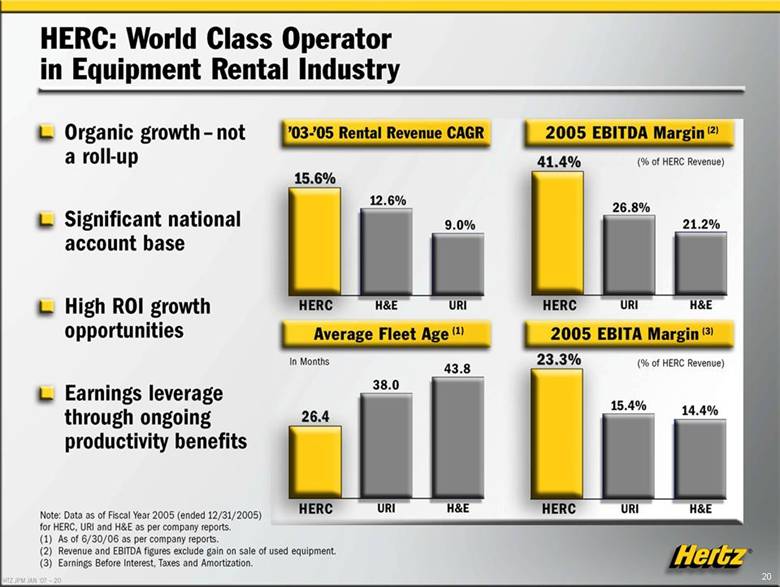
| HERC: World Class Operator in Equipment Rental Industry Organic growth – not a roll-up Significant national account base High ROI growth opportunities Earnings leverage through ongoing productivity benefits ’03-’05 Rental Revenue CAGR 2005 EBITDA Margin(2) (% of HERC Revenue) Average Fleet Age (1) 2005 EBITA Margin(3) (% of HERC Revenue) 15.6% HERC 12.6% H&E 9.0% URI 41.4% HERC 26.8% URI 21.2% H&E 26.4 HERC 38.0 URI 43.8 H&E 23.3% HERC 15.4% URI 14.4% H&E Note: Data as of Fiscal Year 2005 (ended 12/31/2005) for HERC, URI and H&E as per company reports. (1) As of 6/30/06 as per company reports. (2) Revenue and EBITDA figures exclude gain on sale of used equipment (3) Earnings Before Interest, Taxes and Amortization. |
| Financial Overview |
| Financial Profile Significant growth opportunity and profit opportunities -Achievement of cost efficiencies Improved working capital Leverage recent non-fleet investments Deleveraging reduces debt cost Strong balance sheet and liquidity profile Flexible capital structure Attractive free cash flow |
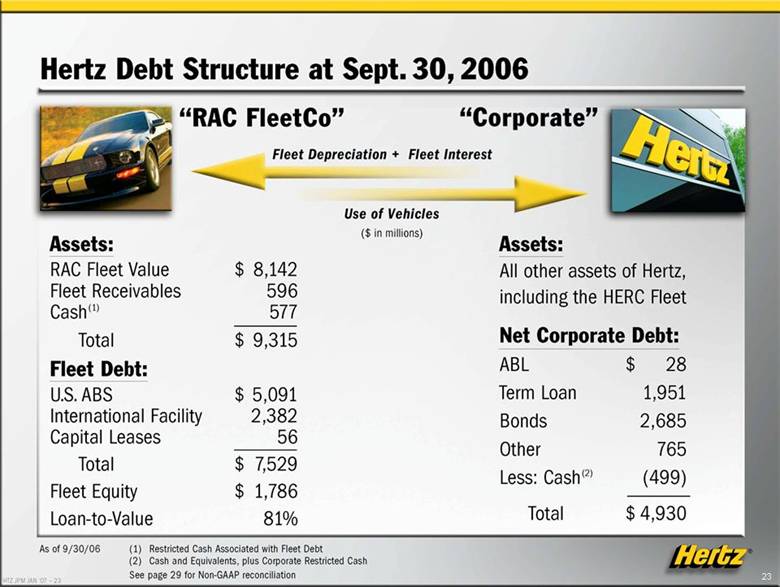
| Hertz Debt Structure at Sept. 30, 2006 Assets: $ 8,142 596 577 RAC Fleet Value Fleet Receivables Cash(1) Assets: All other assets of Hertz, including the HERC Fleet Total Fleet Debt: $ 9,315 Net Corporate Debt: ABL $ 28 U.S. ABS $ 5,091 Term Loan 1,951 International Facility 2,382 Bonds 2,685 Capital Leases 56 Other 765 Total $ 7,529 Less: Cash(2) (499) Fleet Equity $ 1,786 Loan-to-Value 81% Total $4,930 As of 9/30/06 (1) Restricted Cash Associated with Fleet Debt (2) Cash and Equivalents, plus Corporate Restricted Cash See page 29 for Non-GAAP reconciliation |
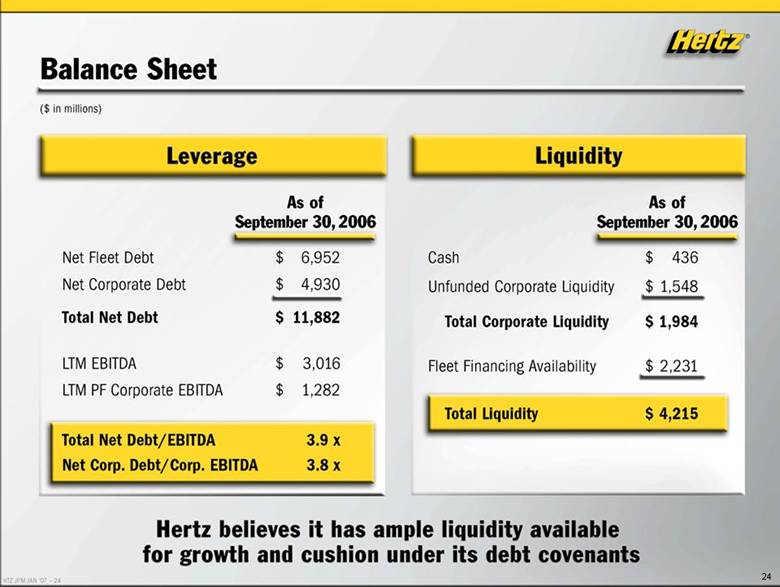
| Balance Sheet ($ in millions) Leverage Liquidity As of September 30, 2006 $ 6,952 $ 4,930 $ 11,882 $ 3,016 $ 1,282 Net Fleet Debt Net Corporate Debt Total Net Debt LTM EBITDA LTM PF Corporate EBITDA 3.9 x 3.8 x Total Net Debt/EBITDA Net Corp. Debt/Corp. EBITDA As of September 30, 2006 Cash $ 436 Unfunded Corporate Liquidity $ 1,548 Total Corporate Liquidity $ 1,984 $ 2,231 $ 4,215 Fleet Financing Availability Total Liquidity Hertz believes it has ample liquidity available for growth and cushion under its debt covenants |
| Key Investment Considerations Premier global brand Leading franchises in large, growing industries Superior business model and strategy with successful track record Multiple drivers of earnings growth -Robust diversified revenue growth Significant productivity opportunities Strong cash flow to drive deleveraging Experienced management team with performance based incentives |
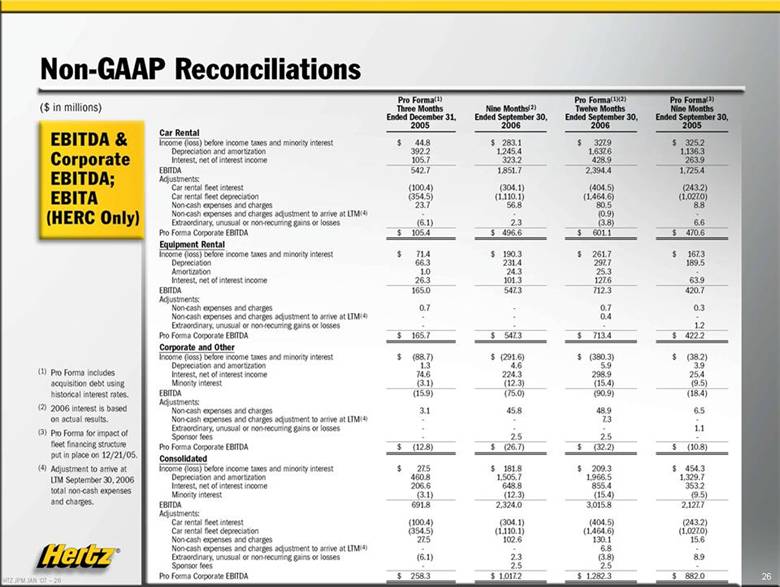
| Non-GAAP Reconciliations $ in millions) EBITDA & Corporate EBITDA; EBITA (HERC Only) (1) Pro Forma includes acquisition debt using historical interest rates. (2) 2006 interest is based on actual results. (3) Pro Forma for impact of fleet financing structure put in place on 12/21/05. (4) Adjustment to arrive at LTM September 30, 2006 total non-cash expenses and charges. Car Rental Income (loss) before income taxes and minority interest Depreciation and amortization Interest, net of interest income EBITDA Adjustments: Car rental fleet interest Car rental fleet depreciation Non-cash expenses and charges Non-cash expenses and charges adjustment to arrive at LTM(4) Extraordinary, unusual or non-recurring gains or losses Pro Forma Corporate EBITDA Equipment Rental Income (loss) before income taxes and minority interest Depreciation Amortization Interest, net of interest income EBITDA Adjustments: Non-cash expenses and charges Non-cash expenses and charges adjustment to arrive at LTM(4) Extraordinary, unusual or non-recurring gains or losses Pro Forma Corporate EBITDA Corporate and Other Income (loss) before income taxes and minority interest Depreciation and amortization Interest, net of interest income Minority interest EBITDA Adjustments: Non-cash expenses and charges Non-cash expenses and charges adjustment to arrive at LTM(4) Extraordinary, unusual or non-recurring gains or losses Sponsor fees Pro Forma Corporate EBITDA Consolidated Income (loss) before income taxes and minority interest Depreciation and amortization Interest, net of interest income Pro Formal1) Three Months Nine Months'2' Pro Forma(1)(2) Twelve Months Pro Formal3) Nine Months Ended December 31, Ended September 30, Ended September 30, Ended September 30, 2005 2006 2006 2005 I 44.8 $ 283.1 $ 327.9 $ 325.2 392.2 1,245.4 1,6376 1,136.3 105.7 323.2 428.9 263.9 542.7 1,851.7 2,394.4 1,725.4 (100.4) (304.1) (404.5) (243.2) (354.5) (1410.1) (1,464.6) (1,027.0) 23.7 56.8 80.5 (0.9) 8.8 (6.1) 2.3 (3.8) 6.6 $ 105.4% 496.6 $ 601.1 $ 470.6 I 71.4 $ 190.3 $ 261.7 I 167.3 66.3 231.4 297.7 189.5 1.0 24.3 25.3 26.3 101.3 1276 63.9 165.0 547.3 712.3 420.7 0.7 - 0.7 0.3 - 0.4 - - - 1.2 I 165.7 I 5473 $ 713.4 I 422.2 $ (88.7) $ (291.6) $ (380.3) $ (38.2) 1.3 4.6 5.9 3.9 74.6 224.3 298.9 25.4 (3.1) (12.3) (15.4) (9.5) (15.9) (75.0) (90.9) (18.4) 3.1 45.8 48.3 i.3 6.5 1.1 - 2.5 2.5 -$ (12.8) $ (26.7) $(32.2) $ (10.8) $ 275 I 181.8 $209.3 $454.3 460.8 1,505.7 1,966.5 1,329.7 206.6 648.8 855.4 353.2 (3.1) (12.3) (15.4) (9.5) 691.8 2,324.0 3,015.8 2,127.7 (100.4) (304.1) (404.5) (243.2) (354.5) (1,110.1) (1.464.6) (1,027.0) 27.5 102.6 130.1 15.6 - - 6.8 - (6.1) 2.3 (3.8) 8.9 - 2.5 $ 1,017.2 2.5 $ 1,282.3 - $ 258.3 $ 882.0Minority interest EBITDA Adjustments: Car rental fleet interest Car rental fleet depreciation Non-cash expenses and charges Non-cash expenses and charges adjustment to arrive at LTM(4) Extraordinary, unusual or non-recurring gains or losses Sponsor fees Pro Forma Corporate EBITDA |
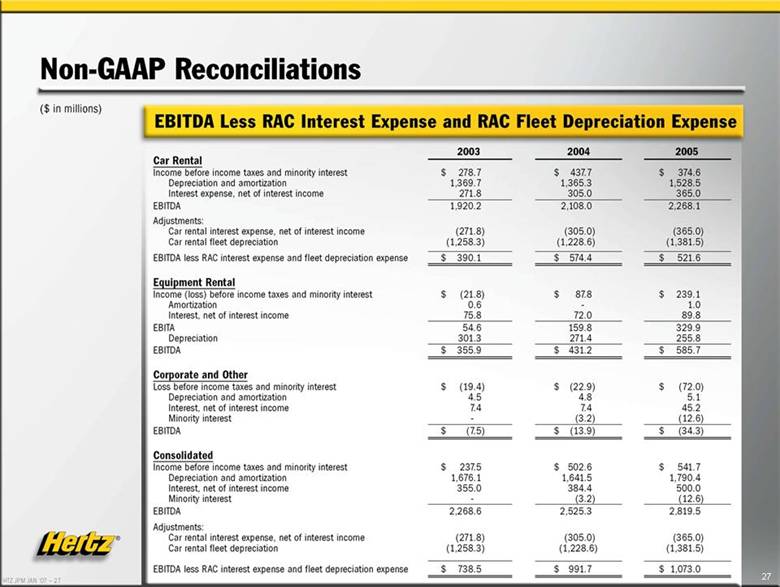
| Non-GAAP Reconciliations ($ in millions) EBITDA Less RAC Interest Expense and RAC Fleet Depreciation Depreciation Expense 2005 Car Rental Income before income taxes and minority interest Depreciation and amortization Interest expense, net of interest income EBITDA Adjustments: Car rental interest expense, net of interest income Car rental fleet depreciation EBITDA less RAC interest expense and fleet depreciation expense Equipment Rental Income (loss) before income taxes and minority interest Amortization Interest, net of interest income EBITA Depreciation EBITDA Corporate and Other Loss before income taxes and minority interest Depreciation and amortization Interest, net of interest income Minority interest EBITDA Consolidated Income before income taxes and minority interest Depreciation and amortization Interest, net of interest income Minority interest EBITDA Adjustments: Car rental interest expense, net of interest income Car rental fleet depreciation EBITDA less RAC interest expense and fleet depreciation expense 2003 2004 $ 278.7 1,369.7 271.8 $ 437.7 1,365.3 305.0 $ 374.6 1,528.5 365.0 1,920.2 (271.8) (1,258.3) 2,108.0 (305.0) (1,228.6) 2,268.1 (365.0) (1,381.5) $ 390.1 $ 574.4 $ 5216 $ (21.8} 0.6 75.8 $ 87.8 72.0 $ 239.1 1.0 89.8 54.6 301.3 159.8 271.4 329.9 255.8 $ 355.9 $ 431.2 $ 585.7 $ (19.4) 4.5 7.4 $ (22.9) 4.8 7.4 (3.2) $ (72.0) 5.1 45.2 (12.6) $ (7.5) $ (13.9) $ (34.3) $ 237.5 1,676.1 355.0 $ 502.6 1,641.5 384.4 (3.2) $ 541.7 1,790.4 500.0 (12.6) 2,268.6 (271.8) (1,258.3) 2,525.3 (305.0) (1,228.6) 2,819.5 (365.0) (1,381.5) $ 738.5 $ 991.7 $ 1,073.0 |
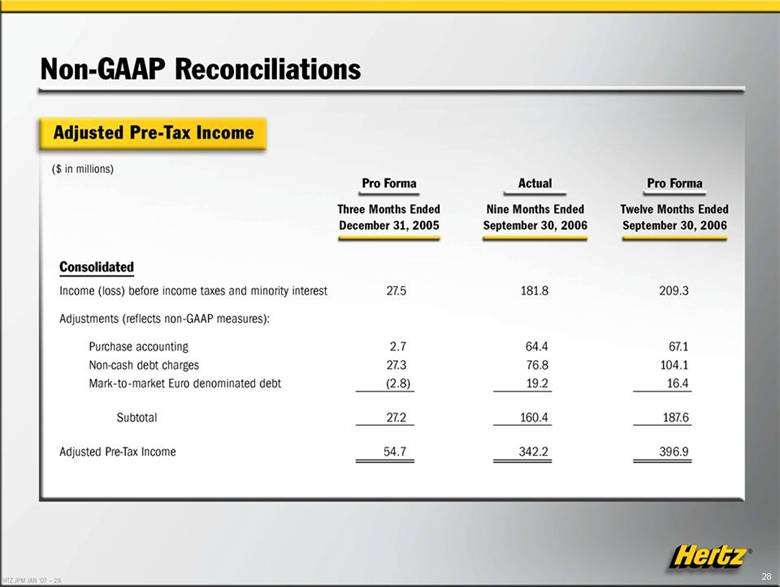
| Non-GAAP Reconciliations Adjusted Pre-Tax Income ($ in millions) Consolidated Pro Forma Three Months Ended December 31, 2005 Actual Ended 2006 Pro Forma Nine Months Ended September 30, Twelve Months Ended September 30, 2006 Income (loss) before income taxes and minority interest 27.5 181.8 209.3 Adjustments (reflects non-GAAP measures): Purchase accounting Non-cash debt charges Mark-to-market Euro denominated debt 2.7 27.3 (2.8) 64.4 76.8 19.2 67.1 104.1 16.4 Subtotal 27.2 160.4 187.6 Adjusted Pre-Tax Income 54.7 342.2 396.9 |
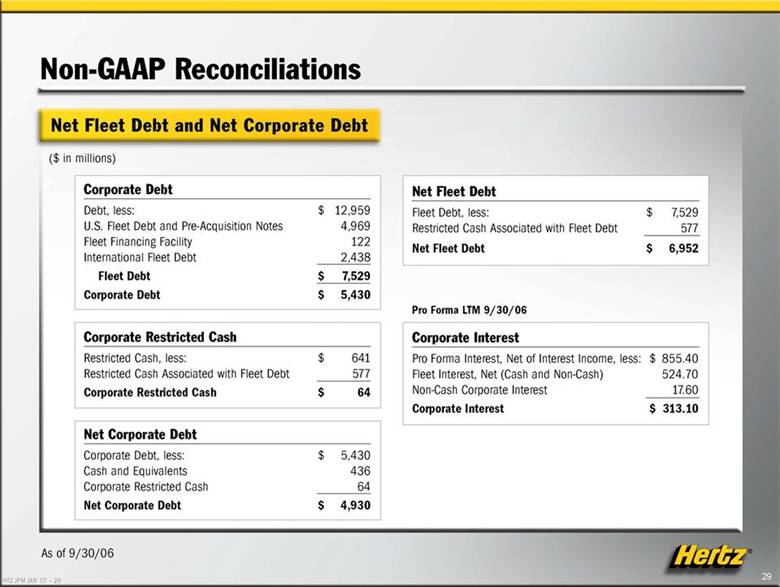
| Non-GAAP Reconciliations Net Fleet Debt and Net Corporate Debt ($ in millions) Corporate Debt Debt, less: $ 12,959 U.S. Fleet Debt and Pre-Acquisition Notes 4,969 Fleet Financing Facility 122 International Fleet Debt 2,438 Fleet Debt $ 7,529 Corporate Debt $ 5,430 Corporate Restricted Cash Restricted Cash, less: $ 641 Restricted Cash Associated with Fleet Debt 577 Corporate Restricted Cash $ 64 Net Corporate Debt Corporate Debt, less: $ 5,430 Cash and Equivalents 436 Corporate Restricted Cash 64 Net Corporate Debt $ 4,930 Net Fleet Debt Fleet Debt, less: Restricted Cash Associated with Fleet Debt Net Fleet Debt $ 7,529 577 $ 6,952 Pro Forma LTM 9/30/06 Corporate Interest Pro Forma Interest, Net of Interest Income, less Fleet Interest, Net (Cash and Non-Cash) Non-Cash Corporate Interest Corporate Interest $ 855.40 524.70 17.60 $ 313.10 |
| Importance of Non-GAAP Measures EBITDA and Corporate EBITDA provide investors with supplemental measures of operating performance and liquidity. Corporate EBITDA provides supplemental information utilized in the calculation of the financial covenants under Hertz's senior credit facilities. Management uses EBITDA and Corporate EBITDA as performance and cash flow metrics for internal monitoring and planning purposes, including the preparation of Hertz's annual operating budget and monthly operating reviews, as well as to facilitate analysis of investment decisions. These measures are important to allow Hertz to evaluate profitability and make performance trend comparisons between Hertz and its competitors. Management also believes that EBITDA and Corporate EBITDA are frequently used by securities analysts, investors and other interested parties in the evaluation of companies in our industries. EBITDA is also used by management and investors to evaluate our operating performance exclusive of financing costs and depreciation policies. EBITDA and Corporate EBITDA are not recognized measurements under GAAP. When evaluating Hertz's operating performance or liquidity, investors should not consider EBITDA and Corporate EBITDA in isolation of, or as a substitute for, measures of Hertz's financial performance and liquidity as determined in accordance with GAAP, such as net income, operating income or net cash provided by operating activities. |
| Importance of Non-GAAP Measures Net Corporate Debt and Net Fleet Debt are important statistics to management and ratings agencies as they help measure the company's leverage. Net Corporate Debt also assists in the evaluation of the company's ability to service its non-fleet-related debt without reference to the expense associated with the fleet debt, which is fully collateralized by assets not available to lenders under the non-fleet debt facilities. Corporate Interest expense helps management measure the costs of financing the business exclusive of the costs associated with fleet financing. L Adjusted Pre-Tax Income represents a measure of the company's operational performance exclusive of the effects of purchase accounting distortions and one-time charges that are not operational in nature or comparable to those of our competitors. EBITA is an important measure because it removes interest expense where differences among industry participants can be caused by financing methodology used by different equipment rental companies but incorporates all other costs. This results in a performance metric that management and investors can then use for comparison across the equipment rental industry. |

