Free signup for more
- Track your favorite companies
- Receive email alerts for new filings
- Personalized dashboard of news and more
- Access all data and search results
Filing tables
Filing exhibits
Related financial report
HRZ similar filings
- 5 Jun 07 Hertz Announces Third Phase of Restructuring Initiative
- 24 May 07 Departure of Directors or Principal Officers
- 26 Apr 07 Hertz Reports Strong First Quarter Operating Results
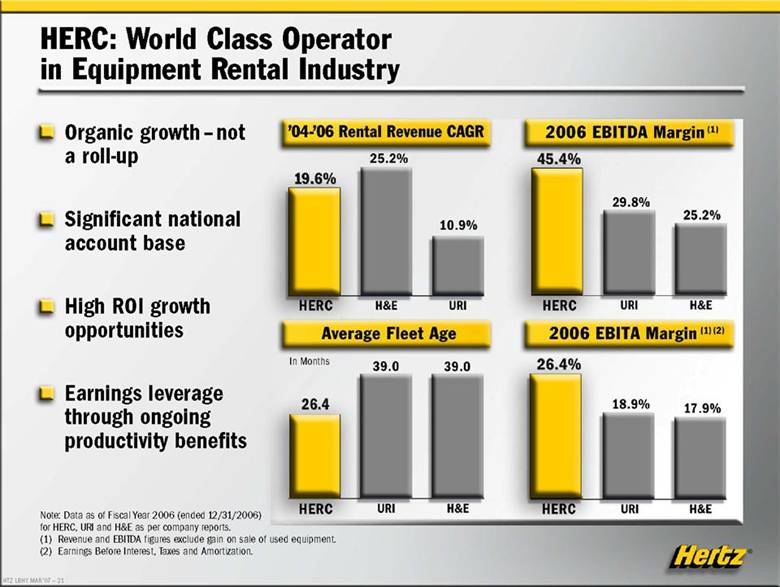
- 2 Apr 07 Hertz Lehman Brothers 2007 High Yield Bond and Syndicated Loan Conference March 2007 HTZ LBHY MAR'07 - 1
- 27 Mar 07 Entry into a Material Definitive Agreement
- 13 Mar 07 Results of Operations and Financial Condition
- 1 Mar 07 Hertz Announces Second Phase of Restructuring Initiative
Filing view
External links